x-ros signaling: rapid mechano-chemo...
TRANSCRIPT

Corrected 12 September 2011; see below
www.sciencemag.org/cgi/content/full/333/6048/1440/DC1
Supporting Online Material for
X-ROS Signaling: Rapid Mechano-Chemo Transduction in Heart
Benjamin L. Prosser, Christopher W. Ward,* W. J. Lederer*
*To whom correspondence should be addressed. E-mail: [email protected] (C.W.W.);
[email protected] (W.J.L.)
Published 9 September 2011, Science 333, 1440 (2010) DOI: 10.1126/science.1202768
This PDF file includes:
Materials and Methods
Figs. S1 to S11
References (29–31) Other Supporting Online Material for this manuscript includes the following: (available at www.sciencemag.org/cgi/content/full/333/6048/1440/DC1)
Movies S1 and S2
Correction: A line stating where MyoTak can be obtained has been added to the section “Cardiomyocyte attachment and stretch,” on page 1 of Materials and Methods.

Supporting Online Materials and Methods
Materials. Colchicine, NAC, DPI, DCF, nifedipine, H202 and CCCP were purchased from Sigma-Aldrich (St. Louis, MO). gp91ds-tat, gp91ds-tat FAM labeled, and gp91ds-tat scramble peptide were purchased from Anaspec (Fremont, CA). Rac1 inhibitor was purchased from Calbiochem (San Diego, CA.)
Rodent models. Animal care and procedures were approved and performed in accordance with the standards set forth by the University of Maryland Institutional Animal Care and Use Committee and by the National Institutes of Health.
Cardiomyocyte isolation. Adult C57BL/10ScSnJ, C57BL/10ScSnJ-DmD (mdx), NOX2-/-, or C57BL/6 mice and Sprague-Dawley rats were terminally anesthetized by injection of pentobarbital, followed by excision of the heart and enzymatic isolation of ventricular myocytes as previously described (28). Cardiomyocytes were stored in a normal Tyrodes solution containing (in mM): NaCl 140, KCl 5, CaCl2 1.8, MgCl2 0.5, HEPES 5, Glucose 5, NaH2PO4 0.33. Experiments were performed at room temperature, 22°C. Due to the relatively greater ease and reproducibility of highest quality cell preparations, rat myocytes were used for the majority of experiments in this study. Each experiment critical to the primary conclusions drawn in the manuscript (stretch-dependence of Ca2+ sparks (Fig. S7) and Ca2+ waves (Fig. 1), role of microtubules (Fig. S7), role of NOX2 (Figs. 3 and 4)) was confirmed in both rat and mouse myocytes. All studies with mdx myocytes or NOX2-/- myocytes were accompanied by experiments with the appropriate mouse control lines listed above.
Cardiomyocyte attachment and stretch. All experiments were performed in custom glass-bottomed cell chambers (Four-hour Day Foundation, Towson, MD) equipped with local and bath perfusion and mounted on an LSM 510 inverted confocal microscope (Carl Zeiss, Jena, Germany). Stiff, 25µm diameter glass micro-rods (Fiber Optics Technology Inc., Pomfret, CT) were coated with a biological adhesive, MyoTak™. MyoTak is a composition of laminin, entactin, heparin sulfate proteoglycan, gentamicin, and Dulbecco’s Modified Eagle Medium (Sigma-Aldrich), collagen IV (BD Biosciences, Franklin Lakes, NJ), Alexa Fluor-647 conjugated to bovine serum albumin (BSA) (Invitrogen, Carlsbad, CA), and an inert alumina silica aggregate 1 µm in diameter (Buehler, Lake Bluff, IL), dissolved in 100 µM BSA. None of these components were harmful to cells, as normal cell morphology and robust contraction were maintained for up to two hours following cell attachment via MyoTak. MyoTak is available from Ionoptix (Milton, MA) and World Precision Instruments (WPI, Sarasota, FL). One glass micro-rod was connected to a high-sensitivity force transducer (KG7, WPI), and the other to a piezo-electric length controller (WPI) driven by a variable voltage output source. The micro-rods were positioned above the cell using motorized micromanipulators (Siskiyou, Grants Pass, OR). Myocytes were attached at both ends by gently pressing down with the MyoTak-coated micro-rod and then lifting the cell from the bottom of the chamber. The distance between the attachment points was measured and axial stretch applied by movement of the length controller to generate a stretch 8% of attached-cell length. The stretch waveform was rounded by an 8-pole Bessel filter (time to peak stretch 120ms) to mimic diastolic filling. The tension signal from the force transducer and positional output from the length controller were recorded at 0.5 kHz with an analogue-to-digital recording system (EPC-9, HEKA Instruments, Bellmore NY). Transmitted light images were taken before and during stretch and analyzed offline using ImageJ software (National Institutes of Health, Bethesda, MD; http://rsbweb.nih.gov/ij/index.html) to

assay changes in sarcomere length. Myocytes were typically subjected to 3 stretch-release paradigms lasting 30s, with 30s rest allowed between stretches. As each stretch produced a similar change in Ca2+ spark rate and change in passive tension (Fig. S11), trials were pooled together for analysis.
Ca2+spark and wave measurements. Cells were loaded with Fluo-4 by 10 minute incubation with 3µM Fluo-4-acetoxymethyl (AM) ester (Invitrogen) and 0.01% Pluronic® F127 (a poloxamer made by BASF, Florham Park, N.J., USA) and allowed an additional 10 minutes for de-esterification. Cells were scanned using a 488 nm argon ion laser in confocal line-scan mode at 1.92 ms/line. Automated analysis of line-scan images for Ca2+ spark location and properties was performed using custom routines written in Interactive Data Language (IDL version 6.2, ITT Visual Information Solutions, Boulder, CO, USA). Contact C.W.W. for more information.
DCF measurements. Cells were loaded with 1µM DCF for 20 min to measure reactive oxygen species. DCF loaded cells were imaged using confocal line-scanning microscopy at 3.07 ms/line. As DCF can produce artifactual signal amplification upon continuous light exposure, cells were imaged at extremely low laser intensity and a sampling rest interval of 9 ms was introduced between each line scan. Confocal line scans were taken from the interior of the fiber only in the stretched region of the cell. DCF fluorescence signals were processed as demonstrated in Fig. S5.
Western blotting. Western blot analysis of six wt and six mdx hearts were performed as previously described (29). In brief, 20 µg of clarified muscle extract was subjected to SDS-PAGE, transferred to nitrocellulose membranes and washed/blocked in a 5% milk solution in PBS for 1 h. The membrane was probed overnight with primary antibody at room temperature. The primary antibodies were anti-α-tubulin (DM1A, 1:000; Sigma-Aldrich), anti-β-tubulin (AA12.1, 1:1000, DSHB), anti-Glu-tubulin (Custom made by Genemed Synthesis Inc. Peptide: CGEEEGEE) and anti-GAPDH (Sigma-Aldrich). Membranes were washed two times for 10 min in 5% milk solution at room temperature, incubated with appropriate secondary antibody (1:10,000) for 1 hour at room temperature, and the membranes were washed in a 0.5% Tween solution in PBS two times for 10 min. Membranes were then exposed to enhanced chemiluminescence with SuperSignal West Pico Chemiluminescent Substrate (Pierce, Rockford, IL) to develop immunoblots. Blots were imaged and quantified with an imaging system (SYNGENE, G:Box; GeneTools software). The GAPDH density signal served as the loading control.
Immunofluorescence. Enzymatically isolated cardiomyocytes were fixed at room temperature for 1 h with 4% para-formaldehyde in phosphate buffer. Cardiomyocytes were probed with mouse anti-α-Tubulin-Alexa 488 (Invitrogen) using procedures previously described (29). Following labeling and washing, cells were briefly dried to glass coverslips and mounted with Vectashield (Vector Laboratories). Confocal images were captured with a 60× NA 1.4 H20 immersion lens on a Zeiss Radiance 2100 confocal system mounted on an Olympus IX-70 inverted fluorescence microscope. Image stacks were collected through the z-axis of the cardiomyocytes at 0.5 µm steps. The raw images were opened in ImageJ, and a flattened plane projection was made of the first image of the cardiomyocyte membrane near the bottom of the coverslip through 5 µm (i.e., 10 images) into the cell.

Fig. S1. Model of X-ROS signaling in heart. NOX2 (gp91phox) is localized to t-tubule membranes in close apposition (15nm) to the jSR. At rest, cytosolic regulatory subunits of NOX2 are localized to the T-tubule/jSR junction, and may be tethered to t-tubule membranes or other NOX subunits. Upon diastolic stretch, microtubules transmit the mechanical signal to promote the activation of transmembrane NOX2. The active NADPH oxidase complex produces ROS via superoxide ion (O2·-), which acts locally on nearby RyR2s. Oxidation of RyR2 increases it’s sensitivity to be triggered by [Ca2+]i, leading to an increase in diastolic Ca2+ spark rate. While under normal conditions X-ROS signaling acts as a regulatory mechanism of Ca2+
signaling in heart, under pathological conditions the same signaling may serve as a trigger of arrhythmogenic events.

Fig. S2. MyoTak™, a biological adhesive, as a tool to examine single cell function. (A) 3D reconstructed view from beneath a myocyte stained with Di-8-ANEPPS to label membrane systems attached to glass micro-rods coated with fluorescent MyoTak-647 (See Movie S2). (B) Representative sarcomere length (SL) vs. tension relationship in a single cardiomyocyte attached via MyoTak. The cell was stimulated at 1 Hz while stretched every 4s to impose a 0.05 μm (2.8%) increase in SL. Active (green) and passive (red) tension from this cell are displayed in the inset above.

Fig. S3. Caffeine and stretch act in a similar fashion to increase RyR2 Ca2+ sensitivity. (A) Fluorescence surface plot of Ca2+ sparks and waves increased by caffeine and stretch. 100µM caffeine was applied by superfusion (at 5 s, see B) with 8% stretch superimposed at 15 s. At 25 s cells were relaxed and superfused with normal Tyrode’s solution. (B) Ca2+ spark histogram from 17 rat ventricular myocytes subjected to protocol described in A. (C) Ca2+ spark rate and (D) Ca2+ wave rate in these 17 cells subjected to caffeine and stretch. Data are mean ± SEM. * = p < 0.05 compared to pre-stretch value, # = p < 0.05 compared to caffeine value, paired t-test.

Fig. S4. Superfusion of a low concentration of H202 (200 µM) reversibly activates Ca2+spark changes with kinetics and extent similar to that observed with physiologic stretch. (A) Fluorescence surface plot of a fluo-4 loaded rat ventricular myocyte revealing the time course of Ca2+ spark activity during application of 200 µM H202,which rapidly and reversibly increased Ca2+ sparks. (B) Spark rate histogram (2 second bins) shows the time course average from ten cells. (C) Spark rate before (black), during (red) and after (blue) application of H202 (n = 10). (D) Effect of H202 on Spark rate in WT (n = 10) and mdx (n = 13) cells. Data are mean ± SEM. *p < 0.05 compared to pre-treatment value. #p<0.05 compared to wash-out value, paired t-test.

Fig S5. DCF fluorescence correction. (A) Average DCF fluorescence in control myocytes (n = 34 rat cells) subjected to 8% stretch. The change in DCF slope indicates an increase in ROS production during stretch. (B) A linear baseline (red in A) was fit to the pre-stretch fluorescence trace and subsequently subtracted from the pre, during, and post stretch traces to better visualize changes in DCF fluorescence (black trace). The baseline corrected trace was well fit by a polynomial equation (r2 = 0.96, green trace). The derivative of this fit is displayed in red, and represents the rate of ROS production. C) ROS production is thus maximal almost immediately upon stretch, declines during the period of stretch, and returns to baseline upon relaxation, consistent with the time course of stretch-activated Ca2+ sparks.
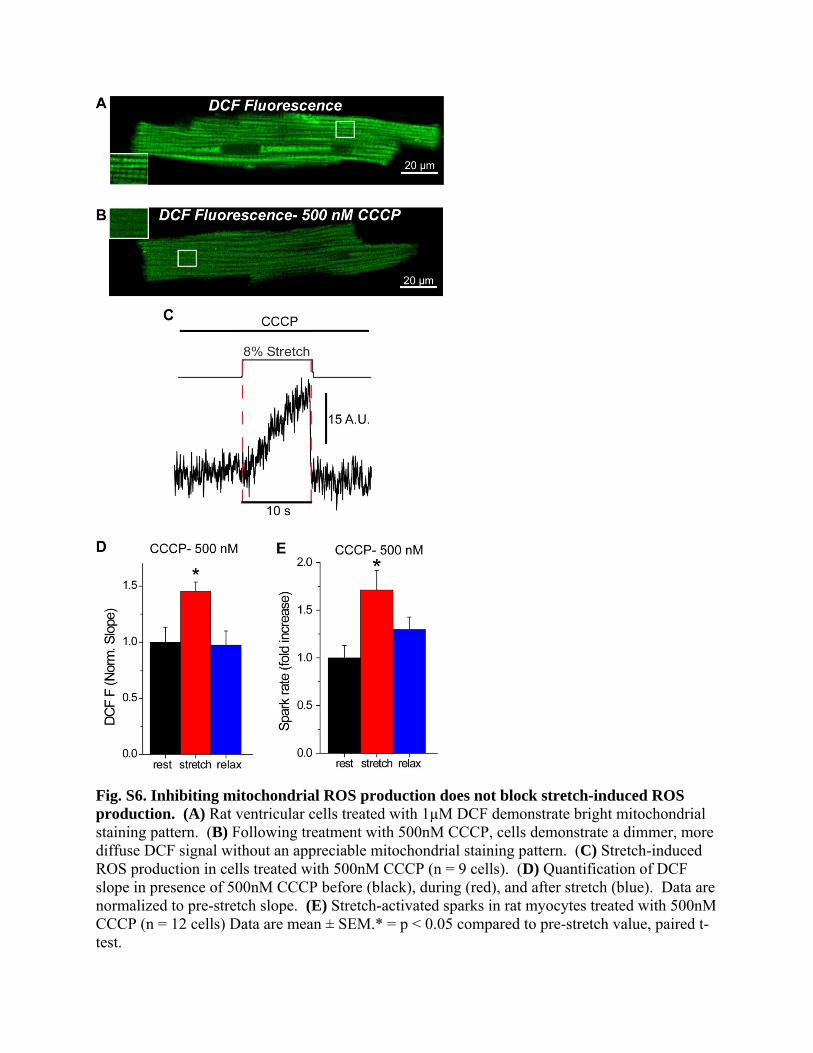
Fig. S6. Inhibiting mitochondrial ROS production does not block stretch-induced ROS production. (A) Rat ventricular cells treated with 1µM DCF demonstrate bright mitochondrial staining pattern. (B) Following treatment with 500nM CCCP, cells demonstrate a dimmer, more diffuse DCF signal without an appreciable mitochondrial staining pattern. (C) Stretch-induced ROS production in cells treated with 500nM CCCP (n = 9 cells). (D) Quantification of DCF slope in presence of 500nM CCCP before (black), during (red), and after stretch (blue). Data are normalized to pre-stretch slope. (E) Stretch-activated sparks in rat myocytes treated with 500nM CCCP (n = 12 cells) Data are mean ± SEM.* = p < 0.05 compared to pre-stretch value, paired t-test.

Fig. S7. De-polymerizing microtubules blocks stretch-activated sparks. (A) Passive tension elicited by 8% cell stretch is unchanged between control (n =9) and 10µM colchicine treated (n = 10) rat ventricular myocytes. (B) 10 µM colchicine abrogates stretch-activated sparks in rat ventricular myocytes. (C) 10 µM colchicine similarly abrogates stretch-activated sparks in mouse ventricular myocytes. Data are mean ± SEM. * = p < 0.05 compared to pre-stretch value, paired t-test.

Fig. S8. NOX2 is found in the SL and TT membranes. (A) NOX2 localization is marked with the fluorescent peptide FAM-gp91ds while the transverse tubule and sarcolemmal (SL) membranes (see also Fig. 3D-E in the manuscript) are identified with the lipophilic fluorescent indicator Di-D (1,1′-dioctadecyl-3,3,3′,3′-tetramethylindodicarbocyanine perchlorate). The apparent co-localization shown in the top panel of WT mice was tested by image co-localization analysis with ImageJ and the co-localization plug-in JaCoP (30). (B) Identical image co-localization analysis was carried out in NOX2-/- myocytes. (C) Pearson's coefficients for WT and NOX2-/-. Pearson coefficient was 0.62 +/- 0.05 (n = 6 cells) in WT myocytes and 0.14 +/- 0.05 (n = 5 cells) in NOX2-/- myocytes. (D) Manders coefficients were 0.68 +/- 0.03 (n = 6) in WT myocytes, suggesting that ~ 70% of NOX2 in the interior of the cell co-localizes with the t-system marked by Di-D. In NOX2-/- cells, the Manders coefficient was found to be 0.20 +/- 0.06 (n=5) indicating that there was minimal co-localization. Data are mean ± SEM. * p<0.001 compared to NOX2-/-value, paired t-test.

Fig. S9. Stretch-dependent recruitment of calcium release units (CRUs) in electrically stimulated myocytes. The method demonstrated here is used to quantify recruitment of CRUs. (A) CRU activity protocol. Fluo-4 loaded and nifedipine (2.5 µM) treated cells were subjected to 5 pre-pulses (via field stimulation; 2 msec. sq pulse) at 0.33 Hz to normalize SR Ca2+ load and control for use-dependent effects of nifedipine. Cells were then either held at resting length or subjected to an 8% stretch and field stimulated with a “test pulse”. Six independent trials were conducted on each cell,at 3 different line scan locations. One stretch and 1 non-stretch trial were conducted at each location so the same CRUs could be analyzed with and without stretch. (B) Top- distance vs. time (x vs. t) plot of fluorescence upon test pulse stimulation (red arrow). An
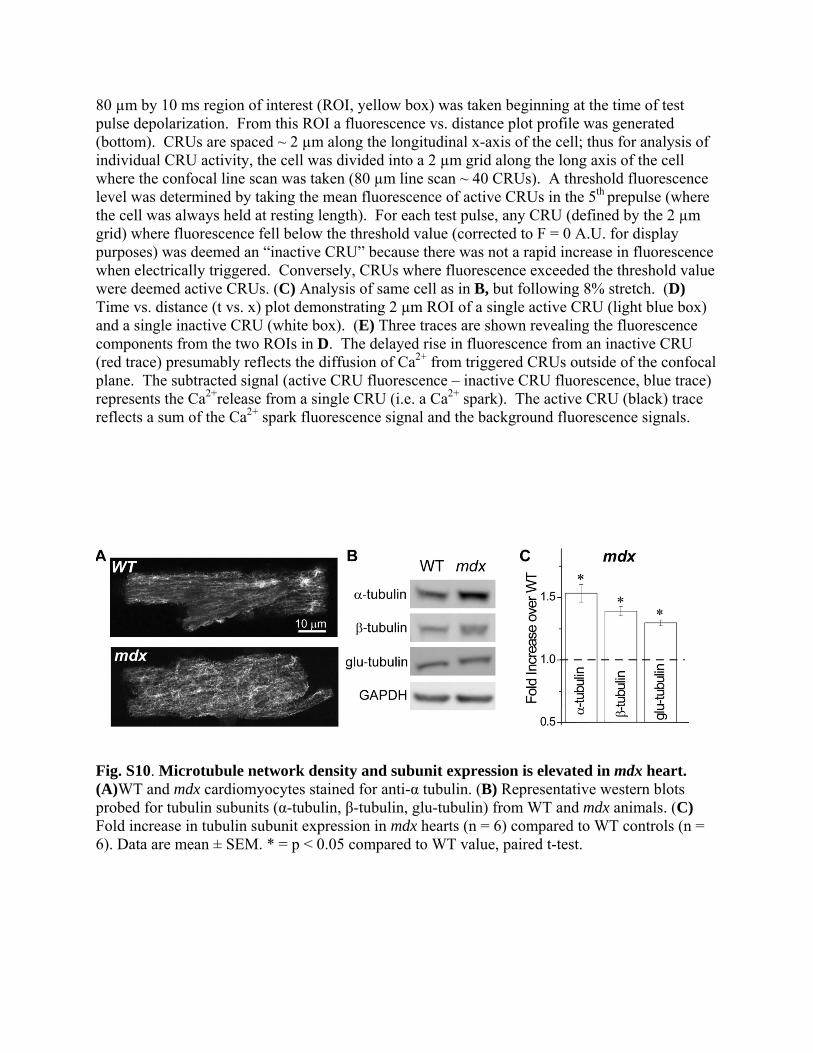
80 µm by 10 ms region of interest (ROI, yellow box) was taken beginning at the time of test pulse depolarization. From this ROI a fluorescence vs. distance plot profile was generated (bottom). CRUs are spaced ~ 2 µm along the longitudinal x-axis of the cell; thus for analysis of individual CRU activity, the cell was divided into a 2 µm grid along the long axis of the cell where the confocal line scan was taken (80 µm line scan ~ 40 CRUs). A threshold fluorescence level was determined by taking the mean fluorescence of active CRUs in the 5th prepulse (where the cell was always held at resting length). For each test pulse, any CRU (defined by the 2 µm grid) where fluorescence fell below the threshold value (corrected to F = 0 A.U. for display purposes) was deemed an “inactive CRU” because there was not a rapid increase in fluorescence when electrically triggered. Conversely, CRUs where fluorescence exceeded the threshold value were deemed active CRUs. (C) Analysis of same cell as in B, but following 8% stretch. (D) Time vs. distance (t vs. x) plot demonstrating 2 µm ROI of a single active CRU (light blue box) and a single inactive CRU (white box). (E) Three traces are shown revealing the fluorescence components from the two ROIs in D. The delayed rise in fluorescence from an inactive CRU (red trace) presumably reflects the diffusion of Ca2+ from triggered CRUs outside of the confocal plane. The subtracted signal (active CRU fluorescence – inactive CRU fluorescence, blue trace) represents the Ca2+release from a single CRU (i.e. a Ca2+ spark). The active CRU (black) trace reflects a sum of the Ca2+ spark fluorescence signal and the background fluorescence signals.
Fig. S10. Microtubule network density and subunit expression is elevated in mdx heart. (A)WT and mdx cardiomyocytes stained for anti-α tubulin. (B) Representative western blots probed for tubulin subunits (α-tubulin, β-tubulin, glu-tubulin) from WT and mdx animals. (C) Fold increase in tubulin subunit expression in mdx hearts (n = 6) compared to WT controls (n = 6). Data are mean ± SEM. * = p < 0.05 compared to WT value, paired t-test.

Fig. S11. Triplicate stretch protocol. (A) Passive tension elicited by 8% stretch on the first, second, and third cell stretch. (B) Stretch activated Ca2+ sparks elicited on 3 successive stretches followed by 30s rest between stretches. As no differences were seen in resting spark rate, stretched spark rate, or passive tension between successive stretches, data was pooled and analyzed together for each cell. Data are mean ± SEM. * = p < 0.05 compared to pre-stretch value, paired t-test.
SUPPLEMENTARY MOVIE LEGENDS Supplementary Movie 1. Stretch of single rat-ventricular myocyte. An intact single ventricular myocyte is attached to stiff glass micro-rods via MyoTak™. The cell is then subjected to a series of small step like changes in length occurring every few seconds (video speed 4x). Supplementary Movie 2. 3D reconstruction of myocyte attached to fluorescent MyoTak. Single ventricular myocyte stained with Di-8-ANEPPS to label the sarcolemma and t-tubules is attached to glass micro-rods via MyoTak. The MyoTak is fluorescent and is evident as a coating around the micro-rods. There is a large surface area of interaction between MyoTak and the cell membrane, which promotes robust cell attachment and control of cell length.

References and Notes 1. R. Knöll, M. Hoshijima, K. Chien, Cardiac mechanotransduction and implications for heart
disease. J. Mol. Med. 81, 750 (2003). Medline doi:10.1007/s00109-003-0488-x
2. M. B. Cannell, Pulling on the heart strings: A new mechanism within Starling’s law of the heart? Circ. Res. 104, 715 (2009). doi:10.1161/CIRCRESAHA.109.195511 Medline
3. R. Toh et al., An x-ray diffraction study on mouse cardiac cross-bridge function in vivo: effects of adrenergic beta-stimulation. Biophys. J. 90, 1723 (2006). doi:10.1529/biophysj.105.074062 Medline
4. G. Iribe et al., Axial stretch of rat single ventricular cardiomyocytes causes an acute and transient increase in Ca2+ spark rate. Circ. Res. 104, 787 (2009). doi:10.1161/CIRCRESAHA.108.193334 Medline
5. H. Cheng, W. J. Lederer, Calcium sparks. Physiol. Rev. 88, 1491 (2008). doi:10.1152/physrev.00030.2007 Medline
6. H. Cheng, W. J. Lederer, M. B. Cannell, Calcium sparks: Elementary events underlying excitation-contraction coupling in heart muscle. Science 262, 740 (1993). doi:10.1126/science.8235594 Medline
7. S. Yasuda et al., Dystrophic heart failure blocked by membrane sealant poloxamer. Nature 436, 1025 (2005). doi:10.1038/nature03844 Medline
8. Materials and methods are available as supporting material on Science Online
9. G. Iribe, P. Kohl, Axial stretch enhances sarcoplasmic reticulum Ca2+ leak and cellular Ca2+ reuptake in guinea pig ventricular myocytes: Experiments and models. Prog. Biophys. Mol. Biol. 97, 298 (2008). doi:10.1016/j.pbiomolbio.2008.02.012 Medline
10. J. Fauconnier et al., Leaky RyR2 trigger ventricular arrhythmias in Duchenne muscular dystrophy. Proc. Natl. Acad. Sci. U.S.A. 107, 1559 (2010). doi:10.1073/pnas.0908540107 Medline
11. N. D. Ullrich, M. Fanchaouy, K. Gusev, N. Shirokova, E. Niggli, Hypersensitivity of excitation-contraction coupling in dystrophic cardiomyocytes. Am. J. Physiol. Heart Circ. Physiol. 297, H1965 (2009). doi:10.1152/ajpheart.00602.2009 Medline
12. I. A. Williams, D. G. Allen, The role of reactive oxygen species in the hearts of dystrophin-deficient mdx mice. Am. J. Physiol. Heart Circ. Physiol. 293, H1969 (2007). doi:10.1152/ajpheart.00489.2007 Medline
13. B. L. Prosser, C. W. Ward, W. J. Lederer, Subcellular Ca2+ signaling in the heart: The role of ryanodine receptor sensitivity. J. Gen. Physiol. 136, 135 (2010). doi:10.1085/jgp.201010406 Medline
14. D. Terentyev et al., Redox modification of ryanodine receptors contributes to sarcoplasmic reticulum Ca2+ leak in chronic heart failure. Circ. Res. 103, 1466 (2008). doi:10.1161/CIRCRESAHA.108.184457 Medline
15. P. Donoso, G. Sanchez, R. Bull, C. Hidalgo, Modulation of cardiac ryanodine receptor activity by ROS and RNS. Front. Biosci. 16, 553 (2011). doi:10.2741/3705 Medline

16. A. Akki, M. Zhang, C. Murdoch, A. Brewer, A. M. Shah, NADPH oxidase signaling and cardiac myocyte function. J. Mol. Cell. Cardiol. 47, 15 (2009). doi:10.1016/j.yjmcc.2009.04.004 Medline
17. C. Jung, A. S. Martins, E. Niggli, N. Shirokova, Dystrophic cardiomyopathy: Amplification of cellular damage by Ca2+ signalling and reactive oxygen species-generating pathways. Cardiovasc. Res. 77, 766 (2008). doi:10.1093/cvr/cvm089 Medline
18. C. E. Murdoch, M. Zhang, A. C. Cave, A. M. Shah, NADPH oxidase-dependent redox signalling in cardiac hypertrophy, remodelling and failure. Cardiovasc. Res. 71, 208 (2006). doi:10.1016/j.cardiores.2006.03.016 Medline
19. C. Hidalgo, G. Sánchez, G. Barrientos, P. Aracena-Parks, A transverse tubule NADPH oxidase activity stimulates calcium release from isolated triads via ryanodine receptor type 1 S-glutathionylation. J. Biol. Chem. 281, 26473 (2006). doi:10.1074/jbc.M600451200 Medline
20. Y. Li, M. A. Trush, Diphenyleneiodonium, an NAD(P)H oxidase inhibitor, also potently inhibits mitochondrial reactive oxygen species production. Biochem. Biophys. Res. Commun. 253, 295 (1998). doi:10.1006/bbrc.1998.9729 Medline
21. J. A. Byrne et al., Contrasting roles of NADPH oxidase isoforms in pressure-overload versus angiotensin II-induced cardiac hypertrophy. Circ. Res. 93, 802 (2003). Medline doi:10.1161/01.RES.0000099504.30207.F5
22. K. D. Martyn, L. M. Frederick, K. von Loehneysen, M. C. Dinauer, U. G. Knaus, Functional analysis of Nox4 reveals unique characteristics compared to other NADPH oxidases. Cell. Signal. 18, 69 (2006). doi:10.1016/j.cellsig.2005.03.023 Medline
23. F. E. Rey, M. E. Cifuentes, A. Kiarash, M. T. Quinn, P. J. Pagano, Novel competitive inhibitor of NAD(P)H oxidase assembly attenuates vascular O2
– and systolic blood pressure in mice. Circ. Res. 89, 408 (2001). doi:10.1161/hh1701.096037 Medline
24. A. Best, S. Ahmed, R. Kozma, L. Lim, The Ras-related GTPase Rac1 binds tubulin. J. Biol. Chem. 271, 3756 (1996). doi:10.1074/jbc.271.7.3756 Medline
25. G. Sánchez et al., Exercise and tachycardia increase NADPH oxidase and ryanodine receptor-2 activity: possible role in cardioprotection. Cardiovasc. Res. 77, 380 (2008). doi:10.1093/cvr/cvm011 Medline
26. L. F. Santana, H. Cheng, A. M. Gómez, M. B. Cannell, W. J. Lederer, Relation between the sarcolemmal Ca2+ current and Ca2+ sparks and local control theories for cardiac excitation-contraction coupling. Circ. Res. 78, 166 (1996). Medline
27. I. A. Williams, D. G. Allen, Intracellular calcium handling in ventricular myocytes from mdx mice. Am. J. Physiol. Heart Circ. Physiol. 292, H846 (2007). doi:10.1152/ajpheart.00688.2006 Medline
28. S. Hein, S. Kostin, A. Heling, Y. Maeno, J. Schaper, The role of the cytoskeleton in heart failure. Cardiovasc. Res. 45, 273 (2000). doi:10.1016/S0008-6363(99)00268-0 Medline
29. R. Mitra, M. Morad, A uniform enzymatic method for dissociation of myocytes from hearts and stomachs of vertebrates. Am. J. Physiol. 249, H1056 (1985). Medline

30. K. W. Prins et al., Dystrophin is a microtubule-associated protein. J. Cell Biol. 186, 363 (2009). doi:10.1083/jcb.200905048 Medline
31. S. Bolte, F. P. Cordelières, A guided tour into subcellular colocalization analysis in light microscopy. J. Microsc. 224, 213 (2006). doi:10.1111/j.1365-2818.2006.01706.x Medline
Acknowledgments: We thank S. Martin for antibodies to tubulin subunits and for discussion, G. Shi for technical assistance, and M. Williams for NOX2−/− animals. B.L.P is supported by an NIH training grant (T32 HL072751-07) to the Training Program in Cardiovascular Cell Biology. This work was supported by NIH grants R01 HL106059, P01 HL67849, R01 HL36974, RC2 NR011968, and S10 RR023028; Leducq North American-European Atrial Fibrillation Research Alliance; European Union Seventh Framework Program (FP7), Georg August University, “Identification and therapeutic targeting of common arrhythmia trigger mechanisms”; and the Maryland Stem Cell Research Fund. World Precision Instruments (WPI, Sarasota, FL, USA and SI-Heidelberg), Gabe Sinclair (Fourhourday, Baltimore, MD, USA), and Siskiyou (Grants Pass, OR, USA) supported instrumentation and equipment development.