x-rays on earth and from space nustar educator's guide
TRANSCRIPT

X-Rays on Earth and From Space
NuSTAR Educator’s Guide


http://www.NuSTAR.caltech.edu/
NuSTAR Educator’s GuideX-rays on Earth and from Space
National Aeronautics andSpace Administration

NuSTAR Educator’s Guide -- The activities in this guide were written by Carolyn Peruta and Lynn Cominsky, with input from Janet Moore and Tyson Harty. Layout and Design by Aurore Simonnet, SSU Education and Public Outreach Group, Sonoma State University, Rohnert Park, CA
About this Guide - Summary of Activities - page 3
Next Generation Science Standards - page 4
Common Core Mathematics and Literacy Standards - page 6
About NuSTAR - page 7
Components of NuSTAR - page 8
What are X-rays? - page 10
• Activity 1 - Focusing X-rays - page 13Teacher Overview - page 13
Student Handout - page 15
Focusing Graphing Paper - page 20
• Activity 2 - Building a Stable Mast - page 21Teacher Overview - page 21Student Handout - page 23
• Activity 3 - Black Holes in the News - page 25Teacher Overview - page 25Article 1: NASA’s NuSTAR Spots Flare from Milky Way’s Black Hole - page 27Article 2: Black Hole Naps amidst Stellar Chaos - page 28Article 3: Do Black Holes Come in Size Medium? - page 29Article 4: NASA’s NuSTAR Telescope Discovers Shockingly Bright Dead Star - page 30Student Handout - page 32
• Activity 4 - Medical X-rays - page 33Teacher Overview - page 33Student Handout - page 36Article 1: Radiography - page 38Article 2: Exposure from Computed Tomography - page 40
Appendix A - Glossary - page 44
Appendix B - Resources - page 45
Appendix C - References - page 46
Content
3
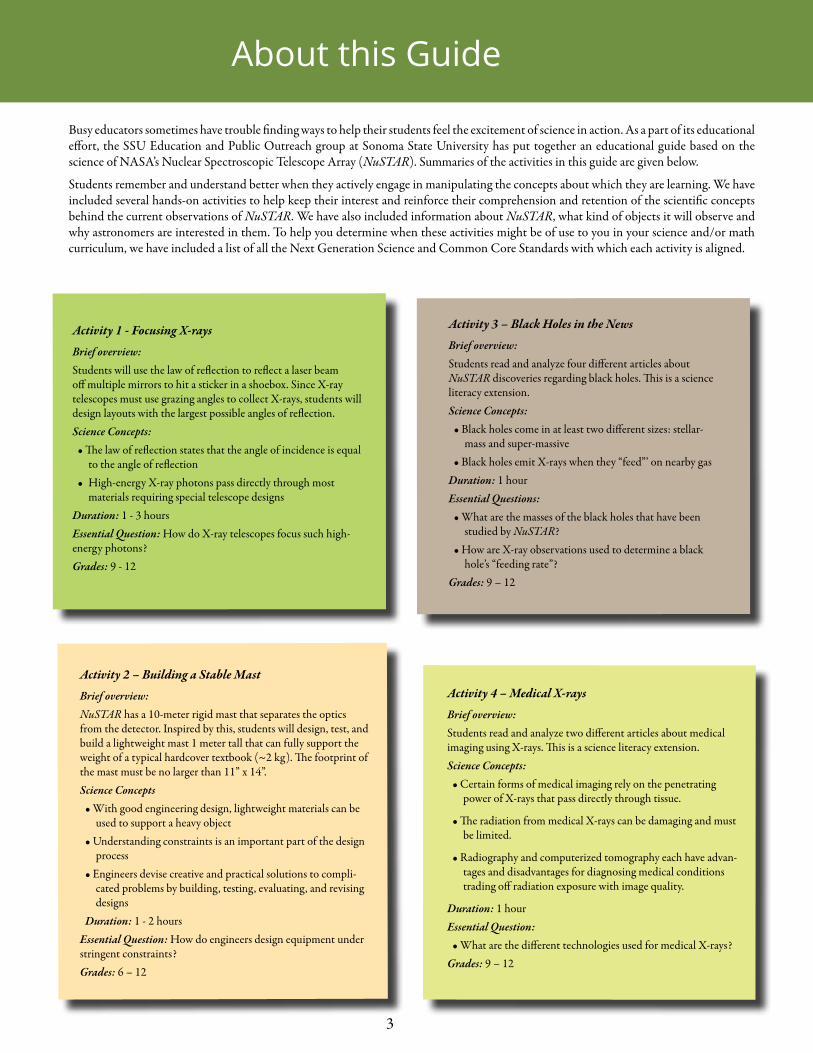
Busy educators sometimes have trouble finding ways to help their students feel the excitement of science in action. As a part of its educational effort, the SSU Education and Public Outreach group at Sonoma State University has put together an educational guide based on the science of NASA’s Nuclear Spectroscopic Telescope Array (NuSTAR). Summaries of the activities in this guide are given below.
Students remember and understand better when they actively engage in manipulating the concepts about which they are learning. We have included several hands-on activities to help keep their interest and reinforce their comprehension and retention of the scientific concepts behind the current observations of NuSTAR. We have also included information about NuSTAR, what kind of objects it will observe and why astronomers are interested in them. To help you determine when these activities might be of use to you in your science and/or math curriculum, we have included a list of all the Next Generation Science and Common Core Standards with which each activity is aligned.
Activity 1 - Focusing X-raysBrief overview: Students will use the law of reflection to reflect a laser beam off multiple mirrors to hit a sticker in a shoebox. Since X-ray telescopes must use grazing angles to collect X-rays, students will design layouts with the largest possible angles of reflection.Science Concepts:
• The law of reflection states that the angle of incidence is equal to the angle of reflection
• High-energy X-ray photons pass directly through most materials requiring special telescope designs
Duration: 1 - 3 hoursEssential Question: How do X-ray telescopes focus such high-energy photons?Grades: 9 - 12
Activity 4 – Medical X-raysBrief overview: Students read and analyze two different articles about medical imaging using X-rays. This is a science literacy extension.Science Concepts:
• Certain forms of medical imaging rely on the penetrating power of X-rays that pass directly through tissue.
• The radiation from medical X-rays can be damaging and must be limited.
• Radiography and computerized tomography each have advan-tages and disadvantages for diagnosing medical conditions trading off radiation exposure with image quality.
Duration: 1 hourEssential Question:
• What are the different technologies used for medical X-rays?Grades: 9 – 12
Activity 2 – Building a Stable MastBrief overview: NuSTAR has a 10-meter rigid mast that separates the optics from the detector. Inspired by this, students will design, test, and build a lightweight mast 1 meter tall that can fully support the weight of a typical hardcover textbook (~2 kg). The footprint of the mast must be no larger than 11” x 14”. Science Concepts
• With good engineering design, lightweight materials can be used to support a heavy object
• Understanding constraints is an important part of the design process
• Engineers devise creative and practical solutions to compli-cated problems by building, testing, evaluating, and revising designs
Duration: 1 - 2 hoursEssential Question: How do engineers design equipment under stringent constraints? Grades: 6 – 12
Activity 3 – Black Holes in the NewsBrief overview: Students read and analyze four different articles about NuSTAR discoveries regarding black holes. This is a science literacy extension.Science Concepts:
• Black holes come in at least two different sizes: stellar-mass and super-massive
• Black holes emit X-rays when they “feed”’ on nearby gasDuration: 1 hourEssential Questions:
• What are the masses of the black holes that have been studied by NuSTAR?
• How are X-ray observations used to determine a black hole’s “feeding rate”?
Grades: 9 – 12
About this Guide
4
Disciplinary Core Ideas (MS)
PS4.A: Wave Properties - in Activities 3 and 4A simple wave has a repeating pattern with a specific wavelength, frequency, and amplitude.
PS4.B: Electromagnetic Radiation - in Activities 1 and 4When light shines on an object, it is reflected, absorbed, or transmitted through the object, depending on the object’s mate-rial and the frequency (color) of the light. A wave model of light is useful for explaining brightness, color, and the frequency-dependent bending of light at a surface between media.However, because light can travel through space, it cannot be a matter wave, like sound or water waves.
Disciplinary Core Ideas (HS)
PS1.A: Structure and Properties of Matter - in Activity 4Each atom has a charged substructure consisting of a nucleus, which is made of protons and neutrons, surrounded by elec-trons.
PS1.C: Nuclear Processes - in Activities 3 and 4Nuclear processes, including fusion, fission, and radioactive decays of unstable nuclei, involve release or absorption of en-ergy. The total number of neutrons plus protons does not change in any nuclear process.
PS4.B: Electromagnetic Radiation - in Activities 3 and 4Electromagnetic radiation (e.g., radio, microwaves, light) can be modeled as a wave of changing electric and magnetic fields or as particles called photons. The wave model is useful for explaining many features of electromagnetic radiation, and the particle model explains other features. When light or longer wavelength electromagnetic radiation is absorbed in matter, it is generally converted into thermal energy (heat). Shorter wavelength electromagnetic radiation (ultraviolet, X-rays, gamma rays) can ionize atoms and cause damage to living cells
PS4.C: Information Technologies and Instrumentation - in Activities 1, 3 and 4Multiple technologies based on the understanding of waves and their interactions with matter are part of everyday experi-ences in the modern world (e.g., medical imaging, communications, scanners) and in scientific research. They are essential tools for producing, transmitting, and capturing signals and for storing and interpreting the information contained in them.
ESS1.A: The Universe and Its Stars - in Activity 3Other than the hydrogen and helium formed at the time of the Big Bang, nuclear fusion within stars produces all atomic nuclei lighter than and including iron, and the process releases electromagnetic energy. Heavier elements are produced when certain massive stars achieve a supernova stage and explode. (HS-ESS1-2),(HS-ESS1-3)
Next Generation Science Standards

5
Science and Engineering Practices (MS)
Developing and Using Models - in Activities 1 and 2Develop and use a model to describe phenomena
Using Mathematics and Computational Thinking - in Activities 1 and 2Use mathematical representations to describe and/or support scientific conclusions and design solutions.
Obtaining, Evaluating, and Communicating Information - in Activities 3 and 4Integrate qualitative scientific and technical information in written text with that contained in media and visual displays to clarify claims and findings.
Scientific Knowledge is Based on Empirical Evidence - in Activities 1,2, 3 and 4Science knowledge is based upon logical and conceptual connections between evidence and explanations.
Science and Engineering Practices (HS)
Developing and Using Models - in Activities 1 and 2Develop and use a model based on evidence to illustrate the relationships between systems or between components of a system.
Planning and Carrying Out Investigations - in Activities 1 and 2Plan and conduct an investigation individually and collaboratively to produce data to serve as the basis for evidence, and in the design: decide on types, how much, and accuracy of data needed to produce reliable measurements and consider limitations on the precision of the data (e.g., number of trials, cost, risk, time), and refine the design accordingly.
Using Mathematics and Computational Thinking - in Activities 1 and 2Create a computational model or simulation of a phenomenon, designed device, process, or system.
Constructing Explanations and Designing Solutions - in Activity 2Design, evaluate, and/or refine a solution to a complex real-world problem, based on scientific knowledge, student-generated sources of evidence, prioritized criteria, and tradeoff considerations.
Engaging in Argument from Evidence - in Activities 3 and 4Evaluate evidence behind currently accepted explanations or solutions to determine the merits of arguments.
Science Models, Laws, Mechanisms, and Theories Explain Natural Phenomena - in Activities 1,2, 3 and 4A scientific theory is a substantiated explanation of some aspect of the natural world, based on a body of facts that have been re-peatedly confirmed through observation and experiment and the science community validates each theory before it is accepted. If new evidence is discovered that the theory does not accommodate, the theory is generally modified in light of this new evidence. Models, mechanisms, and explanations collectively serve as tools in the development of a scientific theory.
6
Math Standards - Focusing X-Rays
CCSS.MATH.CONTENT.7.G.B.5 Use facts about supplementary, complementary, vertical, and adjacent angles in a multi-step problem to write and solve simple equations for an unknown angle in a figure.
CCSS.MATH.CONTENT.HSN.Q.A.2 Define appropriate quantities for the p urpose of descriptive modeling.
CCSS.MATH.CONTENT.HSN.Q.A.3 Choose a level of accuracy appropriate to limitations on measurement when reporting quantities.
CCSS.MATH.CONTENT.HSG.M.G.A.1 Use geometric shapes, their measures, and their properties to describe objects (e.g., modeling a tree trunk or a human torso as a cylinder).
Math Standards - Building a Stable Mast
CCSS.MATH.CONTENT.HSG.M.G.A.3 Apply geometric methods to solve design problems (e.g., designing an object or structure to satisfy physical constraints or minimize cost; working with typographic grid systems based on ratios).
CCSS.MATH.CONTENT.HSG.M.G.A.1 Use geometric shapes, their measures, and their properties to describe objects (e.g., modeling a tree trunk or a human torso as a cylinder).
Common Core Standards
Literacy Standards - Black Holes in the News and Medical X-Rays
6th grade CCSS.ELA-LITERACY.RI.6.1 Cite textual evidence to support analysis of what the text says explicitly as well as inferences drawn from the text.
CCSS.ELA-LITERACY.RI.6.2 Determine a central idea of a text and how it is conveyed through particular details; provide a summary of the text distinct from personal opinions or judgments.
CCSS.ELA-LITERACY.RI.6.3 Analyze in detail how a key individual, event, or idea is introduced, illustrated, and elaborated in a text (e.g., through examples or anecdotes).
CCSS.ELA-LITERACY.RI.7.4 Determine the meaning of words and phrases as they are used in a text, including figurative, connotative, and technical meanings; analyze the impact of a specific word choice on meaning and tone.
7th gradeCCSS.ELA-LITERACY.RI.7.1 Cite several pieces of textual evidence to support analysis of what the text says explicitly as well as inferences drawn from the text.
CCSS.ELA-LITERACY.RI.7.2 Determine two or more central ideas in a text and analyze their development over the course of the text; provide an objective summary of the text.
CCSS.ELA-LITERACY.RI.7.3 Analyze the interactions between individuals, events, and ideas in a text (e.g., how ideas influence individuals or events, or how individuals influence ideas or events).
8th gradeCCSS.ELA-LITERACY.RI.8.1 Cite the textual evidence that most strongly supports an analysis of what the text says explicitly as well as inferences drawn from the text.
CCSS.ELA-LITERACY.RI.8.2 Determine a central idea of a text and analyze its development over the course of the text, including its relationship to supporting ideas; provide an objective summary of the text.
CCSS.ELA-LITERACY.RI.8.3 Analyze how a text makes connections among and distinctions between individuals, ideas, or events (e.g., through comparisons, analogies, or categories).
9th - 12th gradeCCSS.ELA-LITERACY.RI.9-10.1 Cite strong and thorough textual evidence to support analysis of what the text says explicitly as well as inferences drawn from the text.
CCSS.ELA-LITERACY.RI.9-10.2 Determine a central idea of a text and analyze its development over the course of the text, including how it emerges and is shaped and refined by specific details; provide an objective summary of the text.
CCSS.ELA-LITERACY.RI.11-12.1 Cite strong and thorough textual evidence to support analysis of what the text says explicitly as well as inferences drawn from the text, including determining where the text leaves matters uncertain.
CCSS.ELA-LITERACY.RI.11-12.2 Determine two or more central ideas of a text and analyze their development over the course of the text, including how they interact and build on one another to provide a complex analysis; provide an objective summary of the text.

7
NA
SA’s
Nuc
lear
Spe
ctro
scop
ic T
eles
cope
Arr
ay, N
uSTA
R, is
ope
ning
a n
ew w
indo
w o
n th
e U
nive
rse
by b
eing
the
first
sa
telli
te to
focu
s hig
h-en
ergy
X-r
ays i
nto
shar
p im
ages
. The s
atel
lite w
as la
unch
ed in
to lo
w-E
arth
orb
it on
June
13,
201
2.
NuS
TAR’
s hig
h-en
ergy
X-ra
y ey
es se
e w
ith m
ore
than
100
tim
es th
e sen
sitiv
ity
of p
revi
ous m
issio
ns th
at h
ave
oper
ated
in
this
part
of t
he el
ectr
omag
netic
spec
trum
, and
with
10
times
bet
ter r
esol
utio
n. N
uSTA
R sh
eds l
ight
on
som
e of t
he
hott
est,
dens
est,
and
mos
t ene
rget
ic o
bjec
ts in
the u
nive
rse.
NuS
TAR
exte
nds t
he p
ower
of f
ocus
ing,
empl
oyed
by l
ow-e
nerg
y X-ra
y tel
esco
pes l
ike N
ASA
’s C
hand
ra O
bser
vato
ry, t
o hi
gher
ener
gies
. This
enab
les N
uSTA
R to
pee
r thr
ough
dus
t and
gas
, unc
over
ing
blac
k ho
les a
nd n
eutr
on st
ars b
urie
d in
th
e hea
rt o
f the
Milk
y Way
as w
ell a
s oth
er g
alax
ies.
NuS
TAR
addr
esse
s exc
iting
que
stion
s lik
e: H
ow w
ere
elem
ents
tha
t co
mpo
se o
ur b
odie
s an
d th
e Ea
rth
forg
ed a
nd d
isper
sed
in t
he e
xplo
sions
of
mas
sive
star
s? W
hat p
ower
s the
mos
t ext
rem
e act
ive g
alax
ies?
Pe
rhap
s the
mos
t exc
iting
is th
e op
port
unity
to d
is-co
ver w
onde
rs o
f whi
ch w
e hav
e not
yet d
ream
ed.
Wha
t is t
he N
ucle
ar S
pect
rosc
opic
Tel
esco
pe A
rray
(NuS
TAR
)?
Abou
t NuS
TAR
Wha
t’s in
a N
ame
NuS
TAR
incl
udes
two f
ocus
ing X
-ray t
eles
cope
s, he
nce “
Tele
scop
e A
rray
.” A
s w
ell
as m
akin
g fo
cuse
d X
-ray
imag
es,
NuS
TAR’
s sc
ient
ific c
apab
ilitie
s also
incl
ude t
he ab
ility
to m
easu
re th
e ene
rgy
of ea
ch in
com
ing
X-ra
y, he
nce “
Spec
tros
copi
c.” A
nd m
any
of th
e X
-rays
tha
t N
uSTA
R w
ill s
tudy
are
em
itted
fro
m n
ucle
ar li
nes
from
che
mic
al e
lemen
ts th
at a
re c
reat
ed in
supe
rnov
a ex
plos
ions
or
from
the
nucl
ei o
f act
ive
gala
xies
– h
ence
a d
ual m
eani
ng fo
r th
e wor
d “N
ucle
ar.”
8
Components of NuSTAR
Cadmium-Zinc-Telluride Detector
Folded Mast
Solar Panel
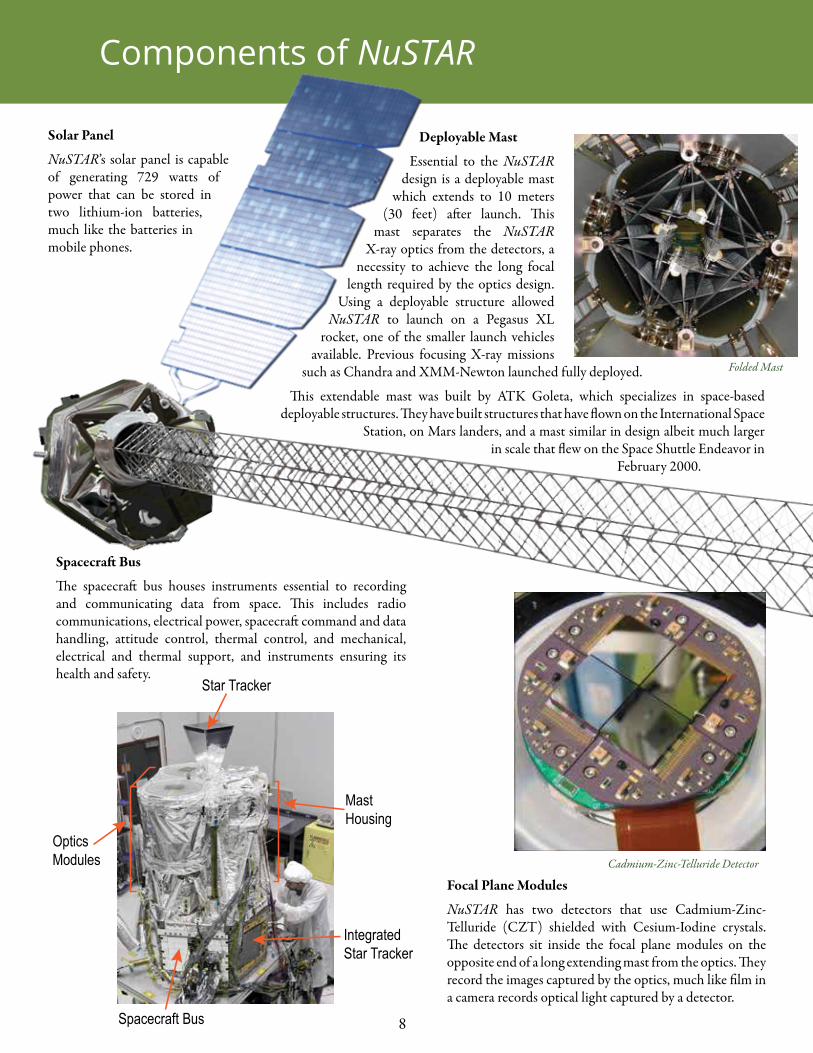
NuSTAR’s solar panel is capable of generating 729 watts of power that can be stored in two lithium-ion batteries, much like the batteries in mobile phones.
Deployable Mast
Essential to the NuSTAR design is a deployable mast
which extends to 10 meters (30 feet) after launch. This
mast separates the NuSTAR X-ray optics from the detectors, a
necessity to achieve the long focal length required by the optics design.
Using a deployable structure allowed NuSTAR to launch on a Pegasus XL
rocket, one of the smaller launch vehicles available. Previous focusing X-ray missions
such as Chandra and XMM-Newton launched fully deployed.
This extendable mast was built by ATK Goleta, which specializes in space-based deployable structures. They have built structures that have flown on the International Space
Station, on Mars landers, and a mast similar in design albeit much larger in scale that flew on the Space Shuttle Endeavor in
February 2000.
Spacecraft Bus
The spacecraft bus houses instruments essential to recording and communicating data from space. This includes radio communications, electrical power, spacecraft command and data handling, attitude control, thermal control, and mechanical, electrical and thermal support, and instruments ensuring its health and safety.
Focal Plane Modules
NuSTAR has two detectors that use Cadmium-Zinc-Telluride (CZT) shielded with Cesium-Iodine crystals. The detectors sit inside the focal plane modules on the opposite end of a long extending mast from the optics. They record the images captured by the optics, much like film in a camera records optical light captured by a detector.
9
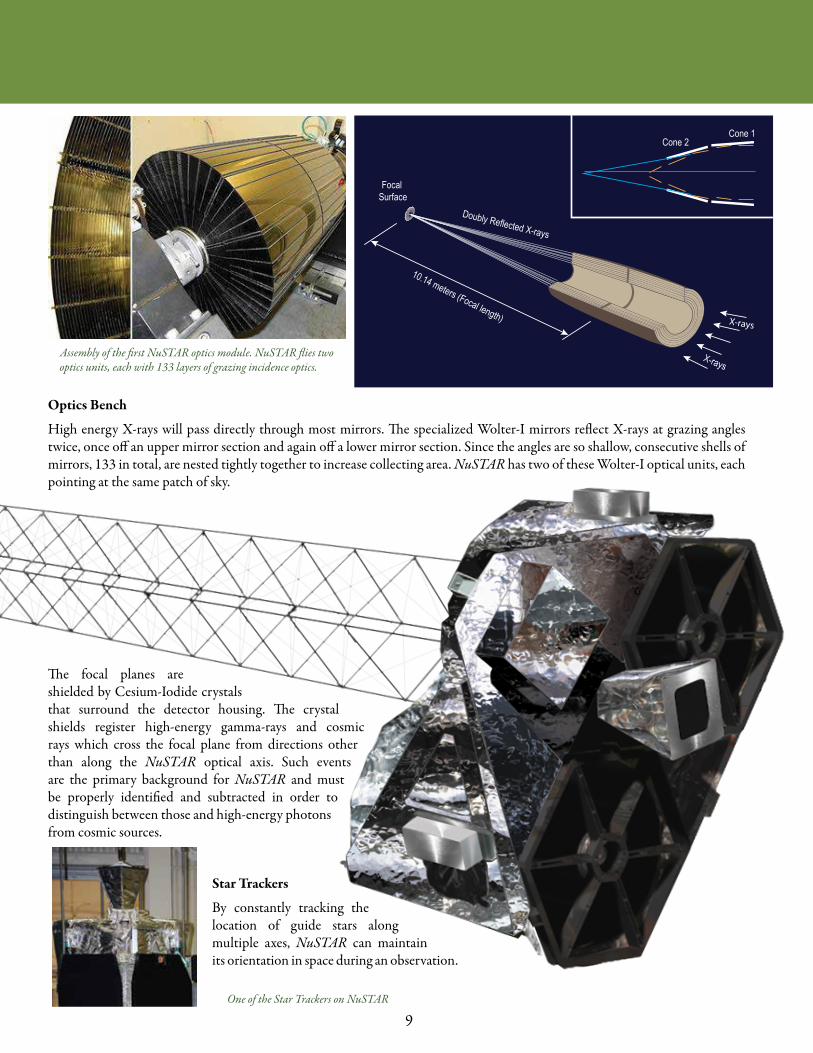
Assembly of the first NuSTAR optics module. NuSTAR flies two optics units, each with 133 layers of grazing incidence optics.
One of the Star Trackers on NuSTAR
Optics Bench
High energy X-rays will pass directly through most mirrors. The specialized Wolter-I mirrors reflect X-rays at grazing angles twice, once off an upper mirror section and again off a lower mirror section. Since the angles are so shallow, consecutive shells of mirrors, 133 in total, are nested tightly together to increase collecting area. NuSTAR has two of these Wolter-I optical units, each pointing at the same patch of sky.
The focal planes are shielded by Cesium-Iodide crystals that surround the detector housing. The crystal shields register high-energy gamma-rays and cosmic rays which cross the focal plane from directions other than along the NuSTAR optical axis. Such events are the primary background for NuSTAR and must be properly identified and subtracted in order to distinguish between those and high-energy photons from cosmic sources.
Star Trackers
By constantly tracking the location of guide stars along multiple axes, NuSTAR can maintain its orientation in space during an observation.

10
X-rays are a form of high energy light in the electromagnetic spectrum. X-rays are more energetic than ultraviolet light but less energetic than gamma rays.
You probably know from visits to the doctor or dentist that X-rays can be used to create images of our insides. These images are not like normal photographs, however. They are really shadows. X-rays can penetrate many materials, but their penetrability depends on the density of the material. Thus, they pass easily through skin and muscles, but less through bones and teeth. As a result, X-ray images really just show contrast in the shadows caused by different parts of the body. They can also be used the same way to look into other materials, like inside machines, or within your bags at the airport.
X-ray images of astronomical objects are very different because the objects are emitting X-ray photons and the telescope is just catching them. Not all wavelengths of light penetrate through Earth’s atmosphere to the ground as can be seen in Figure 4. Certain wavelengths of radio are absorbed, as are those in the far infrared. In fact, most of what penetrates our atmosphere and reaches the ground is the very narrow band of visible light and a large portion of the radio spectrum. Everything else is stopped high above. Since Earth’s atmosphere absorbs X-rays, X-ray astronomy is always done from instruments in space.
What Are X-rays?
Fig. 1 NuSTAR can only observe a small portion of the electromagnetic spectrum where photons have energies of 3-79 keV
Fig. 2 A supernova explosion left behind a pulsar wind nebula nicknamed the Hand of God. NuSTAR has imaged the structure in high-energy X-rays for the first time, shown in blue. Lower-energy X-ray light previously detected by NASA’s Chandra X-ray Observatory is shown in green and red.
11
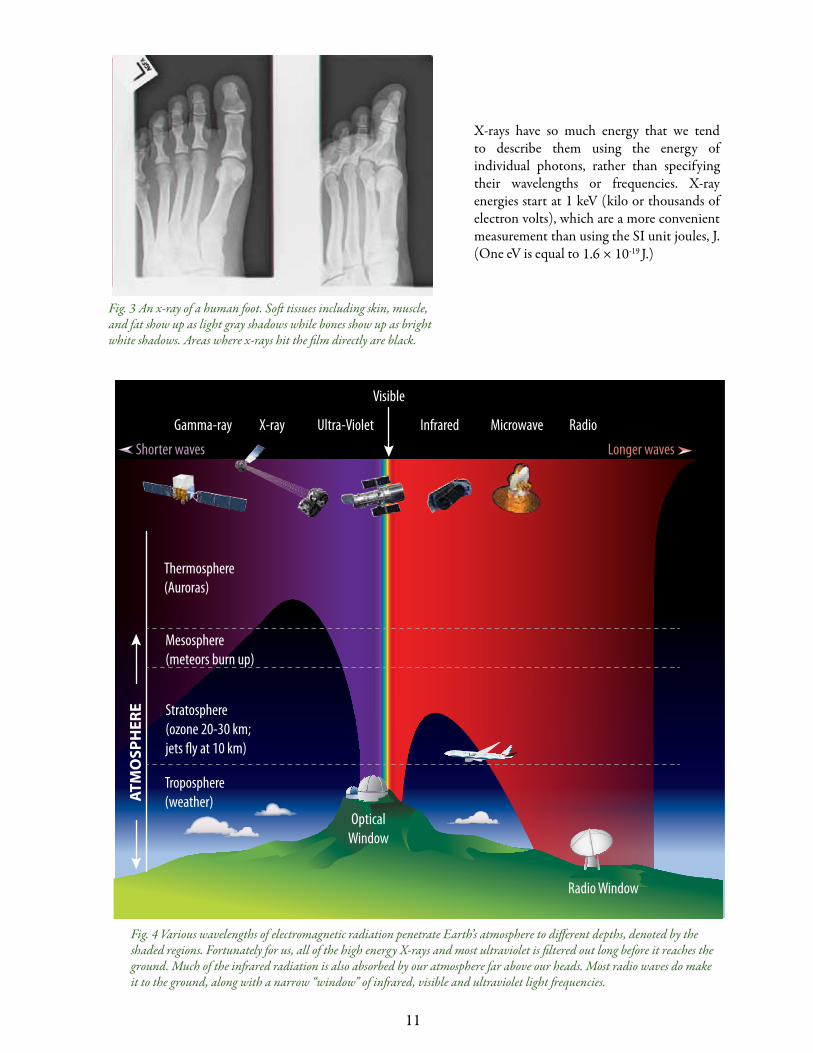
Fig. 3 An x-ray of a human foot. Soft tissues including skin, muscle, and fat show up as light gray shadows while bones show up as bright white shadows. Areas where x-rays hit the film directly are black.
Fig. 4 Various wavelengths of electromagnetic radiation penetrate Earth’s atmosphere to different depths, denoted by the shaded regions. Fortunately for us, all of the high energy X-rays and most ultraviolet is filtered out long before it reaches the ground. Much of the infrared radiation is also absorbed by our atmosphere far above our heads. Most radio waves do make it to the ground, along with a narrow “window” of infrared, visible and ultraviolet light frequencies.
X-rays have so much energy that we tend to describe them using the energy of individual photons, rather than specifying their wavelengths or frequencies. X-ray energies start at 1 keV (kilo or thousands of electron volts), which are a more convenient measurement than using the SI unit joules, J. (One eV is equal to 1.6 times 10 to the minus 19 Joules.)

12
Inverse Compton Scattering
If a low energy photon collides with an electron in a high-energy state, the collision can increase the photon energy to X-ray energies.
e
p
e
eSynchrotron Radiation
Charged particles accelerated in a curved path around magnetic field lines can emit electromagnetic radiation in the form of X-rays.
Thermal Blackbody Radiation
Blackbody radiation is produced by an object held at a constant temperature. Much like a typical tungsten light bulb emits optical light when the filament is at ~10,000 K, gas ejected from a supernovae or spiraling into a black hole between
Creating Cosmic X-rays
When charged particles are accelerated, electromagnetic radiation is emitted, and as the acceleration increases, higher energy photons (like X-rays) are produced.
Different types of acceleration mechanisms produce X-rays with differing spectral energy distributions: three of these non-thermal processes are depicted below. An individual object may also emit thermal (black body) radiation that indicates its temperature.
Bremsstrahlung
Through bremsstrahlung or “braking radiation,” X-rays are produced in high-speed encounters between electrons and protons. As the electron decelerates past the proton, a high-energy X-ray photon can be emitted.
10 to the 7 and 10 to the 9 K will emit X-ray radiation.
13
Background Information
Astronomical focusing of visible light by the use of mirrors and lenses is an old technique, dating back 400 years to Galileo’s first observations with his home-made telescope in 1609.
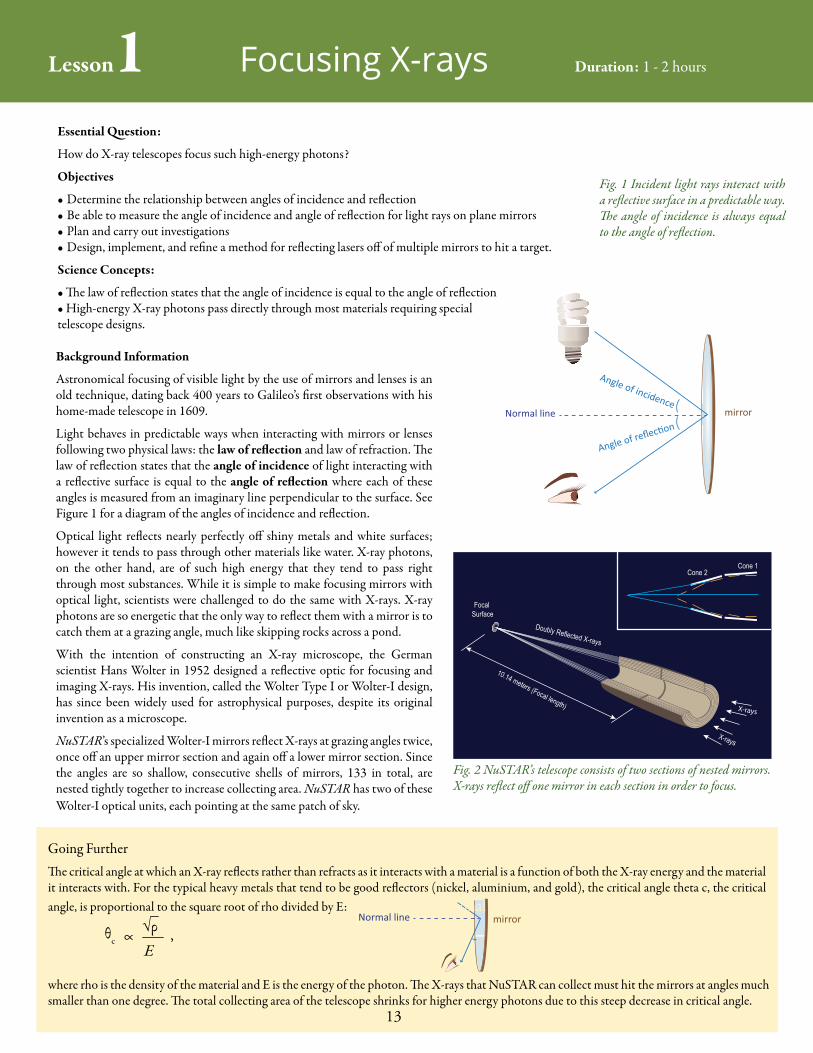
Light behaves in predictable ways when interacting with mirrors or lenses following two physical laws: the law of reflection and law of refraction. The law of reflection states that the angle of incidence of light interacting with a reflective surface is equal to the angle of reflection where each of these angles is measured from an imaginary line perpendicular to the surface. See Figure 1 for a diagram of the angles of incidence and reflection.
Optical light reflects nearly perfectly off shiny metals and white surfaces; however it tends to pass through other materials like water. X-ray photons, on the other hand, are of such high energy that they tend to pass right through most substances. While it is simple to make focusing mirrors with optical light, scientists were challenged to do the same with X-rays. X-ray photons are so energetic that the only way to reflect them with a mirror is to catch them at a grazing angle, much like skipping rocks across a pond.
With the intention of constructing an X-ray microscope, the German scientist Hans Wolter in 1952 designed a reflective optic for focusing and imaging X-rays. His invention, called the Wolter Type I or Wolter-I design, has since been widely used for astrophysical purposes, despite its original invention as a microscope.
NuSTAR’s specialized Wolter-I mirrors reflect X-rays at grazing angles twice, once off an upper mirror section and again off a lower mirror section. Since the angles are so shallow, consecutive shells of mirrors, 133 in total, are nested tightly together to increase collecting area. NuSTAR has two of these Wolter-I optical units, each pointing at the same patch of sky.
Lesson1 Focusing X-rays Duration: 1 - 2 hours
13
Fig. 1 Incident light rays interact with a reflective surface in a predictable way. The angle of incidence is always equal to the angle of reflection.
Fig. 2 NuSTAR’s telescope consists of two sections of nested mirrors. X-rays reflect off one mirror in each section in order to focus.
θc ∞√ρE
,
Essential Question:
How do X-ray telescopes focus such high-energy photons?
Objectives
• Determine the relationship between angles of incidence and reflection• Be able to measure the angle of incidence and angle of reflection for light rays on plane mirrors• Plan and carry out investigations • Design, implement, and refine a method for reflecting lasers off of multiple mirrors to hit a target.
Science Concepts:
• The law of reflection states that the angle of incidence is equal to the angle of reflection• High-energy X-ray photons pass directly through most materials requiring special telescope designs.
Going FurtherThe critical angle at which an X-ray reflects rather than refracts as it interacts with a material is a function of both the X-ray energy and the material it interacts with. For the typical heavy metals that tend to be good reflectors (nickel, aluminium, and gold), the critical angle theta c, the critical angle, is proportional to the square root of rho divided by E: theta c is proportional to one over E times the square root of rho
where rho is the density of the material and E is the energy of the photon. The X-rays that NuSTAR can collect must hit the mirrors at angles much smaller than one degree. The total collecting area of the telescope shrinks for higher energy photons due to this steep decrease in critical angle.

14
Materials For the class• Hot glue gun• Scissors• Student Handout
For each group of 2-4 students• 6 mosaic square mirror tiles between 1 and 2 inches
(can be purchased in bulk online or in craft stores)• 3 wooden skewers • 3 dot stickers (Avery 05473)• Shoebox • Styrofoam – about 1 inch thick and sized to fit the
shoebox • 2 Focusing Graph Paper handouts• Student worksheet• Protractor• Ruler • Laser pointer • OPTIONAL binder clip – one per group (simple
mount for the laser pointer)
Getting Started
Before the lesson begins, put together a shoebox set for each group of students.
1. Snap or cut each skewer in half. 2. Attach a mirror to each of the shortened wooden skewers with
the hot glue gun about one inch from the end. 3. Cut a piece of Styrofoam for each shoebox such that it
completely fills the bottom.4. Cut, reduce in size, or enlarge the sheet “Focusing Graph
Paper” such that it fits inside the shoebox. Copy a second sheet of the resized “Focusing Graph Paper” for student planning.
5. Insert Styrofoam and graph paper inside the shoebox.
Procedure:
1. Introduce the activity by using the information in the NuSTAR introduction and in the activity Background Information.2. Explain to the students that they will be exploring how to focus a beam of light using many consecutive mirrors.3. Have the students work through the student worksheet. Section A involves measuring and drawing angles of reflec-tion. Students will start to build models with their shoebox-es for section B and will connect the concepts introduced to NuSTAR in section C.
Answers
A. Investigations1. The angles of incidence and reflection are equal.2. The angle complementary to the angle of incidence is equal to
the angle complementary to the angle of reflection in this case. 3. Answers will vary. One common problem is that most mirrors
are “second surface” meaning the actual reflection happens on the back coating of the mirror rather than at the glass surface. Another common trouble is with lining up the laser with the drawn line.
B. ConstructionAnswers will vary. Check for completion of all sections.
C. Applications to NuSTAR1. Zero degrees2. All of it, 1 full inch3. More than half4. As the angle of incidence increases, the collecting area of the
mirror shrinks. Someone may even know the true relationship, width =1-inch × cos(θ). theta
5. Answers will vary. Grazing incidence mirrors have very small effective areas. To maximize the collecting area, NuSTAR opti-cal engineers created many nested cones of mirrors.
Points Focusing X-rays
4Students are able to accurately measure, calculate, and draw angles of incidence and reflection. They are able to construct multiple mirror setups and analyze their effectiveness. They successfully apply their knowledge of multiple reflections to NuSTAR.
3Students are mostly able to measure, calculate, and draw angles of incidence and reflection. They are able to construct multiple mirror setups and may be able to analyze their effectiveness. They can apply their knowledge of multiple reflections to NuSTAR.
2Students can somewhat measure, calculate, and draw angles of incidence and reflection. They are able to construct multiple mirror setups. They may be able to apply their knowledge of multiple reflections to NuSTAR.
1Students have difficulty measuring, calculating, and drawing angles of incidence and reflection. They are able to construct at least one mirror setup. They may have difficulty applying their knowledge of multiple reflections to NuSTAR.
0 Students are not able to provide correct responses to any of the required elements.
6. Cut a notch in the shoebox that lines up with the laser symbol on the graph paper.
7. Place three dot stickers at the numbered locations indicated on the graph paper.
Bonus: Each shoebox is a handy storage place for group supplies (mirrors, protractor, ruler, laser, etc.)
Assessment:

15
Group name: Members name:
Student HandoutFocusing X-rays
In this activity you will master reflections. Scientists and engineers developing telescopes like NuSTAR must overcome a unique problem; X-rays pass directly through most mirrors!
X-ray photons are so energetic that the only way to reflect them with a mirror is to catch them at a grazing angle, much like skipping rocks across a pond.
Imagine you were to throw a rock straight into a pond. Your throw, combined with the weight of the rock, gives it enough energy that it passes right through the surface and sinks. Next imagine taking the same rock and tossing it at a shallow angle toward the water. With less energy directed down into the water and more energy directed along the surface, it has a chance to bounce, or skip, along the surface of the pond. If the pond were filled with a much denser material (e.g., corn syrup) you may be able to skip it at slightly steeper angles.
Since working with real X-rays would be difficult (and dangerous), you will instead practice with optical lasers. Remember to practice good laser safety!
Warning, optical lasers can harm your eyes. NEVER look into the laser. Be aware of where the beam is aimed at all times. Only turn the laser on when it is aimed in a safe direction, away from people.
Fig.1 Skipping stones
Fig. 2 Grazing angle of X-rays on mirror

16
Fig. 3 Incident light rays interact with a reflective surface in a predict-able way. The angle of incidence is always equal to the angle of reflection.
A. Investigation
Light behaves in predictable ways when interacting with mirrors. The law of reflection states that the angle of incidence of light interacting with a reflective surface is equal to the angle of reflection where each of these angles is measured from an imaginary “normal” line perpendicular to the surface.
Let’s practice drawing and measuring reflections.
Constructing reflections1. Draw the normal line for each mirror2. Measure and label the angle of incidence3. Draw the reflected ray and label the angle of reflection4. Test each sketch with a small mirror and laser pointer
Questions
1. How are the angle of incidence and angle of reflec-tion related?
2. In the special case of a plane (or flat) mirror, there is also a relationship between the angles of the light beam and the surface of the mirror. You may find it easier to measure these instead of the angles of incidence and reflection. Measure and label those angles in each of the four diagrams. The angles are called complementary angles.
How are the complementary angles of incidence and reflection related?
3. Were there any difficulties in setting up your mirror and laser to test your drawings? If so, list them here.
17
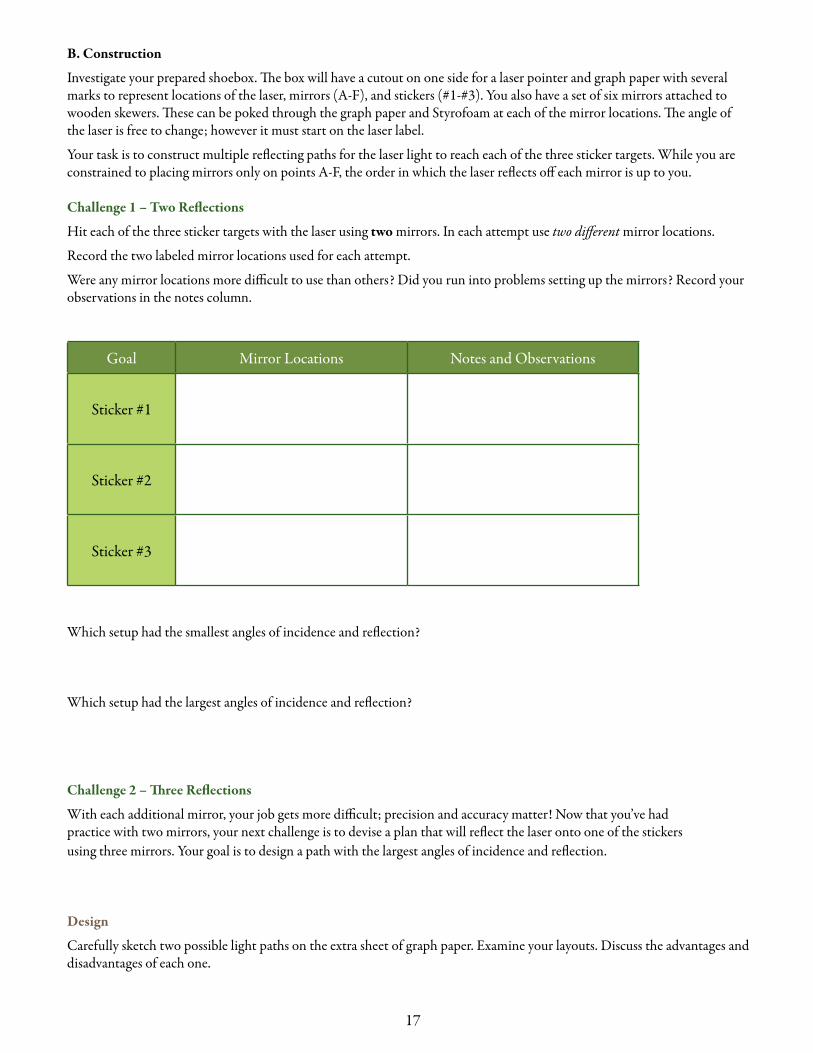
Which setup had the smallest angles of incidence and reflection?
Which setup had the largest angles of incidence and reflection?
Challenge 2 – Three Reflections
With each additional mirror, your job gets more difficult; precision and accuracy matter! Now that you’ve had practice with two mirrors, your next challenge is to devise a plan that will reflect the laser onto one of the stickers using three mirrors. Your goal is to design a path with the largest angles of incidence and reflection.
B. Construction
Investigate your prepared shoebox. The box will have a cutout on one side for a laser pointer and graph paper with several marks to represent locations of the laser, mirrors (A-F), and stickers (#1-#3). You also have a set of six mirrors attached to wooden skewers. These can be poked through the graph paper and Styrofoam at each of the mirror locations. The angle of the laser is free to change; however it must start on the laser label.
Your task is to construct multiple reflecting paths for the laser light to reach each of the three sticker targets. While you are constrained to placing mirrors only on points A-F, the order in which the laser reflects off each mirror is up to you.
Challenge 1 – Two Reflections
Hit each of the three sticker targets with the laser using two mirrors. In each attempt use two different mirror locations.
Record the two labeled mirror locations used for each attempt.
Were any mirror locations more difficult to use than others? Did you run into problems setting up the mirrors? Record your observations in the notes column.
Goal Mirror Locations Notes and Observations
Sticker #1
Sticker #2
Sticker #3
Design
Carefully sketch two possible light paths on the extra sheet of graph paper. Examine your layouts. Discuss the advantages and disadvantages of each one.

18
Attempt Success? Yes/No Adjustment Notes
#1
#2
#3
Set up 1 - Mirror locations Set up 2 - Mirror locations
Advantages for Set up 1 Advantages for Set up 2
Disadvantages for Set up 1 Disadvantages for Set up 2
Which setup is most promising?
When you add the angle of incidence and angle of reflection together you get the total angle between the incoming and re-flected ray. Measure this full angle for each reflection in your chosen setup. From these determine the angles of incidence and reflection for each.
Mirror Location Total angle Angle of incidence Angle of reflection
Use this information to draw the angle you should place each mirror.
Implementation
Without turning on the laser, place the mirrors according to your plan. Use your notes and observations from the first chal-lenge to refine your mirror placement.
You now have three chances to hit sticker #3 with the laser pointer. When you are ready, call your teacher over for each test. Record your observations and adjustment notes for each attempt.

19
Challenge 3 – Six Reflections (optional)
Now for the big one! Use all six mirrors to reflect the laser light onto sticker #3.
Leaving the laser on for this one, try to maximize the angles of incidence and reflection. Remember, X-rays must hit mirrors at grazing angles and in this experiment you are trying to model X-ray properties using visible laser light.
Reflect on your final design. Use a separate sheet of paper to write a summary paragraph about your six-mirror design.
C. Applications to NuSTAR
Imagine you were shining a wider 1-inch beam laser on a small mirror like those in the previous challenge. You are aiming di-rectly at the center of a 1-inch mirror.
1. What is the angle of incidence when the laser beam hits the mirror face on?
2. How much of the 1-inch beam would hit the 1-inch mirror if it were face on?
3. If the 1-inch mirror is at an angle of 45 degrees how much light would hit it? All of it, about half, more than half, or less than half ?
4. Describe the relationship between the angle of incidence and how much light hits the mirror
5. The specialized Wolter-I mirrors in NuSTAR reflect X-rays at grazing angles, once off an upper set of mirrors and once off a lower set. This diagram depicts the layout of these consecutive shells of mirrors. The actual mirror sets contain 133 shells in each section. Based on your answers to the previous questions, what is the benefit of having so many nested mirrors?
Fig.4 NuSTAR’s telescope consists of two sections of nested mirrors. X-rays reflect off one mirror in each section in order to focus.

20
Focusing Graph Paper
21
Background Information
Essential to the NuSTAR design is a deployable mast that extends to 10 meters (30 feet) after launch. This mast separates the NuSTAR X-ray optics from the detectors, a necessity to achieve the long focal length required by the optics design. Using a deployable structure allowed NuSTAR to launch on a Pegasus XL rocket, one of the smaller launch vehicles available. The size of the vehicle required the folded mast to be no more than two meters long and one meter in diameter.
Lesson2 Building a Stable Mast Duration: 1 - 2 hours
Getting Started
1. Gather building materials over several weeks by asking students to bring in empty toilet paper and paper towel rolls. Divide all materials evenly amongst groups.
2. Cut the foam board into 4 equal pieces. Each piece will serve as the building platform for one group.3. Ensure you can read the scale with a piece of foam board on top.4. Split your class into groups of 3 or 4 students each.
Procedure:
1. Introduce the activity by using information in the NuSTAR Introduction section and in the activity Background Information.
2. Pose the question: “How do engineers design equipment under stringent constraints?”3. Pass out the Student Worksheet.4. Introduce the materials provided and reiterate the constraints and goal of today’s construction project.
Materials for each team of 2 or 3 students:
• Scale – must be capable of measuring weights less than 5 pounds. A food scale is recommended.
• Foam board – one 22” × 28” sheet per four groups• Hardcover textbook (~2 kg)– preferably the same book for
each group• Assorted building materials*• Student Handout
Essential Question:
How do engineers design equipment under stringent constraints ?
Objectives:
Design, test, and build a lightweight mast 1 meter tall that can fully support the weight of a typical hardcover textbook (~2 kg). The footprint of the mast must be no larger than 11” ×14 ” (This is the size of a typical poster board cut in 4 pieces).
Science Concepts
• With good engineering design, lightweight materials can be used to support a heavy object• Understanding constraints is an important part of the design process• Engineers devise creative and practical solutions to complicated problems by building, testing, evaluating, and revising designs
* Here are some suggestions:• Drinking straws (various lengths and diameters)• Empty paper towel rolls• Empty toilet paper rolls• Wire (various gauges)• Toothpicks• Popsicle sticks or tongue depressors• Dried pasta (spaghetti, linguini, manicotti, etc.)• Construction paper• Tape (various types)• Glue (various types)

22
Points Building a Stable Mast
4
Students put effort into testing various material combinations and building techniques. They provide a thoughtful discussion of building strategies and draw a detailed diagram of the design plan. The mast prototype fits within the design constraints and is successful at supporting the book. The reflection identifies areas for improvement.
3
Students test at least two material combinations and building techniques. They provide a discussion of building strategies and draw a diagram of the design plan. The mast prototype fits within the design constraints and is successful at supporting the book. The reflection may identify areas for improvement.
2
Students test at least one material combination and building technique. They draw a diagram of the design plan. The mast prototype may fit within some of the design constraints and may be successful at supporting the book. The reflection may identify areas for improvement.
1
Students test at least one material combination and building technique. They draw a diagram of the design plan. The mast prototype does not fit within the design constraints and may be successful at supporting the book. The reflection may identify areas for improvement.
0 Students are not able to test, analyze, or construct a structure with the supplied materials. The reflection is missing.
Assessment:
Fig.1 and 2 Examples of structures that are similar to the NuSTAR mast.
Fig.1 (left): The Shukhov radio tower, also known as the Shabolovka tower, is a broadcasting tower in Moscow designed by Vladimir Shukhov. The 160-meter-high free-standing steel diagrid structure was built in the period 1920–1922, during the Russian Civil War.
Fig.2 (right): A stable mast created using popsicle sticks and masking tape

23
Student Handout
Group: Members:
Welcome future engineers! X-ray telescopes are inherently long to accommodate the large distances between the optics and detectors. When NuSTAR was being designed, scientists had to figure out how to create a rigid 10-meter mast for the optics that could fold up into a small 2-meter by 1-meter box during launch.
Finding the optimal solution took years of research and development. Today you will mirror that effort in a building competition.
Your task is to engineer a lightweight, rigid mast that will support a hardcover textbook one meter off the ground. The winning group is that with the lightest and strongest structure.
A. Investigation
A strong design requires knowledge of the limitations of your materials and constraints of the posed problem.
Constraints:
Size: the footprint of this mast must fit within an 11” × 14” piece of foam board and must be at least one meter tall.
Budget & Materials: Each group is limited to the materials provided. No replacements will be provided for damages as a result of testing or building.
Weight: The mast itself must be no more than 2 kg.
Material tests
Take at least 2 combinations of the approved materials and test their stability by seeing how well they support a text-book when built 1 and 2 layers tall.
Materials Combination #1:
Observations:
Materials Combination #2:
Observations:
Building a Stable Mast
24
Discuss ideas and strategies that might be helpful when building your full mast. In the space below, jot down each idea and strategy and/or sketch each idea suggested. Remember to be open to creative ideas. No idea is silly at the brainstorm-ing stage of the process.
Select the most promising concept and draw a detailed diagram of your design plan. Based upon the data you collected in Step #2, make predictions about how far the mast tower might stray from vertical when the textbook is placed upon it.
B. Construction
Build your mast prototype. With the help of your teacher, verify that your structure weighs no more than 2 kg. Test your mast structure by placing it upright and placing the textbook on top.
C. Reflection
Reflect upon your design and how well it worked. Write a summary paragraph to suggest improvement. What changes could be made to increase stability? If your mast structure was very successful at supporting the textbook, how might you change your design to be more lightweight without losing stability?

25
Brief Overview:
Students read and analyze four different articles about NuSTAR discoveries regarding black holes. This is a science literacy extension.
Background information:
NuSTAR is the first focusing high-energy X-ray satellite in orbit, and its sensitivity is over 100 times greater than previous X-ray missions sensitivity compared to previous X-ray missions working in the same energy bands. One of NuSTAR’s primary science goals is to study black holes throughout the cosmos.
Black holes are the natural result of stellar evolution for stars at least 8 times more massive than our own Sun. When a massive star explodes as a supernova, the inner core collapses down to an incredibly dense state. With so much mass in a tiny region, the force of gravity is so strong that not even light can escape. In contrast with the vast darkness of black holes, the region surrounding them can be unbelievably bright and energetic. As matter falls towards the black hole, a swirling disk forms. Friction and other effects causes the disk to heat up to tens of millions of degrees; a perfect source for X-rays! Black holes that result from supernova explosions range from 3 to 30 times more massive than our Sun, and are referred to as “stellar-mass” black holes.
At the cores of galaxies lie supermassive black holes millions or even billions of times the mass of our Sun. Although our own Milky Way Galaxy has a central supermassive black hole, it is usually dormant (i.e., not actively “eating” and emitting copious numbers of X-rays), as are the black holes in most present-day galaxies. An active topic in current research is the question “Which came first, the galaxy or its central black hole?” Recent studies suggest that they coevolved, but additional observations and evidence are needed to settle the question.
Ultra-luminous X-ray sources (ULXs) may represent a class of intermediate mass black holes, with masses ranging from 100 – 10,000 times that of our Sun. The X-ray emitting object is in a binary system with a normal companion star, and feeds off its gas. However, the X-ray emission seen from ULXs is much brighter than that typically seen from stellar-mass black holes, and is difficult to explain without invoking a more massive X-ray emitter.
Materials:
• Four articles on p. 27-30• Student Handout
Procedure:
Have your students read the four articles on p. 27-30 individually in class or send them home as homework. When they are done, they should answer the questions in the student handout. Gather the students into small groups in class for further discussion and a summative group presentation.
Lesson 3 Black Holes in the News Duration: 1 hour
Essential Questions: • What are the masses of the black holes that have been studied by NuSTAR?• How are X-ray observations used to determine a black hole’s “feeding rate”?
Objectives: Students will… • Read and analyze four different articles about NuSTAR black hole discoveries• Get a better understanding of black holes, their masses and their X-ray emissions
Science Concepts:• Black holes come in at least two different sizes: stellar-mass and super-massive• Black holes emit X-rays when they “feed”’ on nearby gas

26
Answers
Summaries:
NASA’s NuSTAR Spots Flare From Milky Way’s Black Hole: This article describes observations of a two-day long flare seen from the 4-million solar mass black hole at the center of our Milky Way galaxy.
Black Hole Naps Amidst Stellar Chaos: This article describes observations of a 5-million solar mass black hole at the center of the Sculptor galaxy (also known as NGC 253). Although it produced a lot of X-rays in the past, when NuSTAR observed it in 2012, it was dormant. This was surprising because the galaxy’s center has many stars that are forming and exploding, which should provide “food” for the black hole. Even though it did not see any X-rays from the monstrous central black hole, NuSTAR saw X-rays from a smaller bright black hole nearby, called a “ULX” or ultra-luminous X-ray source.
Do Black Holes Come in Size Medium? This article describes observations of ULXs in two different galaxies. The ULX in the Circinus galaxy weighs in at around 100 solar-masses. The Topsy Turvy galaxy (NGC 1313) has two ULXs: one is 70-100 solar masses and the other is only about 30 solar-masses (and may therefore be a typical stellar-mass black hole).
NASA’s NuSTAR Telescope Discovers Shockingly Bright Dead Star: This article describes the discovery of the brightest pulsar ever recorded. This finding helps astronomers better understand ultra-luminous X-ray sources. Until this discovery, all ULXs were thought to be black holes. ULXs may be the missing link between stellar sized black holes and the supermassive black holes in the centers of galaxies. This discovery could not have been made without the high-energy capabilities of NuSTAR and the ability to precisely measure timing of the signals.
People and Science:
NASA’s NuSTAR Spots Flare From Milky Way’s Black Hole: The observations were made by NuSTAR and reported by Principal Investigator Fiona Harrison (Caltech) and team member Charles Hailey (Columbia University).
Black Hole Naps Amidst Stellar Chaos: The NuSTAR observations were led by Bret Lehmer of the Johns Hopkins University, Baltimore, and NASA’s Goddard Space Flight Center, Greenbelt, Md. These observations were following up on a decade-old study done with the Chandra X-ray Observatory (at lower X-ray energies). Other quoted co-authors are Ann Hornschemeier (NASA Goddard) and Daniel Stern (Caltech).
Do Black Holes Come in Size Medium? Dominic Walton (Caltech) conducted new observations with NuSTAR, as well as XMM-Newton, and also used archival data from Chandra, Swift, Spitzer and Suzaku satellites. A second study was led by Matteo Bachetti of the Institut de Recherche en Astrophysique et Planétologie, using NuSTAR.
NASA’s NuSTAR Telescope Discovers Shockingly Bright Dead Star: The observations were made by NuSTAR and reported by Principal Investigator Fiona Harrison (Caltech) and Matteo Bachetti, of the University of Toulouse in France.
Compare and Contrast:
Supermassive black holes live in the cores of galaxies and have masses ranging from millions to billions times that of our Sun. ULXs have masses from 30 – 10,000 solar masses and are distributed randomly within galaxies, although some may be near (but not at) the galaxy’s center. Intense X-ray emis-sion occurs when black holes of any size feed on gas. For the central black hole, the source of gas is not constant, and flares occur when the black holes are feeding. For ULXs, the gas comes from companion stars, which provides a more reliable supply. In the most recent article, NuSTAR has discovered that an object that was previously thought to be a medium-sized black hole is really a neutron star pulsar that is unusually bright.
Predict:
NuSTAR will see flares from supermassive black holes if it continues to monitor our Milky Way galaxy’s center as well as other galaxies. NuSTAR will continue to discover additional ULXs and will provide information that can be used to determine if they are really “medium-sized” black holes.
Points Black Holes in the News
4
Students are able to accurately summarize each article, determine the people and instruments who contributed to each study, and to compare and contrast the masses and feeding rates measured for the different black holes. They are also able to make reasonable predictions as to further investigations. Students effectively communicate their findings in a group presentation.
3Students are able to accurately summarize each article, determine the people and instruments who contributed to each study, and to compare and contrast the masses and feeding rates measured for the different black holes. Students effectively communicate their findings in a group presentation.
2 Students are able to do any two of the three required elements described above. Students effectively communicate their findings in a group presentation.
1 Students are able to do any one of the required elements. Students effectively communicate their findings in a group presentation.
0 Students are not able to provide correct responses to any of the required elements. Students cannot communicate their findings in a group presentation.
Assessment

27
Article 1: October 23, 2012
NASA’s NuSTAR Spots Flare From Milky Way’s Black Hole
PASADENA, Calif. - NASA’s newest set of X-ray eyes in the sky, the Nuclear Spectroscopic Telescope Array (NuSTAR), has caught its first look at the giant black hole parked at the center of our galaxy. The observa-tions show the typically mild-mannered black hole during the middle of a flare-up.
“We got lucky to have captured an outburst from the black hole during our observing campaign,” said Fiona Harrison, the mission’s principal investigator at the California Institute of Technology (Caltech) in Pasadena. “These data will help us better under-stand the gentle giant at the heart of our galaxy and why it sometimes flares up for a few hours and then returns to slumber.”
NuSTAR, launched June 13, is the only telescope ca-pable of producing focused images of the highest-energy X-rays. For two days in July, the telescope teamed up with other observatories to observe Sag-ittarius A* (pronounced Sagittarius A-star and ab-breviated Sgr A*), the name astronomers give to a compact radio source at the center of the Milky Way. Observations show a massive black hole lies at this location, weighing in at about four millions times the mass of our Sun. Participating telescopes included NASA’s Chandra X-ray Observatory, which sees lower-energy X-ray light; and the W.M. Keck Observatory atop Mauna Kea in Hawaii, which took infrared im-ages.
Compared to giant black holes at the centers of other galaxies, Sgr A* is relatively quiet. Active black holes tend to gobble up stars and other fuel around them. Sgr A* is thought only to nibble or not eat at all, a pro-cess that is not fully understood. When black holes consume fuel - whether a star, a gas cloud or, as re-cent Chandra observations have suggested, even an asteroid - they erupt with extra energy.
In the case of NuSTAR, its state-of-the-art telescope is picking up X-rays emitted by consumed matter being heated up to about 180 million degrees Fahrenheit (100 million degrees Celsius) and originating from regions where particles are boosted very close to the speed of light. Astronomers say these NuSTAR data, when combined with the simultaneous observations taken at other wavelengths, will help them better un-derstand the physics of how black holes snack and grow in size.
“Astronomers have long speculated that the black hole’s snacking should produce copious hard X-rays, but NuSTAR is the first telescope with sufficient sen-sitivity to actually detect them,” said NuSTAR team member Chuck Hailey of Columbia University in New York City.
X-ray images of the Milky Way’s black hole. Credit: NASA/JPL-Caltech
NASA’s Nuclear Spectroscopic Telescope Array, or NuSTAR, has captured these first, focused views of the supermassive black hole at the heart of our galaxy in high-energy X-ray light. This is the location of our Milky Way’s humongous black hole, called Sagittarius A*, or Sgr A* for short. NuSTAR is the first telescope to be able to focus high-energy X-rays, giving astronomers a new tool for probing extreme objects such as black holes.
This time series shows a flare caught by NuSTAR over an observing period of two days in July 2012; the middle panel shows the peak of the flare, when the black hole was consuming and heating matter to temperatures up to 180 million degrees Fahrenheit (100 million degrees Celsius). The images show light with energies of 3 to 30 keV.

28
Article 2: June 11, 2013
Black Hole Naps Amidst Stellar Chaos
Nearly a decade ago, NASA’s Chandra X-ray Observatory caught signs of what appeared to be a black hole snacking on gas at the middle of the nearby Sculptor galaxy. Now, NASA’s Nuclear Spectroscopic Telescope Array (NuSTAR), which sees higher-energy X-ray light, has taken a peek and found the black hole asleep.
“Our results imply that the black hole went dormant in the past 10 years,” said Bret Lehmer of the Johns Hopkins University, Baltimore, and NASA’s Goddard Space Flight Center, Greenbelt, Md. “Periodic observations with both Chandra and NuSTAR should tell us unambiguously if the black hole wakes up again. If this happens in the next few years, we hope to be watching.” Lehmer is lead author of a new study detailing the findings in the Astrophysical Journal.
The slumbering black hole is about 5 million times the mass of our sun. It lies at the center of the Sculptor galaxy, also known as NGC 253, a so-called starburst galaxy actively giving birth to new stars. At 13 million light-years away, this is one of the closest starbursts to our own galaxy, the Milky Way.
The Milky Way is all around more quiet than the Sculptor galaxy. It makes far fewer new stars, and its behemoth black hole, about 4 million times the mass of our sun, is also snoozing.
“Black holes feed off surrounding accretion disks of material. When they run out of this fuel, they go dormant,” said co-author Ann Hornschemeier of Goddard. “NGC 253 is somewhat unusual because the giant black hole is asleep in the midst of tremendous star-forming activity all around it.”
The findings are teaching astronomers how galaxies grow over time. Nearly all galaxies are suspected to harbor supermassive black holes at their hearts. In the most massive of these, the black holes are thought to grow at the same rate that new stars form, until blasting radiation from the black holes ultimately shuts down star formation. In the case of the Sculptor galaxy, astronomers do not know if star formation is winding down or ramping up.
“Black hole growth and star formation often go hand-in-hand in distant galaxies,” said Daniel Stern, a co-author and NuSTAR project scientist at NASA’s Jet Propulsion Laboratory, Pasadena, Calif. “It’s a bit surprising as to what’s going on here, but we’ve got two powerful complementary X-ray telescopes on the case.”
Chandra first observed signs of what appeared to be a feeding supermassive black hole at the heart of the Sculptor galaxy in 2003. As material spirals into a black hole, it heats up to tens of millions of degrees and glows in X-ray light that telescopes like Chandra and NuSTAR can see.
The Sculptor galaxy - Credit: NASA/JPL-Caltech
The Sculptor galaxy is seen in a new light, in this composite image from NASA’s Nuclear Spectroscopic Telescope Array (NuSTAR). The NuSTAR data, which appear as colored blobs, show high-energy X-rays. The NuSTAR observations are the sharpest ever taken of this galaxy in high-energy X-rays.
The NuSTAR data also reveals a flaring source of high-energy X-rays, called an ultraluminous X-ray source, or ULX. This object, which appears as a blue spot near the hotter, central region of the galaxy, is most likely an intermediate mass black hole feeding off a partner star. The flare is thought to be the result of a change in the object’s feeding patterns.
The other orange and reddish points are likely additional X-ray-generating pairs of stars located throughout the galaxy.
In this image, red shows low-energy X-ray radiation (3 to 7 kiloelectron volts), green is medium energy (7 to 10 kiloelectron volts), and blue is high energy (10 to 20 kiloelectron volts).

29
Article 3: November 26, 2013
Do Black Holes Come in Size Medium?
Black holes can be petite, with masses only about 10 times that of our sun -- or monstrous, boasting the equivalent in mass up to 10 billion suns. Do black holes also come in size medium? NASA’s Nuclear Spectroscopic Telescope Array, or NuSTAR, is busy scrutinizing a class of black holes that may fall into the proposed medium-sized category.
“Exactly how intermediate-sized black holes would form remains an open issue,” said Dominic Walton of the California Institute of Technology, Pasadena. “Some theories suggest they could form in rich, dense clusters of stars through repeated mergers, but there are a lot of questions left to be answered.”
The largest black holes, referred to as supermassive, dominate the hearts of galaxies. The immense gravity of these black holes drags material toward them, forcing the material to heat up and release powerful X-rays. Small black holes dot the rest of the galactic landscape. They form under the crush of collapsing, dying stars bigger than our sun.
Evidence for medium-sized black holes lying somewhere between these two extremes might come from objects called ultraluminous X-ray sources, or ULXs. These are pairs of objects in which a black hole ravenously feeds off a normal star. The feeding process is somewhat similar to what happens around supermassive black holes, but isn’t as big and messy. In addition, ULXs are located throughout galaxies, not at the cores.
The bright glow of X-rays coming from ULXs is too great to be the product of typical small black holes. This and other evidence indicates the objects may
Washington. “Now, we can get all sides of the story.”
The observations also revealed a smaller, flaring object that the researchers were able to identify as an “ultraluminous X-ray source,” or ULX. ULXs are black holes feeding off material from a partner star. They shine more brightly than typical stellar-mass black holes generated from dying stars, but are fainter and more randomly distributed than the supermassive black holes at the centers of massive galaxies. Because of their brightness and locations within galaxies, ULXs are often referred to as “intermediate” sized black holes.
If and when the Sculptor’s slumbering giant does wake up in the next few years amidst all the commotion, NuSTAR and Chandra will monitor the situation. The team plans to check back on the system periodically.
be intermediate in mass, with 100 to 10,000 times the mass of our sun. Alternatively, an explanation may lie in some kind of exotic phenomenon involving extreme accretion, or “feeding,” of a black hole.
NuSTAR is joining with other telescopes to take a closer look at ULXs. It’s providing the first look at these objects in focused, high-energy X-rays, helping to get better estimates of their masses and other characteristics.
In a new paper from Walton and colleagues accepted for publication in the Astrophysical Journal, the astronomers report serendipitously finding a ULX that had gone largely unnoticed before. They studied the object, which lies in the Circinus spiral galaxy 13 million light-years away, not only with NuSTAR but also with the European Space Agency’s XMM-Newton satellite. Archival data from NASA’s Chandra, Swift and Spitzer space telescopes as well as Japan’s Suzaku satellite, were also used for further studies. “We went to town on this object, looking at a range of epochs and wavelengths,” said Walton.
The results indicate the black hole in question is about 100 times the mass of the sun, putting it right at the border between small and medium black holes.
In another accepted Astrophysical Journal paper, Matteo Bachetti of the Institut de Recherche en Astrophysique et Planétologie and colleagues looked at two ULXs in NGC 1313, a spiral galaxy known as the “Topsy Turvy galaxy,” also about 13 million light-years way.
These are among the best-studied ULXs known. A single viewing with NuSTAR showed that the black holes didn’t fit with models of medium-size black holes. As a
Then, in September and November of 2012, Chandra and NuSTAR observed the same region simultaneously. The NuSTAR observations -- the first-ever to detect focused, high-energy X-ray light from the region -- allowed the researchers to say conclusively that the black hole is not accreting material. NuSTAR launched into space in June of 2012.
In other words, the black hole seems to have fallen asleep. Another possibility is that the black hole was not actually awake 10 years ago, and Chandra observed a different source of X-rays. Future observations with both telescopes may solve the puzzle.
“The combination of coordinated Chandra and NuSTAR observations is extremely powerful for answering questions like this,” said Lou Kaluzienski, NuSTAR Program Scientist at NASA Headquarters in

30
result, the researchers now think both ULXs harbor small, stellar-mass black holes. One of the objects is estimated to be big for its size category, at 70 to 100 solar masses, while the other is only about 30 solar masses.
“It’s possible that these objects are ultraluminous because they are accreting material at a high rate and not because of their size,” said Bachetti. “If intermediate-mass black holes are out there, they are doing a good job of hiding from us.”
The magenta spots in this image show two black holes in the spiral galaxy called NGC 1313, or the Topsy Turvy galaxy. Both black holes belong to a class called ultraluminous X-ray sources, or ULXs. The magenta X-ray data come from NASA’s Nuclear Spectroscopic Telescopic Array, and are overlaid on a visible image from the Digitized Sky Survey.
ULXs consist of black holes actively accreting, or feeding, off material drawn in from a partner star. Astronomers are trying to figure out why ULXs shine so brightly with X-rays.
NuSTAR’s new high-energy X-ray data on NGC 1313 helped narrow down the masses of the black holes in the ULXs: the black hole closer to the center of the galaxy is about 70 to 100 times that of our sun. The other black hole is probably smaller, about 30 solar masses. NGC 1313 - Credit: NASA/JPL-Caltech
NGC 1313 - Credit: NASA/JPL-Caltech
Article 4: October 8, 2014
NASA’s NuSTAR Telescope Discovers Shockingly Bright Dead Star
Astronomers have found a pulsating, dead star beaming with the energy of about 10 million suns. This is the brightest pulsar - a dense stellar remnant left over from a supernova explosion - ever recorded. The discovery was made with NASA’s Nuclear Spectroscopic Telescope Array, or NuSTAR.
“You might think of this pulsar as the ‘Mighty Mouse’ of stellar remnants,” said Fiona Harrison, the NuSTAR principal investigator at the California Institute of Technology in Pasadena. “It has all the power of a black hole, but with much less mass.”
The discovery appears in a new report in the Thursday, Oct. 9, issue of the journal Nature.
The surprising find is helping astronomers better understand mysterious sources of blinding X-rays, called ultraluminous X-ray sources (ULXs). Until now, all ULXs were thought to be black holes. The new data from NuSTAR show at least one ULX, about 12 million light-years away in the galaxy Messier 82 (M82), is actually a pulsar.
“The pulsar appears to be eating the equivalent of a black hole diet,” said Harrison. “This result will help us understand how black holes gorge and grow so quickly, which is an important event in the formation of galaxies and structures in the universe.”
ULXs are generally thought to be black holes feeding off companion stars -- a process called accretion. They also are suspected to be the long-sought-after “medium-size” black holes - missing links between smaller, stellar-size black holes and the gargantuan ones that dominate the hearts of most galaxies. But research into the true nature of ULXs continues toward more definitive answers.
NuSTAR did not initially set out to study the two ULXs in M82. Astronomers had been observing a recent supernova in the galaxy when they serendipitously noticed pulses of bright X-rays coming from the ULX known as M82 X-2. Black holes do not pulse, but pulsars do.

31
Pulsars belong to a class of stars called neutron stars. Like black holes, neutron stars are the burnt-out cores of exploded stars, but puny in mass by comparison. Pulsars send out beams of radiation ranging from radio waves to ultra-high-energy gamma rays. As the star spins, these beams intercept Earth like lighthouse beacons, producing a pulsed signal.
“We took it for granted that the powerful ULXs must be massive black holes,” said lead study author Matteo Bachetti, of the University of Toulouse in France. “When we first saw the pulsations in the data, we thought they must be from another source.”
NASA’s Chandra X-ray Observatory and Swift satellite also have monitored M82 to study the same supernova, and confirmed the intense X-rays of M82 X-2 were coming from a pulsar.
“Having a diverse array of telescopes in space means that they can help each other out,” said Paul Hertz, director of NASA’s astrophysics division in Washington. “When one telescope makes a discovery, others with complementary capabilities can be called in to investigate it at different wavelengths.”
The key to NuSTAR’s discovery was its sensitivity to high-energy X-rays, as well as its ability to precisely measure the timing of the signals, which allowed astronomers to measure a pulse rate of 1.37 seconds. They also measured its energy output at the equivalent of 10 million suns, or 10 times more than that observed from other X-ray pulsars. This is a big punch for something about the mass of our sun and the size of Pasadena.
How is this puny, dead star radiating so fiercely? Astronomers are not sure, but they say it is likely due to a lavish feast of the cosmic kind. As is the case with black holes, the gravity of a neutron star can pull matter off companion stars. As the matter is dragged onto the neutron star, it heats up and glows with X-rays. If the pulsar is indeed feeding off surrounding matter, it is doing so at such an extreme rate as to have theorists scratching their heads.
Astronomers are planning follow-up observations with NASA’s NuSTAR, Swift and Chandra spacecraft to find an explanation for the pulsar’s bizarre behavior. The NuSTAR team also will look at more ULXs, meaning they could turn up more pulsars. At this point, it is not clear whether M82 X-2 is an oddball or whether more ULXs beat with the pulse of dead stars. NuSTAR, a relatively small telescope, has thrown a big loop into the mystery of black holes.
“In the news recently, we have seen that another source of unusually bright X-rays in the M82 galaxy seems to be a medium-sized black hole,” said astronomer Jeanette Gladstone of the University of Alberta, Canada, who is not affiliated with the study. “Now, we find that the second source of bright X-rays in M82 isn’t a black hole at all. This is going to challenge theorists and pave the way for a new understanding of the diversity of these fascinating objects.”
In this image, twin beacons of light are emitted from the magnetic poles of a neutron star as it accretes gas. As the star rotates, the two X-ray hot spots behave like a lamp in a lighthouse, sweeping around. Only when the “lamps” are facing Earth are pulsations seen by NuSTAR. Credit: NASA/JPL-Caltech

32
Student HandoutBlack Holes in the News
Directions:
Read the articles provided and as a group answer the questions below on a separate sheet of paper. After you are done reading the articles, and answering the questions, get into small discussion groups as assigned by your teacher. Discuss your individual responses to the questions. Choose one person in the group to record this discussion and choose another person to report back to the class. Together, design a short presentation for the class. You will have 5 minutes for your presentation. Be creative!
Summarize:
Using your own words, summarize the information in each article. Don’t forget to include the science topics dis-cussed and why scientists are interested in these topics. Try to answer (at least) these two essential questions:• What are the masses of the black holes that have been studied by NuSTAR?• How are X-ray observations used to determine a black hole’s “feeding rate”?• How has our view of black holes changed as a result of NuSTAR’s observations?
People and Science:
Who are the scientists that did the work discussed in each article? What satellites did they use?
Compare and contrast:
What is the difference in the masses of the black holes discussed in the different articles? Where are the black holes located in the galaxies? What is the strength of the X-ray emission seen from the black holes?
Predict:
What other types of measurements do you think scientists will try to make? Do you have any predictions as to what they might see if they continue to observe these black holes?

33
Background Information
Medical X-ray imaging relies on the penetrating nature of high-energy photons. X-rays pass through soft tissue relatively easily but are blocked by bones and other dense structures. The images you see at the doctor or dentist office is actually an X-ray shadow cast by your body.
For medical purposes, X-rays are created in vacuum tubes. A high voltage accelerates electrons toward a metal target. The resulting collision releases X-rays, mostly due to bremsstrahlung (see page 12).
German physicist Wilhelm Röntgen is typically credited with discovering X-rays and their medical imaging potential in 1895. While experimenting with recently invented cathode ray tubes he, along with several contemporary physicists, noticed nearby photographic plates could be destroyed. Wilhelm took this X-ray of his wife’s hand on December 22, 1895.
In the time since this discovery, scientists have refined medical imaging techniques and measured the dangers of radiation. Two common forms of X-ray imaging are radiography and computerized tomography (CT).
Radiography involves casting an X-ray shadow onto a photographic film or digital detector. Fully exposed film is black. Areas where dense objects like bone block the light are white. Soft tissues like muscle and fat only partially block the X-ray photons resulting in shades of gray. While doctors can get high spatial resolution with radiography (you can scan an entire chest at once) and it is fast an inexpensive, doctors don’t get any sense of depth from the image and it is difficult to distinguish between similar tissue types.
Computerized tomography (CT) scans involve an X-ray source and detector, which rotate around the body of a patient. A computer collects these data to form slices and 3-dimensional images. The X-ray dose for CT scans is higher than that of radiographs but the contrast and resolution are much higher.
Lesson 4 Medical X-rays Duration: 1 hour
Essential Questions: What are the different technologies used for medical X-rays?
Objectives: • Read and analyze two different articles about medical X-rays technologies• Get a better understanding of how X-rays are created and detected in medical applications
Science Concepts: • Certain forms of medical imaging rely on the penetrating power of X-rays that pass directly through tissue. • The radiation from medical X-rays can be damaging and must be limited.• Radiography and computerized tomography each have advantages and disadvantages for diagnosing medical conditions trading off radiation exposure with image quality.
Fig.1 An X-ray of Wilhelm Röntgen’s wife’s hand taken December 22nd, 1895 Fig. 2 This X-ray of an ankle shows how X-rays pass through tissue of different densities. Soft tissues including skin, muscle, and fat show up as light gray shad-ows while bones show up as bright white shadows. Areas where X-rays hit the film directly are black.
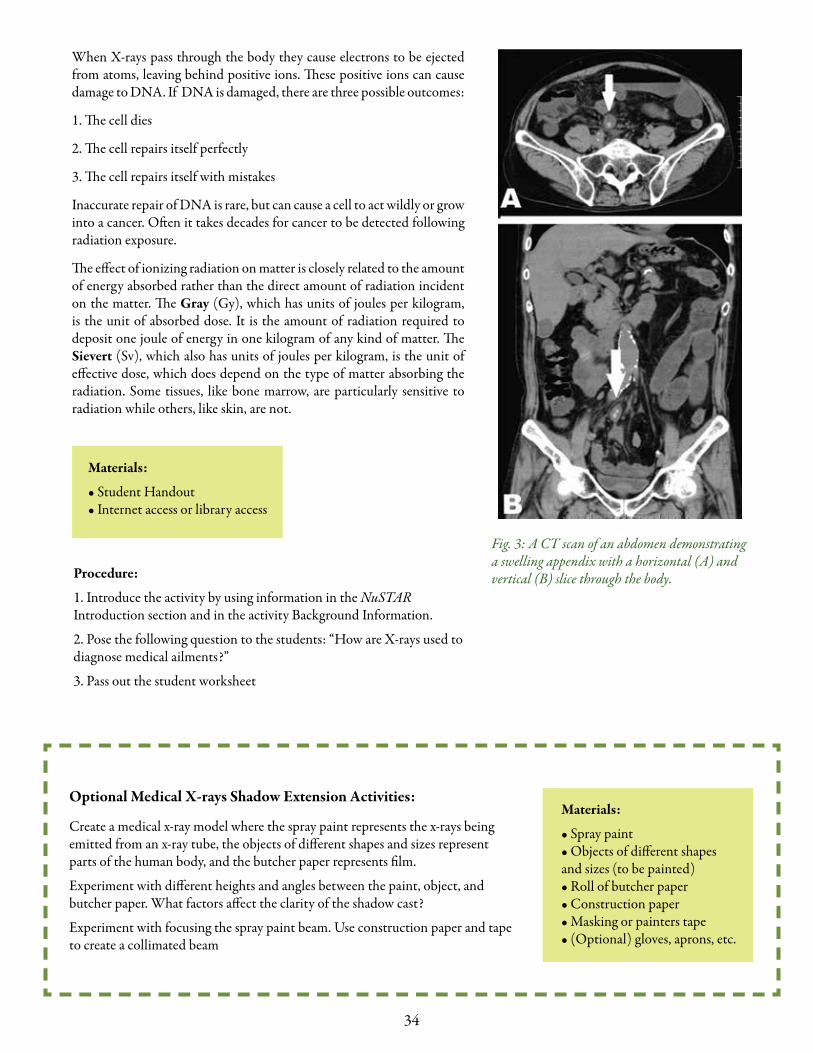
34
When X-rays pass through the body they cause electrons to be ejected from atoms, leaving behind positive ions. These positive ions can cause damage to DNA. If DNA is damaged, there are three possible outcomes:
1. The cell dies
2. The cell repairs itself perfectly
3. The cell repairs itself with mistakes
Inaccurate repair of DNA is rare, but can cause a cell to act wildly or grow into a cancer. Often it takes decades for cancer to be detected following radiation exposure.
The effect of ionizing radiation on matter is closely related to the amount of energy absorbed rather than the direct amount of radiation incident on the matter. The Gray (Gy), which has units of joules per kilogram, is the unit of absorbed dose. It is the amount of radiation required to deposit one joule of energy in one kilogram of any kind of matter. The Sievert (Sv), which also has units of joules per kilogram, is the unit of effective dose, which does depend on the type of matter absorbing the radiation. Some tissues, like bone marrow, are particularly sensitive to radiation while others, like skin, are not.
Fig. 3: A CT scan of an abdomen demonstrating a swelling appendix with a horizontal (A) and vertical (B) slice through the body.
Materials:
• Student Handout• Internet access or library access
Procedure:
1. Introduce the activity by using information in the NuSTAR Introduction section and in the activity Background Information.
2. Pose the following question to the students: “How are X-rays used to diagnose medical ailments?”
3. Pass out the student worksheet
Optional Medical X-rays Shadow Extension Activities:
Create a medical x-ray model where the spray paint represents the x-rays being emitted from an x-ray tube, the objects of different shapes and sizes represent parts of the human body, and the butcher paper represents film.
Experiment with different heights and angles between the paint, object, and butcher paper. What factors affect the clarity of the shadow cast?
Experiment with focusing the spray paint beam. Use construction paper and tape to create a collimated beam
Materials:
• Spray paint• Objects of different shapes and sizes (to be painted) • Roll of butcher paper • Construction paper • Masking or painters tape • (Optional) gloves, aprons, etc.
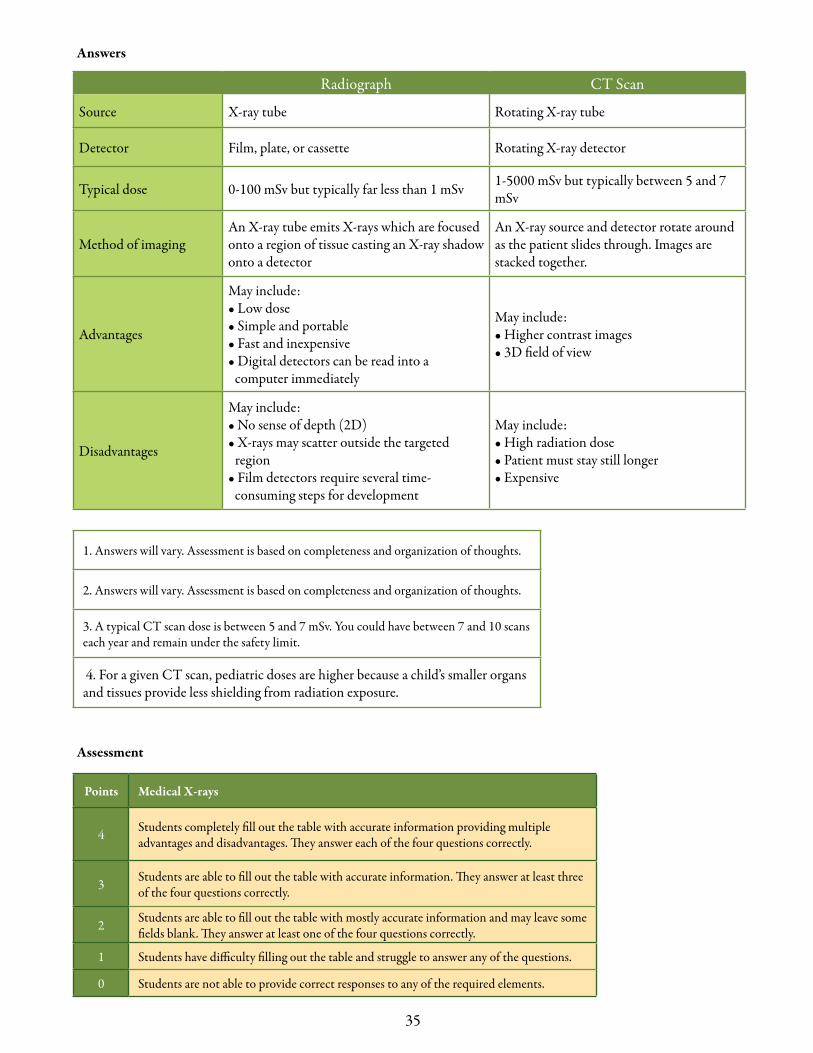
35
Answers table comparing radiopraphy and CT Scan
1. Answers will vary. Assessment is based on completeness and organization of thoughts.
2. Answers will vary. Assessment is based on completeness and organization of thoughts.
3. A typical CT scan dose is between 5 and 7 mSv. You could have between 7 and 10 scans each year and remain under the safety limit.
4. For a given CT scan, pediatric doses are higher because a child’s smaller organs and tissues provide less shielding from radiation exposure.
Assessment
Radiograph CT Scan
Source X-ray tube Rotating X-ray tube
Detector Film, plate, or cassette Rotating X-ray detector
Typical dose 0-100 mSv but typically far less than 1 mSv 1-5000 mSv but typically between 5 and 7 mSv
Method of imagingAn X-ray tube emits X-rays which are focused onto a region of tissue casting an X-ray shadow onto a detector
An X-ray source and detector rotate around as the patient slides through. Images are stacked together.
Advantages
May include:• Low dose• Simple and portable• Fast and inexpensive• Digital detectors can be read into a
computer immediately
May include:• Higher contrast images• 3D field of view
Disadvantages
May include:• No sense of depth (2D)• X-rays may scatter outside the targeted
region• Film detectors require several time-
consuming steps for development
May include:• High radiation dose• Patient must stay still longer• Expensive
Points Medical X-rays
4 Students completely fill out the table with accurate information providing multiple advantages and disadvantages. They answer each of the four questions correctly.
3 Students are able to fill out the table with accurate information. They answer at least three of the four questions correctly.
2 Students are able to fill out the table with mostly accurate information and may leave some fields blank. They answer at least one of the four questions correctly.
1 Students have difficulty filling out the table and struggle to answer any of the questions.
0 Students are not able to provide correct responses to any of the required elements.

36
Student Handout Medical X-rays
In this activity you will research two medical imaging techniques that rely on X-rays to gaze inside the human body.
Prior to the invention of medical imaging, doctors relied on painful prodding and invasive sur-gery to diagnose an internal ailments. As you read through these two X-ray imaging techniques, fill out the chart below. Identify how the X-rays are produced and detected and their optimal energy range. Find the typical dose for each and procedure for taking the image. Finally keep track of the advantages and disadvantages of each.
Radiograph CT Scan
Source
Detector
Typical dose
Method of imaging
Advantages
Disadvantages
If you would like to learn more about medical X-rays, here are some additional online resources:X-ray doses: http://hps.org/physicians/documents/doses_from_medical_X-ray_procedures.pdfMedical history: http://www.slac.stanford.edu/pubs/beamline/25/2/25-2-linton.pdf

37
After you are done filling out the table, answer the following questions:
1. What are some medical situations for which a radiograph might be more appropriate than a CT scan? Explain your answer.
2. What are some medical situations for which a CT scan might be more appropriate than a radiograph? Explain your answer.
3. Workers in the nuclear industry are limited to radiation doses of 50 mSv in the United States each year. Roughly how many chest CT scans would you need to get in a year to reach this safety limit?
4. Why does radiation pose a higher risk to children?
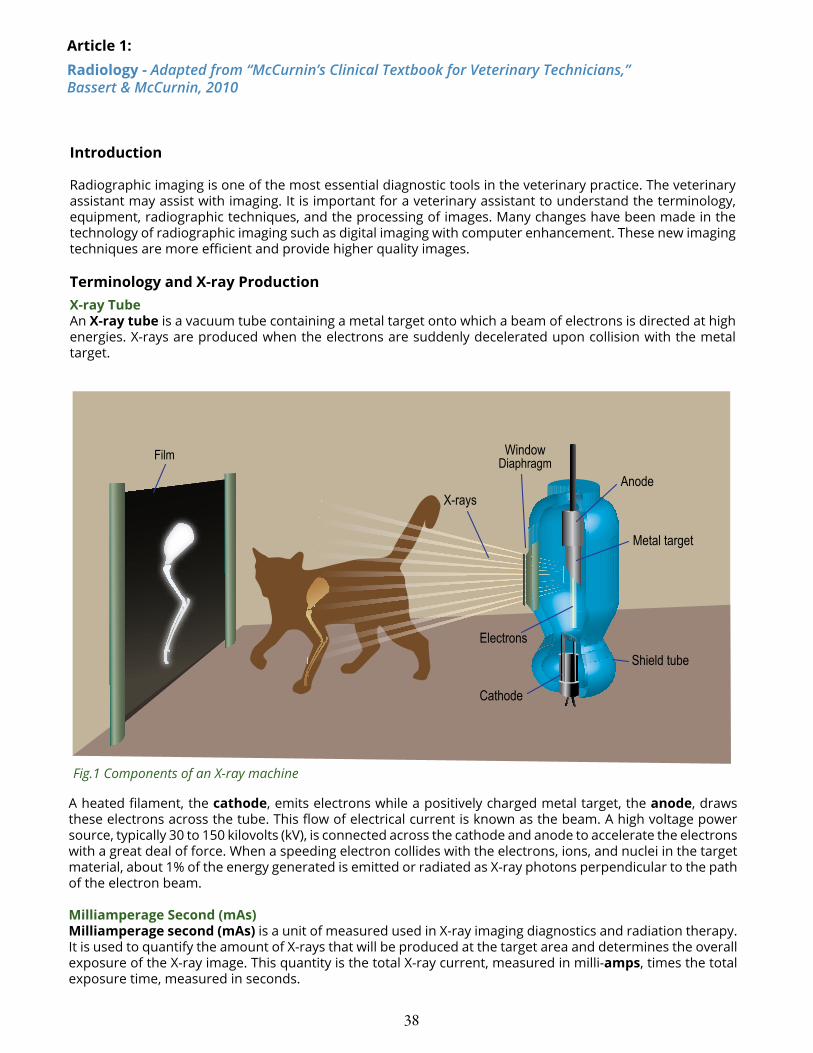
38
Introduction
Radiographic imaging is one of the most essential diagnostic tools in the veterinary practice. The veterinary assistant may assist with imaging. It is important for a veterinary assistant to understand the terminology, equipment, radiographic techniques, and the processing of images. Many changes have been made in the technology of radiographic imaging such as digital imaging with computer enhancement. These new imaging techniques are more efficient and provide higher quality images.
Terminology and X-ray ProductionX-ray TubeAn X-ray tube is a vacuum tube containing a metal target onto which a beam of electrons is directed at high energies. X-rays are produced when the electrons are suddenly decelerated upon collision with the metal target.
Diaphragm
A heated filament, the cathode, emits electrons while a positively charged metal target, the anode, draws these electrons across the tube. This flow of electrical current is known as the beam. A high voltage power source, typically 30 to 150 kilovolts (kV), is connected across the cathode and anode to accelerate the electrons with a great deal of force. When a speeding electron collides with the electrons, ions, and nuclei in the target material, about 1% of the energy generated is emitted or radiated as X-ray photons perpendicular to the path of the electron beam.
Milliamperage Second (mAs)Milliamperage second (mAs) is a unit of measured used in X-ray imaging diagnostics and radiation therapy. It is used to quantify the amount of X-rays that will be produced at the target area and determines the overall exposure of the X-ray image. This quantity is the total X-ray current, measured in milli-amps, times the total exposure time, measured in seconds.
Article 1: Radiology - Adapted from “McCurnin’s Clinical Textbook for Veterinary Technicians,” Bassert & McCurnin, 2010
Fig.1 Components of an X-ray machine
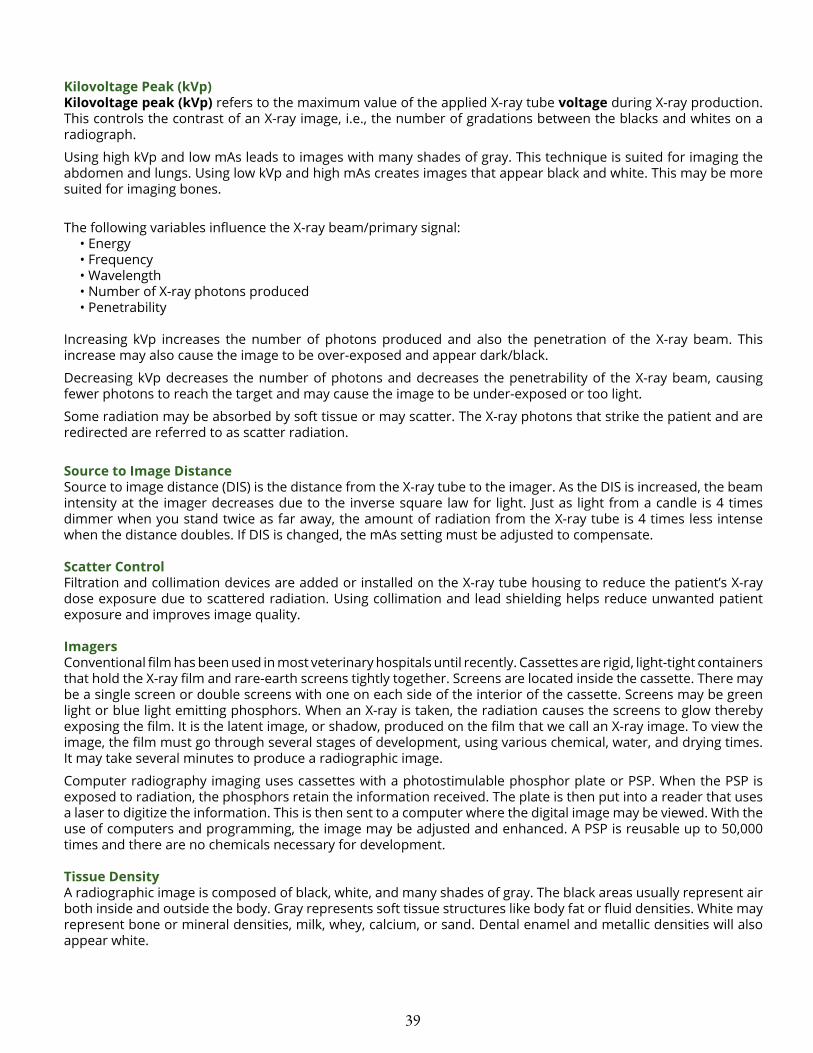
39
Kilovoltage Peak (kVp)Kilovoltage peak (kVp) refers to the maximum value of the applied X-ray tube voltage during X-ray production. This controls the contrast of an X-ray image, i.e., the number of gradations between the blacks and whites on a radiograph.
Using high kVp and low mAs leads to images with many shades of gray. This technique is suited for imaging the abdomen and lungs. Using low kVp and high mAs creates images that appear black and white. This may be more suited for imaging bones.
The following variables influence the X-ray beam/primary signal:• Energy• Frequency• Wavelength• Number of X-ray photons produced• Penetrability
Increasing kVp increases the number of photons produced and also the penetration of the X-ray beam. This increase may also cause the image to be over-exposed and appear dark/black.
Decreasing kVp decreases the number of photons and decreases the penetrability of the X-ray beam, causing fewer photons to reach the target and may cause the image to be under-exposed or too light.
Some radiation may be absorbed by soft tissue or may scatter. The X-ray photons that strike the patient and are redirected are referred to as scatter radiation.
Source to Image Distance Source to image distance (DIS) is the distance from the X-ray tube to the imager. As the DIS is increased, the beam intensity at the imager decreases due to the inverse square law for light. Just as light from a candle is 4 times dimmer when you stand twice as far away, the amount of radiation from the X-ray tube is 4 times less intense when the distance doubles. If DIS is changed, the mAs setting must be adjusted to compensate.
Scatter ControlFiltration and collimation devices are added or installed on the X-ray tube housing to reduce the patient’s X-ray dose exposure due to scattered radiation. Using collimation and lead shielding helps reduce unwanted patient exposure and improves image quality.
ImagersConventional film has been used in most veterinary hospitals until recently. Cassettes are rigid, light-tight containers that hold the X-ray film and rare-earth screens tightly together. Screens are located inside the cassette. There may be a single screen or double screens with one on each side of the interior of the cassette. Screens may be green light or blue light emitting phosphors. When an X-ray is taken, the radiation causes the screens to glow thereby exposing the film. It is the latent image, or shadow, produced on the film that we call an X-ray image. To view the image, the film must go through several stages of development, using various chemical, water, and drying times. It may take several minutes to produce a radiographic image.
Computer radiography imaging uses cassettes with a photostimulable phosphor plate or PSP. When the PSP is exposed to radiation, the phosphors retain the information received. The plate is then put into a reader that uses a laser to digitize the information. This is then sent to a computer where the digital image may be viewed. With the use of computers and programming, the image may be adjusted and enhanced. A PSP is reusable up to 50,000 times and there are no chemicals necessary for development.
Tissue DensityA radiographic image is composed of black, white, and many shades of gray. The black areas usually represent air both inside and outside the body. Gray represents soft tissue structures like body fat or fluid densities. White may represent bone or mineral densities, milk, whey, calcium, or sand. Dental enamel and metallic densities will also appear white.
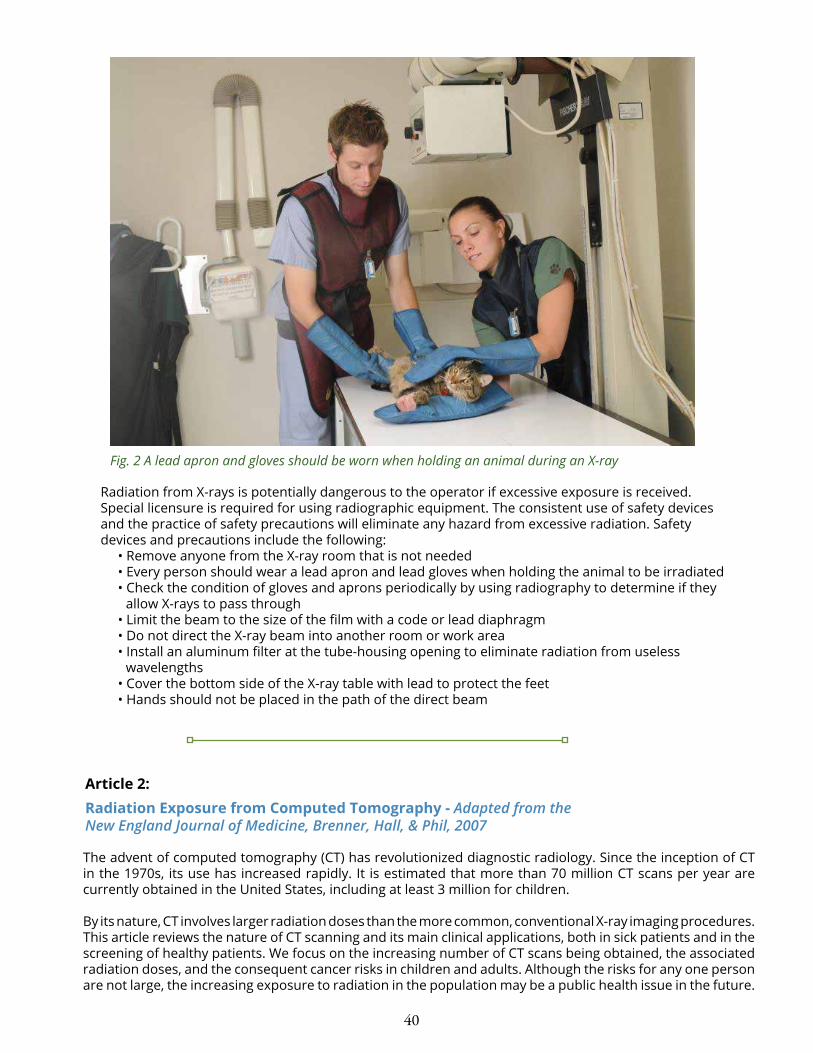
40
Radiation from X-rays is potentially dangerous to the operator if excessive exposure is received. Special licensure is required for using radiographic equipment. The consistent use of safety devices and the practice of safety precautions will eliminate any hazard from excessive radiation. Safety devices and precautions include the following:
• Remove anyone from the X-ray room that is not needed• Every person should wear a lead apron and lead gloves when holding the animal to be irradiated• Check the condition of gloves and aprons periodically by using radiography to determine if they
allow X-rays to pass through• Limit the beam to the size of the film with a code or lead diaphragm• Do not direct the X-ray beam into another room or work area• Install an aluminum filter at the tube-housing opening to eliminate radiation from useless
wavelengths• Cover the bottom side of the X-ray table with lead to protect the feet • Hands should not be placed in the path of the direct beam
Fig. 2 A lead apron and gloves should be worn when holding an animal during an X-ray
Article 2: Radiation Exposure from Computed Tomography - Adapted from the New England Journal of Medicine, Brenner, Hall, & Phil, 2007
The advent of computed tomography (CT) has revolutionized diagnostic radiology. Since the inception of CT in the 1970s, its use has increased rapidly. It is estimated that more than 70 million CT scans per year are currently obtained in the United States, including at least 3 million for children.
By its nature, CT involves larger radiation doses than the more common, conventional X-ray imaging procedures. This article reviews the nature of CT scanning and its main clinical applications, both in sick patients and in the screening of healthy patients. We focus on the increasing number of CT scans being obtained, the associated radiation doses, and the consequent cancer risks in children and adults. Although the risks for any one person are not large, the increasing exposure to radiation in the population may be a public health issue in the future.

41
Table 1 The radiation dose, a measure of ionizing energy absorbed per unit of mass, is expressed in grays (Gy) or milligrays (mGy); 1 Gy = 1 joule per kilogram. The radiation dose is often expressed as an equivalent effective dose in Sieverts (Sv) or millisieverts (mSv). For X-ray radiation of the energies used in CT scanners, 1 mSv = 1 mGy.
CT and its UseThe basic principles of CT scanning are illustrated in Figure 1. CT has transformed much of medical imaging by providing three-dimensional views of the organ or body region of interest.
The use of CT has increased rapidly, both in the United States and elsewhere, notably in Japan; according to a survey conducted in 1996, the number of CT scanners per 1 million people was 26 in the United States and 64 in Japan. It is estimated that more than 70 million CT scans are currently obtained each year in the United States, as compared with about 21 million in 1995. This sharp increase has been driven largely by advances in CT technology that make it extremely user-friendly for both the patient and the physician.
Fig. 1 A motorized table moves the patient through the CT imaging system. At the same time, a source of X-rays rotates within the circular opening, and a set of X-ray detectors rotates in synchrony on the far side of the patient. The X-ray source produces a narrow, fan-shaped beam, with widths ranging from 1 to 20 mm. This illustration shows a single row of detectors, but current machines typically have multiple rows of detectors operating side by side, so that many slices can be imaged simultaneously, reducing the overall scanning time. All the data are processed by computers to produce a series of image slices representing a three-dimensional view of the target organ or body region.
Study Type Relevant Organ Relevant Organ Dose (mGy or mSv)
Dental radiography Brain 0.005Front chest radiography Lung 0.01Side chest radiography Lung 0.15Mammography Breast 3Adult abdominal CT Stomach 10Barium enema Colon 15Neonatal abdominal CT Stomach 20
Common CT Scan TypesCT use can be categorized according to the population of patients (adult or child) and the purpose of imaging (diagnostic or screening). C.T-based diagnosis in adults is the largest of these categories. The largest increases in CT use, however, have been in the categories of pediatric diagnosis and adult screening. These trends can be expected to continue for the next few years.The growth of CT use in children has been driven primarily by the decrease in the time needed to perform a scan — now less than 1 second — largely eliminating the need for anesthesia to prevent the child from moving during image acquisition.
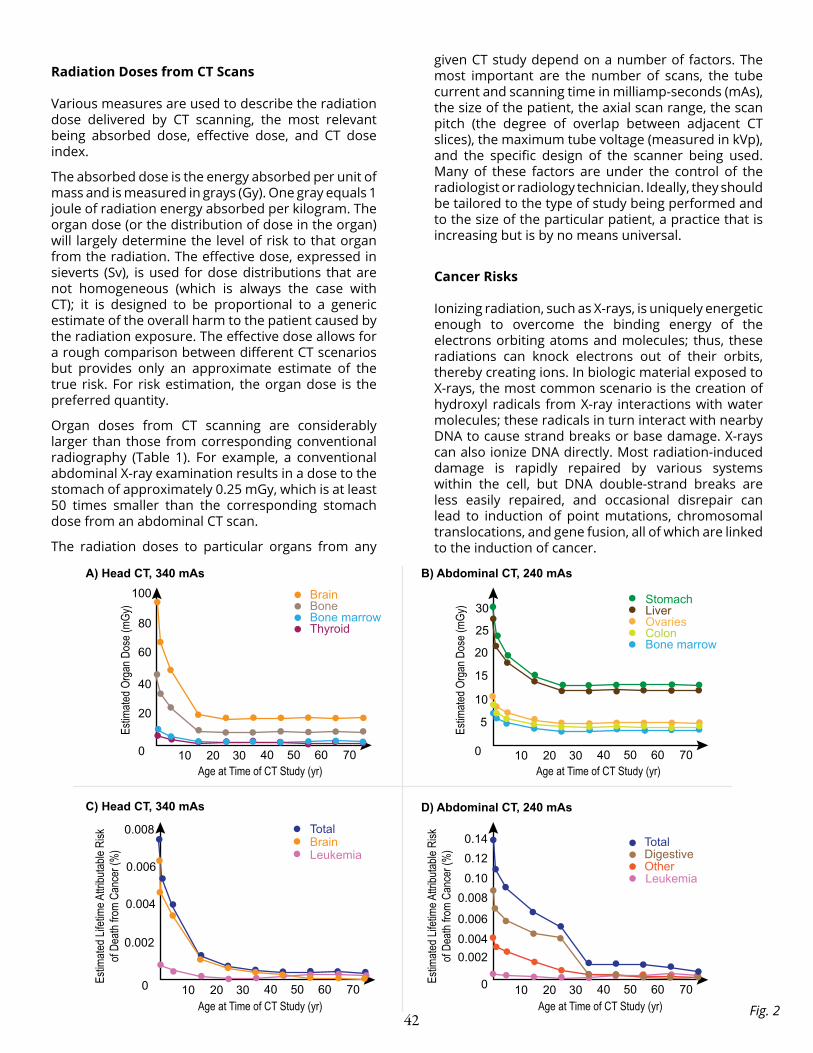
42
Radiation Doses from CT Scans
Various measures are used to describe the radiation dose delivered by CT scanning, the most relevant being absorbed dose, effective dose, and CT dose index.
The absorbed dose is the energy absorbed per unit of mass and is measured in grays (Gy). One gray equals 1 joule of radiation energy absorbed per kilogram. The organ dose (or the distribution of dose in the organ) will largely determine the level of risk to that organ from the radiation. The effective dose, expressed in sieverts (Sv), is used for dose distributions that are not homogeneous (which is always the case with CT); it is designed to be proportional to a generic estimate of the overall harm to the patient caused by the radiation exposure. The effective dose allows for a rough comparison between different CT scenarios but provides only an approximate estimate of the true risk. For risk estimation, the organ dose is the preferred quantity.
Organ doses from CT scanning are considerably larger than those from corresponding conventional radiography (Table 1). For example, a conventional abdominal X-ray examination results in a dose to the stomach of approximately 0.25 mGy, which is at least 50 times smaller than the corresponding stomach dose from an abdominal CT scan.
The radiation doses to particular organs from any
given CT study depend on a number of factors. The most important are the number of scans, the tube current and scanning time in milliamp-seconds (mAs), the size of the patient, the axial scan range, the scan pitch (the degree of overlap between adjacent CT slices), the maximum tube voltage (measured in kVp), and the specific design of the scanner being used.Many of these factors are under the control of the radiologist or radiology technician. Ideally, they should be tailored to the type of study being performed and to the size of the particular patient, a practice that is increasing but is by no means universal.
Cancer Risks
Ionizing radiation, such as X-rays, is uniquely energetic enough to overcome the binding energy of the electrons orbiting atoms and molecules; thus, these radiations can knock electrons out of their orbits, thereby creating ions. In biologic material exposed to X-rays, the most common scenario is the creation of hydroxyl radicals from X-ray interactions with water molecules; these radicals in turn interact with nearby DNA to cause strand breaks or base damage. X-rays can also ionize DNA directly. Most radiation-induced damage is rapidly repaired by various systems within the cell, but DNA double-strand breaks are less easily repaired, and occasional disrepair can lead to induction of point mutations, chromosomal translocations, and gene fusion, all of which are linked to the induction of cancer.
Fig. 2
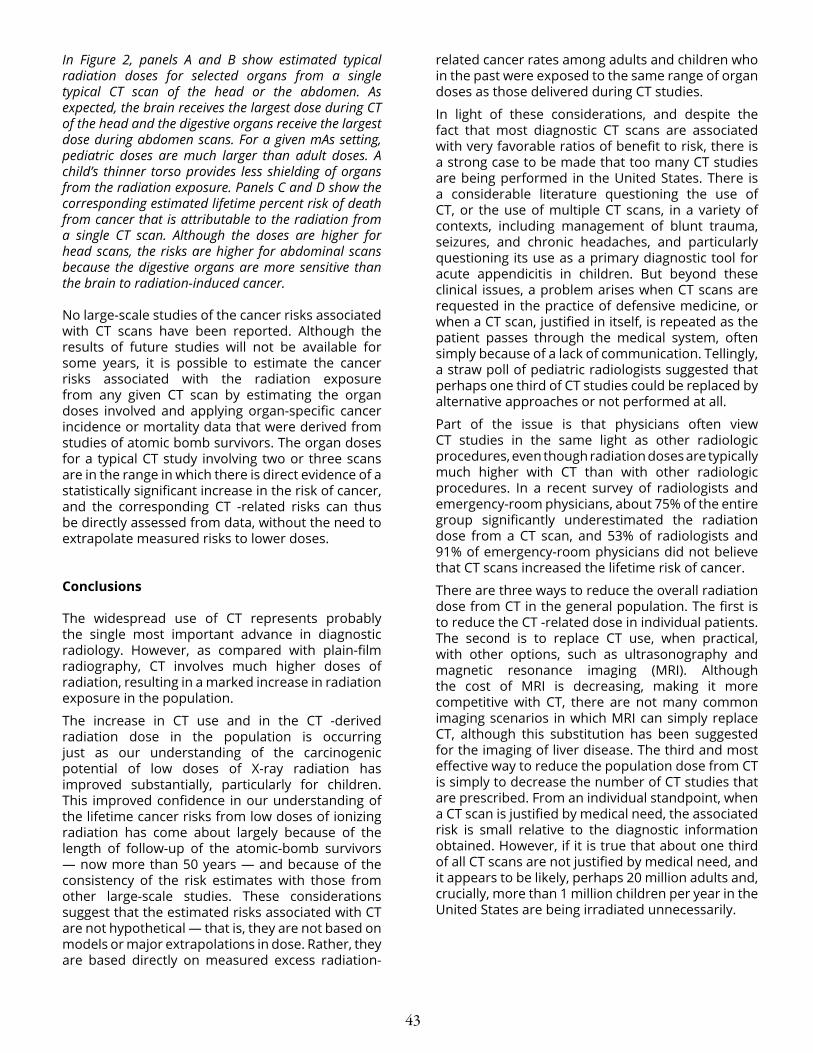
43
In Figure 2, panels A and B show estimated typical radiation doses for selected organs from a single typical CT scan of the head or the abdomen. As expected, the brain receives the largest dose during CT of the head and the digestive organs receive the largest dose during abdomen scans. For a given mAs setting, pediatric doses are much larger than adult doses. A child’s thinner torso provides less shielding of organs from the radiation exposure. Panels C and D show the corresponding estimated lifetime percent risk of death from cancer that is attributable to the radiation from a single CT scan. Although the doses are higher for head scans, the risks are higher for abdominal scans because the digestive organs are more sensitive than the brain to radiation-induced cancer.
No large-scale studies of the cancer risks associated with CT scans have been reported. Although the results of future studies will not be available for some years, it is possible to estimate the cancer risks associated with the radiation exposure from any given CT scan by estimating the organ doses involved and applying organ-specific cancer incidence or mortality data that were derived from studies of atomic bomb survivors. The organ doses for a typical CT study involving two or three scans are in the range in which there is direct evidence of a statistically significant increase in the risk of cancer, and the corresponding CT -related risks can thus be directly assessed from data, without the need to extrapolate measured risks to lower doses.
Conclusions
The widespread use of CT represents probably the single most important advance in diagnostic radiology. However, as compared with plain-film radiography, CT involves much higher doses of radiation, resulting in a marked increase in radiation exposure in the population.
The increase in CT use and in the CT -derived radiation dose in the population is occurring just as our understanding of the carcinogenic potential of low doses of X-ray radiation has improved substantially, particularly for children. This improved confidence in our understanding of the lifetime cancer risks from low doses of ionizing radiation has come about largely because of the length of follow-up of the atomic-bomb survivors — now more than 50 years — and because of the consistency of the risk estimates with those from other large-scale studies. These considerations suggest that the estimated risks associated with CT are not hypothetical — that is, they are not based on models or major extrapolations in dose. Rather, they are based directly on measured excess radiation-
related cancer rates among adults and children who in the past were exposed to the same range of organ doses as those delivered during CT studies.
In light of these considerations, and despite the fact that most diagnostic CT scans are associated with very favorable ratios of benefit to risk, there is a strong case to be made that too many CT studies are being performed in the United States. There is a considerable literature questioning the use of CT, or the use of multiple CT scans, in a variety of contexts, including management of blunt trauma, seizures, and chronic headaches, and particularly questioning its use as a primary diagnostic tool for acute appendicitis in children. But beyond these clinical issues, a problem arises when CT scans are requested in the practice of defensive medicine, or when a CT scan, justified in itself, is repeated as the patient passes through the medical system, often simply because of a lack of communication. Tellingly, a straw poll of pediatric radiologists suggested that perhaps one third of CT studies could be replaced by alternative approaches or not performed at all.
Part of the issue is that physicians often view CT studies in the same light as other radiologic procedures, even though radiation doses are typically much higher with CT than with other radiologic procedures. In a recent survey of radiologists and emergency-room physicians, about 75% of the entire group significantly underestimated the radiation dose from a CT scan, and 53% of radiologists and 91% of emergency-room physicians did not believe that CT scans increased the lifetime risk of cancer.
There are three ways to reduce the overall radiation dose from CT in the general population. The first is to reduce the CT -related dose in individual patients. The second is to replace CT use, when practical, with other options, such as ultrasonography and magnetic resonance imaging (MRI). Although the cost of MRI is decreasing, making it more competitive with CT, there are not many common imaging scenarios in which MRI can simply replace CT, although this substitution has been suggested for the imaging of liver disease. The third and most effective way to reduce the population dose from CT is simply to decrease the number of CT studies that are prescribed. From an individual standpoint, when a CT scan is justified by medical need, the associated risk is small relative to the diagnostic information obtained. However, if it is true that about one third of all CT scans are not justified by medical need, and it appears to be likely, perhaps 20 million adults and, crucially, more than 1 million children per year in the United States are being irradiated unnecessarily.
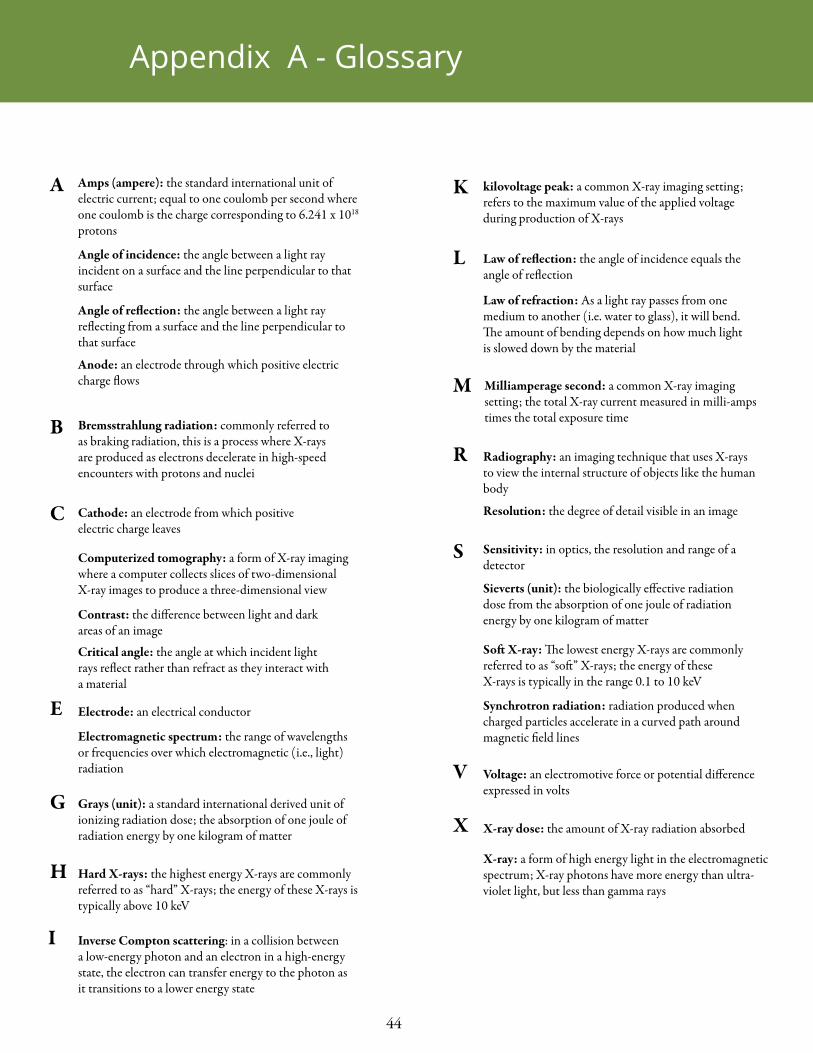
44
A
B
E
G
K
L
M
I
R
S
H
V
Appendix A - Glossary
X
C
Amps (ampere): the standard international unit of electric current; equal to one coulomb per second where one coulomb is the charge corresponding to 6.241 x 10¹⁸ protons
Angle of incidence: the angle between a light ray incident on a surface and the line perpendicular to that surface
Angle of reflection: the angle between a light ray reflecting from a surface and the line perpendicular to that surface
Anode: an electrode through which positive electric charge flows
Bremsstrahlung radiation: commonly referred to as braking radiation, this is a process where X-rays are produced as electrons decelerate in high-speed encounters with protons and nuclei
Cathode: an electrode from which positive electric charge leaves
Computerized tomography: a form of X-ray imaging where a computer collects slices of two-dimensional X-ray images to produce a three-dimensional view
Contrast: the difference between light and dark areas of an image
Critical angle: the angle at which incident light rays reflect rather than refract as they interact with a material
Electrode: an electrical conductor
Electromagnetic spectrum: the range of wavelengths or frequencies over which electromagnetic (i.e., light) radiation
Grays (unit): a standard international derived unit of ionizing radiation dose; the absorption of one joule of radiation energy by one kilogram of matter
Hard X-rays: the highest energy X-rays are commonly referred to as “hard” X-rays; the energy of these X-rays is typically above 10 keV
Inverse Compton scattering: in a collision between a low-energy photon and an electron in a high-energy state, the electron can transfer energy to the photon as it transitions to a lower energy state
kilovoltage peak: a common X-ray imaging setting; refers to the maximum value of the applied voltage during production of X-rays
Law of reflection: the angle of incidence equals the angle of reflection
Law of refraction: As a light ray passes from one medium to another (i.e. water to glass), it will bend. The amount of bending depends on how much light is slowed down by the material
Milliamperage second: a common X-ray imaging setting; the total X-ray current measured in milli-amps times the total exposure time
Radiography: an imaging technique that uses X-rays to view the internal structure of objects like the human body
Resolution: the degree of detail visible in an image
Sensitivity: in optics, the resolution and range of a detector
Sieverts (unit): the biologically effective radiation dose from the absorption of one joule of radiation energy by one kilogram of matter
Soft X-ray: The lowest energy X-rays are commonly referred to as “soft” X-rays; the energy of these X-rays is typically in the range 0.1 to 10 keV
Synchrotron radiation: radiation produced when charged particles accelerate in a curved path around magnetic field lines
Voltage: an electromotive force or potential difference expressed in volts
X-ray dose: the amount of X-ray radiation absorbed
X-ray: a form of high energy light in the electromagnetic spectrum; X-ray photons have more energy than ultra-violet light, but less than gamma rays

45
NASAwww.nasa.gov
NuSTAR mission sitewww.nustar.caltech.eduVisit the main mission page for current news, multimedia, and information about NuSTAR.
Chandra mission sitehttp://chandra.harvard.edu/Visit the main mission page for current news, multimedia, and information about the Chandra X-ray Observatory.
NuSTAR Paper Modelhttp://www.nustar.caltech.edu/page/paper_modelBuild your own model of the NuSTAR observatory.
Active Galaxy Education Unithttp://fermi.sonoma.edu/teachers/agn.phpThis education unit was developed for the Fermi Gamma-Ray Space Telescope Education and Public Outreach program, but addresses one of NuSTAR’s main scientific objectives: the study of galaxies with massive black holes at their cores. All three activities are aligned with the national science and mathematics standards. A beautiful poster illustrating an active galaxy features one of the three activities on the reverse side.
Solar Supernova?http://mystery.sonoma.edu/solarsupernovaWill the Sun explode as a supernova? Help Professor Starzapoppin examine his scientific notes and data to determine our nearest star’s fate.
NASA’s Space Placehttp://spaceplace.nasa.govLearn more about stars, galaxies, and black holes (for younger students).
RadiologyInfohttp://www.radiologyinfo.orgExplore how various x-ray, CT, MRI, ultrasound, radiation therapy and other procedures are performed.
Next Generation Science Standardshttp://www.nextgenscience.orgThrough a collaborative, state-led process managed by Achieve, new K-12 science standards have been developed that are rich in content and practice, arranged in a coherent manner across disciplines and grades to provide all student an internationally benchmarked science education. The NGSS are based on the Framework for K-12 Science Education developed by the National Research Council.
Appendix B - Resources

46
Appendix C - References
Activity 3: Black Holes in the News
Jet Propulsion Laboratory (2012). “NASA’s NuSTAR Spots Flare From Milky Way’s Black Hole” [Press Release]. Retrieved from http://www.jpl.nasa.gov/news/news.php?release=2012-333
Jet Propulsion Laboratory (2013). “Black Hole Naps Amidst Stellar Chaos” [Press Release]. Retrieved from http://www.jpl.nasa.gov/news/news.php?release=2013-198
Jet Propulsion Laboratory (2013). “Do Black Holes Come in Size Medium?” [Press Release]. Retrieved from http://www.jpl.nasa.gov/news/news.php?release=2013-343
Jet Propulsion Laboratory (2014). “NASA’s NuSTAR Telescope Discovers Shockingly Bright Bead Star” [Press Release]. Retrieved from http://www.jpl.nasa.gov/news/news.php?release=2014-345
Activity 4: Medical X-rays
Bassert, Joanna M., and McCurnin, Dennis M. “Chapter 8 – Lesson 3 Radiology” McCurnin’s Clini-cal Textbook for Veterinary Technicians. 7th ed. St. Louis: Saunders Elsevier, 2010. 131+. Print.
Brenner D. J. & Hall E. J. “Computed tomography – an increasing source of radiation exposure.” N Engl J Med. 2007;357(22):2277–84.

47
http://www.NuSTAR.caltech.edu/