x-ray electrons expelled from metals - royal...
TRANSCRIPT

I regret that this was never mentioned in any of the papers; it certainly ought to have been stated explicitly somewhere, but in fact no real importance was attached to this correction. I t was made purely as a m atter of routine, and not from a belief that it was warranted by the accuracy of our experiments. A correction as small as this would in the circumstances almost certainly have been neglected if it had been at all difficult to apply.
R eferences
Birge, R . T. 1939 (August) P rivate communication.Darwin, C. G. 1940 Proc. Phys. Soc. 52, 202.D u Mond, J . W. M. 1939 Phys. Rev. 56, 153.Dunnington, F . G. 1939 Rev. Mod. Phys. 11, 65.Elg, S. 1937 Z. Phys. 106, 315.K retschm ar, G. G. 1933 Phys. Rev. 43, 417.Robinson, H . R . 1934a Proc. Phys. Soc. 46, 693.
— 1934 bPhil. Mag. (7), 18, 1086.— 1936 Phil.Mag. (7), 22, 1129.
Robinson, H. R ., Andrews, J . P . and Irons, E. J . 1933 Proc. Roy. Soc. A, 143, 48. Robinson, H . R . and Clews, C. J . B. 1935 Proc. Roy. Soc. A, 149, 587.Robinson, H . R . and Mayo, R. L. 1939 Proc. Roy. Soc. A, 173, 192.
X-ray electrons expelled from metals 33
The electric strength of some solid dielectrics*
By A. E. W. Austen and S. Whitehead
(Communicated by N. F. Mott, F—Received 29 April 1940)
Methods are described by which the ‘intrinsic’ electric strength of solid dielectrics m ay be defined and evaluated. I t is shown th a t the magnitudes of and the effect of tem perature and thickness upon the electric strengths of certain crystals agree w ith Frohlich’s theory of electronic breakdown, as also does the effect of disordered structure and m icrostructure in similar instances. On the other hand, departures from theory occur w ith complex organic dielectrics and also with crystals when, w ith the la tter, certain limits, e.g. of tem perature, are exceeded.
1. Introduction
The paper describes some recent measurements of the intrinsic electric strength of certain solid dielectrics; a preliminary note of some of the results has already been published (cf. Austen and Hackett 1939). I t was
* Based on Report Reference L/T 114 of the British Electrical and Allied I n dustries Research Association.
Vol. 176. A. 3
on May 7, 2018http://rspa.royalsocietypublishing.org/Downloaded from

34 A. E. W. Austen and S. Whitehead
proposed to determine the actual values of electric strength of certain materials and the effect of temperature, thickness in the case of very thin layers, crystalline form and state of purity.
The experiments were suggested by recent theoretical work on dielectric breakdown. Theories have been given by, among others, Zener (1924), von Hippel (1931), Frohlich (1937) and Seeger and Teller (1939). Zener’s theory, following earlier work by Whitehead and by Joffe, pictures a kind of pulling out of the electrons from the ions: it predicts a rapid increase of current in a dielectric as the field is raised, and in view of recent work must be considered to describe the electronic currents observed before breakdown, rather than the breakdown itself, which appears as a sudden instability. Yon Hippel first suggested that intrinsic breakdown was of the nature of an electron avalanche, similar to that occurring in gases. Frohlich and Seeger and Teller give mathematical developments of this idea. In a recent paper Frohlich (19396) has given reasons for believing tha t Seeger and Teller’s results are incorrect, and since, moreover, the latter authors make no predictions as to the variation of electric strength with temperature or thickness, in the comparison of the present experiments with theory only Frohlich’s work will be considered.
Frohlich’s theory makes the following predictions:(1) The intrinsic strength should decrease as the temperature is lowered
below the Debye characteristic temperature of the material, the effect being most marked for substances with low Debye temperatures.
(2) The strength should be independent of thickness for thick specimens, but should increase for very thin specimens of thickness of the order of a few mean free paths. (One mean free path is of order 10~6 cm.; cf. Frohlich and Mott 1939.)
(3) The strength of a mixed crystal is greater than the weighted mean of those of the pure components, and greater for a given substance in an amorphous than in a crystalline form. Impurities which form large aggregates, e.g. colloidal particles, may give a lower electric strength owing to distortion of the electric field.
(4) Microstructure due to differences in or relative displacement of neighbouring crystallites should probably not affect the electric strength.
Frohlich’s theory also gives a numerical formula from which the electric strength of any thick specimen of an ionic crystal can be calculated if the absorption spectrum of the crystal in the infra-red is known. The expression is
E =5x ^ i°gr<}‘v/°m., (i)
on May 7, 2018http://rspa.royalsocietypublishing.org/Downloaded from

whereV = molecular volume,
z = number of atoms per molecule,
(e{— 1) = 47r x polarizability corresponding to the oscillation of residual wave-length A*,
■ = 1 + tfwjkT_ i »
The electric strength of some solid dielectrics 35
T = abs. temp.,
J and Afl are the energy (in absolute units) and wave-length (in Angstroms) respectively corresponding to the first maximum of the ultra-violet absorption band,
n = number of atoms per cm.3,
r — number of residual ray frequencies,
m = mass of an electron.
If the approximation is made of a single mean residual ray frequency v, equation (1) reduces to
whereA = residual ray wave-length, in Angstroms,
e = static dielectric constant,e0 = n2 = contribution of the electrons to the dielectric constant.
Von Hippel’s experiments (1935) have shown that the theory gives values of electric strength of the alkali halides a t room temperatures in satisfactory agreement with experiment, and also that ̂ the strength of mixed crystals is greater than that of either constituent. The present paper gives an account of work in which experimental methods suitable for a wide range of materials and conditions have been devised and describes experiments as follows:
The variation of the electric strength of potassium bromide with temperature has been measured.
The absolute value of the electric strength of mica, together with its variation with temperature has been determined.
on May 7, 2018http://rspa.royalsocietypublishing.org/Downloaded from

36 A. E. W. Austen and S. Whitehead
Measurements of the electric strength of thin films of mica have been extended to the region where the strength increases considerably.
The strengths of fused and crystalline quartz are compared.In addition the electric strengths of a coloured glass and the corre
sponding basic glass have been measured and organic dielectrics to which Frohlich’s theory does not apply investigated.
2. The nature and measurement of intrinsic breakdown
The electrical breakdown of a dielectric is frequently influenced by the thermal and special electrical conditions under which the test is made, as, for example in breakdown due to discharges in a surrounding liquid or gaseous medium or breakdown due to thermal instability. I t is clear tha t for the present purpose the electric strength measured should be independent of such conditions and it has been found tha t a type of breakdown exists which is a property of the physical nature of the dielectric and its temperature only. This has been called intrinsic breakdown and the corresponding field strength the intrinsic electric strength.
I t is to be expected a 'priori that intrinsic breakdown should possess the following properties:
(a) The electric strength should be independent of thickness over a fairly wide range, except for very small thicknesses.
(b) The electric strength should be independent of the nature or duration of the electric stress provided no appreciable change of temperature occurs as a result of the application of the electric stress and provided the duration (e.g. with impulse voltage) is sufficient to permit the development of the discharge mechanism Envisaged.
(c) The actual discharge should result in the local destruction of the structure and should occur wholly within the dielectric and in the region where the field is most intense.
The existence of an intrinsic electric strength postulates a homogeneous dielectric free from imperfections and weak spots. I t is therefore preferable that as small an area of the dielectric as possible should be exposed to electric stress, but, at the same time the field must be calculable and sufficiently uniform in the direction of the field to avoid incomplete breakdown. For these reasons two spherical electrodes (or one sphere and a plane) were used, where, provided the radius of the sphere is large compared with the thickness of the dielectric, the intense portion of the field at the sphere vertex is substantially uniform through the thickness of the dielectric but is limited to a small area in the neighbourhood of the vertex.
on May 7, 2018http://rspa.royalsocietypublishing.org/Downloaded from

Materials are frequently available in the form of thin plane sheets and if they are tested between spheres the medium between the spherical electrode and the dielectric, in the vicinity of the point of contact, is stressed to a value comparable with the stress in the test specimen. No gaseous or liquid dielectrics in which the test may be carried out have strengths as high as that of some solid dielectrics and the immersion medium then frequently breaks down first and the resulting discharge, either by chemical action or by causing local concentrations of stress, causes premature breakdown of the test specimen. Numerous attempts to overcome this difficulty have been made by immersing the system in liquids of high electric strength or in waxes and sometimes subjecting the whole to high pressures still further to increase the electric strength.
In tests on solid dielectrics of high strength it is necessary to select an immersion medium not only of high strength but also of suitable resistivity, in the case of D.C. tests, or specific impedance for A.C. tests, with respect to that of the specimen. If cr, e, and E are the conductivity, permittivity, loss angle and electric strength respectively, the subscript 8 referring to the dielectric and M to the immersion medium, then
o ' Ey j o"gEg for D.C.or hiMeMsec SM > Es es sec 8S for A.C.
are rough conditions for the avoidance of discharges in the medium. These conditions are not precise since they neglect tangential stress and they are difficult to apply on account of the variation of the quantities with field strength. Theoretically the occurrence of breakdown at the point of contact of the spherical electrode is evidence of a satisfactory test, but the point of contact is difficult to locate with precision and there may be a thin film of the immersion medium so that a breakdown apparently at the point of contact may be spurious. On the other hand, with semi-con- ducting media the specimen is stressed to a value closely approximating to the maximum value at the point of contact over an appreciable area so that a breakdown appreciably separated from the point of contact is not necessarily spurious. A better criterion is the observation of the apparent electric strength for variation of the immersion medium, and if the apparent electric strength is not decreased by a considerable decrease of vj\j Em or E sec 8 ^ it is fairly certain that the breakdown stress is reached in the specimen before the immersion medium is overstressed.
While it is not difficult to find liquid immersion media suitable for use at room temperatures, e.g. mixing castor oil with nitrobenzene permits a wide variation of conductivity without much change of electric strength,
The electric strength of some solid dielectrics 37
on May 7, 2018http://rspa.royalsocietypublishing.org/Downloaded from
38 A. E. W. Austen and S. Whitehead
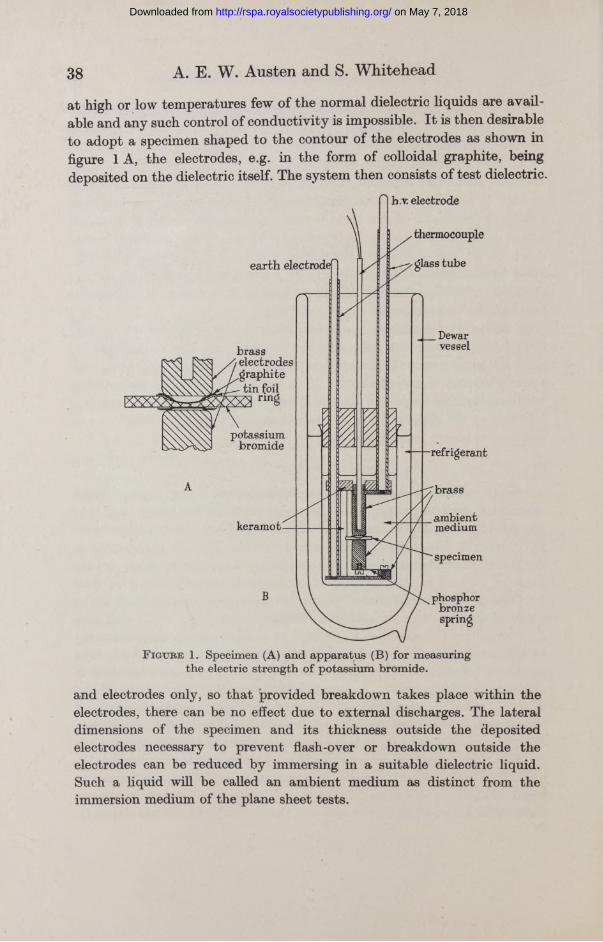
at high or low temperatures few of the normal dielectric liquids are available and any such control of conductivity is impossible. I t is then desirable to adopt a specimen shaped to the contour of the electrodes as shown in figure 1 A, the electrodes, e.g. in the form of colloidal graphite, being deposited on the dielectric itself. The system then consists of test dielectric.
h.v. electrode
glass tubeearth electrod<
___Dewarvesselbrass
/ t electrode / /graphite
tin foil
potassiumbromide ------refrigerant
_ ambient mediumkeramot
specimen
phosphorbronzespring
F igure 1. Specimen (A) and apparatus (B) for measuring the electric strength of potassium bromide.
and electrodes only, so that provided breakdown takes place within the electrodes, there can be no effect due to external discharges. The lateral dimensions of the specimen and its thickness outside the deposited electrodes necessary to prevent flash-over or breakdown outside the electrodes can be reduced by immersing in a suitable dielectric liquid. Such a liquid will be called an ambient medium as distinct from the immersion medium of the plane sheet tests.
on May 7, 2018http://rspa.royalsocietypublishing.org/Downloaded from
3. Results
(a) Potassium bromideThe material was obtained in the form of an artificially prepared single
crystal of cylindrical shape about 4 cm. in diameter and 4 cm. long. I t was found possible to split complete circular plates down to a thickness of 0*5 cm., while plates of linear dimensions about 1*5 cm. could be obtained down to a thickness of about 0*15 cm. I t appeared, therefore, to be necessary to resort to grinding to obtain specimens of thickness suitable for electric strength measurements, i.e. about 0-02 cm. Since it was desired to make measurements at low temperatures it was decided to attem pt to prepare specimens with a spherical recess.
Tinfoil rings were cemented to the specimen at the edge of the recess and the specimen painted with a suspension of colloidal graphite in acetone to form the electrode proper. Contact with the tinfoil rings was made by two cylindrical brass electrodes with rounded ends and maintained by spring pressure, as shown in figure 1 B. I t was found tha t direct immersion in a refrigerant such as liquid nitrogen caused cracking of the specimen and the electrode system was therefore placed in a liquid, petroleum ether a t low temperatures or transformer oil at room or higher temperatures, and the whole assembly placed in a refrigerant in a Dewar vessel or a heated oil bath for tests at low or high temperatures respectively. The temperature was measured by means of a thermocouple in a thin- walled glass tube sunk into the high-voltage electrode and withdrawn just before the application of voltage.
Tests were made at room temperature on specimens (a) with a recess dissolved out by means of a jet of water and (b) with the recess and the plane side ground with carborundum powder (no. 600) in oil, on a copper tool of radius of curvature 1 cm., and polished with rouge or polishing alumina on a chamois leather-covered tool; the values obtained were both inconsistent and rather low, i.e. about 0-5 x 10⁶ V/cm., compared with the value obtained by von Hippel of 0*7 x 106 V/cm. I t was found, however, that remarkably consistent values of about 0-79 x 106 V/cm. were obtained with specimens ground with no. 600 carborundum but not polished, the surface of the material then having a fine m att appearance, the irregularities presumably being of linear dimensions of the same order as those of the carborundum grains, i.e. about 0*001 cm. Microscopic examination of the edge of a cracked specimen, however, showed that the depth of the irregularities was considerably less. The electric strength showed no variation with thickness over a range from 0*015 to 0*04 cm.
The electric strength of some solid dielectrics 39
on May 7, 2018http://rspa.royalsocietypublishing.org/Downloaded from

40 A. E. W. Austen and S. Whitehead
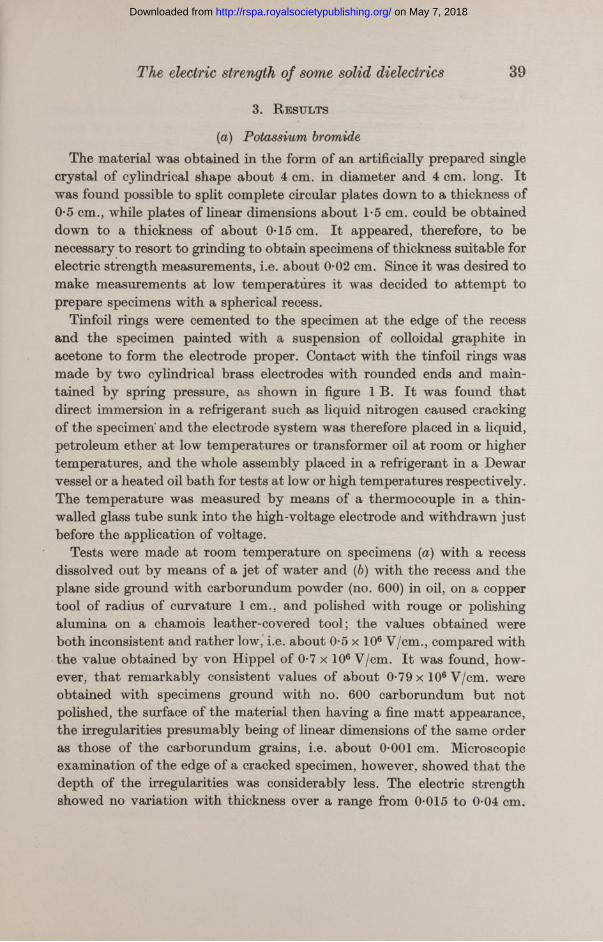
at room temperature, and measurements were made at lower and higher temperatures with ground but unpolished specimens of thickness of order 0*02 cm. The results are compared with the calculated values of Frohlich in figure 2.
The following check tests were made. Two specimens were treated as for a test at low temperature but allowed to warm up to room temperature and then tested: normal values were obtained indicating tha t the specimens did not suffer permanent damage on cooling. The possibility of water absorption was also considered and specimens were prepared, graphited,
O
orHrC
§
ou
0-9
0-8
0-7
0-6
0-5
0-4
0-3
0-2
1 |X !
V\
---------X.
/calculated
F
—me,asured
V ■>
------ '/*"■—' X recessed spec
thickness 0*1linens of to 0*3 mm.
1j
100 300200tem perature (° K)
F igure 2 . Electric strength of potassium bromide.
400
baked at 115° C for 2 hr., cooled over phosphorus pent oxide and tested in petroleum ether containing phosphorus pentoxide, both at room and low temperatures. Normal values were obtained.
I t will be noted that the direction of the variation of electric strength with temperature is in agreement with theory but that the decrease is markedly greater than that obtained theoretically. Von Hippel (1939) has since published the results of tests on potassium bromide and obtains a similar fairly sudden decrease of strength with decrease of temperature, which, while also greater than that required by the theory, is not as great as that observed by the present authors. A complete account of von
on May 7, 2018http://rspa.royalsocietypublishing.org/Downloaded from

Hippel’s experimental technique, however, has not yet been given, and in particular the thickness of the specimens is not stated so that a discussion of the discrepancy is not possible.
The remaining possible source of error in the authors’ experiments would appear to be the nature of the surface of the specimens. I t was observed, however, tha t the surface of the polished specimens was not free from defects, nor was it found possible to obtain a perfect surface. Tests on ground specimens of crystalline quartz, however, gave the same value as polished specimens so tha t it would appear that the low and erratic values for polished potassium bromide are due to surface defects and tha t the values for ground specimens are valid.
(6) MicaThe considerable body of research conducted by the Electrical Research
Association on the electric strength of mica for industrial purposes of thicknesses available commercially, i.e. greater than 0-002 cm., is being published elsewhere and only those parts of theoretical significance will be described here. Tests were made on plane sheets with spherical metal electrodes and immersion media, as already described, and on specimens with a spherical recess in a manner essentially similar to tha t used for potassium bromide. Further description of experimental methods is therefore unnecessary and only the results will be given.
Measurements a t room temperature on plane specimens using as immersion medium a mixture of castor oil and nitrobenzene (resistivity about 2 x 10⁸ ohm-cm. electric strength about 0-1 x 10⁶ V/cm.) showed that there was no variation of strength with thickness in the range 0-002-0-007 cm., and that the D.C. and 50 eye. A.C. crest values were the same. Impulse measurements were made at the National Physical Laboratory in the course of another investigation (Davis and Lacey 1939). Values obtained using a 1/5 /tsec. standard wave for plane sheet specimens are compared with D.C. values for specimens from the same consignment in table 1, which shows tha t although the impulse values are usually higher, the difference is not large compared with the experimental dispersion, which tended to be high in the impulse tests, where distilled water was used as an immersion medium.
X-ray measurements also on the same consignment were made at the National Physical Laboratory. Table 1 shows the lattice spacing and the length of the diffraction arc which is a measure of the mean tilting of the axes of individual crystallites about the mean direction. I t will be seen that although the thinner specimens showed a more pronounced micro
The electric strength of some solid dielectrics 41
on May 7, 2018http://rspa.royalsocietypublishing.org/Downloaded from

42 A. E. W. Austen and S. Whitehead
structure, i.e. a greater relative tilting of the individual crystallites, their electric strengths were, if anything, higher. This supports Frohlich’s view th a t the intrinsic electric strength is not “ structure sensitive” in the commonly accepted meaning of the term.
Table 1. E ffect of duration of stress and microstructure for Muscovite (ruby) mica
Electricstrength (D.C.) Ratio impulse Lattice spacings
Nominal in 10® V/cm. to D.C. Length of perpendicularthickness ̂ ---- >-------- ------ - diffraction to cleavage
Type mm. Mean Maximum Mean Maximum arc* cm. plane (A)
Clear 0-02 10-15 10-7 1-28 1-26 3-25 9-9460-04 10-3 10-8 1-16 1-25 3-00 9-9460-06 9-75 10-0 1-08 1-50 2-60 9-946
Stained 0 0 2 11-6 12-0 0-99 1-17 3-20 9-9570-04 10-5 11-5 1-05 1-17 3-00 9-9580-06 10-6 11-5 0-80 100 2-65 9-958
* Length of recorded X-ray reflexion measured along the diffraction ring. This is a measure of the relative tilting o f the planes o f neighbouring crystallites.
Owing to lack of the requisite optical data, it is not possible to calculate accurately the electric strength of mica. Frohlich, however (cf. Frohlich 1939a), assuming tha t the effective residual wave-lengths are the same as those of quartz, i.e. Ax = 8-4/t, A2 = 20-5/4 and th a t e1 = e2, and th a t the wave-lengths of the first ultra-violet maxima Aq are the same, obtains a value between 6-6 x 10⁶ and 7-5 x 10® V/cm., while the assumption th a t Ax = 8-4 is the only important residual wave-length gives a strength of 15 x 10® V/cm. which is an upper limit to the theoretically possible value. The variation with temperature also depends on the residual wave-lengths, and the curves plotted in figure 3 are obtained by assuming the observed value a t room temperature and residual wave-lengths of 10 and 20/4 respectively. I t will be seen th a t the theoretical curve for 10/4 and the maximum experimental values are in satisfactory agreement up to 450° K. At higher temperatures the electric strength decreases greatly, as is common with solid dielectrics, since the structure itself frequently changes, other breakdown mechanisms intervene and Frohlich’s theory no longer applies.
(c) Thin layers of micaJoffe and his collaborators (cf. Semenoff and Walther 1928) claimed to
have observed electric strengths up to 100 x 10® V/cm. for glass and mica of thickness of order 10-5 cm. These values, however, were subsequently
on May 7, 2018http://rspa.royalsocietypublishing.org/Downloaded from

The electric strength of some solid dielectrics 43
withdrawn (Joffe and Alexandrow 1932), and in a new investigation in which errors due to a potential drop in the graphite electrodes and in the measurement of thickness were eliminated, it was found th a t the electric strength of mica increased only slightly from 9*4 x 10® V/cm. a t a thickness of 5 x 10⁻³ cm. to 12 x 10® V/cm. a t 0-7 x 10~4 cm. The present measurements extend this range to still smaller thicknesses.
So<0
eP£
o•B
O Recess — ve^ Recessed specimens x Recess + ve l of thickness 0-01- + A.C. J 0-05 mm.A Plane specimens 0-05 mm.□ Plane specimens 0-1* mm.
0
B
A
.d[___ *-0
. ^ • “8 O
X
oX
4*oV
--L ...
----- B200 400 600 800
temperature (°K )
1000 1200
F igure 3. Electric strength of clear ruby muscovite mica. A, Theoretical curve for mean residual ray of wave-length 10/*; B, Similar curve for wave-length 20/*.
* A t the lower temperatures breakdown of specimens of this thickness occurred at relatively low stresses as a result of breakdown of the immersion medium.
I t was found possible to obtain sheets of mica down to thicknesses of order 0-001 cm. by splitting from thicker material. I f these sheets were torn, small areas a t the edges of the tear, of linear dimensions of a few millimetres, were sufficiently thin to show the colours of thin films, i.e. thickness of order 5 x 10⁻⁵ cm. These pieces were frequently preserved, if, after beginning detachment by tearing, the process was completed by sliding in the edge of a piece of paper, and in this way specimens of a range of thickness down to 2 x 10⁻⁵ cm. were obtained, together with a few pieces too thin to show the colours of thin films, i.e. less than 10-5 cm.
The thickness of the specimens were determined approximately by visual observation in diffused daylight of the colours corresponding to normal and grazing emergence for both reflected and transm itted light.
on May 7, 2018http://rspa.royalsocietypublishing.org/Downloaded from

44 A. E. W. Austen and S. Whitehead
The corresponding wave-lengths were estimated and it was then generally possible to deduce the orders of the various interference colours and therefore the thickness. The order was confirmed, or if necessary, one of two possible values selected by examining in the approximately monochromatic light from a sodium flame, viewing the light transm itted normally and observing the changes of intensity on rotating the specimen to the position for grazing emergence.
The thicknesses were measured accurately (after the breakdown measurements, except in the case of two specimens less than 10~5 cm. thick) a t the National Physical Laboratory, by an optical method using a Fizeau interferometer. The average accuracy obtained was ± 3 x 10⁻⁸ cm., i.e. ±3% for the thinnest specimens, and one fairly large specimen was also measured by a mechanical method, the value of 6*10 x 10-5 cm. being in good agreement with the value of 6*09 x 10-5 given by the optical method. The thickness estimated from the colour of the specimens was in fair agreement with the optical measurements, the error being generally less than 10%.
Breakdown tests were made between an approximately plane electrode of polished steel mounted on the stage of a metallurgical microscope and a polished steel sphere of diameter 0*3 cm. on the lower end of a short, fairly stiff helical spring inserted in place of one objective in a double nosepiece. The spherical electrode could be raised by the microscope focusing movement and replaced by a 1 in. objective, which, together with a micrometer eyepiece giving a magnification of 40 diameters, made possible the location of the point of contact to an accuracy of 0*005 cm. which was adequate for selecting a suitable part of the specimen.
A D.C. voltage was applied at a rate such tha t breakdown occurred in about 30 sec. and the voltage was measured directly by means of an electrostatic voltmeter. I t was expected that a t the comparatively low voltages necessary to cause breakdown, discharges in the immersion medium, if they occurred at all, would be without effect on the breakdown voltage. This view was confirmed by breakdown measurements on one of the thicker specimens in air and also immersed in a mixture of castor oil and nitrobenzene of resistivity approximately 2 x 10⁸ ohm-cm., which had been shown to be a suitable medium in tests on thicker specimens. The value obtained was the same in both cases and the tests were therefore made in air.
A number of tests were made on each specimen and in most cases at least five values were obtained: the results are plotted in figure 4. The greatest difference from the mean value for any one specimen was 15%,
on May 7, 2018http://rspa.royalsocietypublishing.org/Downloaded from

while the dispersion was generally of order ± 8 % and satisfactory measurements were made down to a thickness of about 2 x 10⁻⁵ cm. Two thinner specimens of thickness about 10-5 cm. were measured a t the National Physical Laboratory, but considerable difficulty was encountered in manipulating them owing to their extreme fragility and tendency to adhere to any clean metal surface. One was broken into fragments too small for breakdown tests in placing it on the plane electrode and although a number
The electric strength of some solid dielectrics 45
18
17
16
§ Id
COoc i 14£b£)££ 13 Id .2t©©
u
10
9
30>J<106| I
mpulse
\10AA
I K
i A
thi
0 s
ckness i by inte
not checl rferomel
ked;er
i' / im
|v \ y
r < / , ■'M
V " ' / ' /
1 ?
' A&
i 10-14 ii3><106 V
;X<;nf
/ / * A ; . %
i' / / / , U p
1 thi
ckne
ss u
p to
i
T 0-
06 m
m.
1
9-11suslvolt
1
bainedages
(3 1 2 3 4 5 6 7x10
thickness (cm.)F igure 4. Electric strength of clear ruby muscovite mica,
x Indicates mean value. Vertical lines indicate range of dispersion.
of tests were made on the other, the breakdown voltage showed a very wide dispersion from 30 to 290 V and the measurements cannot be regarded as satisfactory.
Frohlich (as yet unpublished) has examined quantitatively the effect of thickness, concluding for mica th a t the mean free path is of order 5 x 10~7 cm. and th a t the electric strength should increase by 60 % at a thickness of order 5 x 10~5 cm. and by 100% at 2 x 10⁻⁵ cm. Figure 4 shows tha t the experiments are in satisfactory agreement with this result.
on May 7, 2018http://rspa.royalsocietypublishing.org/Downloaded from

46 A. E. W. Austen and S. Whitehead
(d) QuartzQuartz and fused silica (0-05- 0-1 mm. thick) were tested at room tem
peratures in a manner similar to potassium bromide. The observed value for quartz with the direction of the electric stress parallel to the optic axis was 6-7 x 10⁶ V/cm. and the value calculated by Frohlich 3-3 x 10® V/cm. with an upper limit of 7-4 x 10⁶ V/cm., a reasonably good agreement. According to the theory a disordered structure should increase the electric strength E , but allowance must be made for the decrease in the dielectric constant e when quartz is fused, from 4-6* to 3-9.* This may be corrected by the approximate formula f
Eoce —2-3.
The electric strength of a hypothetical quartz having the same e as the fused silica should therefore be 4-7 xlO 6 V/cm. (from the experimental results on quartz). The measured electric strength of fused silica is 5-4x10® V/cm. so that the disordered structure seems to increase the electric strength.
(e) GlassIf a conducting particle is placed in a dielectric subjected to an other
wise uniform electric field, the field strength in the vicinity of the particle is increased, and it was therefore expected that the electric strength of a dielectric containing metallic particles would be lower than tha t of the same dielectric without particles. I t was proposed to test this hypothesis by making tests on a glass the colour of which was due to the presence of colloidal metallic particles and on the corresponding basic glass, and also to verify that the increase of electric strength observed by von HippelJ for mixed crystals applied also to a glass containing a metal in true solid solution.
Samples of gold ruby glass, the colour of which is supposed to be due to the presence of colloidal particles of metallic gold, and a basic lead glass of identical composition § but without gold were specially prepared in the Department of Glass Technology, Sheffield University, by Professor Turner and Dr Seddon.
Tests made on ground specimens of the type used for potassium bromide gave unsatisfactory results which were attributed to flaws in the glass.
* These values were determined for the actual materials from which the specimens were made.
t See Frohlich (1939). J Yon Hippel (1935).§ Composition (calculated from ingredients) was S i02 47-36%, PbO 39-78%,
K20 10-05%, Sb2Os 1-93%, Fe20 3 0-10%, MnO 0-79%. The gold was estimated at 0*04 % in the coloured glass.
on May 7, 2018http://rspa.royalsocietypublishing.org/Downloaded from

Thin sheets were obtained by blowing on the end of a quartz tube in an electric furnace and satisfactory tests were made on specimens of thickness from 3 x 10⁻⁴ cm. to 15 x 10~4 cm. between sphere and plane electrodes in an immersion medium of resistivity 108 ohm-cm. The thickness was measured in situ on the dial micrometer which was used for supporting the electrodes. The dispersion was rather large, the mean of all values for the basic glass being 5-2 x 10~6 V/cm. and the mean of the maximum values for each specimen 6-0 x 106. The corresponding results for the basic glass were 5*0 x 10® and 6*0 x 10® V/cm. respectively.
This value is much higher than those previously obtained, e.g. it is about double the value given by Moon and Norcross (1929), and the discrepancy is probably due to the unsuitable electrode systems and/or immersion media used hitherto.
The failure of the gold to produce any measurable decrease of electric strength is probably due to the small size of the colloidal particles. I t is improbable that they are of linear dimensions greater than 2 x 10⁻⁵ cm., and if they are assumed to be spherical, although the mean field would be increased to 3 Eat the surface of each sphere, the increased field is maintained only ovbr a distance comparable with the radius of the particle: thus at a distance of 10~5 cm., the field would not exceed 1*25 E. The theory and experimental results on thin layers of mica indicate that breakdown can occur in an electron path of this length only at considerably increased fields.
In view of this negative result and the difficulty of making reliable measurements on glasses made in small batches it was decided not to examine coloured glasses of the solid solution type. The change of electric strength would, in any event, be small since the amount of metal which may be introduced is minute.
(/) Organic dielectricsA brief note is given of the behaviour of more complex organic dielectrics
as employed for industrial electrical insulation which show properties different from those of the preceding materials. The tests to be quoted were made on synthetic resin (Bakelite), shellac, bituminous and natural resin oil varnishes, the last two containing, however, a small addition of synthetic resin. Films of these varnishes were cast on tin foil on which small spherical projections had previously been formed. After appropriate heat treatment the tin foil was dissolved in mercury leaving a film of varnish containing a number of spherical recesses and forming thus a multiple specimen of the type already described. The recesses were sprayed on both sides with
The electric strength of some solid dielectrics 47
on May 7, 2018http://rspa.royalsocietypublishing.org/Downloaded from

48 A. E. W. Austen and S. Whitehead
colloidal graphite to form the conducting coatings. The samples were not immersed directly in liquid nitrogen since the rapid cooling caused the films to crack, bu t were tested by a method similar to th a t employed for mica, using iso-pentane as ambient medium a t low tem peratures, and transformer oil a t other temperatures.
F igure 5. Electric strength o f varnish films. A, clear baking oil varnish (0-03— 0-05 mm.). B , shellac (dewaxed lemon) varnish (0-005—0-05 mm.). C, bituminous baking varnish (0-03—0-05 mm.). D , bakelite varnish (0-03—0-05 mm.). Curves are drawn through mean values. Vertical lines represent dispersion from mean to maximum.
The results are shown in figure 5 and indicate th a t the electric strength of these dielectrics decreases very greatly but in a somewhat irregular manner with increase of temperature. I t is noticeable th a t a t 80° K the electric strength is as high as th a t of some micas although much less a t room temperatures. I t is difficult to explain such an effect in any simple way on the basis of the theory of electronic breakdown as advanced and speculation must be deferred until pure organic dielectrics of known simple structure have been studied.
on May 7, 2018http://rspa.royalsocietypublishing.org/Downloaded from

Acknowledgements are due to the Director of the Electrical Research Association for permission to publish this paper, to Dr Bragg (then Director) and members of the staff of the National Physical Laboratory for checking the thickness of the thin mica specimens and for the impulse voltage and X-ray data on mica extracted from National Physical Laboratory reports; to Professor Mott and Dr Frohlich for their advice and for their good offices in obtaining the potassium bromide crystal; to Messrs Thermal Syndicate, Ltd., for the specimens of fused quartz.
The authors also wish to express their appreciation of the assistance of their colleagues Mr A. M. Thomas, Dr W- Hackett and Miss M. V. Griffith.
The electric strength of some solid dielectrics 49
Summary
Intrinsic electric strength, a property of homogeneous solid dielectrics, is defined and methods of measurement suitable for a wide range of materials and conditions are described.
A comparison of experimental results with Frohlich’s theory yields the following conclusions:
(а) The electric strengths of mica, quartz, potassium bromide and (from von Hippel’s work) other alkali halides agree with the theory, though the limits of uncertainty due to lack of infra-red data for the first two are rather wide.
(б) The effect of temperature on the electric strengths of mica and potassium bromide agrees qualitatively with the theory, while for mica the agreement is also satisfactory quantitatively.
(c) The electric strength of mica increases when the thickness is reduced to the order of a few mean free paths and the agreement is quantitative to the accuracy with which calculation is possible. Indirect corroboration of the existence of this effect is afforded also by the absence of effect of colloidal metallic particles in glass.
(d) Fused quartz has a relatively higher electric strength than crystalline quartz corresponding to the prediction of the theory tha t disorder increases the electric strength. Experiments on mica indicate that, as the theory suggests, the electric strength is not sensitive to microstructure.
In addition the electric strength of mica decreases above 400° K, and complex organic dielectrics show a decrease of strength with increase of temperature; Frohlich’s theory does not apply in these cases.
Vol. 176. A. 4
on May 7, 2018http://rspa.royalsocietypublishing.org/Downloaded from

50 A. E. W. Austen and S. Whitehead
R eferences
Austen and Hackett 1939 Nature, Lond., 143, 637. . .Davis and Lacey 1939 Conference Internationale dee Grands Reseaux a
Haute Tension, no. 304. Paris.Frohlich 1937 P toc. Roy. Soc. A, 160, 230.
—— 1939& P toc. Roy. Soc. A, 172, 94.— 19396 Phys. Rev. 56, 349.
Frohlich and Mott 1939 P toc. Roy. Soc. A, 171, 496. v. Hippel 1931 Z. Phys. 67, 707.
— 1933 Z . Phys. 68, 309.*— 1935 Ergebn. exakt. Naturw. 14, 79.— 1939 Phys. Rev. 56, 941.
Joff6 and Alexandrow 193a Phys. Z . Sowjet. 2 , 527.Moon and Norcross 1929 J * Franklin Inst. 208, 705.Seeger and Teller 1939 Phys. Rev. 54, 515.Semenoff and Walther 1928 Die Physikalischen Orundlagen der electrischen Festig-
keitslehre. Berlin.Zener 1924 P toc. Roy. Soc. A, 145, 523.
Melting and crystal structure
B y J . W. H. Oldham and A. R. Ubbelohde The Davy Faraday Laboratory, The Royal Institution
( Communicated by Sir William Bragg, P.R.S,— Received 27 February 1940)
The role of various types of lattice flaws is discussed in their bearing on melting and crystal structure. Freezing-point determinations on lattices of a single molecule indicate the presence of such flaws in the crystals of polymethylene compounds. Freezing-point determinations on composite lattices of ketone + paraffin and ketone + ketone emphasize the importance of the rotation of the CO group for melting, and indicate that lattice holes are easily formed, without marked lowering of the freezing-point. Ordered composite lattices are formed when the number o f holes does not exceed 12 % of all the methylene groups.
The results emphasize the importance of co-operative effects in lattice flaws. In the equilibrium state of a crystal, such flaws might arise both from energy effects at 0° K, expecially in metals, and from energy and entropy effects at higher temperatures. A picture of melting is suggested in which a network of Co-operative flaws breaks up the crystal into a mosaic, or aggregate of crystalline micelles, and in which the solid-liquid transition is comparable with a gel-sol transition.
Two main approaches have been explored in the discussion of melting.As the temperature of a crystal is raised, the heat motions of the molecules
on May 7, 2018http://rspa.royalsocietypublishing.org/Downloaded from