www.burkenroad.org source: continental magazine market signals
TRANSCRIPT

www.burkenroad.orgSource: Continental Magazine
MARKET SIGNALS

www.burkenroad.org
Disclaimer
THE MATERIAL COVERED IN THIS PRESENTATION IS THE
OPINION OF THE PRESENTER AND SHOULD NOT BE
CONSTRUED AS A RECOMMENDATION TO BUY OR SELL
ANY OF THE SECURITIES MENTIONED. INVESTORS SHOULD
SEEK THE COUNSEL OF THEIR FINANCIAL ADVISOR
BEFORE MAKING ANY KIND OF INVESTMENT. THE
PRESENTER MAY OR MAY NOT HOLD LONG OR SHORT
POSITIONS IN ANY OF THE SECURITIES MENTIONED.
www.burkenroad.org

www.burkenroad.org
Darts vs. Professional Stock Pickers

www.burkenroad.org
Oil
Often Overlooked Oil
Oil Wells
www.burkenroad.org

www.burkenroad.org
Dreco Energy Services Price Graph
31 May 26June 26th July 23rd Aug 20th Sept. 19th Oct. 15th Nov 29Nov
www.burkenroad.org

www.burkenroad.org
Celebrity Stock Picks – Beat Mike
www.burkenroad.org

www.burkenroad.org
Recession Chances
• What is a Recession?
- Two consecutive quarters of negative GDP growth
• Will it Happen?
• Bears say “yes” – Credit Crunch and Housing Worries Will Zap U.S. Consumer Spending

www.burkenroad.org
But, Remember
• Exports continue to grow at 15 -20% per year.
• The weak dollar will bring a surge in U.S. manufacturing.
• Business spending (unlike consumer spending) is still pretty resilient
• Sub-Prime “resets” peak by mid-2008

www.burkenroad.org
A Typical Recession
• Averages 10 months in length• Economic activity declines by 2.5%• Unemployment rises by 2%• - If unemployed, the average tenure is six
weeks. • We’ve had two recessions in the last 25
years. (early 1990’s and 2000 – 2001)• They always end and the economy always
rises to a higher plateau.

www.burkenroad.org
Stimulating Enough?
$170 Billion Proposed Stimulus Plan
$500 Billion Money Taken From Home
Equity Loans in 2005

www.burkenroad.org
Solving Sub-Prime
We’re doing all the right things.
• Stronger firms buying out weaker firms
• Firms are “’fessing up” to valuations and losses.
• Fed cutting interest rates

www.burkenroad.org
The Fed’s Game of “Whack- A-Mole”*
The Fed will probably bail out these sub-prime mess, but…..
The Next bubbles to deal with –
- Commodities?
- Global Stocks?
- Currencies?
*Quote from Yardeni & Assoc.
www.burkenroad.org
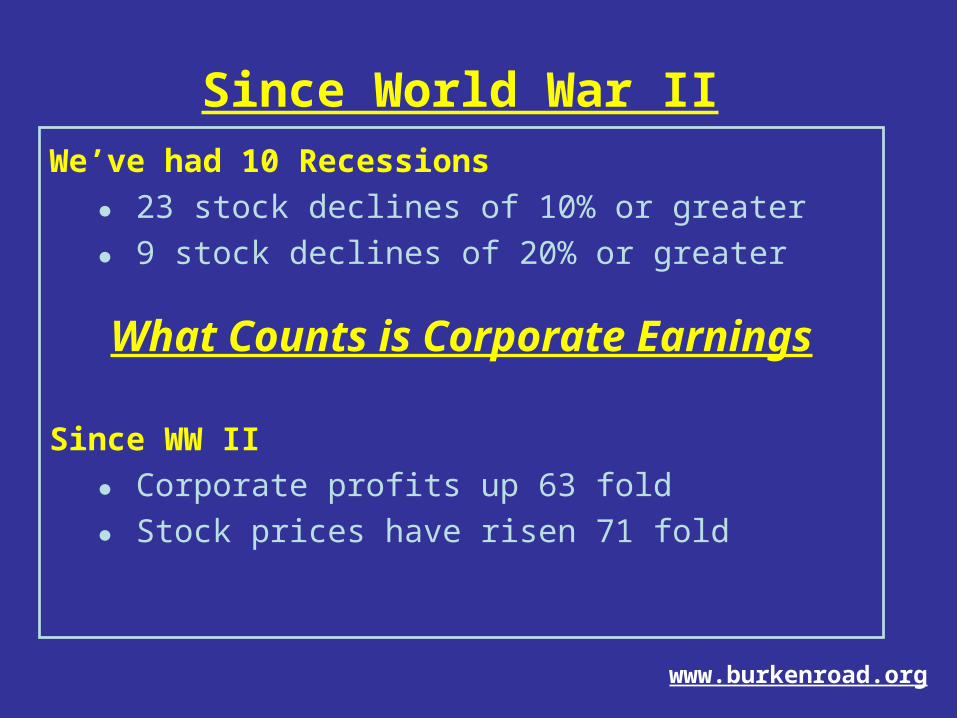
Since World War IIWe’ve had 10 Recessions
23 stock declines of 10% or greater
9 stock declines of 20% or greater
What Counts is Corporate Earnings
Since WW II
Corporate profits up 63 fold
Stock prices have risen 71 fold
www.burkenroad.org
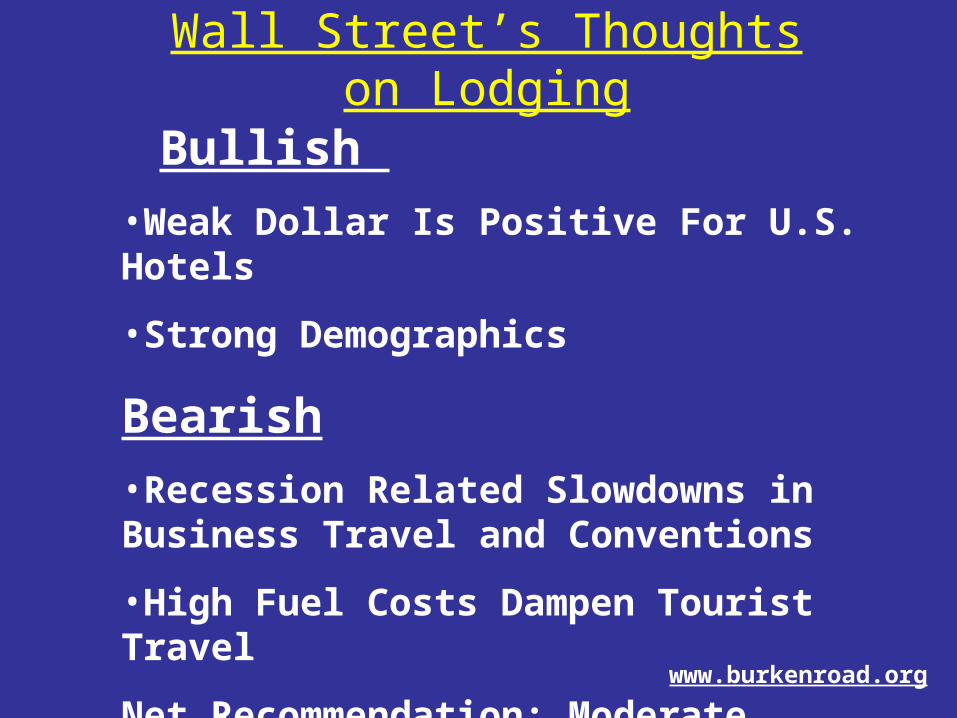
Wall Street’s Thoughts on Lodging
Bullish
•Weak Dollar Is Positive For U.S. Hotels
•Strong Demographics
Bearish
•Recession Related Slowdowns in Business Travel and Conventions
•High Fuel Costs Dampen Tourist Travel
Net Recommendation: Moderate Outperform

www.burkenroad.org
Hang In There
Over the past 30 years the stock market has produced an average annual rate of return just under 11%.
If you were out of the market during the best 30 months your return would drop to just 3%.

www.burkenroad.org
Sources of Long-Term Performance
Stock, Fund or Money Manager
Selection5-10%
Asset Allocation90-95%
Portfolio Rebalancing Makes a Big Difference

www.burkenroad.org
Lou Dobbs Hosts Moneyline From Window Ledge
Source: www.theonion.com
HEADLINE:
www.burkenroad.org
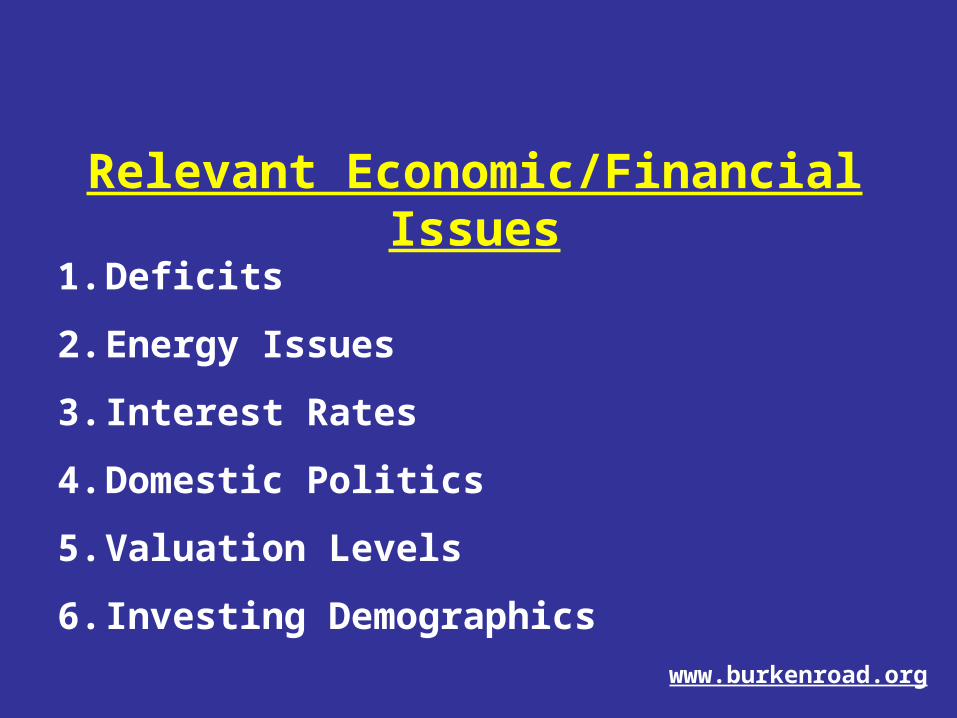
Relevant Economic/Financial Issues
1. Deficits
2. Energy Issues
3. Interest Rates
4. Domestic Politics
5. Valuation Levels
6. Investing Demographics
www.burkenroad.org
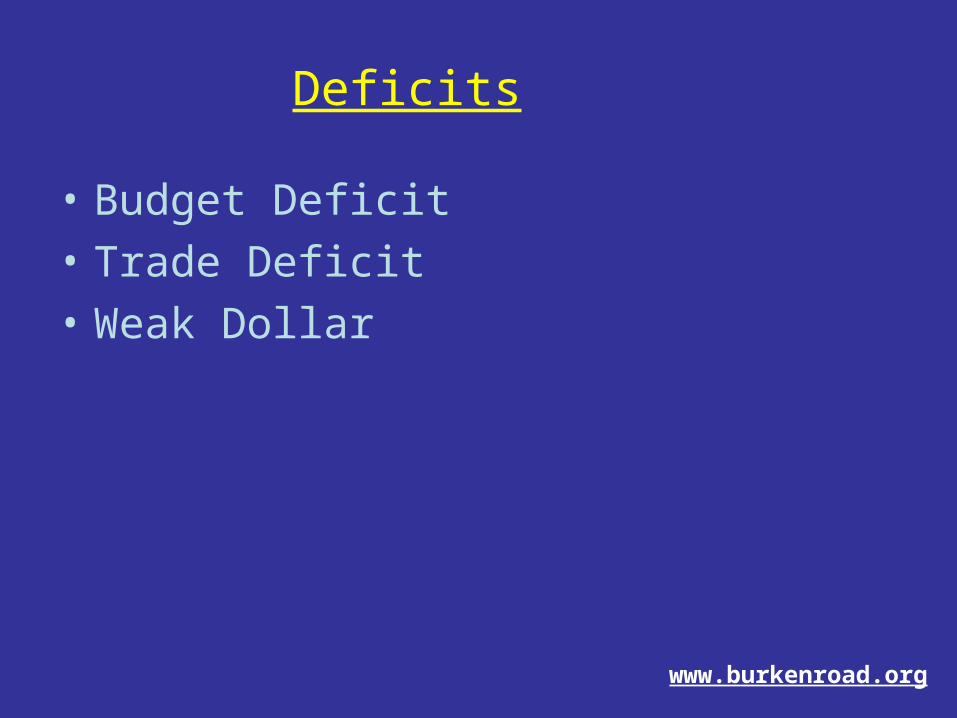
Deficits
• Budget Deficit
• Trade Deficit
• Weak Dollar
www.burkenroad.org
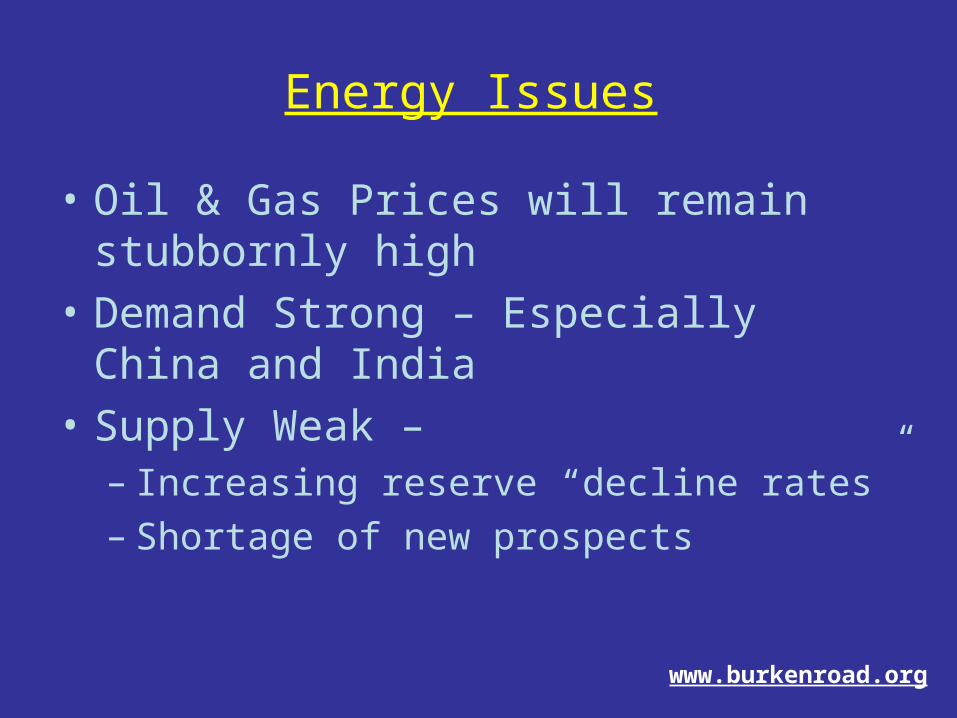
Energy Issues
• Oil & Gas Prices will remain stubbornly high
• Demand Strong – Especially China and India
• Supply Weak – – Increasing reserve “decline rates”– Shortage of new prospects

www.burkenroad.org
New Refineries?
- NIMBY
- BANANA
- NOPE

www.burkenroad.org
Pricing: Oil vs. Natural Gas
•Historically, a barrel of oil has sold at 6-8 times the price of and mcf of natural gas.
•The difference can be accounted for by:
•The weakness of the U.S. dollar
•Supply fears (Geopolitical, hurricanes etc.)
Note: There seems to be an inverse relationship between oil prices and world peace.

www.burkenroad.org
Gulf Coast Wetlands
Of Critical Importance:
•1/3 of the nation’s energy production
•Bulk of Country’s refining capacity
•30% of America’s Seafood
•South Louisiana is the Nation’s largest port
•Wetlands are a buffer against storms

www.burkenroad.org
The Yield Curve As Prophet
Fall 2000
3 month 6.00% 10 year 5.70%
Slope -30 basis points
Predicting a sharp decline in corporate earnings.
Summer 2003
3 month 0.95% 10 year 4.35%
Slope +340 basis points
Predicting a huge increase in corporate earnings growth
Spring 2006
3 month 5.10% 10 year 4.50%
Slope -60 basis points
Projected and end to double digit EPS growth.

www.burkenroad.org
Yield Spreads Tell The Story

www.burkenroad.org
Stocks Told The Same Story
• Fall of 2000: Consumer packaged goods stocks outperformed the market by about 30%. The Economy then began to slow.
• Summer of 2006: Consumer packaged goods stocks outperformed the market by about 30%. What Now?

www.burkenroad.org
Stock Market and Business Cycle
Many stocks are cyclical in nature. They tend to perform better in specific stages of business cycles. Forecasting these cycles can help to put you in the right stocks
at the right time.
Source: Fortune Magazine: 3/21/94
Consumer Staples Excel

www.burkenroad.org
Small Businessman Conducts Business on
Miniature Golf Course
Source:
www.theonion.com
HEADLINE:

www.burkenroad.org
Domestic Politics
The first year of a presidential term is usually worst for stocks.
Ranking
-Third year is best
-Fourth year is second best
-Second year is third best

www.burkenroad.org
Presidential Race 2008
• Like no other
• No sitting president or vice president is running
• We’ve had a Bush or a Clinton on the ticket since 1980

www.burkenroad.org
Federal Reserve Valuation Model
=
=
*Forecasted 12 month EPS. 4/03/08
$90.00*
1365.00
EPS for S&P 500
Price of the S&P 500Yield on 10 Year Treasury Note
6.60%
The 10 yr. Treasury Currently Yields 3.60%

www.burkenroad.orgSource: Yardeni & Associates
Valuation Model

www.burkenroad.org
Mason-Dixon Line Renamed
IHOP-Waffle House Line
Source: www.theonion.com
HEADLINE:

www.burkenroad.org
Today’s Public Companies
• Clean Balance Sheets
• Lots of Cash– Share Buybacks– Increased Dividends– Mergers and Acquisitions– Public Companies Going Private

www.burkenroad.org
Fewer Shares Outstanding

www.burkenroad.org
Investing Demographics
• “The Pig and the Python”
• Very high birth rates from 1946 – 1964
• Investing Concepts
- Financial Services
- Healthcare
- Leisure

www.burkenroad.orgSource: Wells Capital
Management

www.burkenroad.org
HEADLINE:Single Woman Meets
“Slightly Imperfect” Man At Outlet Mall

www.burkenroad.org
Over the Past Eight Years
• S&P 500 has been basically flat
But, ….
• Earnings have risen by 70%
• Long-term opportunity costs of capital has fallen by 40%
• Bullish scenario?
www.burkenroad.org
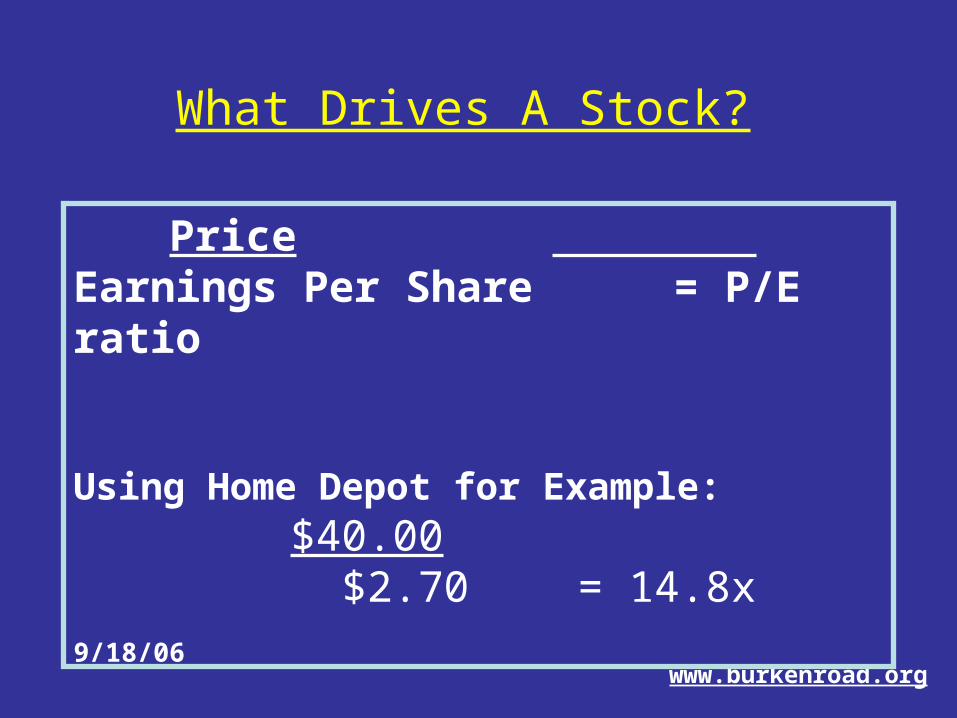
What Drives A Stock?
Price Earnings Per Share = P/E ratio
Using Home Depot for Example: $40.00 $2.70 = 14.8x
9/18/06

www.burkenroad.org
How P/E Works
Variable Effect on P/E
Earnings Volatility The higher the volatility, the lower the P/E
Interest rate Trends The higher the interest rate level, the lower the P/E
Earnings Growth The greater the growth rate, the higher the P/E
P/E ratios of similar stocks
The higher the P/E of similar stocks, the higher the P/E of the given stock
EPS Predictability/Visibility
The greater the predictability and visibility of EPS the higher the PE.
Leverage The higher the leverage, the lower the P/E
P/E of the market The higher the market’s P/E, the higher the company’s P/E
www.burkenroad.org

www.burkenroad.org
Wal-Mart Stock Graph

www.burkenroad.org
Wal-Mart StockP/E’s vs. Earnings Per Share
2007 $43.00 = A PE of 13.0x
$ 3.30
2001 $43.00 = A PE of 29.0x
$ 1.50
The stock has remained flat as EPS growth has mirrored the decline in its PE ratio.
In 2001 Wal-Mart shares were “ahead of themselves”
www.burkenroad.org
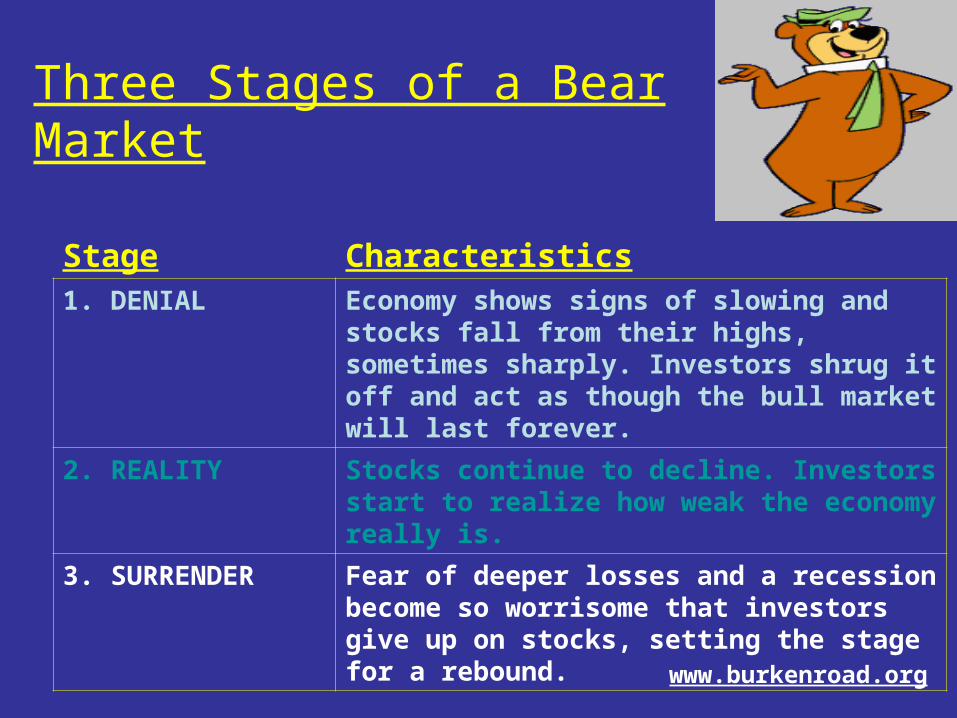
Three Stages of a Bear Market
Stage Characteristics1. DENIAL Economy shows signs of slowing and stocks fall
from their highs, sometimes sharply. Investors shrug it off and act as though the bull market will last forever.
2. REALITY Stocks continue to decline. Investors start to realize how weak the economy really is.
3. SURRENDER Fear of deeper losses and a recession become so worrisome that investors give up on stocks, setting the stage for a rebound.

www.burkenroad.org
It’s Not A Stock Market…
It’s a Market of Stocks

www.burkenroad.org
Important Issues
• Favorable Demographics
• Sour, Bumpy Financial Markets
• Troubles in the Housing Market
• Changes to Pension Plans

www.burkenroad.org
Great ReadingPopular Books
One Up On Wall Street, Peter Lynch (Simon & Schuster)
A Zebra in Lion Country, Ralph Wanger (Simon & Schuster)
The Money Masters, John Train (Harper & Row)
Analytical Books
The Intelligent Investor, Benjamin Graham (Harper & Row)
Security Analysis, Benjamin Graham (McGraw-Hill)
Sophisticated and Well Written
Common Stocks and Uncommon Profits, Phillip A. Fisher (Harper & Row)
The Contrarian Investment Strategy, David Dremen (Random House)
Oldies but Goodies
Reminiscences of a Stock Operator, Edwin Lefevre (George H. Doran)
Extraordinary Popular Delusions & the Madness of Crowds, Charles
MacKay (L. C. Page & Co.)

www.burkenroad.org
www.burkenroad.org