mining
TRANSCRIPT

271
Gésner J. I. dos Santos et al.
REM: R. Esc. Minas, Ouro Preto, 67(3), 271-277, jul. sep. | 2014
Abstract
The risks in the evaluation of mining projects are directly related to the prob-ability of errors in the estimates, and, as the estimates are based on sampling results, this activity must be performed in a careful and planned way, to prevent surprises at the beginning of operation. To validate the representativeness of the borehole samples selected for the mineral processing studies, the geological resources evaluation team proposed a methodology based on the utilization of statistical analyses that, beyond considering the spatial distribution of the samples in the deposit, also assessed if they are representative of the populations under investigation. With this data, the geologist is able to make a fast analysis of the sampling’s representativeness.
keywords: sampling, representativeness, iron ore.
Resumo
Os riscos na avaliação de projetos mineiros estão diretamente relacionados à probabilidade das estimativas falharem e, como as estimativas são realizadas a partir de resultados de amostragens, essa atividade deve ser realizada de forma criteriosa e planejada, para se evitararem surpresas no início da operação dos projetos. Para validar a representatividade de amostras de furos de sonda selecionadas para estudos de processamento mineral, a equipe de geologia de avaliação de recursos propôs uma metodologia baseada na utilização de ferramentas de análise estatística, que além, de considerar a distribuição espacial dessas amostras, no depósito, analisa se elas são representativas das populações estudadas, permitindo ao geólogo fazer uma análise rápida da representatividade amostral.
Palavras-chave: amostragem, representatividade amostral, minério de ferro.
Gésner J. I. dos SantosGeólogo Gerência Geral de Geologia
e Planejamento de Mina, Vale SA.
Diniz T. Ribeiro Dr. Geólogo/Geoestatístico,
Gerência de Modelagem Geológica
e Planejamento de Mina,
Diretoria de Planejamento
de Ferrosos – Vale SA.
Carlos Alberto PereiraDr. Professor do Departamento
de Engenharia de Minas da UFOP
Methodology for selection of samples from borehole probe for technological characterization of iron oreMetodologia para seleção de amostras de furos de sonda para caracterização tecnologica de minério de ferro
MiningMineração
1. Introduction
Sampling is a sequence of operations performed with the objective of removing a representative part of its surroundings, called primary or global sampling. This process is necessary throughout the life of a mining venture. Its use in mining begins with the preliminary steps of geo-
logical exploration, and continues for the resource reserves evaluation phase, mine planning, mine and power plant opera-tion, laboratorial quality control, tailings level control, final product qualification, contaminant monitoring of the burden pile, springs, dams and finally, mine clo-
sure monitoring. At all stages, representa-tive samples are fetched that serve as the basis for specific studies in various areas. The big challenge is to collect the so-called "representative sample".
Agricola (1556) has already said that "a mining company that is ignorant
272
Methodology for selection of samples from borehole probe for technological characterisation of iron ore
REM: R. Esc. Minas, Ouro Preto, 67(3), 271-277, jul. sep. | 2014
and inexperienced in the art of mining, digs a mineral occurrence without care-ful discrimination, while one that has experience and knowledge, first acquires samples and proves the mineral’s exis-tence, and when very narrow / wide and solid veins are found, works only those that will produce economic returns.”
A sampling theory proposed by Pierre Gy (1955), tackles the issue of sampling representativeness. According to Gy, there is no way of knowing whether a particular sample is representative of its surrounding by only using sampling process surveillance or characterization of the sample itself. A sampling procedure done with quality is able to recognize the samples as being representative of the situation.
The sub or super sizing of equipment projected for usage in a power plant is a very common mistake and inadequate sampling can be its cause. Studies done for this purpose are usually conducted from samples of evenly-spaced boreholes, whose mass is little representative of the total ore deposit (resource or reserve). Many projects are designed based on insufficient information, and can generate high equipment adaptation costs because the equipment proved to be inappropriate for the type of deposit.
The risks in the evaluation of mining projects are directly related to the prob-ability of errors in the estimates. . As the estimates are taken from the sampling results, this activity should be judicious and well-planned, to avoid surprises at the beginning of the operation of the projects.
This type of surprise is common in the mineral sector. Burmeister (1989) examined 35 Australian gold mine op-erations initiated in the period between 1984 and 1987 and found that 23 of them did not reach the expected produc-tion in the first year of operation. Those that exceeded their production goals an-ticipated improvements in the processing plants. Only two of the 35 reached the projected content recovery; those that didn’t noted that the reasons for the differ-ences between planning and production levels included excessive dilution, inap-propriate estimative planning techniques, inappropriate geological interpretation, questionable chemical analysis and insuf-ficient probing.
Clow (1991) examined 25 advanced gold projects in Canada and found that only three had achieved their expecta-tions. For the author, the main reason for the failures was incorrect resource estima-tion due to factors mentioned below:
i. poor data management;
ii. inappropriate treatment of high level values (outliers);
iii absence of large-volume samples;iv. geostatistical application errors;
andv. inadequate assessment of the dilu-
tion and mining methods.Another similar example was the
study by Harquail (1991) about North American gold mines. It detected 39 types of design flaws, 20 of which were due to aspects related to reserve assessments, including basic sampling errors and lack of mining knowledge. He noted that most of the failures occurred mainly because the expected production levels were not achieved and/or the inadequate process-ing methods used for ore-poor mining generated high operational costs. Other authors attributed the unexpected results of mining projects to inexperience in mine development, and the deficiency of geology studies and financial engineering that support production decisions (Vallee et al., 1992).
Most of the problems identified by these authors are related to the estima-tion of Mineral resources and reserves, which is obtained from sample data. It can be concluded that a poorly projected estimate of resources and reserves can lead to serious economic consequences.
2. The sampling theory of Gy and sampling representativeness
Sampling is a complex selection process. According to Gy (1976), a selection process can be characterized in terms of a priori and a posteriori qualities.
A priori qualities meet the follow-ing conditions:
The selection process is said to be:- “probabilistic” - when each ele-
ment of the batch has the probability of being selected.
- “non-probabilistic” - if the batch elements do not meet the “probabilistic” condition. For example, the selection method of selection that uses a hammer and shovel is based on a pre-defined selection of material and is a non-probabilistic method. These methods are generally very biased and must be rejected since they do not permit a theo-retical approach.
-“correct” - when all elements in the
batch are subjected to selection, and have an equal probability of being selected.
- “incorrect” - when it does not meet the condition of equal probability.
A posteriori qualities are based on the results of the selection and more specifically on the statistical properties of the selection error e in relationship with the difference between the critical content aE of sample E and the critical content aL of the batch sample lot L:
e = (aE - aL) / aL
The selection process is said to be: “unbiased” - when the average m check error is nil:
m (e) = 0 → m (aE) = aL
(1)
(2)
“biased” or “skewed” - when the average error is not null. The average value is the bias B or systematic relative error:
B = m (e ) ≠ 0 → m (aE) ≠ aL (3)
“reproducible” - when the selection’s er- ror variance is not greater than the given "reproducibility standard deviation σ20:
σ2(e) ≤ σ20 (4)
273
Gésner J. I. dos Santos et al.
REM: R. Esc. Minas, Ouro Preto, 67(3), 271-277, jul. sep. | 2014
m (e) = 0 e σ2(e)
m (e) = 0 e σ2(e) ≤ σ20
m (e2) = m2(e) + σ2(e) ≤ R20
“accurate” - when the mean and varian- ce of the error of selection is always null:
“needed” - when at the same time it is reproducible and unbiased:
“representative” - when the mean square of the error does not exceed the
standard deviation of representativeness R2
0:
(5)
(6)
(7)
In practice, the only a posteriori quality feature that can be achieved is the “representative”. Precision and
accuracy are achieved only at the limit. The theory of sampling can also be con-sidered as the search for relationships
between the conditions and the results of a sampling, i.e. between its qualities a priori and a posteriori.
3. Sampling in iron ore projects
Various types of sampling for differ-ent purposes make up the database used by mining companies. The database used in the evaluation of geological reserves and resources in the study of mineral processing (grinding, sieving, flotation, gravimetrics, magnetic separation, etc.) is formed usually from probing samples and represents the main group of samples that impacts on decision-making of the companies in the mineral sector.
Big mining companies use the large diameter probe to collect samples in bulk for processing trials and metallurgical tests. Sometimes it is difficult to perform this type of sampling because of the dif-ficulty in allocating qualified companies and low equipment availability.
Another large-volume sampling practice adopted is the opening of small
pits or galleries for experimental workings and ore treatment on a pilot scale. In this case, the environmental constraints have been a major problem for the collection of samples with representative volumes.
Direct access to the mineral body is given by outcrops, galleries, research wells and boreholes. Each of these "fronts" of research carries factors affecting the rep-resentativeness of the samples, mainly due to the collection methods that permit sam-pling in different volumetric brackets. In the case of boreholes, the small mass of the samples provides the information almost immediately. Factors related to sample mass, probing recovery, nugget effect, rock density, contents and granulometry can generate possible errors, which in turn, depend on sampling support.
At Vale, a large Brazilian mining
company, the main means of collecting large volume samples are galleries, re-search wells and samples taken at the min-ing front. Boreholed samples have already been used for several mineral processing studies and the evaluation of resources and reserves. Other types of sampling results are also stored in the database at Vale: handheld, for qualitative assessment of the levels of rocks on the surface; boreholes (or reverse circulation diamond); channel samples; etc.
Samples are used in various types of studies, among which the following stand out: density; granulometric and chemical variability; mineralogical characteriza-tion; technological characterization; pilot tests for definition of process routes; simulation of operational parameters for the plant; thickening tests; etc.
4. Selection Methodology of borehole samples for mineral processing studies
Technological characterization studies of ore types are very important in the development of new projects, ex-pansion projects, and definition of plant and route process suitability. The results obtained are also used in equipment siz-ing and other operational parameters, prediction of ore behavior in the mill, mass balance, tailings characterization, ROM degradation studies, and product predictability, among others.
Until mid-2009, there was no de-fined methodology for the selection of samples. Each sampling was performed empirically with criteria depending on the study’s objectives. Its analyses observed only if the average of the population levels were close to the average of the selected samples considered to be the historical
population average (previous samples), in an attempt to find a parallelism be-tween the proportions of each lithotype in relationship with the resources or re-serves in order to determine the number of specimens to be collected. Also, there was no check performed between the selected samples and the surroundings from which they were extracted. To try to minimize possible errors in the defini-tion of projects for power plants caused by inadequate or poorly representative sampling, a methodology is proposed, based on the use of analytic statistical procedures such as histograms and QQ-Plot (quantile-quantile plot) graphs for the validation of the sample selection.
The histogram represents a prob-ability distribution function (fdp) dis-
cretized from a particular variable. If this function is representative, the occurrence frequency data can be measured as a func-tion of the class interval variable itself, for certain volumetric support. These func-tions can be represented by accumulated frequencies associated with cut-off values (fdpc, cumulative histograms). In the case of iron ore, for example, the frequency curve of the data registering iron levels above various cut-off levels is called the parameterizing curve and serves to quan-tify the resource or reserve for a given volumetric support (sample, block, etc).
As a sample of this process, consider the parameterization curve calculated with all samples as being representative of the deposit (total curve). This curve is made for each specific lithological group
274
Methodology for selection of samples from borehole probe for technological characterisation of iron ore
REM: R. Esc. Minas, Ouro Preto, 67(3), 271-277, jul. sep. | 2014
taking into consideration the effects of the spatial groupings of the samples and techniques applied for ungrouping. The subset of samples collected for the char-acterization process should have a param-eterization curve that represents the full curve and thus the curve for a particular lithological group in the deposit. For each percentile calculated by the total curve, there is a cut-off value. Similarly, for the curve representing the sampling process, there should be cut-off values associated with the aforementioned percentiles. With this data, a chart comparing the cut-off values of the two curves, associated to the same percentiles can be assembled and plotted in in a scatterplot (QQ-Plot). If the two curves are similar, the cut-off values in the same percentile should be
close and the scatter plot points should approximate a straight line identity with the bisect passing through the origin with an angular coefficient of 1.
This technique is often used to compare types of experimental theoretical probability distribution (Gaussian distri-bution, for example).
The proposed methodology follows the following scheme:
1) a sampling request is made by the area responsible for processing, including studies with quality specifications and types to be sampled;
2) selection is made by a geological team from the probing database, taking into consideration the spatial distribution of samples throughout the mine pit, as well as their representativeness in relation
to the geological reserve resources; 3) representativeness of the samples
is validated in relation to required qual-ity and is performed using statistical analysis tools;
4) a list of samples selected for the location and subsequent collection is submitted;
5) specimens are sent to mineral processing.
The following are two examples of application of the methodology. The first example was to check the sampling performed for variability studies at the Brucutu Mine in 2007. At that time the methodology in question did not exist. Tables 01 and 02 display the values of the geological resources and the mining sequencing between 2011 and 2015.
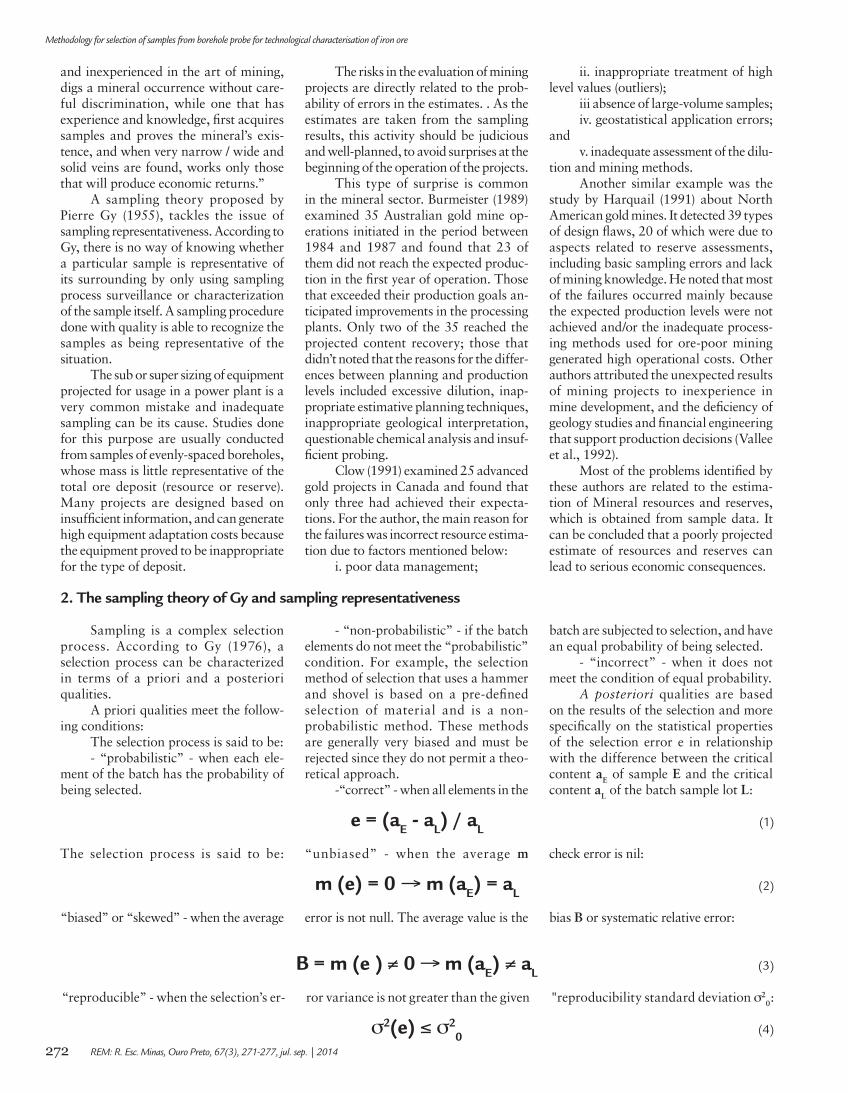
Lithology Code Fe% Mass (Ton)
Canga CG 62.00 80,997,000
Aluminous Hematite HAL 6200 5,512,000
Compact Hematite HC 64.00 97
Friable Hematite HF 62.00 88,473,000
Goetitic Hematite HGO 62.00 12,230,000
Aluminous Itabirite IAL 34.60 44,693,000
Compact Itabirite IC 35.30 141,206,000
Friable Itabirite IF 41.50 1,356,857,000
Friable Itabirite high content IFR 55.20 137,154,000
Goetitic Itabirite IGO 47.10 129,001,000
Maganesifere Itabirite IMN 31.90 46,806,000
Total 2,042,947,097Table 01Geological Features of Brucutu Mine (2007 Model).2 042 947 097 Bton
Global Content
Plan Fe% Si% Al% P% Mn%
2011 57.89 13.34 1.37 0.031 0.059
2012 49.62 25.75 1.18 0.031 0.081
2013 49.77 25.59 1.21 0.032 0.098
2014 49.88 25.62 1.20 0.030 0.107
2015 49.72 26.17 1.15 0.027 0.098Table 02Mining Sequencing of Brucutu Mine.
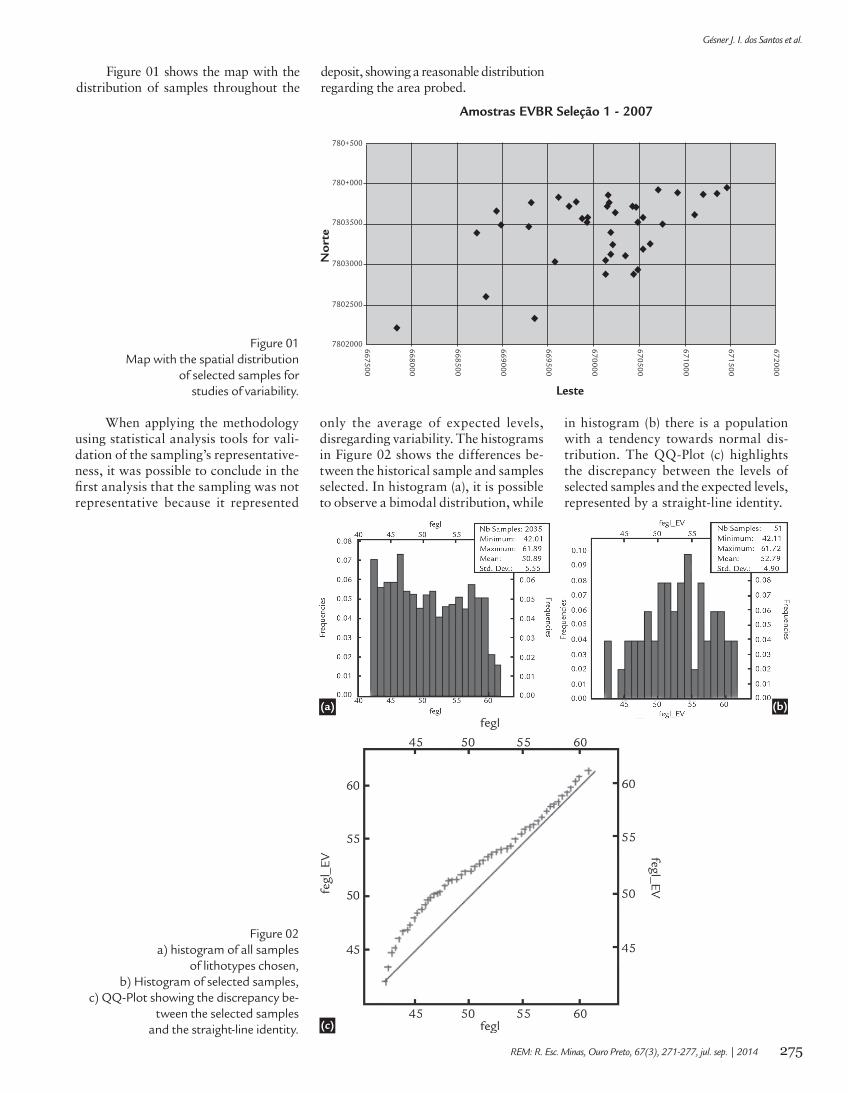
For the specifications of the selected samples, a consultation was held for short-term planning regard-ing sampling at the Brucutu Mine to define the types of itabirite ore
to be considered: IAL (aluminous Itabirite), IF (Friable Itabirite), IFR (friable Itabirite high content) and IGO (goetitic Itabirite). Consulta-tion was also made for long-term
planning regarding the cut-off val-ues that were set at Si02 < 27% and Fe > 42%. In this way the follow-ing ranges have been defined by lithology levels:
Litologia Range of contents
IAL 45% < Fe < 60%
IF 47% < Fe < 55%
IFR 50% < Fe < 62%
IGO 42% < Fe < 62%
275
Gésner J. I. dos Santos et al.
REM: R. Esc. Minas, Ouro Preto, 67(3), 271-277, jul. sep. | 2014
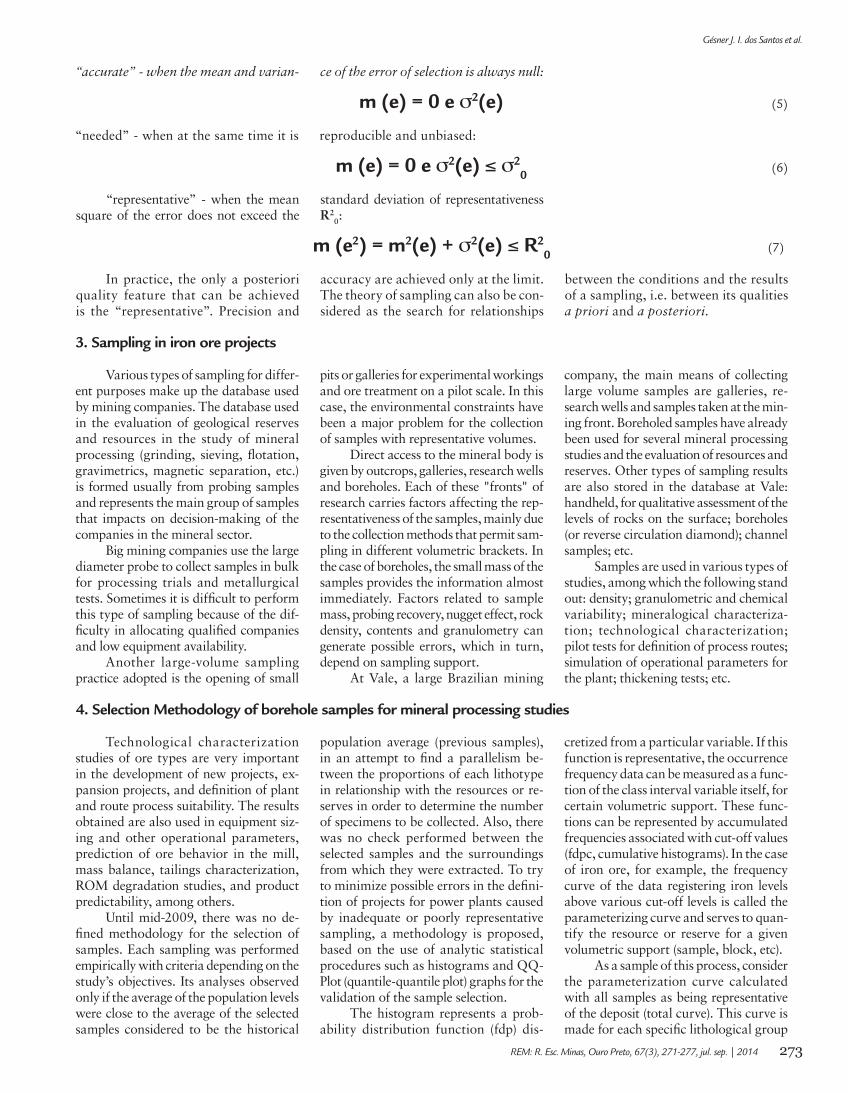
Figure 01Map with the spatial distribution
of selected samples for studies of variability.
Figure 01 shows the map with the distribution of samples throughout the
deposit, showing a reasonable distribution regarding the area probed.
Amostras EVBR Seleção 1 - 2007
No
rte
Leste
780+500
780+000
7803500
7803000
7802500
7802000 667500
668000
668500
669000
669500
670000
670500
671000
671500
672000
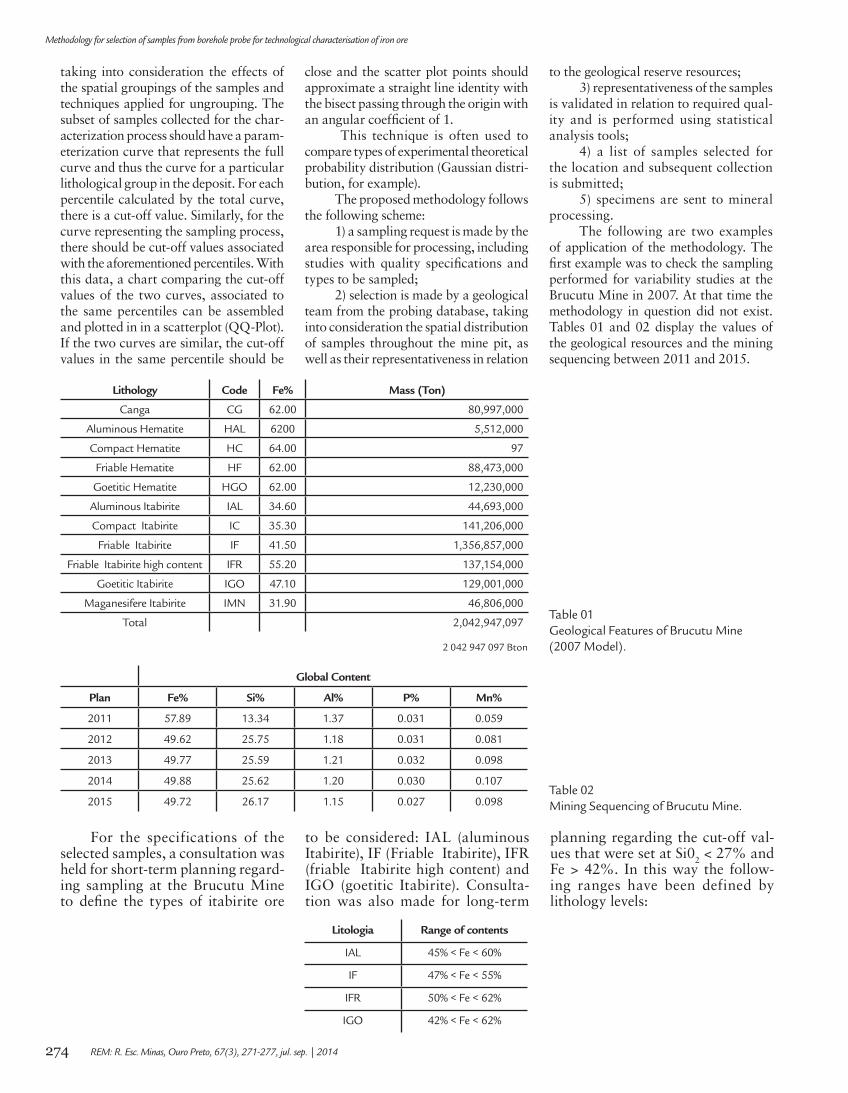
When applying the methodology using statistical analysis tools for vali-dation of the sampling’s representative-ness, it was possible to conclude in the first analysis that the sampling was not representative because it represented
only the average of expected levels, disregarding variability. The histograms in Figure 02 shows the differences be-tween the historical sample and samples selected. In histogram (a), it is possible to observe a bimodal distribution, while
in histogram (b) there is a population with a tendency towards normal dis-tribution. The QQ-Plot (c) highlights the discrepancy between the levels of selected samples and the expected levels, represented by a straight-line identity.
Figure 02a) histogram of all samples
of lithotypes chosen, b) Histogram of selected samples,
c) QQ-Plot showing the discrepancy be-tween the selected samples
and the straight-line identity.
(a) (b)
(c)

276
Methodology for selection of samples from borehole probe for technological characterisation of iron ore
REM: R. Esc. Minas, Ouro Preto, 67(3), 271-277, jul. sep. | 2014
The following example illus-trates the sample selection method-ology, where the specifications have
already been studied and samples selected. The next step is the vali-dation of the selection. Below, in
Figure 03 there is a spatial distri-bution of samples along the Mine of João Pereira.
Figure 03Map of the spatial distribution of selected samples for studies of variability in the mine of João Pereira
The histograms in Figure 04 shows the similarities between sampling surroundings and the selected samples. In histogram: (a)
it is possible to observe a bimodal distribution of samples, in the same way as that in histogram; (b) the QQ-Plot is given; and (c) shows
the adhesion between the levels of selected samples and the expected levels, represented by a straight-line identity.
Figure 04a) histogram of all samples of lithotypes chosen;b) Histogram of selected samples; c) QQ-Plot showing the adhesionbetween the selected samplesand the straight-line identity.
(a) (b)
(c)
277
Gésner J. I. dos Santos et al.
REM: R. Esc. Minas, Ouro Preto, 67(3), 271-277, jul. sep. | 2014
5. Conclusions
In the two previous examples it was possible to observe that the mere use of statistical analysis tools such as histograms and QQ-plotting permitted the rapid analysis of the sampling rep-resentativeness of the samples selected for the testing of technological charac-terization.
The use of the methodology has brought quality gains for sampling and allowed the geologist to assess whether the selected samples represented or not the sampling universe of the ores to be studied.
For cases of samples with very ir-regular meshes, techniques for spatial data construction for ungrouping the QQ-Plots
and histograms must be applied.The sampling selection technique
presented herein has validated the use of stochastic or probability analysis for metallurgical/technological results of the sampling process, opening up new possibilities for risk assessment in the mineral projects of a company.
7. Bibliography
AGRICOLA, G, De Re Metallica. (Dover Publications: New York). 1556.(Traduzido por H.C Hoover & L.H Hoover)AusIMM, - Mineral Resource and Ore
Reserve Estimation.The AusIMM Guide to Good Practice - Monograph 23. Pu-blished by The Australasian Institute of Mining and Metallurgy - Level 3, 15-31 Pelham Street, Carlton Victoria, Australia 3053.2001.693p.
BURMEISTER, B. From Resources to Reality-A Critical Review of the Achieve-ment of New Australian Gold Mining Projects During the Period January 1983 to September 1987, Macquarie University, Sydney. 1989. MSc Thesis (unpubli-shed)CLOW, G. Why Gold Mines Fail, The Northern Miner Magazine, n.6, n.2, p.31–34. 1991.
GY, P. M. Introduction to the theory of sampling I. Heterogeneity of a population of uncorrelated units. Cannes, France. Trends in analytical chemistry, v. 14, n. 2, p. 67-76. 1995.
GY , P.M. The sampling of particulate materials. A general theory school of Geology, Nancy/Consulting Engineer, Cannes (France). International Journal of Mineral Processing, p. 289-312. 1976.
HARQUAIL, D. Investing in Junior Mining Companies, In: The 6th Mineral Econo-mics Symposium of CIM (Canadian Institute of Mining, Metallurgy and Petro-leum: Montreal, Canada). Proceedings… 10p. 1991.
VALLEE, M DAVID, M; DAGBERT, M ; DESROCHERS, C. Guide to the evaluation of gold deposits, Canadian Institute of Mining, Metallurgy and Petroleum, Mon-treal, Canada. p. l9-23, 1992. (Special volume 45).
6. Acknouwlwdgemnt
The authors are grateful to Capes, CNPq and Ufop for the financial support.
Received: 15 Juny 2011 - Accepted: 04 April 2012.