w«tui?i»i•t»¥-ti bic rilt ojobf - apps.dtic.mil · is- distribution statement (ot thla...
TRANSCRIPT

g^Wb?»-l^VA^M*V^^V^3*^ üJ a * .-« J* -ry-- '.."Ml^fWJ^rwroi W«TUI?I»I•T»¥-TI
BIC riLt o JOBf
^ USAAEFA PROJECT NO. 83-24
00
00
< I a <
AIRWORTHINESS AND FLIGHT CHARACTERISTICS TEST OF A SIXTH YEAR PRODUCTION UH • 60A
I u s A A E F A
ARTHUR R. MARSHALL, JR. MAJ, AV
PROJECT PILOT
ROBERT MACMULLIN MAJ, AV
PROJECT PILOT
ROY A. LOCKWOOD MAJ, AV
PROJECT PILOT
THOMAS L. REYNOLDS MAJ, AV
PROJECT PILOT
EDWARD J. TAVARES MAJ, AV
PROJECT PILOT
ROBERT M. BUCKANIN PROJECT OFFICER
GARY L SKINNER PROJECT ENGINEER
MICHAEL K. HERBST PROJECT ENGINEER
CHARLES F. CASSIL PROJECT ENGINEER
PATRICK J. SULLIVAN CW4, AV
PROJECT PILOT
ROBERT A. WILLIAMS CW4, AV
PROJECT PILOT ••vVHM
JUNE 1985
FINAL REPORT
\^MAY 051987
APPROVED FOR PUBLIC RELEASE, DISTRIBUTION UNLIMITED.
UNITED STATES ARMY AVIATION ENGINEERING FLIGHT ACTIVITY EDWARDS AIR FORCE BASE, CALIFORNIA 93523
? 5 4 b .- . ,— t :,-»- ,-».-» r -• » , •-.- | -y ,-.;..^-.:.^..^A' -v ••- •-", -,• :-• •-- aj •-- •*- "• ••1M^- V.^-'1-' V ZWj &£ •"-' tkj -W

DISCLAIMER NOTICE
The findings of this report are not to be construed as an official Department of the Army position unless so designated by other authorized documents.
DISPOSITION INSTRUCTIONS
Destroy this report when it is no longer needed. Do not return it to the origiaator.
TRADE NAMES
The use of trade names in this report does not constitute an official endorsement or approval of the use of the commercial hardware and software.
wruwte-^AX^fnonm-KT'~VTr-jTxrrvvrB-xTivtiai-*

" gygca
DISCLAIMER NOTICE
THIS DOCUMENT IS BEST QUALITY PRACTICABLE. THE COPY FURNISHED TO DTIC CONTAINED A SIGNIFICANT NUMBER OF PAGES WHICH DO NOT REPRODUCE LEGIBLY.

UNCLASSIFIED
SECURITY CLASSIFICATION OF THIS PAGE (Who* Data BntoromV
REPORT DOCUMENTATION PAGE I. SIFÖJff MUMUR
ÜSAAEFA PROJECT NO. 83-24 k READ INSTRUCTIONS
BEFORE COMPLETING FORM 12, GOVT ACCEMION NO. >• RECIPIENT'S CATALOG NUMBER
M/gQ/P
>
4. TITLE (and Svbittta)
AIRWORTHINESS AND FLIGHT CHARACTERISTICS TEST OF A SIXTH tfEAR PRODUCTION UH-60A
ft. TYPE OF REPORT * PERIOD COVtREO
FINAL 3-20 OCTOBER 1983 29 FEB & 18 SEP 1984 t. PERFORMING OR«. REPORT NUMBER
7. AUTHOR«)
ROBERT M. BUCKANIN MICHAEL K. HERBST ROY A. L0CKW00D
S. CONTRACT OR GRANT NUMBER«)
GARY L. SKINNER PATRICK J. SULLIVAN et al
ft. PERFORMING ORGANIZATION NAME AND AOORESS
US ARMY AVN ENGINEERING FLIGHT ACTIVITY EDWARDS AIR FORCE BASE, CA 93523-5000
10. PROCNAM ELEMENT, PROJECT, TASK AREA * WORK UNIT NUMBERS
68-3BE243-04-68-EC
ft. CONTROLLING OFFICE NAME AND AOORESS
US ARMY AVIATION SYSTEMS COMMAND 4300 G00DFELL0W BOULEVARD ST. LOUIS, MO 63120-1798
It. REPORT DATE
JUNE 1985 IS. NUMBER OF PAGES
14. MONITORING AGENCY NAME A ADDRESS«"» dlltarant fro» Controlling Oltlca) 12SL IS. SECURITY CLASS. («I thla report)
UNCLASSIFIED
IS«. DECLASSIFICATION/DOWNORAOING SCHEDULE
IS- DISTRIBUTION STATEMENT (ot thla Raport)
Approved for public release; distribution unlimited.
17. DISTRIBUTION STATEMENT (ot tha mbattmct ontmrod In Block 30, II dlltormnt from Raport)
IS. SUPPLEMENTARY NOTES
IS. KEY WORDS (Contlnum on torotma alda It nacaaamry and Identify by block numbor)
Equivalent Flat Plate Area Performance Data Sixth Year Production Stabilator Position UH-60A Helicopter 20. ABSTRACT (tSndtau* •» rmrormm atä* fi mcNNir and Idontlty by block numbor)
Testing was conducted to obtain performance data for inclusion in the sixth year production UH-60A helicopter operator's manual. A total of 58 productive flight hours were flown at five different test sites between 3 and 20 October 1983 and 29 February and 18 September 1984. The out-of-ground effect hover gross weight capability was 16,526 pounds for 95 percent intermediate (30/**" minute limit) rated power available at 4700 feet pressure^altitude and 35<T temperature. The increase in equivalent flat plate area/(Fe)of the sixth _~ -) OV*
DD ,5!rw 1473 EDITION OF t NOV «S IS OBSOLETE UNCLASSIFIED
SECURITY CLASSf FlCATtON OF THIS PAGE (Whan Data Bniarod)

UNCLASSIFIED SECURITY CLAillFICATtOW OF TMIt MBHWwiJHifc<iw< &
ft-
>year product^oA-aXrcraft configuration over the/first fyear^mmfiguratiojLwas 5 square feet Mf&—in level flight at a referred rotor *>fed (<£y7<*J of 258 revolutions per minute. Of this increase, 2.5 p- vas attributed to the External Stores Support System fixed provision fairings, 1.5 jkv to the external mounting brackets of the AN/AL0^14A(V) infrared counterme&iures set and M-130 chaff dispenser, and 1.0JP to numerous other raino/ external changes. However, throughout the (töT/fi)range, the difference /in power required \hetween the first and sixthyear production aircraft does not equate to a constant Fe. A limited investigation of the effect of staJ>ilator position on level fl^ht power required did not completely account for ^he power differ- ences noted flying at different the same nondimensional thrust coefficient.
dimensional conditions that produce
/V <yb t ik t i~ dU
UNCLASSIFIED SECURITY CLASSIFICATION OF THIS PAGEfWhmn Data Bnt0fd)

PREFACE
Special recognition IB given to Vera L. Gardner for her innovative computer programming support which aided during the data analysis phase of this project.
Aoetiftlon For
NTIS GRAtI DTIC TAB Unannounced Justification.
By Distribution/
1 a
Availability Codsa
Avr.il and/or Special

TABLE OF CONTENTS
Page
INTRODUCTION
Background I Test Objectives * I Description 1 Test Scope 2 Test Methodology • • 3
RESULTS AND DISCUSSION *
General 4 Hover Performance 4 Level Flight Performance 5 Airspeed Calibration 7
CONCLUSIONS 9
RECOMMENDATIONS . 10
APPENDIXES
A. References 11 B. Aircraft Description 12 C. Instrumentation..... 23 D. Test Techniques and Data Analysis Methods 27 E. Test Data 38
DISTRIBUTION

INTRODUCTION
BACKGROUND
1. The US Amy has contracted t?lth Sikorsky Aircraft Division of United Technologies, for the sixth, seventh and eighth /ear UH-60A production lots. The US Amy Aviation Engineering Flight Activity (USAAEFA) has conducted testing on earlier YUH-60A and UH-60A helicopters to Include the Government Competitive Tests, Preliminary Airworthiness Evaluations, Climatic Laboratory Tests, Artificial and Natural Icing Tests and an Airworthiness and Flight Characteristics (AiFC) evaluation. Further tearing was needed to update previous test results of the first year produc- tion UH-6QA for inclusion In the sixth year production UH-60A operator's manual.
2. In September 1983, USAAEFA was tasked by the US Army Aviation Systems Command (AVSCOM) (ref I, app A) to conduct an A&FC evalua- tion of a UH-60A helicopter from the sixth year production lot.
TEST OBJECTIVES
3. The objectives of the A&FC evaluation were as follows:
a. To determine the performance change caused by the infrared countermeasures set AN/ALQ-144(V) and chaff dispenser M-130, and their external mounting brackets.
b. To obtain sufficient level flight performance data to update existing data for inclusion in the operator's manual.
c. To obtain sufficient hover performance data to update existing data for inclusion in the operator's manual.
DESCRIPTION
4. The UH-60A is a twin-turbine single-main rotor helicopter capable of transporting cargo, 11 combat troops, and weapons during day, night, visual meteorological conditions, and instru- ment meteorological conditions. The helicopter is powered by two General Electric T700-GE-700 turboshaft engines, each having an installed therraodynamic rating (30 minute limit) of 1553 shaft horsepower (SHP) (power turbine speed of 20,900 revolutions per minute (rpm)) at sea level, standard day static conditions. Installed dual engine power is transmission limit id to 2828 SHP. The engines used during this evaluation were calibrated by the engine manufacturer. Two test aircraft were used during this evaluation: USA S/N 82-23748, a sixth year production Black

Hawk in the normal utility External Stores Support System (ESSS) fixed provision fairings configuration (defined as normal utility (ESSS) configuration) described in paragraph 5, and USA S/N 77-22716, a first year production aircraft incorporating airspeed and stabilster modifications similar to the sixth year aircraft in the normal utility configuration, the normal utility configuration with AN/ALQ-144(V) and M-130 external mounting brackets added, and the normal utility configuration with AN/ALQ-144(V) and M-130 sets installed.
5. Several modifications were incorporated to arrive at the normal utility (ESSS) configuration for the sixth, seventh and eighth year production lots. These Include reorientation of the production airspeed pitot-statlc tubes, a modified stabilator schedule, and the addition of external mounting brackets for the AN/ALQ-144(V) infrared countemeasures set and M-130 chaff dis- penser. Also included were the ESSS fixed provisions and fairings along with numerous other minor external configuration changes* A more detailed description of the UH-60A with descriptive photo- graphs is available in appendix B, and additional information can be found in the Prime Item Development Specification (ref 2, app A) and in the operator's manual (ref 3).
TEST SCOPE
6. Hover and level flight performance tests were conducted at Edwards AFB (elevation 2302 feet), Bakersfield (488 feet), Bishop (4120 feet) and Coyote Flats (9980 feet), California and at Duluth (1430 feet), Minnesota. Sixth year production aircraft test flight hours totaled 74 of which 51 were productive. These tests were conducted between 29 February and 18 September 1984. Level flight performance tests were also conducted on a first year production aircraft between 3 and 20 October 1983 and totaled 12 hours of which 7 were productive. Flight restrictions and operating limitations observed throughout the evaluation are contained in the operator's manual (ref 3, app A) and in the air- worthiness release issued by AVSCOM (ref 4). Testing was conducted in accordance with the test plan (ref 5) at the conditions shown in table 1.

Table 1. Test Condition«!1
Longitudinal Groas Center of Density Referred Trio Weight Gravity Altitude Rotor Speed Airspeed
Type (lb) (FS) (ft) (rpn) (KTAS)
132402 3300 244 Hover to 354.0 to to 0
22680 10720 265
Level3 14470 3430 245 41 Flight to 347.4 to to to
21690 14000 286 170
NOTES:
lTests were conducted at an approximate mid lateral center of gravity with the automatic flight control system on in the normal utility (ESSS) configuration, unless otherwise noted.
2Aircraft gross weight plus cable tension. 3Tests also conducted with the AN/ALQ-144(V) and M-130 mounting brackets added and with the complete AN/ALQ-144(V) and M-130 sets Installed.
TEST METHODOLOGY
7. The flight test data were recorded by hand from test instru- mentation displayed in the cockpit, by on-board magnetic tape recording equipment and via telemetry to the Real Time Data Acquisition and Processing System. A detailed listing of test instrumentation is contained in appendix C. Level flight performance tests were supplemented by test data from a first year production UH-60A adjusted for drag differences. Flight test techniques and data reduction procedures are described in appendix D.

RESULTS AND DISCUSSION
GENERAL
8. Testing was conducted to obtain performance data for Inclusion In the uH-60A sixth year production helicopter operator's manual. At the hover performance guarantee conditions of 95 percent Intermediate (30 minute limit) rated power available (IRP), 4700 feet pressure altitude (Hp) and 35*C, the out-of-ground effect (OGE) hover gross weight capability was 16,526 pounds. The difference in level flight power required does not equate to a constant equivalent flat plate area (Fe) between the first and sixth year production aircraft throughout the referred rotor speed (NR//6) range. The increase in Fe between the normal utility and normal utility (ESSS) configurations at Nn/Zeof 258 rpm was determined to be 5 square feet (ft ). Of the total 5.0 ft2, 2.5 ft2 can be attributed to the ESSS fixed provision fairings and 1.5 ft2 can be attributed to the external mounting brackets of the AN/ALQ-144(V) infrared countermeasures set and M-130 chaff dispenser. The remaining 1.0 ft2 Is attrib- utable to numerous other minor external configuration changes. Installing the AN/ALQ-144(V) and M-130 sets increases Fe by an additional 0.5 ft2. The effect of stabilator position does not completely account for the discrepancy in power required as a result of flying at dimensionally different conditions that produce the same nondimensional thrust coefficient (C-r).
HOVER PERFORMANCE
9. Hover performance tests were conducted on the sixth year pro- duction aircraft at the conditions in table 1 using the tethered and free flight techniques described in appendix D. The 2-foot main wheel height in-ground effect (IGE) and the 100-foot main wheel height OGE tests were conducted at the 2302, 4120, and 9980 foot test sites in the normal utility (ESSS) configuration. Tip Mach number for these tests varied from 0.61 to 0.67. The data from these tests were compared with first year production aircraft hover data presented in USAAEFA Report No. 77-17 (ref 6, app A). The previous data was reanalyzed and a different curve was faired through both the 2-foot IGE and the 100-foot OGE data sets. When compared with the reanalyzed fairings, current test data reveal an increase in power required to hover IGE of approximately 5 percent and an increase of approximately 3 percent to hover OGE. Results are presented In figures 1 through 3, appe-idix E. These results compare favorably with previous OGE hover performance data with the ESSS fairings installed, USAAEFA Report No. 82-15-1 (ref 7, app A). No discernible compressibility trend was observed during this or any other previous testing. The hover performance results contained in this report should
•i-rrvara^\J.iMy^m^^MiM!i>ii»r4mM*^-'L.^si.*n^.tLn<*^»rxj*tJvr3.M

be used to define Che hover performance of a UH-60A In the normal utility (ESSS) conflagration. The reanalyzed fairings for the first year production aircraft should be used to define the hover performance of a UH-60A In the normal utility configuration.
10. The standard day OGE hover ceiling at the primary mission gross weight of 16,455 pounds (app E) was 11,224 feet Rp using IRP available from USAAEFA Report No. 77-17 (ref 6, app A). At 4000 feet Hp on a 35 °C day, the OGE hover maximum gross weight was 17,593 pounds with IRP. At the hover performance guarantee conditions of 95 percent IRP, 4700 feet Hp and 35°C, the OGE hover capability was 16,526 pounds.
LEVEL FLIGHT PERFORMANCE
11. Level flight performance tests were conducted at the con- ditions listed in table 1 to determine power required and fuel flow for airspeeds, altitudes, gross weights, and rotor speeds throughout a portion of the operational envelope of the sixth year production aircraft. Test data from USAAEFA Report No. 81-16 (ref 8, app A) was used to supplement the 258 rpm NR/ /Q data base. Techniques used in obtaining and analyzing level flight performance data are described in detail In appendix D. The data were obtained and analysed in ball-centered flight and corrected for estimated drag of external test instru- mentation and instrumentation electrical load.
12. Nondimensional test results are presented in figures 4 through 31, appendix E. The test data indicate power required generally increases with increasing NR//8. Trends at NR//8 above 258 rpm are not consistent with those of the first year production aircraft presented in USAAEFA Report No. 77-17 (ref 6, app A). The exponential increase in power required with increasing NR/ /6 as predicted by theory and as observed for the first year production aircraft (ref 6), was not evident for the sixth year production aircraft. Specific differences in power required between the first and sixth year aircraft throughout the NR/ /(5 range tested did not produce a constant change in Fe (ÄFe) between the two aircraft at all conditions. Comparing the normal utility and normal utility (ESSS) configurations at N«//$of 258 rpm indicates a AFe of approximately 5 ft . This difference was summarized as:
Oth yr prod A/C « 1st year prod A/C + ESSS fairings (2.5 ft2) + M-130 & AN/ALQ-144(V) brackets (1.5 ft2) + external drag differences (1 ft2)

Additional testing should be conducted tn forward flight to investigate the inconsistencies In power required as a function of NR//TT between the first and sixth year production aircraft. The AFe of the ESSS fairings was documented in USAAEFA Report No. 82-15-1 (ref 7), the M-130 and AN/ALQ-144(V) mounting brackets in paragraph 15, and the external configuration differences affecting drag between the two aircraft are depicted in the photographs in appendix B. Dimensional level flight test results are presented in figures 32 through 59, appendix E. Inherent sideslip, presented in figures 60 and 61, was developed from the resultant angle of sideslip associated with ball-centered flight during level flight performance testing (figs. 62 through 66). The data indicate that in ball-centared flight, sideslip increases to the right with increasing Oj. These results show the sixth year production UH-60A to fly with more inherent right sideslip when compared with previous test results (ref 6, app A) especially at higher Op's.
13. Tests were conducted to ascertain the AFe with sideslip for a range of Op's and the data are presented in figure 67, appendix E, for both the normal utility and normal utility (ESSS) configurations. Results are independent of airspeed and NR//A, but vary with Gj. The data indicate that minimal Fe occurs between 4.5 and 7 degrees left sideslip depending upon Cf. Coordinated flight throughout the tested level flight airspeed envelope of the UK-60A results in a maximum left sideslip of approximately 1 degree.
14. Level flight performance testing on the UH-60A at different dimensional conditions that yield the same nondimensional con- dition have not produced consistent results. Stabilator position has been suspected to be a contributing factor to this discrepancy because the nondimensional parameters do not account for indicated airspeed which is the dimensional parameter that determines sta- bilator position in stabilized, ball-centered level flight at a given Cx_y combination. Limited testing was conducted to determine the stabilator position effect on power required for level flight. Results are presented in figures 08 through 70, appendix E in the form of change in power coeflicient as a function of deviation of stabilator from the programmed schedule positlou. Results vary with both Cx and JJ The data show that stabilator trailing edge (TE) up movement produced an Increase in power required and TE down movement produced a decrease. Sufficient data were gath- ered during the stabilator investigation to perform an analysis of the stabilator effect at a Cx of 0.009 at various values of ji. No stabilator corrections have been made to the level flight data presented in appendix E, however, a limited analysis was performed using the data available at a Cy of approximately 0.009, for
tsv.ttu\iu\n«\*u\a^xjiMTKn*eimm iLamv AJ3 a-ftJLÄXnÄJrt'fcJ^ 'tATUi JL^XiV^V^lT^ jUT"i<JHiLrt»ÜT

example figures 40 and 42. The fairing on these two figures represents a normalization process based to a large extent on the two data sets because of their proximity, but is also influenced by cross fairing C^, Cp, u, and NR//6~of all the tests. The fairing can be made to better approximate the data by deter- mining for a specific u, the difference in indicated airspeed due to the different dimensional conditions representing the data and normalized fairing. This difference can then be converted into a change in stabilator position and consequently a change in power required. For example, the fairing in figure 42 repre- sents an altitude greater than that represented by the data and denotes less power required than the data. Decreasing altitude increases indicated airspeed for the same y, which positions the stabilator more TE up, thereby requiring a corresponding increase in power to maintain level flight raising the faired line. Applying the stabilator correction, however, accounts for less than half of the difference in power required between the two CT data sets, after equating both to a nominal C^. Therefore, regardless of the limited amount of data accumulated on stabilator effects and their consequences on power required, it is assumed that other unexplained aerodynamic effects preclude accurate nondimensionalizing of level flight performance. If these differences are to be fully explained, further stabilator tests at a range of airspeeds throughout the C«j envelope, and a study undertaken to identify remaining differences complemented with verification testing should be accomplished.
15. Testing was accomplished earlier on a first year production aircraft for inclusion in this report of the performance change associated with the installation of the AN/ALQ-144(V) infrared countermeasures set and M-130 chaff dispenser. Level flight performance test results are presented in figures 54 through 59, appendix E. The mounting^ brackets for the AN/ALQ-144(V) and M-130 sets produce 1.5 ft? of Fß. Installation of the AN/ALQ- 144(V) and M-130 sets increases Fe by an additional 0.5 ft
?. The slightly high fairings at Or of 0.009 could be lowered if the st-aMlator correction described in paragraph 14 wao applied.
AIRSPEED CALIBRATION
16. The standard ship's airspeed system on the sixth year produc- tion aircraft was calibrated in level flight. A calibrated T-28 pace aircraft and a calibrated trailing bomb were used to deter- mine the position error. The position error of the ship's airspeed system is presented in figure 71, appendix E. In level flight, airspeed position error varied from -8 knots at 35 knots indicated airspeed (KIAS) to +3 knots at 160 KIAS. This represents a

decrease in position error of almost 2 knots from the position error determined with the prototype production airspeed system (ref 9, app A). Additional testing to determine the airspeed position error of the production airspeed system over a broader range of flight conditions should be conducted.

CONCLUSIONS
L7. Based on this evaluation, the following conclusions can be drawn about the performance of the sixth year production UH-60A in the normal utility (ESSS) configuration:
a. Power required to hover was increased compared to the first year production normal utility configured ÜH-60A (para 9).
b. Increased requirement for power was measured generally as a result of increasing referred rotor speed (NR//8), although the exponential increase predicted by theory was not realized (para 12).
c. Drag in level flight Increased by 5 square feet (ft^) of equivalent flat plate area (Fe) compared to the normal utility configured UH-60A at a NR//e" of 258 rpm (para 12).
d. Drag of the mounting brackets for the AN/ALQ-1AA(V) and M-130 sets in level flight was 1.5 ft cf Fe> and installation of the sets increased total Fe by an additional 0.5 ft* (para 15).
e. The difference in stabilator position accounts for less than half the difference in level flight power required when different dimensional conditions produce the same nondimensional condition for a C^ of 0.009 (para 14).
t^mrnM3^amm;mmmsmmme!mm»narmxmai»^mm»: :.auKKja:naiH t— i•!•«•!• WIMtlTin n •im • - •———*— ———•«

RECOMMENDATIONS
18. The following recommendations are made:
a. Hover performance determined during this evaluation should be used for a UH-6GA in the normal utility (ESSS) configuration (para 9).
b. Reanalyzed hover performance fairings of USAAEFA Project No. 77-17 produced during this evaluation should be used for a UH- 60A in the normal utility configuration (para 9).
c. Additional testing should be conducted in forward flight to investigate the cause of the variations in power required as a function of referred rotor speed between the first and sixth year production aircraft (para 12).
d. Further stabilator testing is necessary at a range of airspeeds throughout the thrust coefficient envelope of the UH-60A if it's effect on level flight power required is to be fully documented (para 14).
e. A study, complemented by testing for verification, should be undertaken to identify unexplained aerodynamic effects that preclude accurate nondimensionalizing of level flight performance of the UH-60A (para 14).
f. Additional testing throughout a range of flight conditions should be conducted to further evaluate the differences in air- speed position error between the prototype system presented in USAAEFA Project No. 82-09 and the current airspeed system incor- porated in the sixth year production aircraft (para 16).
10
i wKir^a.KmciutarR'ira it inarviuiwwcv^irK'WKBinnivgFJOt Mi u». fiv L".v LKtai v^V;«^JV'JKN: UV^Ai \£V 'JVI\%,'JW^V\,V\^A!V,VK(\IU\ lUl'MKAKAMK

APPENDIX A. REFERENCES
1. Letter, AVRADCOM, DRDAV-DI, 30 September 1983, subject: Airworthiness and Flight Characteristics (A&FC) Test of a Sixth Year Production UH-60A, USAAEFA Project No. 83-24.
2. Prime Item Development Specification, Sikorsky Aircraft Division, DARCOM-CP-2222-S1000F Part I, 15 December 1981.
3. Technical Manual, TM55-1520-237-10, Operator's Manual, UH-60A Helicopter, Headquartere Department of the Army, 21 May 1979 with change 22 dated 2 September 1983.
4. Letter, AVSCOM, DRSAV-E, 21 February 1984, subject: Airworthi- ness Release for the UH-60A Black Hawk Helicopter, S/N 82-23748, to Conduct an Airworthiness and Flight Characteristics (A&FC) Test of a Sixth Year Production UH-60A, USAAEFA Project No. 83-24.
5. Test Plan, USAAEFA Project No. 83-24, Airworthiness and Flight Characteristics Teet of a Sixth Year Production UH-60A, December 1983.
6. Final Report, USAAEFA Project No. 77-17, Airworthiness and Flight Characteristics Evaluation UH-60A (Black Hawk.) Helicopter, September 1981.
7. Final Report, USAAEFA Project No. 82-15-1, VH-60A External Stores Support System Fixed Provision Fairings Drag Determina- tions, May 1984.
8. Final Report, USAAEFA Project No. 81-16, UH-60A Expanded Gross Weight and Center of Gravity Evaluation, Unpublished.
9. Final Report, USAAEFA Project No. 82-09, Preliminary Airworthiness Evaluation of UH-60A with an Improved Airspeed System, April 1983.
10. Technical Manual, TM55-1520-237-23-2, Aircraft General Information Manual, UH-60A Helicopter, Headquarters Department of the Array, 29 December 19/8.
11

APPENDIX B. AIRCRAFT DESCRIPTION
GENERAL
1. The Sikorsky UH-60A (Black Hawk) is a twin-turbine engine, single main rotor helicopter capable of transporting 11 combat troops plus a crew of three. It is equipped with three nonretract- able conventional wheel-type landing gear. A movable horizontal stabilator is located on the lower portion of the tail rotor pylon. The main and tail rotors are both four-bladed with a capability of manual main rotor blade and tail pylon folding. The cross-beam tail rotor with composite blades is attached to the right side of the pylon and is canted 20 degrees upward f'om the horizontal. A complete description of the aircraft is contained in the operator's manual (ref 3, app A) and the aircraft general information manual (ref 10).
2. Two helicopters were used in this evaluation, first year (USA S/N 77-22716) and sixth year (USA S/N 82-23748) production aircraft. The following photographs 1 through 12 illustrate the configuration differences between the two aircraft in their respective normal utility configurations.
EXTERNAL STORES SUPPORT SYSTEM (ESSS) FIXED PROVISION FAIRINGS
3. The sixth year production aircraft is equipped with provisions for incorporating the ESSS. With the system removed, aerodynamic fairings are installed (photo 1). The weight of the integral airframe fixed provisions is 123 pounds, the removable provisions are 8 pounds, and the total is included in the aircraft basic weight. The first year production aircraft does not include provisions for the ESSS (photo 2).
COUNTERMEASURE PROVISIONS
4. The sixth year production aircraft is equipped with the AN/ALQ-144(V) Infrared (IR) countermeasures set and an M-130 chaff/flare dicpcncer. These unite were removed for testing, but the brackets supporting them remained (photos 3 and 4). The first year production aircraft does not incorporate these countermeasure devices. However, aircraft USA S/N 77-22716 (first year production aircraft) was tested with the brackets added and with the countermeasure devices installed to determine their effect on level flight performance.
12
imnMzn Kn.K>\.x^i .Knx.<i,EtiK\>Asnsnwn«aiiu3'KA'astiui-Iiu>'iu3'«ii'aAiui«Fuu>]tiiii

Photo 1. ESSS Fairing Installation, Left Side (Normal Utility (ESSS) Configuration, Sixth Year Production Aircraft)
Photo 2. Right Side (Normal Utility Configuration, First Year Production Aircraft)
13
jg^^ijfli J J-. -J-. •.- M • -• -J i .> •..'..-•- -..»..-^ j •^ •••>
r.i. - ..• L- .->vn-.<;

AN/ALQ-144(V) IR Countermeasure Bracket (Sixth Year Production Aircraft)
Photo 4. M-130 General Purpose Dispenser Bracket (Sixth Year Production Aircraft)
14

AIRSPEED/STABILATOR MODIFICATIONS
5. The airspeed/stabilator system on both test aircraft incorpor- ated the modifications developed during USAAEFA Report No. 82-09. The first year production aircraft incorporated the development, or prototype production system, while the sixth year aircraft included the contemporary production system. Three changes were incorporated in the pitot-static pressure systems and two changes in the electrical circuit to the stabilator amplifiers of the stabilator system. Major changes from the original production version incorporated in both aircraft were: reorienting the pitoc-static tube 20 degrees outboard and 3 degrees down, venting the vertical speed indictor static source from the pitot-static tube to the cabin, damping the airspeed Indicator 0.4 seconds, increasing the damping of the stabilator to 3.0 seconds, and reducing the collective bias of the stabilator schedule at high collective settings. The mount to reorient the pitot-static tube of the first year test aircraft varied from the production mount on the sixth year aircraft in height (photos 5 and 6).
MISCELLANEOUS
6. The bifilar absorbers of the sixth year production aircraft are redesigned in comparison to the first year production absorb- ers (photos 7 and 8).
7. Sixth year production aircraft are equipped with the rotor deicing system, while the first year production aircraft was not. The deice system incorporates main and tail rotor deicing capabilities. Photo 9 shows the main rotor slip ring and distrib- utor assembly of the deice system. The main rotor hubs of both test aircraft were adapted with a slip ring assembly for instru- mentation purposes (photo 10). Other drag producing components of the deice system are the ice detector probe located on the right engine nacelle (photo 11) and the outside air temperature sensor located on the nose of the aircraft in front of the renter windshield (photo 12).
ENGINES
8. The primary power plants for the UH-60A helicopter are General Electric T700-GE-700 front drive turboshaft engines, rated at 1553 shaft horsepower (SHP) at a power turbine speed of 20,900 revolutions per minute (rpm) (sea level, standard day installed). The engines are mounted in nacelles on either side of the main transmission. Each engine has four modules: cold section, hot
15
i vtf'i/ll.'HIVJlA r

Photo 5. Modified Production Pitot-Static System Mount (Normal Utility (ESSS) Configuration)
Photo 6. Development Mount for Modified Production Pitot-Static System Installed on Aircraft USA S/N 77-22716 During this Testing
16
?yÖQ&3w,üVüttJiÄW^^ -fti tfBWttftTAVJiÄjß* -N V.' ÖlViWVW ffiÄßfciVJ' AW

w »Twivflw •»Tirw'Tr" ¥-» — r«¥»t"T»T>iT'vv»v^r'v» v v »'.
Photo 7. Bifilar Absorber (Sixth Year Production Aircraft)
Photo 8. Bifilar Absorber (First Year Production Aircraft)
17
•TST- - g J^I^LLJL ->..--« .J..^...\n.-r *. •••..I. — ^ • tf •>•-"• J» .. •* ••• ••• V ->r^ .'_r o •-•^•-'•••' v v > ••• •-• v.'.^ -- •>

'¥"T- V— -W— V-T — TT--S-—--V- vr-u-U-
Photo 9. Main Rotor Hub (Sixth Year Production Aircraft)
Photo 10. Instrumented Main Rotor Hub (Roth Test Configurations)
18
-y^-->:<

Photo 11. Ice Detector Probe, Right Side (Sixth Year Preiuction Aircraft)
Photo 12. Deice System Temperature Sensor (Sixth Year Production Aircraft)
19
jttmmüi •• - a • :-' - - - - ...- «•• n • K - » - > • M .T t -. .-.-.-i-.-.-. • _ .- • »••... < . r • •• , ...•••.., -....• ... - -

section, power turbine section, and accessory section. Design features include an axialcentrifugal flow compressor, a through- flow combustor, a two-stage air-cooled high pressure gas generator turbine, a two-stage uncooled power turbine, and self contained lubrication and electrical systems. Pertinent engine data are shown below«
Model Type Rated power
Compressor
Combustion chamber
Gas generator stages Power turbine stages Direction of engine rotation (aft looking fwd)
Weight (dry) Length Maximum diameter Fuel
T700-GE-700 Turboshaft 1553 SHP installed at sea level,
standard-day static conditions at 20,900 rpm
Five axial stages, 1 centrifugal stage
Single annular chamber with axial flow
2 2
Clockwise 415 pounds max 47 in. 25 in. MIL-T-5624 grade JP-4 or JP-5
BASIC AIRCRAFT INFORMATION
9. General data of the sixth year production UH-60A helicopter are as follows:
Gross Weight
Empty weight
Primary Mission gross weight
Fuel c«p«rfty (measured)
Main Rotor
Number of blades
Diameter
Blade chord
Blade twist
Approximately 10,750 pounds
16,455 pounds
359 gallons
53 ft, 8 in.
1.73/1.75 ft
-18 deg (equivalent)
20
••«Ärv-wr»-' ?Kjumim.~nwt*mJuinia~ a^L4it_*M i. •-,•-;ultmmktfiuh dB

Blade tip sweep 20 deg aft
Blade area (one blade) 46.7 sq ft
Airfoil section (root to tip designation) thickness (percent chord)
SC1095/SC1095R8 9.5 percent
Main rotor mast tilt (forward) 3 deg
Tail Rotor
Number of blades 4
Diameter 11 ft
Blade chord 0.81 ft
Blade twist (equivalent linear) -18 deg
Blade area (one blade) 4.46 sq ft
Airfoil section (root to tip designation) thickness (percent chord)
SC1095/SC1095R8 9.5 percent
Shaft cant angle (upward) 20 deg
Gear Ratios
Main Transmission Input RPM Output RPM Ratio (Teeth)
Input bevel Main bevel Planetary
20,900.0 5747.5 1206.3
5747.5 1206.3 257.9
3.6364 4.7647 4.6774
(80/22) (81/17)
(228 + 62) 62
(34/116)
(37/76)
(92/56)
Tail takeoff Accessory bevel
(generator) Accessory spur
(hydraulics)
1206.3
5747 5
11,805.7
4115.5
11,805.7
7186.1
0.2931
0.4868
1.6429
Intermediate Gearbox 4115.5 3318.9 1.2400 (31/25)
Tail Gearbox 3318.9 1189.8 2.7895 (53/19)
21

Overall
Engine to main 20,900.0 257.9 81.0419 rotor
Eni«ne to tail 20,900.0 1189.8 17.5658 rotor
Tail rotor to 1189.8 257.9 4.6136 main rotor
22

APPENDIX C. INSTRUMENTATION
GENERAL
1. ""he test instrumentation was installed, calibrated and maintained by the US Army Aviation Engineering Flight Activity. A test boom, with a swiveling pitot-static tube and angle of attack and sideslip vanes, was Installed at the nose of the aircraft. Equipment required for specific tests was installed when needed. Data was obtained from calibrated instrumentation and displayed or recorded as indicated below.
Pilot Panel
Airspeed (boom) Airspeed (ship)* »1t4». I- / V - N miiiuuc ^uuuui;
Altitude (ship)* Altitude (radar)* Rate of climb* Rotor speed (sensitive-digital) Engine torque* ** Turbine gas temperature* ** Power turbine speed (Np)* ** Gas producer speed (N»;* ** Control position
Longitudinal Lateral Directional Collective
Horizontal stabilator position* Center of gravity (eg) lateral acceleration (sensitive) Angle of sideslip Tether cable angles
Longitudinal Lateral
Copilot Panel
Event switch Airspeed* Altitude* Rotor speed* Engine torque* ** Ballast cart control Ballast cart position Cable tension Fuel remaining* **
•Ship's system/not calibrated **Both engines 2-a

Engineer Panel
Pressure altitude Ambient pressure Engine Fuel flow** Engine Fuel used** APU fuel used Total air temperature Instrumentation controls Time code display Run number Event switch
2. Data parameters recorded on board the aircraft and via telemetry include the following:
Digital (PCM) Data Parameters
Airspeed (boom) Altitude (boom) Airspeed (ship's) Altitude (ship's) Total air temperature Rotor speed Gas generator speed** Power turbine speed** Engine fuel flow** Engine fuel used** Engine fuel temperature** Engii.e output shaft torque** Turbine gas temperature** APU fuel used Main rotor shaft torque CG latera1 acceleration (sensitive) Tether cable tension Tether cable angle
Longitudinal Lateral
Stabilator position Movable ballast location Control position
Longitudinal Lateral Directional Collective
Attitude Pitch Roll Yaw
24 **Both engines

Angular Rate Pitch Roll Yaw
Tall rotor shaft torque Tall rotor Impressed pitch (Blade angle at 0.75 blade span) Angle of sideslip Angle of attack Time of day Run number Pilot event Engineer event
AIRSPEED CALIBRATION
3. The standard ship's airspeed system and test boom airspeed system were calibrated in level flight. The ground speed course, a calibrated T-28 pace aircraft and a calibrated trailing bomb (finned pitot-static system) were used to determine the position error. The position error of the boom airspeed system Is present- ed in figure 1.
WEATHER STATION
4. A portable weather station was used during tethered hover tests. The weather station equipment Included an anemometer to measure wind speed and direction at selected heights up to 100 feet above ground level. A sensitive temperature gage and barometer were utilized to measure ambient temperature and atmospheric pressure, respectively.
LOAD CELL
5. A calibrated load cell was incorporated with the ship'« r*rgo hook to measure cable tension and accelerometers were used to measure longitudinal and lateral cable angles for tethered hover tests. Indicators were installed in the cockpit to display cable tension and cable angle measured with respect to the ground.
25


APPENDIX D. TEST TECHNIQUES AND DATA ANALYSIS METHODS
AIRCRAFT RIGGING
1. A flight controls engineering rigging check was performed on the main and tail rotors to insure compliance with established limits. The stabllator control system was adjusted to conform as close as possible to the modified production schedule to prevent improper drag characteristics effecting level flight performance.
AIRCRAFT WEIGHT AND BALANCE
2. The aircraft was weighed in the Instrumented configuration with all fuel drained and full oil prior to the start of the Airworthiness and Flight Characteristics program. The initial weight of the sixth year production aircraft was 12,000 pounds with the longitudinal center of gravity (eg) located at fuselage station (FS) 352.2 with the eg of the empty ballast cart located at FS 301. The fuel cells and an external sight gage were also calibrated. The measured fuel capacity using the gravity fueling method was 359 gallons. The fuel weight for each test flight was determined prior to engine start and after engine shutdown by using the external sight gage to determine the volume and measuring the specific gravity of the fuel. The calibrated cock- pit fuel totalizer indicator was used during the test and at the end of each test compared with the sight gage readings. Aircraft eg was controlled by a movable ballast system which was manually positioned to maintain a constant eg while fuel was burned. The movable ballast system was a cart (2000-pound capacity) attached to the cabin floor by rails and driven by an electric screw jack with a total longitudinal travel of 72.3 inches.
PERFORMANCE
General
3. HpHrnnfpr performance was generalized through the use of non- dimensional coefficients as follows using the 1968 US Standard Atmosphere:
a. Coefficient of Power (Cp):
SHP (550) C - (1) P 3
PA(«R)
27

b. Coefficient of Thrust (Cj):
GW + CABLE TENSION
CT - (2)
c.
PA(«R)2
Advance Ratio (u):
VT (1.6878) (3)
OR
Where:
SHP Engine output shaft horsepower (total for both engines)
6 p » Ambient air density (lb-sec /ft*) » p.
?o
6 •
lao
9 -
OAT
A =
ß .
R
GW
0.0023769 (lb-sec2/ft4)
Pa Pressure ratio •
?ao
Ambient air pressure (in.-Hg)
' 29.92126 in.-Hg
OAT + 273.15 Temperature ratio - 288.15
• Ambient air temperature (*C)
Main rotor disc area * 2262 ft2
Main rotor angular velocity (radians/sec)
Main rotor radius • 26.833 ft
• Gross weight (lb)
28

vK
Vx • True airspeed (kt) 1.6878/p/p0
1.6878 • Conversion factor (ft/sec-kt)
Vg • Equivalent airspeed (ft/sec) •
7(70.7262 Pfl) eft
Po
12/7 +1
70.7262 - Conversion factor (lb/ft2-in.-Hg)
Qc " Dynamic pressure (in.-Hg)
At the normal operating rotor speed of 257.9 revolutions per minute (rpm) (100%), the following constants may be used to calculate Cp and Cj:
IR - 724.685
(«02 - 525,168.15
(»)3 - 380,581,411.2
4. The engine output shaft torque was determined by use of the engine torque sensor. The power turbine shaft contains a torque sensor tube that measures the total twist of the shaft. A concen- tric reference shaft is secured by a pin at the front end of the power turbine drive shaft and is free to rotate relative to the power turbine drive shaft at the rear end. The relative rotation is due to transmitted torque, and the resulting phase angle between the reference teeth on the two shafts is picked up by the torque sensor. This torque sen«or for both engines was cali- brated in a test cell by the engine manufacturer. The output from the engine torque sensor was recorded on the onboard data record- ing system. ii*a output SHP was determined from the engine's out- put shaft torque and rotational speed by the following equation.
SHP Q(NP)
5252.113
(4)
!/2
29

Where:
Q • Engine output shaft torque (ft-lb)
Np - Engine output shaft rotational speed (rpm)
5252.113 - Conversion factor (ft-lb-rev/min-SHP)
The output SHP required was assumed to Include 13 horsepower for daylight operations of the aircraft electrical system, but was corrected for the effects of test instrumentation installation. A power loss of 1.82 horsepower was determined for electrical operation of the instrumentation. Reductions in power required were made for the effect of external instrumentation drag. This was determined by the following equation.
Fe (P/P0)(VT)3
SHPinstr drag " (5)
96254
Where:
Fe - 0.833 ft2 (estimated)
96254 - Conversion factor (ft2-kt3/SHP)
The nominal fuel temperature of 50°C for the cold weather test site and 55°C for remaining test sites was used in the determina- tion of engine fuel consumption.
Shaft Horsepower Available
5. The SHP available for the T700-GE-700 engine installed in the UH-60A was obtained from data received from US Array Aviation Systems Command and presented in USAAEFA Report No. 77-17 (ref 6, appA). This data was calculated using the General F.lert-rlr engine deck number 80024, dated 26 February 1981 with a power turbine shaft speed of 20,900 rpm. The installation losses used were based on 0.25 degree C engine inlet temperature rise in a hover, exhaust losses as obtained from the Sikorsky Aircraft Document Number SER-70410, Revision 2, dated 8 March 1979, inlet ram pressure recovery as obtained from the Sikorsky Prime Item Development Specification, and an inlet temperature rise in forward flight assuming an adiabatic rise referenced to ambient.
30
ananMBHB«^»«^^

Hover Performance
6. Hover performance was obtained by the tethered hover tech- nique. Additional free flight hover data were accumulated to verify the tethered hover data. All hover tests were conducted in winds of less than 3 knots. Tethered hover consists of restraining the helicopter to the ground by a cable in series with a load cell. An increase in cable tension, measured by the load cell, is equivalent to an increase in gross weight. Free flight hover tests consisted of stabilizing the helicopter at a desired height using the radar altimeter as a height reference. All hovering data were reduced to nondimensional parameters of Cy and Of using equations 1 and 2, respectively, and grouped according to wheel height. A two segment fairing was used to more accurately represent the out-of-ground effect hover perfor- mance. Fairings of the same form used In this analysis were used in a reanalysis of the data representing the normal utility configured UH-60A (ref 6, app A) to yield a more indicative comparison. Summary hovering performance was then calculated from these nondimensional plots using the power available from reference 6.
Level Flight Performance
General:
7. Each speed power was flown in ball-centered flight by refer- ence to a sensitive lateral accelerometer at a predetermined Cj and referred rotor speed (NR/ZSJ. TO maintain the ratio of gross weight to pressure ratio constant, ^altitude was increased as fuel was consumed. To maintain NR//6 constant, rotor speed was decreased as temperature decreased. Power corrections for rate-of-climb and acceleration were determined (when applicable) by the following equations.
(R/CXLXGW)
SHPR/C - - (6)
33,O0O(Kp)
SHPACCEL — 1.6098 x 1(T4 / | (VT) (GW) (7)
Where:
AHP\/0AT + 273.15 R/CTL * Tapeline rate of climb (ft/min) - [_
31 l fit /\0AT8 + 273 „15,

• Change In pressure altitude per unit time (ft/min)
At
OAT8 * Standard ambient temperature at pressure altitude
AHp where was measured (°C)
At
KP - 0.76
1.Ö098 x lCT* - Conversion factor (SHP-sec/kt2-lb)
AV • Change in airspeed per unit time (kt/sec)
At
A power correction to insure ball-centered test data complied with the inherent sideslip family of curves depicting the UH-60A in figures 60 and 61, appendix E, was determined from AFe as a function of sideslip angle (fig. 67) and equation 5 rewritten as follows.
SHPs/s • <AFe in s/s " ÄFe B-C> ^P0> (VT3>
96254
Where:
AFe*in s/s " Change in equivalent flat plate area based on UH-60A inherent sideslip.
APe*B-e a Change in equivalent flat plate area based on
the sideslip angle measured in ball-centered flight.
*Ba8ed on change in engine shaft horsepower.
i'ower required for level flight at the test day conditions was determined using the following equation.
SHPt - SHP + SHPR/C + SHPACCEL + SHPs/s - SHPlnstr drag - 1.82 (9)
32

8. Test day level flight data was corrected to average test day conditions by the following equations.
SHP8 - SHPt
'T -VT 8 t
[•*].
(10)
[*]. (11)
Where:
NR » Main rotor speed (rev/min)
subscript t • Test day
subscript s - Average test day
Test data corrected for rate of climb, acceleration, Instrumenta- tion installation, and corrected to inherent sideslip, standard altitude, and ambient temperature are presented in figures 32 through 59, appendix E.
9. Level flight performance was determined by using equations 1 through 3, rewritten in the following form.
CP
Cf
SHP(478935.3)
5/e" r %i 3
Po^3
GW(9 i.19)
6 r % i 2
P0AR2
/r 33
(12)
(i3)

VT(16.12) u - (14)
R/5
/r Where:
478935.3 - Conversion factor (ft-lb-sec2-rev3/min3-SHP)
91.19 • Conversion factor (sec2-rev2/min2)
16.12 - Conversion factor (ft-rev/min-kt)
10. Data analysis was accomplished by plotting Cp versus \i for each test at the average C-j and NR//8*. The curves through these data were then cross-faired as Cp versus Cj for lines of constant Np//8~at a given u for an initial determina- tion of what effect NR//0* had throughout the level flight envelope. These curves were subsequently faired into individual carpet plots (Cf versus Cp for lines of constant u) at each NR//9 at the average test conditions (figs. 20 through 31, app E). The classification of these carpet plots into related families of curves (Cp versus %//e" for lines of constant Cj at increments of u) allows determination of power required as a function of airspeed for any value of C«j» and NR//§~(figs. 4 through 19).
11. The specific range (SR) data were derived from the test level flight power required and fuel flow (Wp ). Selected level flight
performance SHP and fuel flow data for each engine were referred as follows.
SHPt SHPREF * 1_ (15)
660-5
WFt WF « fc (16) rREF
690.55
34

A curve fit was subsequently applied to this referred data and was used as the basis to correct Wp to standard day fuel flow
using the following equation.
WF - WF + AWF (17) 8 t
Where:
ÄWF - Change In fuel flow between SHPt and SHP8
The following equation was used for determination of SR.
vT SR - f_ (18)
WF s
Stabilator Position Effect:
12. Tests were flown in ball-centered level flight at a predeter- mined C-j and u. Stabilator position was varied incrementally up and down from the trim schedule position to a predetermined limit based on the main rotor mast endurance limit. Change in power required for level flight due to change in stabilator position for a constant u was obtained at each stabilized increment. Power corrections indentlcal to those used in the level flight performance analysis, equation 9, were also applied. Plotting stabilator movement and corresponding change in power required show they vary as a function of u and Gj (figs. 69 and 70, app E). Direction of stabilator movement Indicates if the change in power required is additive or subtractive.
13. Stabilator position is a function of collective position arc* indicated airspeed in stabilized ball-centered level flight. Different dimensional conditions, and correspondingly different stabilator positions, can produce the same nondimensior-.il condition. Collective position analyzed on a nondimensional basis normalizes as a function of p for the same Gj regardless of the dimensional circumstances. Indicated airspeed varies with dimensional conditions for the same u* Level flight power required, therefore, can be adjusted for the effects of different stabilator positions caused by flying at different test conditions for the same C-j. The procedure is to determine the difference in indicated airspeed for the same y and convert this difference into change of stabilator position
35

and consequently ACp. Data at the different test conditions allows solving equation 14 for Vj, and determining 6 as follows*
o- [1-6.8755856E-06 (HD)J
Where:
Hn - Density altitude (ft)
4.25584 (19)
o6 (20)
Calibrated airspeed (Vcai) and consequently indicated airspeed (Vic) at the different test conditions are determined as follows.
Vcai-H79.12 ({[ö] {[l 2 -,
+0.2 38.97(0AT+273.1SW* "••I
,2/7 vl/2
+li -l] (21)
vic • * (vcal» SniP airspeed system position error, fig. 71, app E)
The difference in stabilator position between test conditions can be obtained from the slopes of the airspeed versus stabilator angle schedule.
A STAB - AVlc A STAB
AV ic
+ AVi(
segment 1
A STAB
AV ic
+ ...
segment 2
Where:
A STAB - Difference in stabilator position (deg)
Avic " Difference in indicated airspeed within an airspeed segment (kt)
36

A STAB
AVlc Slope of stabllator schedule within an airspeed segment (deg/kt)
0 deg/kt; 0.1042 deg/kt; 0.7250 deg/kt; 0 deg/kt;
above 147 KIAS 80 to 147 KIAS 35 to 80 KIAS below 35 KIAS
%
3b 80 147
INDICATED AIRSPEED
?00
Figure 1. Normalized Stabil ator Schedule
The change In power required to correct for differences in stabllator position is obtained when curves from figure 68, appendix E, are cr->ss-faired as ACp versus Astabilator angle for a specific u.
cP(te8t condition 2) " cP(test condition I) ± ACp
Where:
+ or - is employed depending on direction of stabllator movement when trans versing from test condition 1 to test condition 2.
+ ;TEUP movement ;TEDN movement
TEUP * Stabllator trailing edge up TEDN « Stabllator trailing edge down
37

APPENDIX E. TEST DATA
INDEX
Figure Figure Number
Hover Performance Hover Summary Nondlmensional Hover Performance
Level Flight Performance Nondlmensional Level Flight Performance Dimensional Level Flight Performance Inherent Sideslip Change in Equivalent Flat Plate Area
with Sideslip Stabilator Effects in Level Flight
Ship System Airspeed Calibration
2 and 3
4 through 31 32 through 59 60 through 66
67 68 through 70
71
38
».-...-. .. .-._ aim iriinii «in

u- T
j.
NOTES:
FIGURE i SUMMARY:. HOVER PERFORMANCE
:UH-6aA USA $/N 82-23748 MAIN fcOTOfc SPÖED * 258 RPM
1. NORMAL UTILITY CONFIGURATION CESSS FAIRINGS> 2. "yHEEL"REIGHT MEASURED' PROM BOTTOM
OF LEFT MAIN WHEEL LESS-nH^M ..THREE- KNOTS DATA DERIVED FROM FIGURES 2 AND 3
INTERMEDIATE <38 MINUTE LOTTO POWER AVAILABLE -+~:-epTA3frB> FROH-USAAEFA REPORT NQ. 77-t7 6i. - SOLID; LUCS DPMOTE 100 FOOT MAIN WHEEL HEIGHT 7. DASHEk LINES DENOTE SINGLE ENGINE OPERATION
"»nrs FOOT WIN WFEEL HEIGHT
*y\>W'VV>:A.ki3<i^

W^vmnr'^MWl HIT.«1 ' »"• • •'•»'«»'MW ••>'•! !•' w**1* wwm-*mvwr >»v»i/n w w TTTT » v <rT • w^n w i wu»r" w»i »trwn^ 'ipi»v« VWM
C%>'
^
v •v
aa&&^^

SYMfeX
..ja L~ e A '
w
V * i_ *
NOTES
D£NfeItV! ALT
I 34te .
4758 4fipa 6180 SSjtt
j p <WH>j*" i j •" j '; <$BÖ • JSn
mi
108-
1 .
2,
-1096a- 10540
WHEEL HEIGHT MEASURED FROM BOTTOM OF LEFT MA3N WHEEL
VERTICAL DISTANCE F&OI BOTTOM OF MAIN WHEELS TO ;CENTER OF MAIN FpTOR HUB - 12 FT
TESTS CONDUCTED AIRCRAFiT TETTHERED
THE THE GROUND
A
S7
WINDS ÜESS JTHAhj THrtEE rtCJTSJ
«. 1 M - » ' • fl.« : »_- .I." ». • H.- H..-. *."•. 1.,- .1 1 W 1 «..

FIGLRE 4 NONDIMENSIONAL LD/EL FLIGHT PB*FURrV\CE
UH-60A USA S/N 77-22716 e»xJ S/N 82-23748
M - 0 10
NOTES t MDRMAL UTILITY (XNTMURATION <ESSS FAJKIN3S5 2 BALL CENTER TRIM CONDITION
• 3. AVERAGE UDMSIIUXENAL CENTER OF GRAVITY LOCATION AT FS 347 4 4 AVERAGE LATERAL q^NTER OF GRAVITY LOCATION AT BL 0 2 LEFT B. CURVES OBTAINED FROH FIGtRES 20 TVfiU 31 AND b3
- iflfr-
«4
«8
78
72
Lß'
«a
«4-
68
58
i 4.5g..
^48-
48-
38
32
/
CT - 0 8096
T f
j f + 1- j; .. j.. - .]. • ..).. -• |.
! : . } .....j ;
i -
ICT - 0.0080
,.,......_,.. ..: I ..!....;.—I..-.
cir - 0.00^5
!CT «t"8.
246 2S0 2S4 258 262 . 266 270 274 REFERRED ROTOR SPEED CRPM>
278 282 286
if-jOLf-y rj> • j. ;\r ^ £ . •• r.^./.<r.»-, '.'i' ; • /,..:: m ,/ . A , V'B-A'-^'.--.: ••••••.»>,*•,- iiu.^v.M.ii.T.i..i.ij^!ikS, >'J>-;i-,!(,.)f',h'.v n' .;»-.: i

i

'T*T*'i'»r,if» vr
PIGURF. ft • .-. : NOi^OlHENSlONAL LEVEL FLIGHT F€^:'C«M.ANCE
UM-6QA USA S/N 77-22716 ^ S/N 8?- 33 MS
'ft A4
**•
kytes .1. M»m_ UTILITY CONFI6LRAT:IC*,' a:ssp rAdti»fes> 2 BALL CENTER TW COMMTION 3 AM3WJ5E. U^GHLDINAi. -CENTO* OK »^VIT't LÜpA-T-ISTn. AT- F5. 347-4. 4. AVERAGE LATEÄiL. CENTE;< CT. GRAVITY LOCATION AT;B- Ö.g LEFT! E. CLRves OBTAINED n^oh Fteur^s jM TU?U 31 Ato 5&
.VA- ^JL _:-:.;A .v .v,.:...'-,:^,^,^ jy .^•.^'•L.'-Or. -->

, ..4- • • -i
T\ FIGLRE 1 .+... ...... biCWDIMENSlQNAL LEVEL FLIGHT PERrÖRMAfsCE
U*-«ßA USA S/N77-22718 end S^N 82-23748
M - ö 16
H+ hOTÖS 1. M3fiHAi_
2 am.
IS äjfiväT"COT AIN§>
/ cd^rdftATioN cEsste FAIRINGS:) TRIM
AT GRAVITY LOCATION AT FS 347 4 yiTY yXÄTTON^AT BU 0 2 LEFT

I
v.
^^^^^E^LäOR^ <*^d S/N 82-23746
M - e 18

... . F3GLRE :9 . .
U*-80A USA S/Tf T742..716 cr»d S/fN 82-23748
I ' "' > *>'fc.i«' • "" ' ! • • : • 1 • ! • : ; :
NOTES- '1 ;• M3fihAL UmjTV CCNFieURATKN CESSS FAJRIN&S> ' 2. BULL CENTW TRIM O0M>tT3!0N

HWHHIIIIIUIUHIJI^ inww^iji iui-uii^»»"iiwmT»w -ynByimtwi H mi'»"wi.»iiw'«i'ww •IIIUMIUIIIW
FIGURE 10 NONDIMENSIONAL LEVEL FLIGHT PERFORMANCE .
UH-60A USA S/N 77-22716 and S/N 82-23748
fl '* e 22
NOTES 1 M3RMAL UTILITY CONFIGURATION <ESSS FAIRIMSG> 2 BALL. CENTER TRIM CONDITION 3 AVERAGE LXNäXTLDINAL CENTER QF GRAVITY LOCATION AT FS 347. 4 4 *' "RAGE LATERAL CENTER OF GRAVITY LOCATION AT. BL 0.2 LEFT 5 CURVES OBTAINED FROM FIGURES 20 THRU 3S AhD b3
to
2« 2$0 . 2S4 262 ?&6 278 flEFERBED RO^OR SPEED <RRM:>
4 2/8 *82
.L..i.„.L ' I '
r,m^,-_ -u ~. - -.-..-. -_•..-„.-...-> Cm - M ••-..-- -w..--.-^ -u ru . --• i...-- -•< -..p.'.-./ -. rt.i-w,-. •-> • * ••*••»:. ä. .'•*...• I-, r «;

. FIGLRE 11 J-L-:.. I NOSlQlMgNSXQNAL LEVEL. FLIGHT PERFORMANCE
LH-60A USA S/N 77-^227 i 6 <*>d S/N 62-23748
" "fi'm ö '24 ' 1 • """!
NOTES • 11 ." M3RMAL UTILITY CCNFlGUPAtlON <ESSS FATRJH3S> I 2. BMJ- CENTER TRIM CCMXTTTCN 3. AVERAGE UDN3TOD2NAL CENTER OF GRAVITY LOCATION AT FS 3471.4 . A AVERAGE LATERAL CDTEfelCf GRAVITY LOCATION AT BL 0 2 LEFT E CURVES OBTADCD FROMFJBÜSSi20 TWJU31 A|*> 53
;
:
•
;. . : : .{!
1 • ••••{•••-- :
.
» -
...... : i
i •
n ^. r, f : ^i /. f r . y; «• . r.; v- vmmf -r ^ ; •-.. J- ^ ^if . f.lMA.n »flnfl.V ,!f l ^i^,;^ W,,V .'.^ V *-.••-, ^ ^ ^ .

. FIGURE 12 NONDIMENSIONAL LEVEL FLIGHT PERFORMANCE
UH-68A USA S/N 77-22716 cr>d S/N 82-23748
0 26
NOTES I NORMAL UTILITY CONFIGURATION CESSS FAIRINGS) 2 BALL CENTER TRIM COCOTICN 3. AVERAGE LDMBTTLDINAL CENTER CF GRAVITY LOCATIDN AT FS 347.4 4 AVERAGE LATERAL CENTEROF GRAVITY LOCATION AT BL 0.2 LEFT 5. CURVES OBTAINED FROM FIGURES 20 THRU 31 AND 53
1
m
"M
262 266 270 274 REFERRED ROTOR SPEED CRPfD .
-- M • -•*- •-* '-• -» -• k I'I * 'iff * r " t *iiiift.i.'.j..'iii hi »na

4-
I . : . FIGURE 13 i NOsDB^ßlONÄL XEV£L FLIGHT PERFORMANCE
U+-60A USA S/N 77-22716 end S/N 82-237-«
'•; : '" " pi* *.& " r ••{•-•
NOTES.' il .NORMAL. UHLITy CONFIGURATION CESSS FA3RIN5S> ;
2. BALL CENTER TRIM COhDmON . 3\.AV£RAG£U>JG£nJDINAL CENTER OF GRAVITY LOCATItti AT FS 347.4 .
4 AVERAGE LATEWL CENTER_CF GRAVITY LOCATION AT BL a.2 LEFT E. CURVES OBTAINED FRO-lfejRES '20 TVRU 31 AND 53
i-iTV-yj ttV --• W "Vd y.(H7«i.1j'.'d^'.n;i.i.v^Jr.vi.v^.M',^i.,^^ ^. r. m. r.f.fMu-i -,.in; r-r-,-^, - TO-,,, -., ^,,v.n.i.-«uv,-....v.,.JP.Ji; » . r > >

ri|Fl»'Ty^1|ll|»ll ••Uli '••'.• M-w-'y"»-" in'T"ir'tfvi"tf-u-ni- -IPIM-'VP rww «< w"nw<WT." (wn>
• . FIGLRE 14 NONDIMENGIQNAL LEVEL FLIGHT PERFORMANCE
LM-60A USA S/N 77-22716 cr*d S/U 82-23 ?4S
M jüia:aa
NOTES: 1 . NORMAL UHLXTV ÖOM^GtRATtON CESSB FAIRINGS* :
2. BALL CENTER TRIM CONDITION 3 AVERAGE LONCTUJPINM. CENTER- OF GRAVITY LOCATION AT PSj 347J 4- 4 AVERAGE LATERAL CENTER OF^GRAVITY: LOCATION AT: BL fe.g (-EFT 5. CURVES OBTAINED FROM nrÖURES 20" THRO 31 Ak> 53
v..
V.
^w ! /*• C» t - e.eite .:. . . . ;. I
266 270 274 REFERRED. ROTOR SPEED CRPM5
--«•-•» 1 ••.»-•-•-• --^ •'-'..•- < --••- t-1, - . •?*'-" - - '• • 1--"-- *'• * ••< -.JL-«•-•/. .ML .Jf..

FIGURE lb INDNDIMEi^SICNAL LEVEL. FLIGHT PERFORMANCE
UH-60A USA S/N 77^227t6 end S/N 82-23748
M » 0 32
„.,.4.
NOTES ! NORMAL UTILITY CONFIGURATION <ESS$ FAIR2NB55 2 BALL CENTER TRIM CONDITION 3. ANFRÄßE LONGI'lUOINAL CENTER OF GRAVITY LOCATION AT FS 347 4
j 4 AVERAGE LATERAL. CENTER CF GRAVITY LOCATION AT 8L 0.2 LEFT S CURVES OBTAINED FROM FIGURES 20 TVftU 31
!—--+- 1"
•:-|W#-
*9S —r
r«e-
#
~84-
*
::LL:i;i:i;:.:i::.
-78
?*-
• W- !
CT « 0 0090
>'"
-; «*~ " i Ur~s„.
- m J ; J-:.
58-
•«*•
CT »-8.9065
•"j . . , . ... ,. •L+H
:w=P: 4— "JCT •*•«-.• wee- . .. j :, ,.
•i i !---;-
•fCT •••* 8-8070
•••• (•• :—1
48
246 2S3 254 ,=58 262 266 278 274 REFERRED ROTOR SPEED CREW
276 282 288
\\ iTI1" •'•»'w •* » * M-"*n ».^uni.'.Muii-.ünii.'ii-. v.. *•> r . f.,-*i TT4 irj IT. m -n-r- • v" f r - IT- •»-1 r i»".«-, • J* ^ ji • ' •• ."'

NOTES:
FIGURE 16 NONDIMENSIONAL LEVEL FLIGHT PERFORMANCE
UH-60A USA S/N 77-227"16 and S/N 82-23748
ju '• 8.34
1 NORMAL UTILITY CONFTGURATTON <ESSS FAIRINGS) 2. BALL CENTER TRIM CONDITION 3. AVERAGE LCNGTTIDINAL CENTER OF GRAVITY LCCATIpN AT FS 347.4 4 AVERAGE LATERAL CENTER OF GRAVITY LOCATION AT BL 0.2 LEFT 5. CURVES OBTAINED FROM FIGURES 20 THRU 31
/1 ifiiiMfihfri ir <<i -fi'ii *•, •..'..^.•^.•.•v^.^vi'<.':..'..'-u.v.-.^r--lvr aMH • ; [ », *-' S£ !•- "-' lÜttt

„ I in umi •»•Pinmiumi im i • I i i i • n • i • —.—...--.— J« —
w !" I
i£
; FIGURE 17 ^DIMENSIONAL LEVEL FLIGHT PERFORMANCE
UH-6ÖA USA S/rt 77-227T6 and S/N 82-23748
ft - 0.36
"~1 NOTES :f MDRHAL UTILITY CONFIGURATION <ESSS FAIRINGS) • i £ BALL CENTER TRIM CONDITION .-.;- : . ..;. . -8- AVERAGE. LONGITUDINAL CENTER OF GRAVITY LOCATION AT FS 347.4. • i. t4. AVERAGE LATERAL CENTER OF GRAVITY LOCATION AT BL 0 2 LEFT
5." CURVES OffTAUCD FROM FIGURES 20 THRU 31
V; 1* "-' 1" V -.'• •.'• '.- •-' «w- ^ >.' %••• '-" ^ "-- *"' ***-" ••'• "- "''• *'•''-'• *•" V'-^ VLVW ••% -^ -"- LV-^LVAA^. ,% -x ^-^L^LV.^-.JV.J.2

FIGURE 18 NONDIf^MSIONAL LEVEL FLIGHT PERFORMANCE
UM-68A USA S/N 77-22716 cxvd S/N 82-23748
M - 0 38
NOTES I NORMAL UTILITY CONFIGURATION CESSS FAIRINGS) 2 BALL CENTER TRW CONDITION 3. AVERAGE LONGITUDINAL CENTER OF GRAVITY LOCATION AT FS 347.4 4 AVERAGE LATERAL CENTER OF GRAVITY LOCATION AT BL 0 2 LEFT 5. CURVES OBTAINED FROM FIGURES 20 TFRU 31
s
i
ne
i 12
186
«94
tee
1 «
> • - . 92- x :
i A»
84
ee
76-
i
j-7fc
i
«8
64
88
/
C**0.
,... i
GOB»
/; ~;"7 X""
_ i__ ._
cf""«? 0:0070
:/ ......^
2S8 262 2Ö6 270 274 i 278 i REFERRED ROTOR SPEED «CRPMJ.. .;. . j !.
I • i *!;[•• M j • -; f i i !• j"! i
'••'-'' •••»» -> -' -•- -*- CiMMLi 1J aa aa aa&c ^ ^ =k. aj aaiim »-* aa •- £*&* & &*&> - • a fl £. a *v y.v./yjv.vjv.rv-v

FIGLRE 19 NOsDIhEf^IQNAL LEVEL FLIGHT PERFORMANCE
LW-80A USA S/N 77^22716 <w)d S/N 82-23748
ft '«* 0.40
'f NOTES: ') / NDRMAL UTILITY CONFIGURATION CE5SS FAIRINGS) 2. BALL CENTER TRIM CDMÄTICN
M*--
—i-~ J
•- • '
.......
. .
3. AVERAGE LOCrruaNAL CENTER Cf GRAVITY UXATIEN AT FS 3*7.4 - 4. AVERAGE LATERAL CENTER OF1 GRAVITY LOCATION AT BL 8 2 LEFT' 5 CURVES oerrAECD FRCM FIGURES 20 THRU 28
1 ••'•" "
•••"—1 H2
"" * ' j j '] : \~ \" I I '"{ " ' \" '; ; ' I : ' " * " ] '" : •••:•••--.
• •-• i ..„-. itee
• j
i ! i . : , • ! : • '
r ••••[•""•" | j ] ;"" j • ;. ' ; ; ; ; ; • : f ,......,:...
• i :• -
i .... , --••!•-•••{-•" {- j -i I ; -•: I----4- r \ I • •• ••; • ••• •: • •
• •
W*H .. .) .;
: -~~~j~r-
: I : .. ........ .„ — •ri—
i
i [ .
• \ ' • / CT 4 0-0070 i • • •;•.. j--: j •
j • ; f jS\ i •• \ : 1 ' i : ) '•• ..... I ..... . i.jr ;•;•: ; |. • ; • J • • I"' \ ' "•".
H~ • .:. ! ;• -4- k|:G
1 !_L • (•• •• t !•••.; :••(•"' 1 • •• • V •(
(**~
;T! :;;.;. ...... ; Hr H ! "i" ; tif ••;-.! ; \: rA : •
:* u-~- LJ.L_, L_J_i
... j.
— [ I | !";'""i r~'~\ i 1
J.. .
i -{§-
-88"
. • ; i
hr- : 1
—;—H . 1 . .:...< . . .
: L .Ä J
1—'—" : 1
1 —:—« i : ! ; i
Ti'iiiiT . .: . j ' .. j.-..]LJ
' • I ;
i. -.i. ..!. : ""'i:",'r:':j!' •
---•- w' '.'"••I ':".. .!:.i:..!
._LL • :. 1 .
•:4- :•:•!-::
H; T' •• •. .-.y.::.l.:.:..•.
. : ...1 . !. -iHHi: . -J.J, !•.:... -f- .
• .! . ; .
i. { ' i •!•!-' ..Li..;.-..
„.:.!" \:. •:.;
1 ..:....
.1 . • -i. : ::••: •••
, ^ ...;.„-
-. : ..;^-J
-~^r"' •• :'
• •lit'
.;..: :;;|:i= j 1" v
• ::f: ; ..:i. ; j. ....:.. ,:.;.,
i
_..|._i
. ; . •:•:!•-: •. j':!"
.X .... _ .;.;!.:
:r||l: •. ; i: .'. 1....
.!:; .
•V i -- = ; •^|-: "!'i:::.
• • : . .•.!..; !
' \ \ ! .'; ::':!;':j;:l:i':; iiji;: ! ....j...
• . : ...I •. i
• '•
-f- jlj-i .,:] .-.; •
... 1 .. i -' "I" ' : i
..., •• ]•'•]. : •••.'•: 1 I '• i
i : :: i : • . . j ;.._.! LJ ...j'Jj:j....!_ •: llllJ^' . i..j •
; •• !•••; h\- 1 :i- ...j,_-
S ••:•;--
•"I .. ::;:..
; 1 ;••'• j ••: •••
7-7-i •
' f ' I' ' ! ,.;.;r|..:...
! :l 1 : . 1 ;i
: :-v;:;M . •;;.; ::.-i =
..- ••••j:-"'
,.:.j..r rf h«*- *: «i ••• '}-.;- .-..(.: . ;•;; ..:i-
rrffrrr-:
h- •
•-I "
1 --T- H---;--]-----rr" • '
...,L... r-j-f- • 'i ' ':- :: ; •. . 1 ! ;•.!:' i ;•;• i ; ! i • : ! ' '! "i ,::
: ..J!;:. •..•Ll. 1.. :. 1..;.. 1.,:. . .; .j ;. j . j. :. j : j. ; ;..:..[,'; .
• :• i ' •] !.•.[..;• |
• •; • • .$ B •|a 0 • 254 • 2fB • ....'! 2E" ^5' i si»; ! 2H • j 2-J8. 2K! ! i :2$S- .1 .:
'•-':•--
"••:- •
..... ... .
• •
i ...:....! „ ...;
±ü
.... !
>. ' ; ........
rj%vki«iÄU«\Jw\aifaißfflRiKvwir*u>cy^

'V—f—'-.--^w -v v",-jr 'V
.V.N
70 813 90 '03 THRUST COEFFICIENT x'. \ 0 4
53
••'.•--->->•.'••-••> •"- -''-"'••..•-'•'^.'•^.'-_•_>••'-•»*'- .•'--h%lK*'-_->->Mi^ -*' •"•j,"'.-">• -"»/-. w'- J".,x>_B>_W^:J,'V_-"'-•"•••'•

-"wj• »n ^^
FIGURE 21
;UH-60A ISA S/M 82-23748:
NOTES X.-NDBMAL UTILITY. CONFIGURATION.:CESSS FAIRINGS} 2. BALL CENTER TRIM CONDITION 3. AVERAGE LONGITUDINAL CENTER OF
A 6^VlTY--4J3CATI-0N--AT--FS--34?. 4- -- - -~ --— ^..AVERAGE. LATERAL CENTER OF.
GRAVITY LOCATION AT BL 0.3 LEFT •fcr-pOIWTS- DERIVED' FRCH FIGURES 32 "THRU" 34T" "" r' —
^^^/C^:^/^^;A^/'^>^^:-^/^•/•.fA•^^^•.v^.VA^/.t.^^^v•/l• /^ .•..•• ,J^>\^VA%\VWVA\%VA^^^"AJ^VV\:^?^.^^^..O:

IWI^WWWH'H". tiiuiiM"!' fiM^'P <i i ii*'tT".'r"F'r'?' •<r>*T>\.w'w-••*"&'-.**-* '
:v
:..:.;. FIGURE 22 ..NONEttOlS^^ .
IUH-08A jfjSA S/N 82-23748 . ; .
- ~ • REFERRED foTOfr-SPEEfr-^-frJSrt -
. NOTES: L..MSMAL L2ßJ^^CX)boai^TiON <ESSS FAJKD^S^ 2 BALL l^NTgR TRIM CONATION 3. AVERAGE LONGITUDINAL CENTER OF ÄAVSY-4£GAT4ÖN-ÄT»-Ffe-'34^-M -
.4.. AVERAGE LATERAL. CENTER .OF;. . . .!...;. GRAVITY LDCATirON AT BL 0.3 LEFT
•- S." POINTS" DERIVED "FHOWTlGURgS^aTHRb '34
Or^üMttÄjftX^i*»^

• ^••^••^.•••^. •.•"%' •!!•• »vT1 •vi,v.^T^y",g'.^i"T|!"* '. ". ^'- «'- »i ".^'."T1 v v»; *v * v ' "n" v ^ i?»'..'» tf»vT*T»y » »r^f^r
f I ?;.-) FIGURE 23 ji
J ^' '' '""L7jh^?.> «<*•** S/N ter2Ö748i. ; 1 : t t - •••
irapORra^-WW-SPeee»- «r 5*58:3
. © !
': «1
•"at*
90
60
Lfl:
70
•9
fi 50
40
<\1
.JsBSDEB- l*..fflft«L. UTILITY C0hf:TCU8AIIQN.<ES55 FAURIHS^ 2 BÄLU CENTER TRIM CO^frpDN
• 3. AVERAGE LCNGIYUDINAL CENTER OF "! ~-4-rGftAMX?E¥ LOCATION AT--^S ^4-7,4- - -- •*- AVERAQE LATERAL CENTER CF: .
GRAVITY LOCATION AT ÖL 0.2 L£FT • D "PDTJsrrS DERTVH5 FRCtt FTGLRES 35 TH*U 44"
IT
00 90
60 70
60
50
«0
70
60
It» OO
30 40
o:
Or"
.0
0'
0
ß
A*. » 0.-1 Q
M - 3 12 P
/
/
/ 0
/
•
0" ../. : i
/•• £'
. ... _ a. .* 8. 14
30
S0 78 &3 'HRUS r
90 !00 if .K ! fcy T
I 10
•^S&LitäLZ^^^

> ^•w'wv"iwv<y "*"***'"'* '»•••»«»"»'—y!y>v"yip' 'T">" IM -iMHft'tium' «•v--'''»'-i'.-<ii'»-sM'iv»iw->kj^«ij1^ L"t'r'jf '• fiuMip "J»U" P y
,%V.
J*J\ IL. > •_" .«_' "T- <" >#rs fU LA* JV .*» L U * a •)' i / '.•VSSJ?}UI

•tu TIT .vw "•• miw^umwwnii'wimnjn »'••<• muMi mm "vv» WJW-BUB wi 'int1!*» >**» WB'WB« n»\imi »n'ww i>»jim '••c'fUMrvi^jMi <mmj t»t'« »c i w B."
i
>.
£
m
FIGURE 25 .LEVEL FLIGHT PEEEORMAhCE-
Ü+-6ÖA U£A S/N 717-22716 arid S/N 82-23748
•: :--RBFBRRE&"Wf8R- SPEED ="258; 3
NOTES; .1 ...NpBmL.LTgjLlTY CONFIGURATION CESS3 FAZ82N3S2 |2. BALL CENTER TRIM CONDITION 3. AVERAGE' L&ISITUMNAL CENTER OF'
•:- - - -— GRAVIfTV-LÖGATIQN- AT FS -34-7 4- •- — - 14 AVERAGE LATERAL CENTER .OF;
GRAVITY LpCATlON AT BL Z. 2 LEFT --5.-PDINT5 DERIVEtr FROK riGÜRES" 35 THRb 44 '
3|8: :\;L..:.:€j0..: ..!.' . 00..: .100 THRUST^ (EFFICIENT * to-*
53
M^'MV^IAI^V^

miKiwim»miiinimn WIPIM WI^I w^niwwmwwim'iiii' T*T
fas
FlGUfcE 26 NONDIFENSIl^^
^H~6feA U?A S/N 8^-23748 | . .! .
i! R0TOR!' 9Pfejp3r_wt'25D5y0r "~f "I
NOTES: i^jflBttTurin TBg:..^to:defeTi^N.X£s% FAXRINGS:> 2. BALL CENTER TRIM CuivOfLTION 3. AVERAGE LONGITUDINAL CENTER OF
- -GftAV5rYr4=geATgQN AT re -34^,4-L ; 4. AffiSfe LATER^LCEMgR 0FU . i ..
GRAVIfY: LOCATION AT BL 8.£ LE^T -Sr^PprNTte- DERIVEP"FRfaM rjESURpS. 4f THRU 47'
SÜß 3Ö^ICIE^Ti, ^_i^ L. i.T
r<*OT-y«v^WA/^v."ÄVii\' ^^V//JV/*-UV'Y>J>J\^V^

nw-i»^TWTw>TjMu^j^\iin»r«y^w»»HPw •»»•'»•••* v*w«w«T"g»B-»r«w"V«V'»i"«i-'rrwv^\rv • »"•.»^i1 wjpii"HF»y*v.'^*ir.'^.'lF',I^V*l'^'yv*'V
tettetgi.-2F-.i-j... ;..:u.:.
70 80 90 100 THRUST COEFFICIENT x 10''
65
v<<£a^ücüa&^^

rv*^W '"i" X^ "U" '^ '\^-V "^ ~V" r^T--»" WVTM-VM"
p SSV*
f.V- --.<-. •<•--". •<-. *VC •/*£/***, <j.*'Sl\ •'. •SJ-SL". ' \"OT4 WV.V' VGCTOC ^Tl'^.^'v.'^'i V v^-A,r^'/'».,r'-W«.-"-/ •/ •/'•.

.. • FIGURE 29 NQNaEENSf^^
i UH-§0A pSA S/K te-23748j . '".];/•:
- r ••-REFERRED £o7eft-spEEfr -^i-r—- ••—:—
.NOTES ••. X JSBMALJJIIUJtf £E£3gL FAIR^QS> . BpHTCENTER TRIM CONATION
LONGITUDINAL CENTER OF vT£QN-AT-«-347.4 ^- ,
4.. AVERAGE. LATERAL. CENTER OF. (CAVITY LOCATION AT BL 0,11 LEfn" | !
-g.-POINTfe-OERIVED- FROK FIGURESrflfrTHRp 52:
&&SMM^J^^

m
i
tf*\s
FIGURE 30 NONDIMENSIONAL LEVEL FLIGHT PERFORMANCE
.UH-60A USA S/N 82-23748
• REFERRED ROTOR SPEED * 27$. I :
NOTES i ... NORMAL UTILITY CONFIGURATION <XSS5 FAIRINGS) 2. BALL CENTER TRIM CONDITION 3. AVERAGE LONGITUDINAL CENTER OF
GRAVITY LOCATION-AT FS 347.4 4. AVERAGE LATERAL CENTER OF
GRAVITY LOCATION AT BL O.1 LEFT 5. P0INT5 DERIVED FROM" FIGURES 48 THRU 52
&AJ-
8N MWÄiwv^v^a^vw^AW^^^^

rnir-T-»
itpi>iiiiii!fefii-j 31
Ttmx
R^FERJCP fröret,$F^-f-g7M
M. MAÖJCEI 1 ».-..<. t
f-9&- /i}- 0128
""I r-v 8.32 ! • - • I
78 . 80 90 !i, THRUST COEFFICIENT x; 10 4
69 ••••• -t
n^*te^^^^

LEVEL iFLIGHT! PERFORMANCE "itfrrttt USA $/N 62-25748;
'TO5'"; AVQIlWt ÄVG ' AVG ' ÄVG ' ÄVG" ! GROSS CG:. LOCATION ; DENSITY: O.A.T. ROTOR;
WEIGHT LONG LAT ALTITUDE i--*€«SfflD-2 CBL) CFEET> CDEG.C^ CRPM;>
•T CONFIGURATION
CLB:> CFS:> 15110 346.9
0.25-1
0 26
SIS 0.15 -1 OH
is8'18"1
& . S.05 H
0 00-
3206
2889 -
M
W 1200 -i
800
0.4LT 4Ö70
33
23.5 244.8 0,000510 NORM. UTI^ .._ 1. HI CES6S FAIRINGS)
NOTEi 8ÄLL (tCNTÜR-TfiaW CtONDtTlON
uJ ilrT-T.-f-?3-: ms:m\^B r0v9i
-0.-81
-0.7
CURVE DERIVED FROM FIGS. 4 THRU 19
^ ltd 90 110 138 TRUE AIRSPEED CKNOTS)
70
50 72
4fe&iMJl&^^

?*w^~.J=s^*\r^rwv TU Tvrvwv"
FIGURE 33 LEVEL FLIGHT PERFORMANCE
•• LH^0A tJSA S/N 82-23748
M
CONFIGURATION ÄV& ÄVB ÄV$ ÄVG AVG R£F
GROSS C.G. LOCATION DENSITY OAT. RO^OR WEIGHT LGNfc •-•LAT ALTITUDE SPEED CLOD CFSi> CBL) CFEET> CDEG.C) CRPND 19490 347. KFWD} 0.2LT 6300 23.8 245.1 0.008978 NORM UTIL
AVG CT
NOTE« BALL CENTER TRIM CONDITION CESSS FAIRINGS}
0.25-1
0.20-
0.15 4- TgVEöra QPQE: B
«•«-1 < I *.-1.- .».-..••- • iMaf*-- '•' -••:•". aia J MMI v.>..i>..'...T.->..i.TiP..v^^^ .•..» -.^ .- A:-..»;.-.. ^ . ^ .•.-.• .^,

mrmmmmmmvwmm PI mi I •inwfwwwww*'. ^wmi*zmwmmmmmm^mmm*wm*m^mimn*iwumn 1WWWJ w»m'
FIGURE 34 LEVEL FLIGHT PERFORMANCE
LH-60A USA S/N 82-23748
CONFIGURATION
(V5J
AVG AVG AVG AVG AVG REF. AVG GROSS CG LOCATION DENSITY O.A.T. ROTOR CT WEEGHT LONG LAT ALTITUDE SPEED ' CLB) CFS) CO.) CFEET) CDEG.C) CftPM) 19360 347.3CFWD> 0.3LT 10830 16.5 245.4 0.010472 NORM UTIL
_ _ CESSS FAIRINGS) NOTE: BALL CENTER TRIM CONDITION
0.25 -1
0.20 - u.
n a B a as Hct]
.raw ••. •. " . <.-..*. .*\. + if • ^»•vii.^w'i^ T.-wj •(vy.!'. K-.-r- «•. *•-*•..••<., *

"--.
.--.."-•-' •••_:. - " i' - «* e ' 1"* •- "^ •'" '- ' a ''"•*-"- -"- * ----- ---

"Tjr'Tw-Kir-vnr'—w •*.-»"• » JTT-»W-'*
P1GUWE 36 i LEVEL:FLIGHT PERFORMANCE
ÄVG . AVE~ "' AVG AVG AVG:T«F."WS":'"" * f• GftCSS C.öi. LOCATION COÄTTY OAT. ROTOR: C* : CX*ri&A*T?ffiN JööHT i&& -. ya ALTtn&e s*e&>: * C~-- CLÖ> CFS> . CfiL:> CFÖETD CDCG.C) <ftPM:> isefee 34ftj öl-» ... "668Ö 9.S 2S8.3 e.aoaooi rcRM uny.
NOTES: 1 BALL CENTER TftlH CONKITEON e.ae
e 2S -
«2B-
«; f&-
2. A?^ALQ-t44CV^ ANfr t^tt» fiftACKgTS ADOgfr 3. 3.s FT£AFE .jpcqEgpRfrrEa.TO A: . DßAG DIFFEREKlSSBEnSN tEST:
FUEL FLOU..IhDEEHATItfEL
niiglaf- •#&%; -.;

FIGURE 37 LEVEL FLIGHT PERFORMANCE
uH-eaA usA S/N 77-22716
AVG AV& AVG ÄVG AVG REF GROSS CG. LOCATION D04SITY OAT ROTOR WEIGHT LONG LAT ALTITUDE SPEED
<LB) CFS} CBL) CFEETD CDEG.CD CRPM> 14470 347.0 0.ILT 10290 14.5 258.0 0 007010
AVG CT CONFIGURATION
NORM UTIL
NOTES 1 . BALL CENTER TRIM COhDITION 2. S FT2 AFE INCORPORATED TO ASSIMILATE
DRAG DIFFERENCES BETWEEN TEST AIRCRAFT
FUEL FLOW INOPERATIVE rl.01
w*V k%' IäT'JV \i\ "JVÜ* If % LV.V W tfV '«> kV k"V -"W «V WV if* k~s 1> .> .Cw •->• ."> W U> . > LTn w>, '«> v~4 rfK y> tf* »'V V* i.v

FIGURE 38 LEVEL FLIGHT PERFORMANCE
UK-60A USA S/N 82-23748
CONFIGURATION
Sfi
AVG AVG AVG " AVG AVG REF. AVG GROSS CO. LOCATION DENSITY O.A.T. ROTOR CT WEIGHT LONG LAT ALTITUDE SPEED ' CLB) CFS} CBL!) CFEET) CD£G.C!> CRPM!) 19720 347.5CFV;D? 0.3LT 4790 117.0 2$7.8 0.008005 NORM UTIL
^-. .L * ^~*.^.~ CESSS FAIRINGS) NOTE: BALL CENTfcR TRIM CONDITION
rl.ea
TRUEAIKSPEHD (KNOTS!) 76
mmmmmmmmmmmm^

FIGURE 3$ LEVEL FLIGHT PERFORMANCE
nw^r—'1*7! "WS"" ÄVG AVG; PEP r
GROSS = C.-Gl. "LfitATX» DÖ«5ITY; O.A.T.; W»i weifeT-^4Jft- -£fo tALimee , ••-swasn ••-•
<Lft> : CFS> <BL> CFBETV CDCB.C3 CftPto I 158120 347.1 0.1LT 11B20 • T4.S 2SS 2 0
cohrn^JF^tk^-
NBftl.SffiB- NQTSS: 1 . SfcLL CENTER TRIM CONDITION
2. SiFT** APE SvgyRPOftATED TO Al DftAS DIFFERENCES 8ETUEEN TEST
^M^^M^M^M^ •.' •:•'" -^MMMMMM^MS^^äMMt

\r» IT"VW TV V*l"W '-NtTV».-WtfT-Vl "V •*." V "C ^-"' t" I"1 T^*'" VTT'VT»1'""X'-"« T»¥^ - X" - v - «"*VW «^
,">
V.
AVfaf :' I.:'.; ~~Ä :flfeÄr -UfiNB
1B#» ! 347L J
~S^ O.fc.T.
-iALTTTlC?fl[--—' •—-
8 0.338643 NCftM :
%>
'•^ith^La^'-v-''- *<><*<?*.{*#*.<*. v ••* -*. A ' -f 3#^:^:-^::^Xy//^;>'

—I K -l '•• • i
. -~| I" .—}
FIGURE 41 i LEVEL; FLIGHT; PERFORMANCE
ÄV& -4-
Wfc" GROfcS: I C.GJ. LOCATION
:--rt:
-pSA~Vtt f 7-^7W
:"TOg'SBTt; AVG"! mi o.A.T.: ROTOR! :CT
;
Sf££D i -i 4 am:.. i..cE$j> . 4..cep....t.taEflo^! <D6G C} CI$PM;> 16196 i 347I.J
COhFIGURATtoN
! I •|M£HEj3v:'"'JT/:-8|
&^(V.*^*W».?>v-'Ä51>'.^.f-*.--*;^^?-«' •>R>.r.>A« » >».>.?.»* *"* »>. V>. «> «>V>bV.>U>.'-JV\;*. .->v-V L.V .%'.> ,-V IV' '.••%.'».'. V\ '..%"" Vi VI *w' *."*. V t.1 "."' •V' «-"1 «i

:r n»IT' f" w w »" v« * • «.•' T i." ^J'~~
LEVEL: FLIGHT! PERFORMANCE !
AvtB Avs• T 'imrT'~'%wTmtR&rr''~$fän ; GROSS C.G. LOCATION" :| DSN&rTVj 0. A.Ti ' ROTOR i :; \Gf i KONFIGURATION WEIGHT • LONG LAT TÄ¥$RM~—t—i j—SR«|----! M-~r- i~•:- -I-—
CLB) CFS:> : CBL> J;;<ifiptST.::ä5ittÖjC3 .:<HPHD'! ;.]..;....] .. . ! 19730 347.8CFWÜ5 0.I3LT • 7970 i t| ,0 I 2$7,5| Ö.009Ö$S_ NORM- UTDL
UJ 92 ?f¥#> -f
1600 A
UJ
w 1200 -4
30
E
ta •r ; ; '•• - A -
^3--_ •i-®~JB&-
- - •: : .... CURVE;DERIVED FROM 1 FIGS. :4 THRU 19
33 j ] __, j r
70'3a 110 TRUE: AIRSPEED CKNOTS>
80
T :"S" 70
fe:£&&fo^^ ^i£&&&

w*i -v?-* WTT w< i
FIGURE 43 LEVEL I FLIGHT PERFORMANCE —"fm^Sm USA $/N 77-22716
ÄVG ÄVB AVG ÄVß AVG RET AVI? AVfc AVU AVb AVb KtJ- GftOlSS CGI. LOCATION DENSITY OAT. ROTOR
\€2GHT ^LONk LAT ALTITUDE SPEED CL83 CFSb CBL> <FEET> CDEG.C3 CRPM}
21690 347.3CFWDJ 0.I1LT 8Ö70 16 0 2S8.1
AVG C,
0.00999'
CONFIGURATION
NORM UTIL
NOTES: BALL CENTER TRIM CONDITION S; ^z &FE INCORPORATED; TO ASSIMILATE DRAG DIFFERENCES BETWEN TEST AIRCRAFT
aJOvVVn^"A\^TJWV»\VU%'i^iil^,ü&ry&\^' W\t* .*< \fi*UH WW LV US Vk LV 4/V Wfc i/V V> W> VM JV '-ft» tf* .1 \Th i.-h »> V> tfWUUUtt LM WV A V* UN kf K If* UH. IT». IT* W* 1/1

If'y'V-'V /,^'l-J"^«l^f^^l'^V"^^^VV^"^T'^ff^»~-^»gT-s^"^••^ JV"Tyi:^SJ T">"M"W^'l^IHim.'*. I •>• WHF—imum IW1« PtW V« IHtill VH •
A,
'AV.
AS
LEVELIFLJIQHT; PERFORMANCE
AVO AVE "'" im mrr'mt^r^im GROSS CG". LOCATION rttMStTY!" O.ft.T-i -llWOfrl " : :Cf
WEIGHT LONG : LAT ^TÖÜ^-^:"^-H--'-4atea>- • S
CLB) CFS} : <BL> i All CC«6.d CRF*D 19870 347.2CFWD> 0.3LT i 429(70 I • 8.5 ! 2SQ 8
0 .25-1
C 0 20-
cctu 0.15 i Oj
£* 9 ,e UR üj< i ft -0 05
-J 0.00 J
3290
H
a 2400
Ld
O
w
fa 1609 -1
30
NOT? r.tswrtfriTfeiM tern
CONTIOJRATtlON:
a.&iay? NORM! uttL: I
.L...i..:.i.-.:.
.U...:. .|*4B ffa •1—:—
3 • Q
u*.
« \ •
k 1 , H CO Z Lü 1200 -
883- —
^
-ft: 9
-ft.-ai
LebS
CURVE .DERIVED FROM FIGS. 4 THRU 19
— T- 50
"T~ T 90
'*T 7J3 ' 33 tl0 138
TRUE AIRSPEED CKN07S5
r
150 70
tä^^-\^^^^Ä^^<^:-'---^y:' /-:<-:^^-:<<<<<0'>^-::^>->:v:v>>:v:v:v;v.:v::;-:v;^>;,

•VW -»\f-wv —v» w»-w-
K
F.It*jR£ 4b LEVEL FLIGHT PERFORMANCE
UH-60A USA S/N 82-23748
ÄVG GROSS WEIGHT
CLÖ) 170130
e.25-1
«28-
«.45-
C.G: LONG CFS} 347.5
ÄVG LOCATION
• LAT CBL^ 0. 1LT
ÄVG ' ;
C€KSITY ALTlTLOe
CFEET) 3430
ÄVG' 'ÄVG RET. 0 A.T
CD€G.C} -1:3.0
ROTOR Sf*£D
264.9
ÄVG CT
0.00699
NOTE* BALL £FNT£R TRIM CONDITION
CONFIGURATION
7 NORM UTIL CESSS FAIRINGS}
aa Ba.ü. ,©. :^,.:.-
83
£gj8l^

•v-'vv sT"'»,""y'v '•••j-.' -.» "J ••,» "•••- *^ *"""* -ir—^-»T"ff " t •7,\'V7T'JTr,l" V'" I'lV^T» ^"^'' 1i "T,1 ^'V
•V.
GRC6S CO: LOCAT: WEIGHT • LöN& CLB> CFS>. 19890 347.2lcmDO-0.aLT:
:-:-t
i ; • - i ; .
1 • : •
i 1• .[ ! 1 ••
1 '• -4— ~f- —-•--—- J...-:„ -••- -:—
-£UQ
—r
.OjRVEJDERlVED iFRQM FIGS. 14 THRU 19
"T—;r 7b . gja . tie 130
TRUE AIRSPEED fKNOTS) T*~ T
150 —r la
Eft 84
JS.'J"! .*.' "-/" -V. "-' "J»

- ÄVg ' GROGS
. nessln i
' 19600
JT1GJRE 4/ LEVEL:FLIGHT: PERFORMANCE
; rt>M5©A USA "fc/K £2-23748;
::rrr''W&"' AW-"^MIW: äVG CGi) LO&VTISK •• i DfiNfeTTY! O.A.T. ROTOR I CT
•LßN&~- -4- LAT i*yr-#FUD£- SPEED: • CFSb . CEO i CF£ET>; CDEG.CD CftPM) JöES. i_BifeLi 13S80 J-.§ ..:... .^:? . 0. 0t 0454 NORM UTIL
fÖOTEV 8*LLrCJön^-TIÖW CONDTTIDN
CONFIGURATION
wifiMtfHift<wifü^*tfWNM^^

:>:
LEVEL
AVG GROSS
WEIGHT CLB) 17080
ÄvS
E" i ! t
XVS ] : AVÖ |AVS;«:P. : >V5"| 0 m CG. LOCATION
LONG LAT-'-i-At^.^., .. w•. CFS:> CBL> IjOTHa .mftio:..:.«*& 347.2 0 1LT i &JQ& -fcS.a 3 27S3
:r jC^ "I : GXJNTtl^URATION
6). ÖÖ6S22 NORM UTIL
^«Nmi«nalr-!»-Mi8W FAIRINGS>
70 90 110 I: TRUE AIRSPEED CKNOTS}
86

r-> • wi "iwwimniwiww
FlGlJRfc. ^:J
LEVEL FLIGHT PERFORMANCE • UH-68A USA S/N 82-23748
AVG ÄVG GROSS C G LOCATION
WEIGHT LONG LAT CLß> CFS:> C8LD 19760 347.7CFMD5 0.ILT
NOTE
AVG AVG ÄVG QfT DENSITY 11 A 7 ROTOR ALTITUDE SPEED CFEET:* CDBG O CRPM)
27
C-r CONFIGURATION
4520 -23 0 274 g
BALL CENTER TRIM CONDITION
0 9081 IS NORN . ^L CLrSSS FAIRINGS)

r^-rrrr^ r• i -*-»-• • ir»»u"*»w"v-»"
GftOSS WEIGHT
(LB)
JflOUfeE SO : j. • j
sp.: - . Lie t"Ja twk-AlRÖPÖED CKrOTS)
88
^^>>^^sy^^^^^:<-->v -• ..* *-"->".*». . •*• ••-• - - - e "

i"Mr^i wi win« «'
LEVEL FLIGHT PERFORMANCE UH--60A USA S/N *2~23740
AVG CONFIGURATION
AVG AVG AVG ' AVG AVG REF GROSS C G LOCATION DENSITY 0 A T ROTOR
WEIGHT LONG LAT ALTITUDE SPEED CLB) CFS^ CBL) (FEET) CDEG.O CRPM5
28150 347.5CFVÄ» 0 ILT 10200 -30 0 275.7 0.010039 NORM UTIL CESSS FAIRINGS}
NOTE- BALL CENTER TRIM COf^lTION

" "V .' VV^-Tv^ rv "V* 'TT* *^r^*s?**~^ ri^fV r\j*r\fl-
H
i$^«^^

r-w-w T— ma -T— »
lie t30 TRUE AiRSP^ED <lKNOtS>
91
v^'>mjKY^0ißtkyyrMYyfj^

m
FIGURE 54 LEVEL i FLIGHT PERFORMANCE
'UH-fQA USA fe/N 77-227*6 ! I
AST AVQ REF. AVG O.A.T. ROTOR 'T CONFIGURATION
Ave Ävfe ~~t~"~~ ;Aye GROSS CrGi. LOCATION i DENSITY
WEIGHT LONG LAT ULT^TU« SPEED CLB) CFS^ <BU> CFEET)! CDßB.C} CÜPM}i 15958 348.1 0.0 6$80 : 9.5 ] .258,3 0.006991 NORM UTIL
NOTES jl . BALL pENTER T&IM CONDITION "^'" ~' " •t?r-AN/Ätb=14i4CV> ANfr ff-t30 BRACKETS ADDED
ij#£xyxvv^m>i^^

ERTORMANbE
C» CONFIGURATION
.0 | "0.007905 NORMjUTHi. tNOTt 2,1>
*Nt>i Mr-1§0 BRACKETS ADPEb -~H
UißäMW^W*Äto^>teVUV&V5^^

LEVEL!
"AVS GROSS
CLÖ) 15840
: ÄVS
TPERFOrtMAN
Ave AVQ REF: ; AVG C.G. LOCATION : DCNfelTY! O.Ä.T. ROTOR
-LÖN& i-f-i-fctfr jAilTyrEiPg ! • T. iSftEJj&j- CFS!> CBU> CFÖET>i CD£G.C3 CRPM)
3.0 i 238.8 3471.1 0 .0 4000
Ct CONFIGURATION ! i
L_jß 9--ÖI08943 NORM UTIL
ri b: ßkl: fcENTfeR ifelM tONDilTION CN°TE: 2' ?
ig.: AN/AL^T44tV>t-AM^f^t3g BRACKETS ADDED
.CURVE DERIVED FROM FlGS. 4 THRU 19 WITH AFE = -5 FT 2
^INCORPORATED
110 i: TRUE AIRSPEED C^KNOtS^
94
fcXfo&töüüüßüiK^^^

IflGUfeE 5? fTJLUiurcc. 0/ LEVEL! FLIGHT! PERFORMANCE i. lUHMffrpgK S/lH.p-^gTttSr!—
r "iv^-' Avd'iciH. £vbi 3TY) O.k.t. ROTOR) 'te j CONFIGL^ATlGN < •>«- ^ 1." i • ISfeED-1
CDte-iO. CäPfD 14.$ I 258.4; 0.^969»4 NORM
CNÖTt 2>
B^^ia&^fito

"»«•»«."• W •*-' V"V!I1 1^11 I"
y.
>
v>
.;:.sa.:. L 110:. t TRUE: AIRSPEED öKNOTSD
96
iiiS^

y~ r'rm i «ii iiifwnmiuiH i • .1 • i.p
AVG GROSS WEIGHT CLB> 16110
0.30
0.25
0.29
0.15
0.10
0.05 J
AVG
°T CONFIGURATION
FIGURE 59 LEVEL FLIGHT PERFORMANCE
UK-teA PSA S/N 77-22716;
• AVß" 7 AVG T AVG AVG ftEF. C.G. LOCATION DENSITY O.A.T. ROTOR LOMS - LAT ALTtTlDC $ßm> CFS:> CBL> CFfiET) CDEG.O CRPK> 547.4 0.0 13470 2.0 2S8.2 0.$09015 :V£RM UTTL
NOTES- 1 . BALL CENTER TRIM CONDfETID^ CN0TE '* 2. A^ALCM44CV:> W M-13TIf<«TALLED
i , . ,
FUEL FLOW INOPERATIVE
•3ÖÄ3
•opoo
tTW
I 1200-
600
rt.01
-e 96
rii 1-0.00-
4ÄI
I !
—r
CURVE-DERIVED FRO-t FIGS. 4 THRU 19 WlTH^FE --5FT2
INCORPORATED
90 110 1: TRUE AIRSPEED ^KNOTS)
97
178
•ttft&*&&tettx*&xw&w&&#

wpivn»!» iwpw r ^lvi9".»"J!,*".»V"»"i,i'ii"iii'»"i>r"T,v'
w
uVV
r^f-mj^ii ]< wpV -4—t- üM'jiill '
i^illiMi^i^^

LH-6faA l&Al $/H 757-22716 end 5/N 82r-23748 I . . :
I .. ! -H 4—~—i—:—i:-—
:- .-:--.;....: :•: ,;...:-:..!....: .:.-. ..... f.. .
• --4
. AND USAAE^A RkPCRt NO. 8!Htß ' r ' •;
........ i • ;•-! ••:• +--M -v. '••••••
1 ••-: i • :• •;•::• rhr.'f::: d:rr:::: .•:{ ::•:•:+ .;:• •
^fo&W^W^^^^

v; wj * r * « " * ~ V" «J1 •.•" V""" ^"^'' ^ '"Vl"1 '."w'7"r "T" ?•«•'•• " .• >_•"."• !«^»l»»",»"\r'«P^ ^MlHllHHHf"!«!"»'!"« n ^< IVI ^1 •* l"J IH*I f«V !'•••
; . . 1 li.
;
;....: ;.:.:.. ; . : . FIGURE i€2 3d : SIDESLIP. IN 3ALL .CENTER .LEVEL FLIGHT
UH-60A USA S/N 77-22716
TTE
SVM AVG AVG CG AVG AVG AVG AVG I GROSS LOCATION DENSITY OAT REFERRED Tf-RJST I
i «EIGHT LONG LAT ALT ROTOR SPEED COEFFICIENT CLS) CFS) CBL3 CFT> CDEG C."- CRFM).
. 258.1. . . 0.009991 '• j i • •: A < 21680 347..3CFWD5 .0. 1LT .8873 16.8 • ; 16198 347 1 0 iLT 13848 7 8 * 1S920 347 1 0 ILT t:S20 14.5
258 0 0 009019 ; 258 2 8 £08306 .
+ 14470 347 0 0 ILT 10299 :4S 258 Z 0 807010
,--:-
;
: :
.
• . i j NOTES I NORMAL. UTILITY. CCNT^fcATION 2 CURVES OBTAINED FROM FIGURES 6p AH> 61
-4-f-f-rH i •'
•
....;.
i&fl&ask^^^ < v i • ^•A-.vA-,1

FIS.RE 63 .. !SIDESLIP. IN...BALL [CENTER LEVEL FLIGHT
UH-«A U84 S/N 82-23748
• • -M - - •" --- — --»•

FIGURE 64 SIDESLIP IN BALL CENTER LEVEL FLIGHT
UH-60A USA S/N 82-23748
m
SYM AVG AVC CG AVG AVG AVC ^VG GROSS LOCATION DENSITY GAT REFERRED THRUST WEIGHT LONG LAT ALT' ROTOR SPEED COEFFICIEMT
CLB> CFS) CBO CFT> CDEG C5 CRPMI) • 19380 347.3CFWD) 0.3LT 10830 16.5 245.4 0.010472 Q 19490 347.1CFU>:> 0 2LT 6300 23.0 245.1 0 008978 A 15110 346.9 0.4LT -»870 23.5 244.8 8.006510 • 19600 347 5 0.2LT 13880 3.5 265.5 8.0I04S4 * 19890 347.2CFUD) 0-3LT 9850 8.0 264.5 0.009022 + 17000 347.5 0.1LT 3430 -13 0 264.9 0.006997
30-i a ! •' . . , '!""T ; : ' •
•~— ~i \ • I- j • j • PI ; I-:- :r-T:-- ie- ^N^ri i ... •] ; 1--) ~h ; | j - hH e- . jTTtSigdfc D ! B-P .Bj-Hfj?.: . [ . i. . 1 j ..
Li r
: i • ! • i i • | j hi -I-:-- I-- 1 qft-.
O ..... I'll'1 • • •* • i • A SCtESi. li_ NOßMAL UTILITY! CXMTTGURATIDR .cfeSSS FAlfelNGS5 L.J. _.]
£ . j.a. CURVES OBTAINED FROM FIGURES 60 AND. 61 j
29- \° » ~H -1- •-' ; !• •'•-• '• i- : ; f 1 i
10- ^*±S :i .__.. I • •• ; • ; • . ..._ | — • ... . : !
8-
5 71 : i .
i | : 1 : r v i" r. !
- • • 1
• i : ! • • ; • •
... 1.... \ 1 !. i
20-
§ 19-
j 1 1 .: 1
| .:.. i A i i j ;• • r'
i \.
*\L ..:. _j .. — : 1
_4
.1 _ 1 1 -'."i—
i 1 ! .- '
i ' *~ j
j ....... I"
—LLr
"1":: -J V
.... ...... =4t^ ̂ rt>
........ "IP"
"1*1 &h- i i i •""l"-
: {..
i
9 ! i
4 •• •--••
I •
--
1
a &
| ; 29- K •
•
! ' :
\ « > . i : . .. •
: ;
- j *J *
• ,.*•• -,.f UJ u > ' ' ;
•
• .
.. - I • • i : ;
jti :- 29-
1
! •; • .....j..
• L-i
:
•4- _ L_l i j !
—j*r-
f0-
- 0-
*9-
38-
...j_. . p
*> rv ; L „
• ! . • |- • * * *'" r"' ' L * ~ '
:- :
1-Ljl^. • • i
• -i
.j...
J* 28-
19-
a-
:..L'.
! :....'. . ! :
V : 1 - ! : :
• • ; , •
.~^_ : •
s • .+ i U + " 1- + - ++ + + + =
i : : i 8.10 e 14 8 18 8 ^ 8. 26 8 » 0. 34 0. 38 ..,..|......
! RA M I
, j . ..... i 1 •
' ! • .1 ! • ! |02 i I : '. ; ; : 1 i ! ; 1
i^r^i*3UCTL'tf»T^'ft*;/^
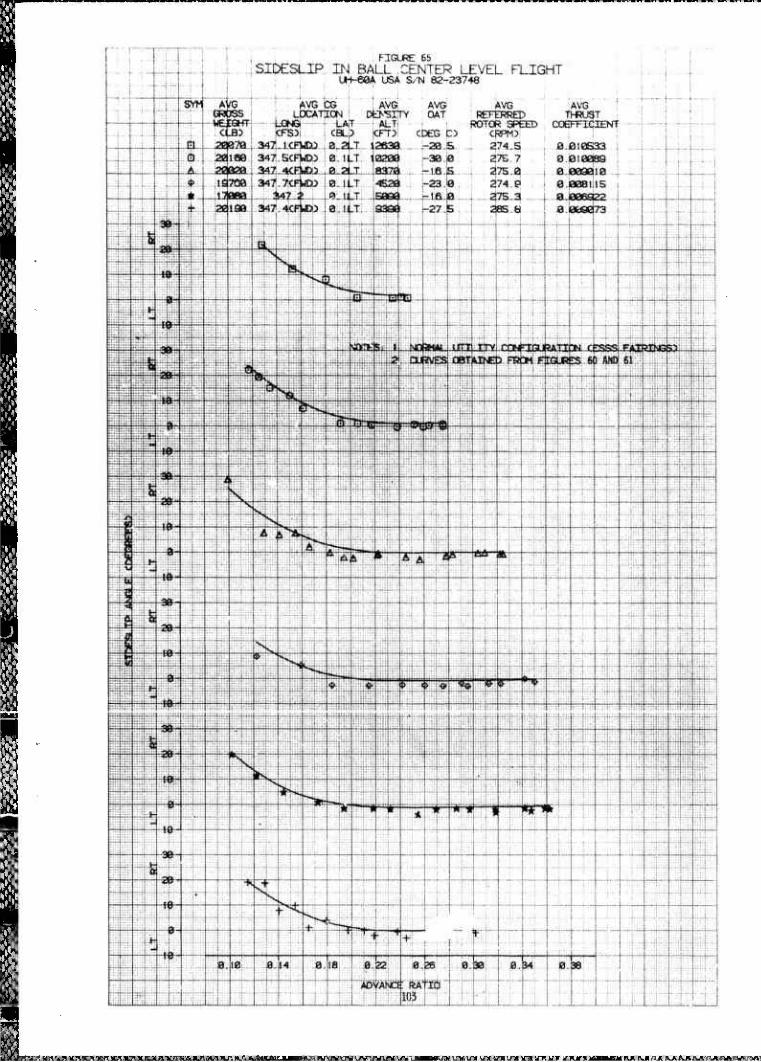
'. A '. »Ä «' .1 - .^ R " 'A-"\ ILA A.fi H .1 VJS v,\ R-n •*„! XT, US. Vi atTffir «J— f ~i PJ"-ALV L/V _f«fU"W U". :JS uy. 'I/K w* i/» i/Ti in irr, v.* tf.iut »J I n* rJi r-i. T-JKT^, rv r-rcfiA.'v.rtfu

nun«juuji»win"J11— IU'LIHIWJJI.LII,I jwwwwwwMwwiwuiwwimiuiup fwwiwnrwv*www^www^vwr^
i
FIGURE 66 SIDESLIP IN BALL CENTER LEVEL FLIGHT
UH-60A USA S/N 77-22716
SYM AVG AVG CG AVG AVG GROSS LOCATION DENSITY OAT WEIGHT LONG LAT ALT
<"' B> CFS3 • 16118 347.4 0.0 13470 2.0 G 16180 347.6 0-0 »0240 7.5
AVG AVG REFERRED THRUST
ROTOR SPEED COEFFICIENT CBU> CFT} CDEG C> CRPM>
258.2 0.009015
A 19950 347.6 0.0 7190 • 15840 347.1 0.0 14000 * '.6030 348.0 0.0 .9860 + 15950 348.1 0.0 6580
14.S 3.0 2.5 9.S
258. 1 258.4 258 8 258.0 258.3
0.008015 0.006994 0.008943 0.007995 0.006991
38i
28
,91 0-
te-
38
2G
18
0
NOTES; '; KwpMAi ifTT) rrvj rndrrrafeATThM .
4 +•,!*„« DEHOTEi AN/KLQ-!144CV3. AND. M|-130; BRACKETS ADDED 3L -A. 4|. CURVES! QBTJMNEf)
Mbl30 AH> 61 RVESi OBTAINED FS3M. FJDGLRfcS: 60 j
I ! • eng u ap ab
INSTALLED. ! i I
JKÄ\H53«Quras^ ^WLAAVSHfiK*. Art X/W «LA A.

V.vvv '.-*:vxvx wxvxWKwxw>. wa^x*?,ifajf A;h>j^*ik^w>"A><TJr:y.kY^:7,.j.':n^f>TA^j^jf^?wn*A*Tu<r>'\K n> \* r>u^ ra pj< r> n* r>.r>rxv"•. v J\*.v :-•

• yPH»» nfi »yn tu ' if i'tfi 'i.i.i^v*.1' "'• •".'»•••"».•.»•":' ".» ".r-.• »• W'"_i "j» -w WJI »vn1 L"»"P—g»"W • f« V * V w ?••!!• V V ' V* B-*V * V* V* l**» ? * r^.^'.."^ l VVVYTf VV\ V^. V\~^
> .*•
&V1
,• ft-.
TO
v.''"
i L .._ 11/y \ i • ' . :
NI "39NVH3
:»to>>>a*^

K
•SS
mmmz^mmm,

"TV" «rV-WT- V ' V- • WT" V 1TJ" • V
yv
SftiilllitJI^^

»••' iw. •J u"T gJT» *y* ! wt •^•^m^TT\7T:'"yny^w '^ <rw«^yv* ' r^ •'vw rr^rxwvr:»r^r\y"^JfT,T
__A-.„^
100 t; Ststait INfltfCAJED;. AlRSFfeED
<KNOTS> i ;: m •
niiAH.IMAWl'H.llftA HAA\Hfl K.1- AA K* .-.1 O i-M W. K.'T A." y.'WIW W1 k^ -.1O. «.*. *1«." KJVWS 'O «." *Jl -.1 -L". * ^ « -1 '*J\ .^vi -. KYJS A tW iS 4 T^*"* T «. « * K .*.-V<.*WH"

DISTRIBUTION
HQDA (DALO-AV, DALO-FDQ, DAMO-HRS, DAMA-PPM-T, 6
DAMA-RA, DAMA-WSA)
US Array Materiel Command (AMCDE-SA, AMCDE-P, AMCQA-SA, 4
AMCQA-ST)
US Army Training and Doctrine Command (ATCD-T, ATCD-B) 2
US Army Aviation Systems Command (AMSAV-8, AMSAV-ED, 15
AMSAV-Q, AMSAV-MC, AMSAV-ME, AMSAV-L, AMSAV-N,
AMSAV-GTD)
US Array Test and Evaluation Command (AMSTE-TE-V, 2
AMSTE-TE-O)
US Array Logistics Evaluation Agency (DALO-LEI) 1
US Army Materiel Systems Analysis Agency (AMXSY-RV, AMXSY-MP) 8
US Array Operational Test and Evaluation Agency (CSTE-AVSD-E) 2
US Army Armor School (ATSB-CD-TE) 1
US Array Aviation Center (ATZQ-D-T, ATZQ-CDC-C, ATZQ-TSM-A, 5
ATZQ-TSM-S, ATZQ-TSM-LH)
US Array Combined Arms Center (ATZL-TIE) 1
US Army Safety Center (FESC-SPA, PESC-SE) 2
US Army Cost and Economic Analysis Center (CACC-AM) 1
US Array Aviation Research and Technology Activity (AVSCOM) 3
NASA/Ames Research Center (SAVRT-R, SAVRT-M (Library)
US Army Aviation Research and Technology Activity (AVSCOM) 2
Aviation Applied Technology Directorate (SAVRT-TY-DRD
SAVRT-TY-TSC (Tech Library)

US Array Aviation Research and Technology Activity (AVSCOM) 1
Aeroflightdynamics Directorate (SAVRT-AF-D)
US Array Aviation Research and Technology Activity (AVSCOM) 1
Propulsion Directorate (SAVRT-PN-D)
Defense Technical Information Center (FDAC) 2
US Military Academy, Department of Mechanics 1
(Aero Group Director)
ASD/AFXT, ASD/ENF 2
US Army Aviation Development Test Activity (STEBG-CT) 2
Assistant Technical Director for Projects, Code: CT-24
(Mr. Joseph Dunn) 2
6520 Test Group (ENML)
Commander, Naval Air Systems Command (AIR 5115B, AIR 5301)
Defense Intelligence Agency (DIA-DT-2D)
Project Manager Training Devices (LTC Cleland, AMCPM-AVD)
Singer/Link Division (DEPT 445, Tony Mazza)
PM, TRADE (AMCTM-AVD)
Singer Link
Singer Company, Link Division (Robert Martin)
US Army Aviation Systems Command (AMCPM-BH)
United Technologies Corporation, Sikorsky Aircraft
Division (Rich Gallagher)