wsu road & streets mutcd 2013.ppt - event management …€¦ · assessment/management methods...
TRANSCRIPT

Traffic Solutions MUTCD Compliance Dates & Systematic Upgrades
Rick MowldsState Sign Engineer
Road & Street – Maintenance Supervisors’ ConferenceYakima, WA
October 15, 2013
Lynn PetersonSecretary of Transportation
John NisbetState Traffic Engineer

Assessment/Management Method for Maintaining Sign Retroreflectivity (Compliance Date: June 13, 2014)
WSDOT’s Approach:
Currently our approach encompasses all sign types, not just regulatory and warning signs
• Our approach is a combination of assessment/management methods:
– Visual Nighttime Inspection (Review each sign every two years)
– Expected Sign Life
– Control Signs
2
Assessment/Management Methods for Maintaining Sign Retroreflectivity (Continued)Visual Nighttime Inspection:
• Typically a Two- Person Crew
• Preferred Vehicle is a Pick Up or SUV preferable with the newer headlight style (VOA, HID)
• The Crew Records Deficient Signs into the Department’s Sign Inventory Database – Traffic Sign Management System (TSMS)
• Traffic and Maintenance Personnel are able to generate a “Needed Maintenance Report” of the identified deficient signs
3

Assessment/Management Methods for Maintaining Sign Retroreflectivity (Continued)Visual Nighttime Inspection: (Needed Maintenance Report)
4

5
Assessment/Management Methods for Maintaining Sign Retroreflectivity (Continued)
Expected Sign Life:
• Associated with Capitol or Preservation Projects
• WSDOT policy was to replace any existing sign that is 10 years or older within project limits
6
Assessment/Management Methods for Maintaining Sign Retroreflectivity (Continued)
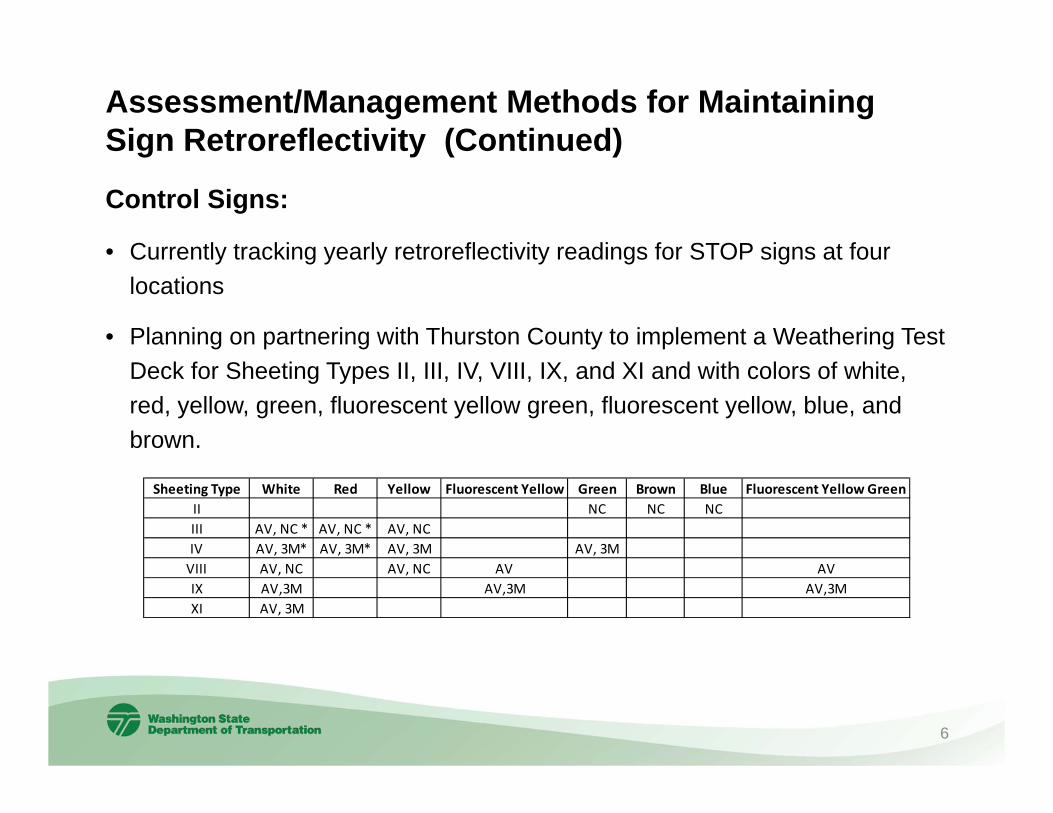
Control Signs:
• Currently tracking yearly retroreflectivity readings for STOP signs at four locations
• Planning on partnering with Thurston County to implement a Weathering Test Deck for Sheeting Types II, III, IV, VIII, IX, and XI and with colors of white, red, yellow, green, fluorescent yellow green, fluorescent yellow, blue, and brown.
Sheeting Type White Red Yellow Fluorescent Yellow Green Brown Blue Fluorescent Yellow GreenII NC NC NCIII AV, NC * AV, NC * AV, NCIV AV, 3M* AV, 3M* AV, 3M AV, 3MVIII AV, NC AV, NC AV AVIX AV,3M AV,3M AV,3MXI AV, 3M

7
Assessment/Management Methods for Maintaining Sign Retroreflectivity (Continued)
Issues:
• Funding
• Staff Levels

Crashworthiness of Sign Supports (Compliance Date: January 17, 2013)
Placed on roads with posted speed limit of 50 mph or higher
WSDOT Approach:
• Department policy all sign supports installed on the state highway system have been crash tested and approved by FHWA, since the 1980’s.
• Meets NCHRP 350 or AASHTO Manual for Assessing Safety Hardware (MASH)
Hardware accepted under NCHRP Report 350 is appropriate for replacement and new installation. Retesting is not required.
As of January 1, 2011, all new products must be tested using MASH crash test criteria for use on the National Highway System (NHS).
• No Impact
8

One Way Signs (Compliance Date: December 31, 2019)
Placed on roads with posted speed limit of 50 mph or higher
WSDOT Approach:
• Currently identifying needs
• Future coordination with city’s over 25 K
in population
9

Horizontal Alignment Warning Signs(Compliance Date: December 31, 2019)
The placement of a Large Arrow or Chevrons on curves where the difference between the speed limit and advisory speed is 15 mph or more.
WSDOT Approach:
• Identify impacted curves
• Provide funding for three Regions
each biennium
• Systematic approach of addressing curves that have higher serious injuries and/or fatal crashes first
• Currently approximately 30% of the identified curves have been addressed
10

Yellow Change and Red Clearance Intervals(Compliance Date: June 13, 2017)
Duration of yellow change and red clearance intervals shall be determined using engineering practices.
The engineering practices are available in ITE’s “Traffic Control Devices Handbook” and ITE’s “Manual of Traffic Signal Design” WSDOT Approach:
• Consistent with Department policy
• If needed, addressing yellow change and red clearance intervals when timing adjustments are needed at individual intersection and/or corridor
• Continue dialogue with the six Region to ensure compliance date is meet
11

Pedestrians Intervals and Signal Phases(Compliance Date: June 13, 2017)
Pedestrian change interval shall not extend into the red clearance interval and shall be followed by a buffer interval of at 3 seconds.
WSDOT Approach:
• When timing adjustments are needed at individual intersection and/or corridor adjustments are being made to bring the intervals into compliance
• Continue dialogue with the six Region to ensure compliance date is meet
• Follow up with City’s that are operating Department owned signals to ensure compliance date is meet
• Currently, roughly 15% - 20% signals have been adjusted
12

Grade Crossing (Crossbuck) Signs and Supports(Compliance Date: December 31, 2013)
Retroreflective Strip on Crossbuck sign and Support
WSDOT Approach:
• The responsibility lies with the
Railroad owner since the sign assembly
is when Railroad right of way
13

Crossbuck Assemblies with Yield or Stop Signs(Compliance Date: December 31, 2013)
The use of STOP or YIELD signs with Crossbuck signs at passive grade crossings
WSDOT Approach:
• The responsibility lies with the
Railroad owner since the sign assembly
is when Railroad right of way
14

15
Systematic Approach
Strategic Items to consider when upgrading existing traffic control devices:
• Crash History, especially severe crash locations
• Reduce Risk Liability
• Roadway Classification
• Traffic Volumes
• Geometrics (Lane and Shoulder Widths)
• Existence of Horizontal and Vertical Curves

16
Systematic Approach Example:WSDOT ASSESSMENT GUIDE FOR REPLACING SIGNS - August 2013
Note: • This guide illustrates the range of potential consequences and likelihood that may be associated with key department risk areas. • Judgment is required to assess the consequences and likelihood of a risk event (both before and after effective risk treatment action).
Severity Score Quantities & Costs Regulatory Warning Guide Informational
Sign Fab NumberR1-Series, R3-1, R3-2, R3-4, R3-18, R5-1, R5-1A, R6-1, R6-2
W1-Series , W2-Series, W3-1 Series, W3-2 Series, W13-Series
E4-501, E6-101, E11-1 SeriesNot Applicable Low Medium High
Total # of Signs 24,790 20,149 1,664 0 Average Daily Traffic
Square Feet 173,962 149,678 172,921 0 Retroreflectivity Fair Marginal Low
Estimate Replacement Cost1 $3,479,240 $2,993,560 $6,916,840 $0 Likelihood Score 0 2 5
Sign Fab Number
R2-Series, R4-Series, R5-2 Series, R5-1000 Series, R6-Series, R8-Series, R9-Series, R10-Series, R11- Series, R12-Series, R13-Series, R14-Series, R15-Series, R16-Series, R18-101, R18-201, S1-1 through S5-2
S1-1, S3-1 Series, S4-3, W3-3 through W3-501, W4-Series, W5-1 through W5-3, W6-Series, W7-1 through W7-4E, W8-Series, W9-Series, W10-Series, W11-Series, W12- Series, W14-Series, W15-Series, W16-Series
D1-Series, D3-Series, D5-Series, D8-Series, D10-Series, E1-Series, E3-101, E4-301, E5-Series, E6-2, E8-Series, E12-Series, M1-1 thru M1-701, M3-Series,
I2-401, I2-501, I7-401, I7-7 thru I7-702, I8-101 thru I8-701, I8-901, I8-1001, I25-Series, I35-101
Tier 2 Tier 2 Tier 2
Total # of Signs 19,536 25,971 44,879 1,779
Square Feet 164,198 161,657 637,319 23,101
Estimate Replacement Cost1 $4,925,940 $3,233,140 $19,119,570 $462,020
Sign Fab Number
R3-16, R3-17, R7-Series, R18-301
W5-4, W7-5, W17-1 D4-Series, D6-Series, D7-Series, D9-Series, D11-1, D12-Series, D13-1, E2-1A, E7-1, E9-1, E13-Series, M1-8, M1-9, M2-Series, M4-Series, M5-Series, M6-Series, M7-Series, M8-Series
I1-Series, I2-101 thru I2-301, I2-601, I2-701, I3-Series, I4-Series, I5-Series, I6-Series, I7-301, I7-601, I8-7 Series, I8-801, I8-804, I9-101, I20-Series, I30-Series, I35-102, Ride Share signs
Tier 3 Tier 3 Tier 3
Total # of Signs 2,698 7 7,199 10,234
Square Feet 7,505 22.00 127,983 82,742
Estimate Replacement Cost1 $150,100 $440 3,199,575 $1,654,840
Level of Risk Definitions: High
Medium
Low
Adapted from "Risk Management Procedure – PN 224P" , version 1.1, Governance Branch, Roads and Traffic Authority, NSW, Australia.
# If an existing sign is more than 15 years add one point to the final score.
1) The Estimate Replacement Cost does not include the replacement cost of support structures.<500 500 - 2500 2501 - 4000 >4000
Likelihood Score 1 2 3 4
Risk is managed by current practices and procedures - consequences are dealt with by routine operations at Director/Office level - monitor routine practices and procedures for effectiveness.
STEP 3 – Develop the Risk Response Plan
(Develop the Risk Strategy & Remedial Actions)
See Table below for Average Daily Traffic Score
Risk Levels
Average Daily Traffic Risk Levels
* - For Level One Signs with a low retro-reflectivity receives a score of 7; signs with a marginal retroreflectivity receives a score of 5; signs with a fair retroreflectivity receives a score of 3.
App
endi
x A
- Pr
iorit
y M
atrix
STEP 1 – Determine the Severity Level for each Major Risk Area (Score the Risk Severity for each Key Area that is applicable)
Major Risk Areas for Signs #
Ris
k Se
verit
y fo
r Sig
ns
High (Level One)
7*
Medium (Level Two)
2
Low (Level Three)
1
STEP 2 – Estimate the Risk Impact (Score the Likelihood and determine
the Level of Risk)
Consequences threaten the effective the ability of WSDOT to carry out its mission and strategic plan - existing controls must be effective and requires additional action to be managed at the executive management level.
Consequences threaten completion of a critical WSDOT function - existing controls must be effective and possibly additional action implemented - action to be managed at Division level.
