wrt caba/crf conference 02/12/14 - sean comber
TRANSCRIPT

Road run off and reasons for failure ‐ Fingle Brook A30 study
regarding impacts on the river Teign
Sean Comber, Will Blake, Rupert Goddard, Chris Rowett, Alex Taylor

Content
• Brief background • Roads as a source of contamination • The A30 • Results collected • Conclusions

Background • Water Framework Directive is driving higher
expectations for water quality and lower standards
• Large areas of SW not compliant • For a number of reasons
– P from WwTW/Agric/Industry – Legacy mine issues – Obstructions – Road runoff/urban runoff

• Fingle Brook only moderate status (based on fish)
• Part of The Dart and Teign River Improvement Project (DTRIP)
• Catchment Restoration Funds available for assisting meeting WFD status by 2027
Teign Catchment
Fingle Brook

Recent fish data

What are the pressures on Fingle Brook?
• Sewage effluent (Whiddon Down)
• Mines (Whiddon Down ‐ Cu some Pb; Drewsteignton Quarry – limestone, may be metals before that)
• Road runoff • Agriculture

Fingle Brook catchment

• ~ 5km of A30 runs parallel to Fingle Brook • ~ 10,900,000 l/yr of runoff • (13,961,250 l/yr from Whiddon Dn WwTW)
109200000
?

Metals in vehicle and road materials (mg/kg)

Metals in runoff
0.01
0.1
1
10
100
1000
0 10000 20000 30000 40000 50000
Conc
entr
atio
n (µ
g/l)
Average daily traffic
CdCuPbZn
A30 average 2‐way daily traffic
Data from: Harrison et al., 1985, Hewitt and Rashed, 1992, Legret and Pagotto, 1999, Bäckström et al., 2003

Work so far • Environment Agency cannot hope to provide detailed
monitoring on sub‐catchment level • Plymouth University working with WRT and EA to increase
knowledge base • Student projects:
– 3rd Year dissertation (Chris Rowett – metal bioavailability in runoff water from Whiddon Down settlement pond; Rachel Giles ‐ Effects of Road Salt Runoff on Freshwater Organisms – Brighton Stream)
• Small contracts: – Investigation of water and sediment quality relating to A30 road
runoff into Fingle Brook, upper Teign catchment, Devon (March, 2014)
– Assessing significance of sources of metals to Fingle Brook under low and high flow conditions (July – December 2014)
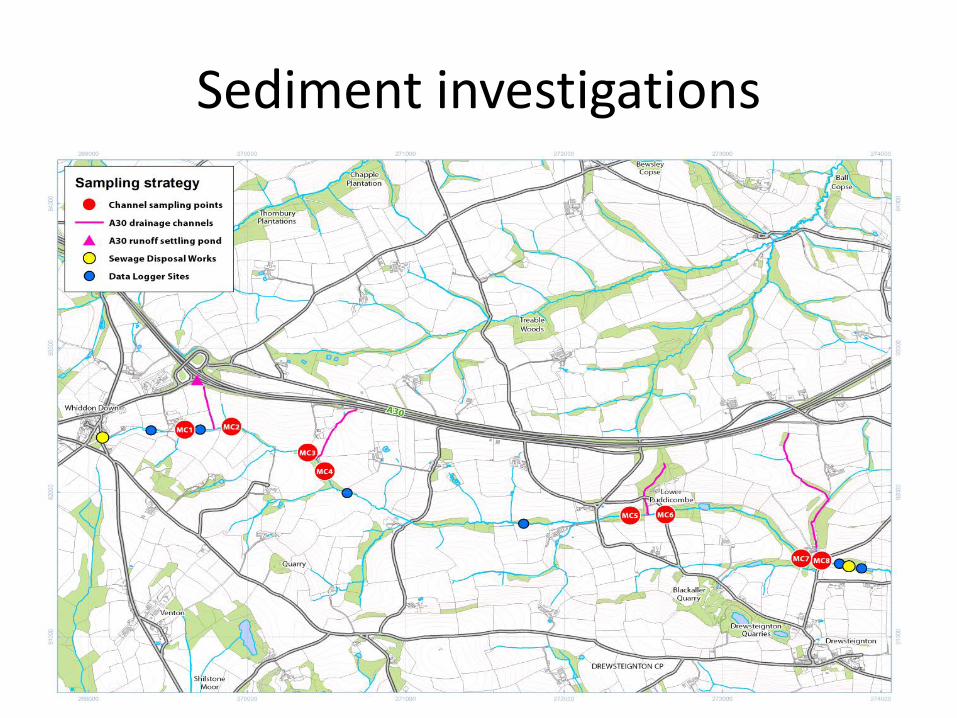
Sediment investigations

Metals elevated above probable effect levels (Canadian standards ‐ mg/kg) for some metals
Variables Freshwater
(TEL) Freshwater
(PEL) Fingle Brook
channel sediments Lead 35 91.3 113 Chromium 37.3 90 184 Copper 35.7 197 38 Zinc 123 315 285
TEL = Threshold Effect Level (below which no impacts) PEL = Probable Effect Level (above which expect negative impacts)

Mean metal levels in sediment (mg/kg)
SAMPLE Zn Cu Cr ROAD DUST 756 282 183 LAGOON 785 113 176 SOIL 69 25 138 BANK 141 35 175 MAIN CHANNEL SED 285 38 184 NORTH TRIB SED (drain input) 321 65 190 NORTH TRIB SED (no drain input) 164 30 167 SOUTH TRIB SED (drain input) 212 33 172

Water Quality? Metal Speciation & Toxicity
Most toxic
Intermediate toxicity
Low toxicity
DOC
Humic M - Org
CO 3 2 -
S 2 -
OH - NO 3
-
M +
M ++ M - Inorg
Fulvics
X
EDTA

Water quality – New standards (EQS)
• Important to assess bioavailability (Cu, Zn, Ni, (Mn, Pb)) – site specific EQS available based on measurement of Ca, pH, dissolved organic carbon and dissolved metal – set by EU &UK
• Other EQS set by UK

Sample sites
• Sampled during dry period (baseline) and 2 rain events (Dec ‘13 and Jan ‘14)


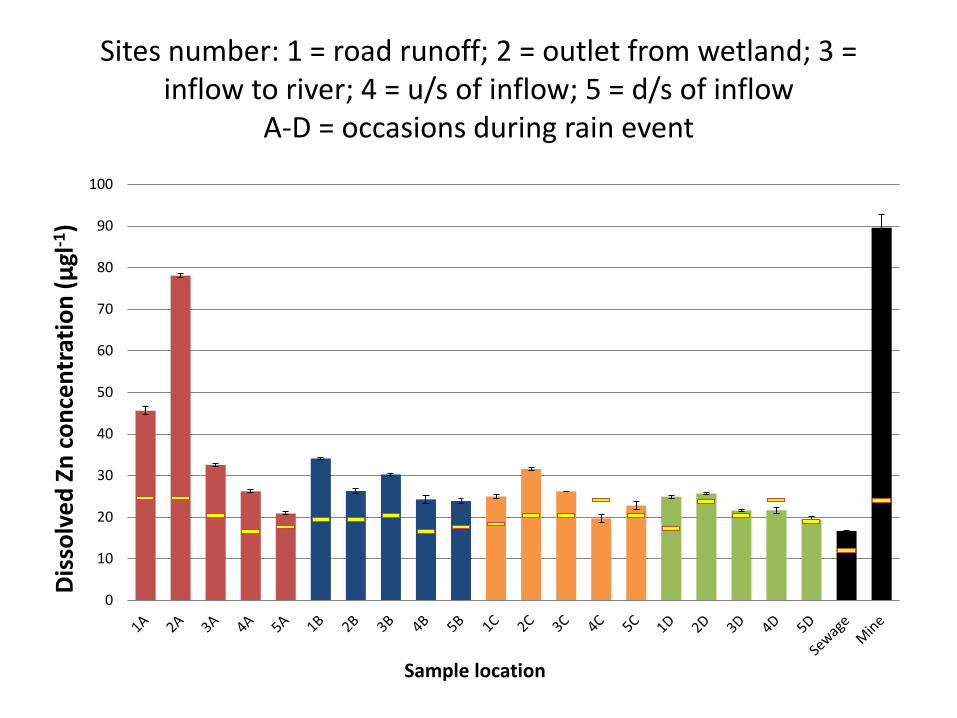
Sites number: 1 = road runoff; 2 = outlet from wetland; 3 = inflow to river; 4 = u/s of inflow; 5 = d/s of inflow
A‐D = occasions during rain event
0
2
4
6
8
10
12
14
16
18
20
22
Dis
solv
ed C
u co
ncen
trat
ion
(µgl
-1)
Sample location

Sites number: 1 = road runoff; 2 = outlet from wetland; 3 = inflow to river; 4 = u/s of inflow; 5 = d/s of inflow
A‐D = occasions during rain event
Sites number: 1 = road runoff; 2 = outlet from wetland; 3 = inflow to river; 4 = u/s of inflow; 5 = d/s of inflow
A‐D = occasions during rain event
0
10
20
30
40
50
60
70
80
90
100
Diss
olve
d Zn
con
cent
ratio
n (µ
gl-1
)
Sample location

Detailed water quality survey to determine sources of metals
1) Downstream of STW 2) Upstream of Widdon Down mine site 3) Input of Widdon Down mine site 4) Downstream of Widdon Down mine site 5) Upstream of Drewsteignton quarry 6) Input of Drewsteignton quarry 7) Downstream of Drewsteignton quarry 8) Upstream of Millfarm road drain 9) Input Millfarm road drain 10) Downstream Millfarm road drain 11) Upstream of Redlake road drain 12) Input of Redlake road drain 13) Downstream of Redlake road drain 14)Upstream of Lower Puddicombe road drain 15) Input of Lower Puddicombe road drain 16) Downstream of Lower Puddicombe road drain 17) Upstream of Veet Mill road drain 18) Input of Veet Mill road drain 19) Downstream of Veet Mill road drain 20) Upstream of Fingle Brook input into the River Teign (Fingle Bridge) 21) Input of Fingle Brook into the River Teign (Fingle Bridge) 22) Downstream of Fingle Brook input into the River Teign (Fingle Bridge)

Low flow data
012345678
Cu (µ
g/l)
05
10152025303540
Zn (µ
g/l)
0.00
0.02
0.04
0.06
0.08
0.10
0.12
Cd (µ
g/l)
0
5
10
15
20
Pb (µ
g/l)
Red bars denote EQS exceedance

Main inputs to Fingle Brook under low flows (µg/l)
• High flow samples collected 18/11/14
Site Cu Ni Zn Co Se Cd Pb3A Widdon Down mine site 0.63 5.10 4.4 0.52 1.85 0.02 0.26A Drewsteignton quarry 0.25 0.28 3.5 0.01 10.13 0.05 0.29A Millfarm road drain 5.34 2.57 13.2 0.17 0.17 0.02 27.118A Veet Mill road drain 2.05 8.84 13.2 0.62 0.17 0.12 0.615A Lower Puddicombe drain 2.68 8.34 17.3 3.10 0.56 0.26 5.812A Redlake road drain 7.56 1.79 8.6 0.11 0.34 0.03 12.4
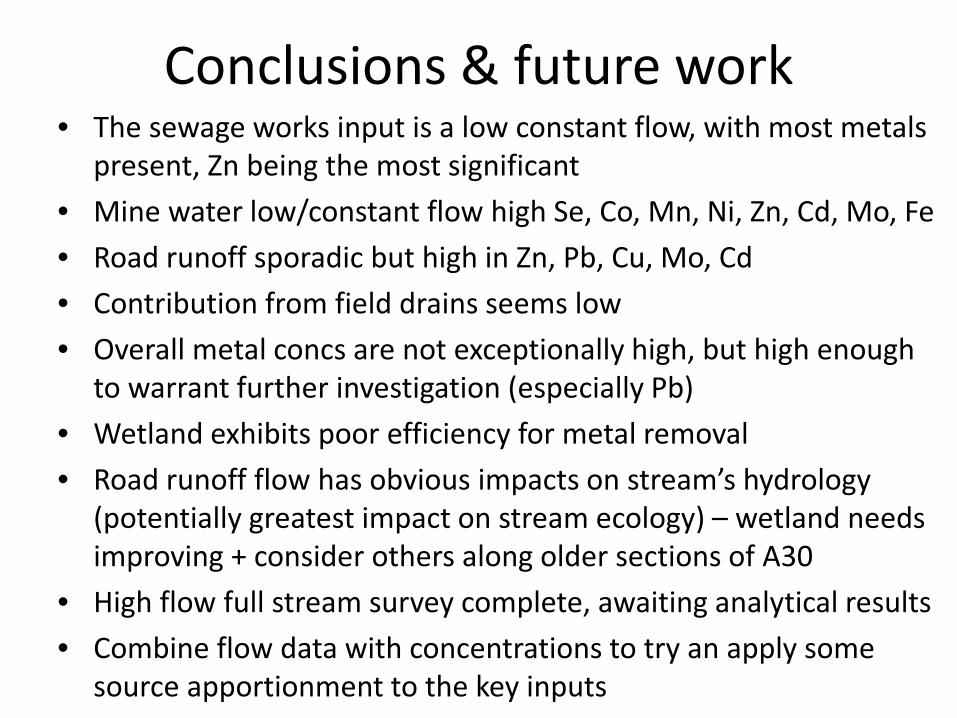
Conclusions & future work • The sewage works input is a low constant flow, with most metals
present, Zn being the most significant • Mine water low/constant flow high Se, Co, Mn, Ni, Zn, Cd, Mo, Fe • Road runoff sporadic but high in Zn, Pb, Cu, Mo, Cd • Contribution from field drains seems low • Overall metal concs are not exceptionally high, but high enough
to warrant further investigation (especially Pb) • Wetland exhibits poor efficiency for metal removal • Road runoff flow has obvious impacts on stream’s hydrology
(potentially greatest impact on stream ecology) – wetland needs improving + consider others along older sections of A30
• High flow full stream survey complete, awaiting analytical results • Combine flow data with concentrations to try an apply some
source apportionment to the key inputs

Possible mitigation options?
Cheap, but manpower intensive………