wp4.3.3 water distribution and users’ behavior – analysis
TRANSCRIPT

Project no. 4CE439P3
URBAN_WFTP
Introduction of Water Footprint (WFTP) Approach in Urban Area
to Monitor, Evaluate and Improve the Water Use
WP4.3.3
Water distribution and users’ behavior – Analysis Report
Wrocław
Lead contractor for deliverable WP 4.3.3:
Prepared by: University of Environmental and Life Sciences (PP9) and Municipal Water and
Sewage Company in Wroclaw (PP10)
Start date of project: 1 November 2012 Duration: 25 months
Submission date: July 2014

URBAN_WFTP deliverable 4.3.3
2
CONTENT
1. Introduction ......................................................................................................................... 3
2. Target groups ...................................................................................................................... 3
3. Current situation on the water supply system ..................................................................... 7
4. Results of the questionnaires ............................................................................................ 10
4.1 Group of “young residents” ...................................................................................... 10
4.2 Group of “professionals” .......................................................................................... 15
5. Conclusions ....................................................................................................................... 18
6. Future needs ...................................................................................................................... 18
References ................................................................................................................................ 19
Appendix 1 ............................................................................................................................... 20
Appendix 2 ............................................................................................................................... 21
URBAN_WFTP deliverable 4.3.3
3
1. Introduction
This report is based on data obtained through the two questionnaires. The first survey on
group of students called in the report group of “young residents”, was carried out between 25th
of February and 16th of March 2014 at Wroclaw University of Environmental and Life
Sciences (PP9). The questionnaire consisted of three separate parts. The first part was about
students’ preferences for water management at home e.g. how often the respondents brush
teeth, flush toilet, take shower or bath, wash dishes and how, do laundry and where etc. In the
second part students had to register the volume of water they used for activities mentioned
above by means of water meter. The third part included extra questions concerning some
particular behaviors e.g. controlling water losses in case of breakdowns or throwing out waste
to the toilet. In this part respondents also answered how many people live in their household
and how much water they consume during a month (see Appendix 1).
Second survey was carried out in June 2014 by the Municipal Water and Sewage
Company in Wroclaw (PP10) (see Appendix 2). It was distributed mostly among the company
workers and some of the workers have also published it on their Facebook profiles to make it
available to their friends.
The overall aim of the research was first to asses water consumption in the household related
to different activities and users’ behaviors in order to verify what requires improvement in the
urban water distribution system. The second part of the survey aimed to obtain information on
the sewage discharge to the municipal sewer system. The survey is also showing, what is the
awareness of the residents about the impact of their behaviors on the functioning of the
sewerage network.
2. Target groups
In the first survey 73 people were involved where women and man accounted for 63% and
37% respectively. Group of „young residents” (Fig. 1) were at the age of 20 – 28, lived in
Wrocław and their household consisted of 2 to 6 persons (Fig. 2).

URBAN_WFTP deliverable 4.3.3
4
20-21 years
33%
22-23 years
49%
24-25 years
17%
26-28 years
1%
Fig. 1. Percentage of the respondents by age
0
5
10
15
20
25
30
35
40
45
50
2 persons 3 persons 4 persons 5 persons 6persons
13
20
49
15
3
Sh
are
of
ho
use
ho
ld, %
Fig. 2. Percentage of the respondents living in a household
In the second survey participated 166 people from which 84% lived in the city (Fig. 3).
The respondents were at the age of 18 - 65 (Fig. 4) and females constituted 54%. When
relating the percentage partition of survey participants at different age to the internet users, the
values correspond. The dominating group of internet users are people at the age of 18-34,
which amount to 50% and spent around 15 hours a week online, at average, while other age
groups spent 8 hours on internet a week, based on CBOS survey (2013). In the Water and
Sewage Management survey carried out this group made 63%. The difference is associated
with the fact that the survey was made available mostly to the Water and Sewage Company

URBAN_WFTP deliverable 4.3.3
5
workers, so the age of the participants reflects rather the age of the office workers, who
decided to participate in the survey.
16%
84%
People from the suburbs People from
Wrocław
Fig. 3. Percentage of the respondents by place of living
28%
17%
16%
1% 2%
35%1% 25-34 years
No answer
55-64 years
45-54 years
35-44 years
18-24 years
>65 years
Fig. 4. Percentage of the respondents by age
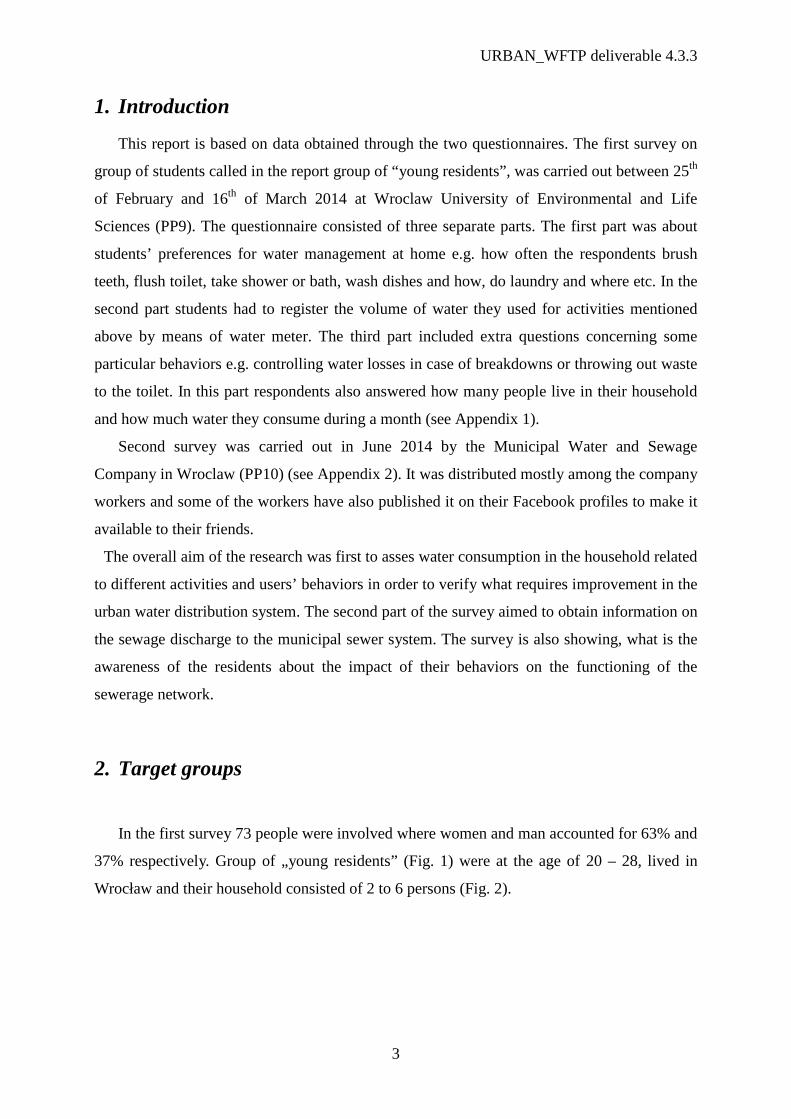
More than 80% of respondents were working in the sector related to water and wastewater
management or environmental protection (Fig. 5). They are called in this report as group of
“professionals”. About 70% of professionals lived in a house or semi-detached house (Fig. 6)
and their household usually consisted of 2 to 4 people (Fig. 7).
URBAN_WFTP deliverable 4.3.3
6
3%
83%
14%No
Yes
No answ er
Fig. 5. Percentage of the respondents working in the sector related to water and wastewater
management or environmental protection
66%
34%
People living in a bolck of f lat or tenement house
People living in a house or semi-detached house
Fig. 6. Percentage of the respondents by type of housing
Fig. 7. Percentage of the respondents living in different size of household

URBAN_WFTP deliverable 4.3.3
7
3. Current situation on the water supply system
Water Supply System in Wroclaw is quite extensive (Fig. 8). It has the length of 1 519 km
(without house connection) and is characterized by a great diversity of age and material. The
oldest pipelines, built before 1900, are operated in the center of the city (approximately 7% of
the total length). The largest share in the system are pipes from 1900 and 1945. The length of
the water supply network is increasing every year because Municipal Water and Sewage
Company in Wroclaw (MPWiK) responds rapidly to the growing needs of the city by building
new networks in areas of newly formed residential and office buildings, and industrial plants.
Currently almost whole Wroclaw population uses water system. New water pipelines are built
in parallel with the modernization of the existing ones. The pipes are made of various
materials including cast iron, ductile iron, steel, PVC and HDPE, and in some areas pipes are
made of asbestos-cement. 73% of pipes are made of cast iron and 20% of PVC and HDPE.
Pipe diameters range from DN 80 to DN 1400 mm and water pressure maintained throughout
the network does not fall below 0.2 MPa.
The city has three water treatment plants Mokry Dwór, Na Grobli and Leśnica, in which
surface water, infiltration water and groundwater are treated, respectively (Fig. 9). MPWiK
has permission to take surface water in Czechnica intake, from Oława river in maximum
amount of 208 000 m3/d and from the open ditches Oława river in maximum amount of
7 500 m3/d. The company collects also water from the infiltration system of Oława river with
a total maximum amount of 132 000 m3/d.

URBAN_WFTP deliverable 4.3.3
8
[m3/year/ha]
Fig. 8. Water consumption in Wrocław
Fig. 9. Water intakes in Wroclaw (www.mpwik.wroclaw.pl)

URBAN_WFTP deliverable 4.3.3
9
Most of water is purified in two water treatment plants – „Na Grobli” and „Mokry
Dwór” – with a total efficiency of 123 000 m3/d. Various water treatment technologies are
implemented in Wrocław (eg. Aeration, coagulation, sedimentation, filtration, sorption,
pH adjustment) which require using variety of chemical reagents (eg. sodium chlorite,
liquid chlorine, aluminum sulfate, sodium hypochlorite, sodium hydroxide, liquid
oxygen). In addition, the water is disinfected using ozone, chlorine dioxide and chlorine.
Water quality is monitored continuously with the frequency of 130 000 qualitative
analyzes a year.
Figure 10 presents the share of blue, green and grey water footprint determined for the
administrative regions of Wroclaw using Model B. The highest grey WFTP is located in
the center of the city whereas the suburbs are dominated by green WFTP.
Fig. 10. WFTP in administration regions of Wroclaw

URBAN_WFTP deliverable 4.3.3
10
4. Results of the questionnaires
4.1 Group of “young residents”
Between 25th of February and 16th of March 2014 at the Wrocław University of Life
Sciences a survey among „young residents” was carried out. The results showed that the
majority of residents preferred shower to bath (Fig. 11), washing dishes under running water
(Fig. 12), opted to launder in a washing machine (Fig. 13) and do teeth brushing with the tap
turned off (Fig. 14).
Shower
76%
Bath and
shower
18%
Bath
6%
Fig. 11. Percentage of the respondents taking bath and/or shower

URBAN_WFTP deliverable 4.3.3
11
Washing the dishes
under the tap
43%
Washing the dishes
in the sink
6%Washing the dishes
in the dishwasher
6%
Washing the dishes
in the dishwasher,
under the tap and in
the sink
32%
Washing the dishes
under the tap and in
the dishwasher
6%
Washing the dishes
in the sink and in
the dishwasher
1%
Washing the dishes
under the tap, in
the sink and in the
dishwasher
6%
Fig. 12. The way of washing dishes selected by the respondents
Hand wash
1%
Wash in a washing
machine
64%
Hand wash and in
a washing
machine
35%
Fig. 13. The way of washing cloths selected by the respondents

URBAN_WFTP deliverable 4.3.3
12
Brushing teeth
under running
water
4%
Brushing teeth
with turn off the
tap
64%
Brushing teeth
under running
water and with
turn off the tap
32%
Fig. 14. The way of brushing teeth selected by the respondents
Average water consumption per household is presented in the Fig. 15. It can be noticed
that the water consumption did not significantly depend on the number of persons in the
household (Fig. 16).
0
5
10
15
20
25
2 persons 3 persons 4 persons 5 persons 6 persons
7.25
11.70
15.92
18.10
20.50
Ave
rag
e w
ate
r
con
sum
pti
on
/ho
use
ho
ld,
m3
Fig. 15. Average monthly water consumption in the household

URBAN_WFTP deliverable 4.3.3
13
0
5
10
15
20
25
2 persons 3 persons 4 persons 5 persons 6 persons
3.63 3.90 3.98 3.62 3.42
Ave
rag
e w
ate
r
con
sum
pti
on
/pe
rso
n,
m3
Fig. 16. Average monthly water consumption per person in the household
The structure of water consumption is presented on Fig. 17, which confirms that most
water is consumed for washing dishes and clothes, taking bath/shower and flushing toilets.
More than half of the respondents have double flushing at home (Fig. 18) and almost 80% of
them control leaks in their household (Fig. 19).
Bath
31 %
Brushing teeth
2 %
Dishwashing
28 %
Washing
11 %
Toilet (WC)
20 %
Hands washing
4 %
Cooking
2 %
Cleaning
2 %
Fig. 17. Water consumption of "young residents" group

URBAN_WFTP deliverable 4.3.3
14
0
10
20
30
40
50
60
Bifunctional button in the
toilet cistern
One button in the toilet
cistern
55
45
Th
e s
ha
re o
f re
spo
nd
en
ts,
%
Fig. 18. Type of toilet flush in the household
0
10
20
30
40
50
60
70
80
Leakage control Lack of control
79
21
The
shar
e of
res
pond
ents
, %
Fig. 19. Control of leaks in the household installations

URBAN_WFTP deliverable 4.3.3
15
4.2 Group of “professionals”
The majority of respondents from “professionals” group take water from urban water
supply system. Only a small percentage of respondents have their own well and more than
half of them do not monitor the amount of water taken up (Fig. 20). Moreover, 60% of
respondents have 2 to 4 water-saving devices, while only 10% do not have them at all (Fig.
21). The most popular devices are: a double flush, faucet aerator and dishwasher (Fig. 22).
Fig. 20. Percentage of the respondents by the source of water
1%
23%
26%
22%
18%10%Five devices
Nothing One device
Four devices
Three devices
Tw o devices
Fig. 21. Percentage of the respondents by the number of water saving devices

URBAN_WFTP deliverable 4.3.3
16
Fig. 22. Percentage of the respondents by the type of water saving devices
The results of the survey confirm the habit that most people more often take a shower than a
bath. Every day 75% of respondents take a shower (Fig. 23), whereas only 9% take a bath
(Fig. 24). Among people with a car (89% of respondents) more than 70% wash car at a car
wash (Fig. 25).
Fig. 23. Frequency of using shower

URBAN_WFTP deliverable 4.3.3
17
Fig. 24. Frequency of using bath
Fig. 25. Percentage of the respondents depending on the place of washing car

URBAN_WFTP deliverable 4.3.3
18
5. Conclusions
• “Young residents” have still bad habits as washing dishes under running water (43%)
but only 4 % brush their teeth under running water. Most water is used for washing
dishes and clothes taking bath/shower, and flushing toilets. It is worth mentioning that
more than half of the respondents have double flushing at home and almost 80%
monitor leaks in their households. Despite the lack of specialized equipment for water
saving they are interested in environmental protection.
• Group of “professionals” usually take water from urban water supply system. They
have higher environmental awareness as evidenced by having mostly 2 to 4 eco-
devices and washing car in the car wash. Moreover one person has an installation to
reuse rainwater, while 81% do not collect rainwater at all.
• In the two groups most people prefer shower than bath and they are interested in new
water saving technologies.
6. Future needs
It is important to make people aware of water scarcity especially among young people, as they
are about buying their own accommodation, so it is important they take into account
equipping it with water saving technologies and solutions. As most water is used for taking
bath/shower, washing dishes and clothes, and flushing toilets, the current technologies most
important to implement are especially water saving shower heads and faucet aerators, water
and energy saving washing machines and dishwashers, and water saving double flushing in
toilets. The first two are the cheapest and at the same time the most important solutions, as
37% of water is used for taking bath/shower, washing hands and teeth. It is important to make
citizens aware how much water they can save and what is the return on investment for
particular solutions, what will encourage them to buy them.
Another important issue is rainwater usage for household purposes. Only 19% people collect
rainwater, and one person reuses it to for flushing toilet, saving this way blue water. This
shows that recycling rainwater is very unusual among citizens. Most people are not aware that
small investments can help them to save lots of water e.g. for gardening purposes. This needs
to be changed possibly by spreading relevant information and promotion of such solutions
among them. They can be also supported by the special incentives offered by the
URBAN_WFTP deliverable 4.3.3
19
municipality. The Wroclaw Urban Lab will concentrate on convincing the relevant
municipality representatives to promote implementation of water saving and recycling
solutions.
References
CBOS, Public Opinion Research Center, The Survey Report Internet Users 2013, BS/75/2013,
Warsaw 2013

URBAN_WFTP deliverable 4.3.3
20
Appendix 1
Part I of questionnaire
Part II of questionnaire
Part III of questionnaire

URBAN_WFTP deliverable 4.3.3
21

URBAN_WFTP deliverable 4.3.3
22
Appendix 2

URBAN_WFTP deliverable 4.3.3
23

URBAN_WFTP deliverable 4.3.3
24

URBAN_WFTP deliverable 4.3.3
25