wp4: monitoring & control d4.4: report on development of ...€¦ · d4.4: report on developed...
TRANSCRIPT
EUROPEAN COMMISSION
DG Research and Innovation
Seventh Framework Programme Theme [EeB.ENV.2010.3.2.4-1]
[Compatible solutions for improving the energy efficiency of historic buildings in urban areas]
Collaborative Project – GRANT AGREEMENT No. 260162
WP4: Monitoring & ControlD4.4: Report on development of BMS system
The European Union is not liable for any use that may be made of the Information contained in this document which is merely representing
the authors view
D4.4: Report on developed BMS system
2
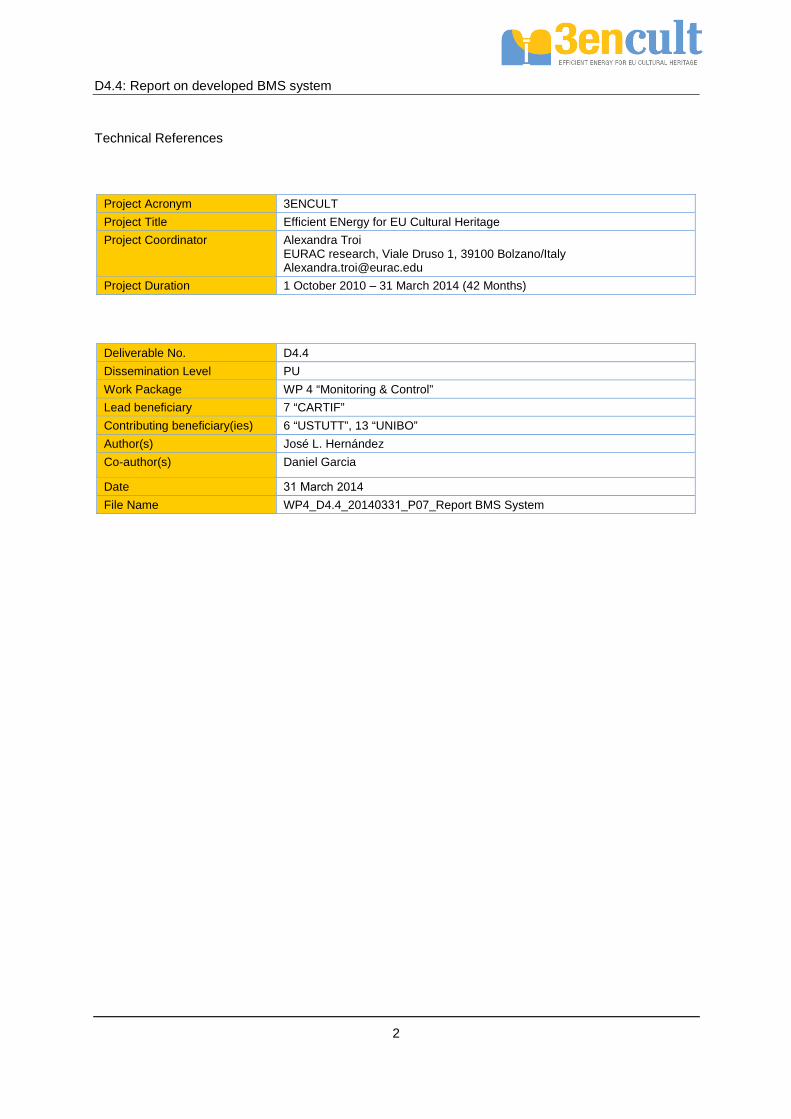
Technical References
Project Acronym 3ENCULT
Project Title Efficient ENergy for EU Cultural Heritage
Project Coordinator Alexandra Troi EURAC research, Viale Druso 1, 39100 Bolzano/Italy [email protected]
Project Duration 1 October 2010 – 31 March 2014 (42 Months)
Deliverable No. D4.4
Dissemination Level PU
Work Package WP 4 “Monitoring & Control”
Lead beneficiary 7 “CARTIF”
Contributing beneficiary(ies) 6 “USTUTT”, 13 “UNIBO”
Author(s) José L. Hernández
Co-author(s) Daniel Garcia
Date 31 March 2014
File Name WP4_D4.4_20140331_P07_Report BMS System
D4.4: Report on developed BMS system
3
Table of Content 0 Abstract ............................................................................................................................................ 7
1 BMS Specification ............................................................................................................................ 8
1.1 Monitoring and controlling requirements ................................................................................. 8
1.2 Architecture.............................................................................................................................. 9
1.2.1 Services definition.............................................................................................................. 12
1.2.2 Software Environment ....................................................................................................... 14
1.2.3 Hardware selection ............................................................................................................ 15
1.3 BMS goodness ...................................................................................................................... 16
1.4 Interfaces definition ............................................................................................................... 17
1.5 BMS Roles ............................................................................................................................. 20
1.6 BMS database ....................................................................................................................... 20
1.7 GUI definition ......................................................................................................................... 21
2 ZigBee specification and interface ................................................................................................. 23
3 BMS Services ................................................................................................................................. 25
3.1 Monitoring Service ................................................................................................................. 25
3.2 Lighting Management Service ............................................................................................... 29
3.3 HVAC Service ........................................................................................................................ 30
3.4 Energy Consumption Management ....................................................................................... 33
3.5 Technical Alarms & Task Management ................................................................................. 34
3.6 Data downloading .................................................................................................................. 36
3.6.1 Available filters ................................................................................................................... 37
3.6.2 Files format ........................................................................................................................ 37
3.7 Administrator tools ................................................................................................................. 37
4 Real example of deployment .......................................................................................................... 40
5 Future research lines...................................................................................................................... 42
6 Central Server data collection ........................................................................................................ 42
6.1 Architecture............................................................................................................................ 43
6.1.1 Central Server database .................................................................................................... 44
6.2 Case Study connectors specification .................................................................................... 46
6.2.1 CS1: Public Waaghaus – Bolzano..................................................................................... 47
6.2.2 CS2: Palazzo d’Accurso – Bologna ................................................................................... 48
6.2.3 CS3: Palazzina della Viola – Bologna ............................................................................... 50
6.2.4 CS5: Siegmair School – Innsbruck .................................................................................... 50
6.2.4.1 Before refurbishment ................................................................................................. 50
6.2.4.2 After refurbishment .................................................................................................... 51
6.2.5 CS6: Warehouse City – Potsdam ...................................................................................... 52
6.2.6 CS7: School of Industrial Engineering – Béjar .................................................................. 52

D4.4: Report on developed BMS system
4
6.2.7 CS8: Strickbau – Appenzell ............................................................................................... 53
6.3 Application for monitoring and downloading data.................................................................. 53
7 References ..................................................................................................................................... 55
D4.4: Report on developed BMS system
5
List of figuresFigure 1: Building Management System: Overall Architecture.............................................................. 10
Figure 2: Building Management Service: Software Architecture ........................................................... 12
Figure 3: Entity-Relationship and table diagrams ................................................................................. 21
Figure 4: Generic screen for the 3EnCult GUI ...................................................................................... 22
Figure 5: Access screen to the Building Management System ............................................................. 25
Figure 6: Main monitoring screen of the system ................................................................................... 26
Figure 7: Monitoring system classified by application fields .................................................................. 27
Figure 8: Application field view in the monitoring service ...................................................................... 28
Figure 9: List of variables in the monitoring system .............................................................................. 29
Figure 10: Lighting service .................................................................................................................... 30
Figure 11: HVAC temperature service .................................................................................................. 31
Figure 12: HVAC relative humidity service ............................................................................................ 32
Figure 13: HVAC air quality service ...................................................................................................... 33
Figure 14: Energy management service ............................................................................................... 34
Figure 15: Technical alarms .................................................................................................................. 35
Figure 16: Creation of a new set-point for technical alarms .................................................................. 35
Figure 17: Task management service ................................................................................................... 36
Figure 18: Creation of a new scheduled task ........................................................................................ 36
Figure 19: Downloading data from the BMS ......................................................................................... 37
Figure 20: Enable and disable sensors ................................................................................................. 38
Figure 21: Deletion of historical data ..................................................................................................... 38
Figure 22: Administrator tools for the BMS configuration ...................................................................... 39
Figure 23: Tree scheme for the ZigBee sensor network ....................................................................... 40
Figure 24: Distribution of the sensors in the test room .......................................................................... 40
Figure 25: Central Server data collection architecture .......................................................................... 43
Figure 26: Data exchange between the case study and Central Server ............................................... 44
Figure 27: Entity-Relationship diagram for the Central Server database .............................................. 45
Figure 28: Sequence diagram for the retrieval of information from case studies .................................. 46
Figure 29: Case study 2 data treatment ................................................................................................ 48
Figure 30: Monitoring interface for the Central Server .......................................................................... 54
Figure 31: CS7 tab in the Central Server Web interface ....................................................................... 54

D4.4: Report on developed BMS system
6
List of tablesTable 1: Comparison between PostgreSQL and Oracle ....................................................................... 11
Table 2: Technical features of PostgreSQL database .......................................................................... 15
Table 3: Minimum features of the computer in which BMS is allocated. ............................................... 16
Table 4: Configuration of the motes in the test suite ............................................................................. 41
Table 5: Final implementation of the Central Server tables .................................................................. 45
Table 6: Case Study 1 information format example .............................................................................. 48
Table 7: Monitoring data format in the Case Study 2 ............................................................................ 49
Table 8: Weather Station data format in the Case Study 2 ................................................................... 50
Table 9: Light measurements in the classrooms for the case study 5 .................................................. 51
Table 10: Status measurements in the classrooms for the case study 5 .............................................. 51
Table 11: CS5 after refurbishment data example ................................................................................. 51
Table 12: Map of headers and values in the case study 6 .................................................................... 52
Table 13: Code translation for the sensors in the case study 6 ............................................................ 52
Table 14: Information format in the case study 7 .................................................................................. 53
Table 15: CS8 example of data ............................................................................................................. 53
D4.4: Report on developed BMS system
7
0 Abstract
This document contains the design, specification and drivers of the Building Management System (BMS) as well as the services and interfaces to monitor and control such services. This Building Management System is developed according the constraints presented by heritage buildings and according to the ZigBee sensor network developed in the project in order to fullfil with the premises required by this kind of constructions.
Due to the limitations which must be faced when working with historical buildings, the BMS must be designed and developed gathering the biggest amount of information from the different case studies. Therefore, taking into account the feedback of the case studies, the BMS has been defined as a multiprotocol and multiservice platform, whose services can be adapted and upgraded to meet all the buildings’ needs. Moreover, all the functionalities included in each service have been tunned with the requirements and limitations of this kind of buildings in order to adapt them to the real needs of cultural heritage buildings.
Additionally, different interface concepts have been designed and included in this document, with special focus on strengthening the usability and bring the information to the user in an easy and efficient way.
This deliverable is directly related to the rest of deliverables of the Work Package (WP) 4 because the BMS is developed on to of ZigBee sensor network deployed in this WP. Moreover, the recommendation of the monitoring system is another input for the deliverable in order to take into consideration those variables included in such deliverable. Furthermore, the analysis of monitoring and control algorithms was the last input for the BMS due of the integration of the patterns into the plaform. Last but not least, this document is also related to the WP6 because one of the the goal of the WP4 was the BMS deployment in the case studies, therefore, the characteristics of the buildings, as well as specific context requirements, needed to be collected.
Finally, regarding the contribution of the partners, it was fundamental for the completion of the deliverable. Not only the WP4 partners, but also the case studies responsibles collaborateed to the finalisation of the tasks associated to the present deliverable. From one side, the WP4 partners have helped with recommendations and ideas to the development of the BMS in several meetings, feedback, etc. On the other hand, the case study responsibles have answered to the questionaires in the design phase of the services, as well as providing the historical data so that the database has been implemented.
D4.4: Report on developed BMS system
8
1 BMS Specification
A Building Management System (BMS) is a software high-technology computer-based system which is installed on buildings for monitoring and controlling the equipment and facilities [1]. Some examples for the equipment to be added in the BMS are the following:
• HVAC systems,• lighting,• shading/daylighting (when controllable),• possible natural ventilation openings and further devices,• power systems,• fire systems,• security systems.
A BMS is a complex, multi-level, multi-objective, integrated, interrelated and complete intelligent design management information system [2] which mixes software and hardware. The software is the entity in charge of the communication with the physical network and the wisdom of the application components. On the other hand the hardware is the physical environment, both the devices, sensors, actuators and the environment or facilities where the devices are placed.
The purpose of a Building Management System (BMS) is to automate and take control of the operations of the facilities and actuators in the most efficient way possible for the occupiers/business, within the constraints of the installed plant [1].
1.1 Monitoring and controlling requirements
The first step in all the processes when a software application is going to be developed is the definition of the requirements [3][4]. These can be from an end-user point of view or from a technical point of view. The end-user requirements are those defined from a user who is requesting some functionalities and the language is based on non-technical one. Afterwards, a software expertise translates the end-user requirements into technical ones which describe, in a specific language, the functionalities desired for the development of the application [3][4]. In general, one end-user requirement is translated into several technical ones. As it is logical, the technical is more specific and the end-user requirement is a generic input for the software development.
For this project, it has been collected a set of end-user requirements which has been performed through questionnaires asking for needs in each Case Study. Following, it is described the end-user requirements:
1. RQ1: The BMS should generate an historical log with the values collected from the wirelesssensor network.
2. RQ2: The BMS should show the latest values read from the network.
3. RQ3: The BMS should be able to filter these values in application fields to be defined.
4. RQ4: The BMS should be able to access to several services so that the variables could bemanaged in its own monitoring and control service.
5. RQ5: The BMS should integrate control access so as not to allow all the functionalities to allthe users accessing to the system.
6. RQ6: The BMS should allow users with privileges to download historical data.
7. RQ7: The BMS should be able to work out simple control algorithms.
These are the end-user requirements, but they have been translated into technical ones. These are described below in order to collect all the functionalities needed for the system.
1. TR1: The BMS should be able to connect with the ZigBee sensors through a drivercommunicating with the devices in order to read the information. (RQ1)
D4.4: Report on developed BMS system
9
2. TR2: The BMS should be able to send and read the commands implemented by the ZigBeedevices (RQ1).
3. TR3: The BMS should be able to store the data into a persitent way so as to maintain thehistorical log of the information. (RQ1)
4. TR4: The BMS should print a screen showing the latest values stored in the persitent way sothat the user could visualize the data values. (RQ2)
5. TR5: The BMS should allow users to update the graphical interface for the up-to-date values.(RQ2).
6. TR6: The BMS should filter the values and variables in function of several application fieldsdefined. (RQ3)
7. TR7: The BMS should show a view with the application fields and their variables/valuesassociated (RQ3).
8. TR8: The BMS should implement several services to be defined in order to associate thevariables read with each service (RQ4).
9. TR9: The BMS should develop a view for every service accessible from the main screen of theapplication (RQ4).
10. TR10: The BMS should implement a management of users in order to filter the functionalitiesallowed for each one (RQ5).
11. TR11: The BMS should filter the functionalities not allowed for the user logged in the system(RQ5).
12. TR12: The BMS should implement some control access strategy for the logging in the systemsuch as nickname/password (RQ5).
13. TR13: The BMS should allow those users with privileges to download data from the historicalpersistent log in a file format (RQ6).
14. TR14: The downloading functionality should be accessible from the main screen of theapplication (RQ6).
15. TR15: Every service of the system should be able to calculate control patterns (e.g switchingon/off the lights) in function of the variables and values read (RQ7).
16. TR16: Every service should show a recommendation of the control pattern to be applied(RQ7).
17. TR17: The BMS should be able to send the commands to control the facilites of the building, ifsupported by the ZigBee sensors (RQ7).
Some additional requirements have to be added for including other aspects as the performance of the BMS. Following, such requirements are specified.
18. TR18: A database should be used as storage of historical data.
19. TR19: The system should be able to respond in a limited time in order to allow a fluent activity.
20. TR20: The downloading of data should be done in a standar format as CSV, XLS or any other.
21. TR21: The BMS should use open-source technologies.
22. TR22: The BMS should be able to integrate other protocols (e.g. LonWorks) and their specificreading and actuation commands.
1.2 Architecture
The defined BMS is a multiservice system that has been thought according to a service-oriented and open architecture (SOA Architecture). This SOA architecture is a software design methodology based on structured collections of discrete software modules, known as services that collectively provide the

D4.4: Report on developed BMS system
10
complete functionality of a large or complex software application [5]. Each module implements a simpler functionality of the whole system and a well-known interface for the communication with the remaining modules in order to allow the complete system functionality.
The general architecture of the BMS is showed in the scheme below:
Figure 1: Building Management System: Overall Architecture.
The general scheme for the SOA architecture is based on Java [6] and the Java Virtual Machine [7]. From bottom to top level, it could be found the hardware such as the sensors or actuators in the sensor network. The next level is the operating system, but it is common the multi-platform development, therefore, it is usually removed from the architecture. Following, the drivers needed for the communication with the system are represented. It could be defined a unique driver or various ones if different sensor network are deployed in the building or integrated in the same BMS. The Java Virtual Machine is the level in charge of being transparent between the high level layers and the lower ones. Next, one of the most important levels because OSGi is the framework which allows running the SOA Architectures in a multi-service level and supporting the high level services. OSGi technology is a set of specifications that defines a dynamic component system for Java. These specifications reduce software complexity by providing a modular architecture for large-scale distributed systems as well as small, embedded applications [8]. Thus, the deployment is easier in order to develop singles modules working together. Next, the specific driver for the communication with the sensor network. It could have one or several drivers which depend on either the number of different networks in the building or the protocols integrated in the same network. Finally, the high level services (Building Management Services) which represent the main functionality of the application. It is usually to define several simple services working together for more complex behaviour of the whole system.
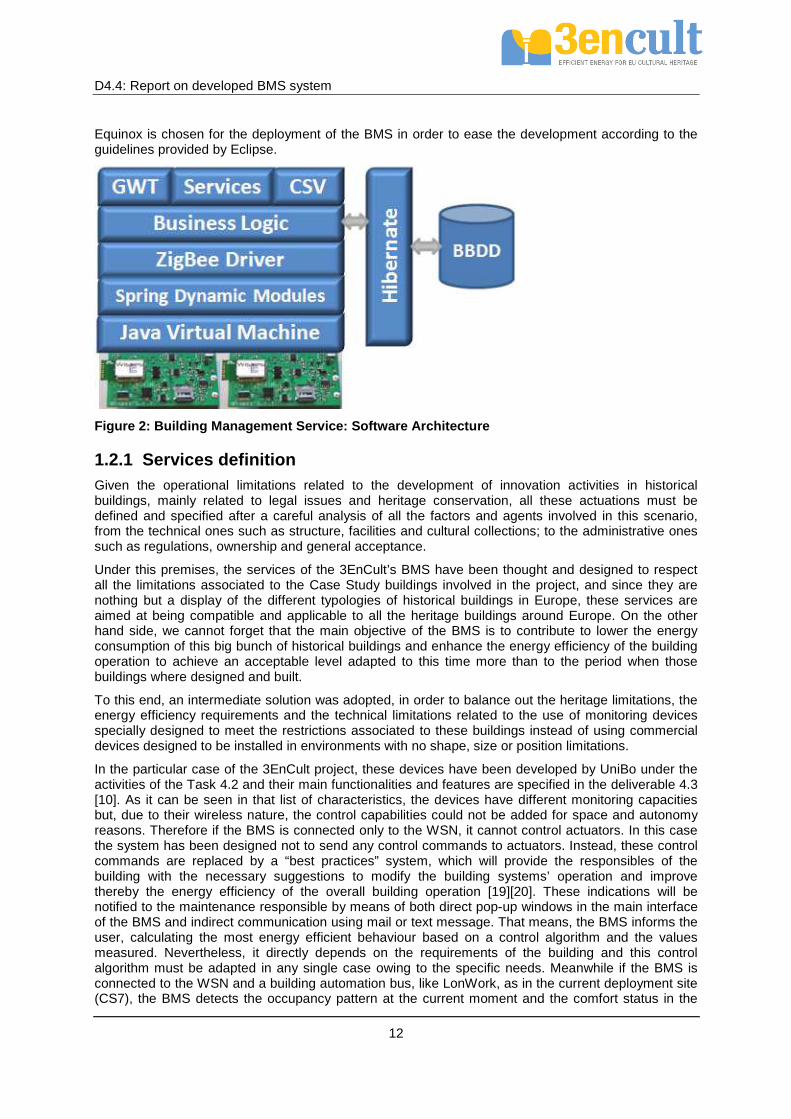
For the purpose of the 3ENCULT project a SOA architecture has been defined. It is slightly different to the common one, but it is compliant with that. Thus, six levels have been defined (Figure 2) ommiting the operating system and the drivers layers from the overall architecture. The purpose of the BMS is to be multi-platform without being important the operating system. Therefore, the hardware level is represented by the ZigBee devices. The OSGi framework has been developed through the Spring Dynamic Modules framework [9]. This framework can be defined as a Java tool suite for integrating several technologies in order to ease the software development with the help of the features for injecting the dependencies of other modules. Also, it includes a Web server for running web applications in an easy way.
The next layer is in charge of the communication with the ZigBee sensors developed in the deliverable 4.3 [10]. It has been defined a set of commands which are able to send request to the network and receive the information and the responses from the coordinator of the network. More information will be detailed in following sections.

D4.4: Report on developed BMS system
11
On the top layer, about the Building Management Services, it has been splitted into two sublayers: Business Logic and other services. First of all, the business logic sublayer is the one in charge of dispatching the communications to the database or to the high level services. It receives the data from the driver and manages the information in order to store it in the database. It also sends the variables and values to the high level services and receives the requests from these services. In summary, it is the main node for the communications among the driver, the high level services and the database. Thus, it coordinates the connection among the modules for the suitable behaviour of the whole system. Secondly, the high level services are responsible for the monitoring and downloading system. For visualization purposes, a graphical user interface based on Google Web Toolkit [11] has been implemented. GWT is a development toolkit for building and optimizing complex browser-based applications [11]. Another high level service is the CSV (Comma-Separated Values) which frames the file for downloading data. This service is based on a Java library for formatting a file containing the information. Finally, the services are those defined for the project and they will be detailed more in advance.
In parallel of the architecture, it is presented a vertical layer which is responsible for the communication with the persistent way, i.e. the database. It has been decided the use of PostgreSQL [12] as database for the project. In a comparison with Oracle [13], PostgreSQL offers reliability, data integrity, and correctness, as well as it is compliant with the standard SQL:2008 [14][15]. Moreover, it offers interfaces with several programming languages such as C#, C++ and Java. In depth, Oracle presents the same features, but it adds robustness and a large amount of data to the database size. However, the disadvantage of Oracle is the license for using it (more than 1000$). Therefore, taken into account the requirements for the BMS persistent storage, PostgreSQL applies for the conditions and it is an open-source database. Thus, the usage of a free license software allows the replicability and scalability in other buildings. That means, if the database is Oracle compliant, then a new license is needed, being the price of the BMS deployment higher than a PosgreSQL database. On the other hand, a building could install the present BMS without the need of buying any license or external software, being easier the integration of the platform.
Feature Oracle PostgreSQL Data types
compatibility Subset of SQL'92 types plus specific types Broad set of native data types
Constraints level Very good (primary and foreign key and check constraint)
Very good (primary and foreign key and check constraint restricted)
Views Yes Yes, but using rules Transactions Very good (including rollback) Very good (without rollback) Multi-users Yes, no limit Yes, limited
Back-up Yes Yes, not online Scalability Parallel multi-thread Not threated Analitical
processing Yes No
Data size limit Limited only by max. number of columns and max. size of columns of specific data
types.
16k maximum
Table 1: Comparison between PostgreSQL and Oracle
For the communication between the business logic and this database, it has been used the Hibernate framework [16] which is a useful toolkit for connecting any database. The Hibernate framework eases the development of an object-based application such as the Java language. Due to the relational aspect of the database, the managing of object is quite complex. However, the Hibernate mapping context solves this problem and it provides persitent objects as interface with the tables of the database [16]. Thus, these objects are easier to handle in the Java framework.
At last but not least, it is necessary a server for deploying all the modules and the framework. As well-known servers are Equinox [17] and Felix [18]. Both of them implement the OSGi R4 Service Platform, but Equinox is integrated with Eclipse which is the environment for the Java development. Therefore,
D4.4: Report on developed BMS system
12
Equinox is chosen for the deployment of the BMS in order to ease the development according to the guidelines provided by Eclipse.
Figure 2: Building Management Service: Software Architecture
1.2.1 Services definition Given the operational limitations related to the development of innovation activities in historical buildings, mainly related to legal issues and heritage conservation, all these actuations must be defined and specified after a careful analysis of all the factors and agents involved in this scenario, from the technical ones such as structure, facilities and cultural collections; to the administrative ones such as regulations, ownership and general acceptance.
Under this premises, the services of the 3EnCult’s BMS have been thought and designed to respect all the limitations associated to the Case Study buildings involved in the project, and since they are nothing but a display of the different typologies of historical buildings in Europe, these services are aimed at being compatible and applicable to all the heritage buildings around Europe. On the other hand side, we cannot forget that the main objective of the BMS is to contribute to lower the energy consumption of this big bunch of historical buildings and enhance the energy efficiency of the building operation to achieve an acceptable level adapted to this time more than to the period when those buildings where designed and built.
To this end, an intermediate solution was adopted, in order to balance out the heritage limitations, the energy efficiency requirements and the technical limitations related to the use of monitoring devices specially designed to meet the restrictions associated to these buildings instead of using commercial devices designed to be installed in environments with no shape, size or position limitations.
In the particular case of the 3EnCult project, these devices have been developed by UniBo under the activities of the Task 4.2 and their main functionalities and features are specified in the deliverable 4.3 [10]. As it can be seen in that list of characteristics, the devices have different monitoring capacities but, due to their wireless nature, the control capabilities could not be added for space and autonomy reasons. Therefore if the BMS is connected only to the WSN, it cannot control actuators. In this case the system has been designed not to send any control commands to actuators. Instead, these control commands are replaced by a “best practices” system, which will provide the responsibles of the building with the necessary suggestions to modify the building systems’ operation and improve thereby the energy efficiency of the overall building operation [19][20]. These indications will be notified to the maintenance responsible by means of both direct pop-up windows in the main interface of the BMS and indirect communication using mail or text message. That means, the BMS informs the user, calculating the most energy efficient behaviour based on a control algorithm and the values measured. Nevertheless, it directly depends on the requirements of the building and this control algorithm must be adapted in any single case owing to the specific needs. Meanwhile if the BMS is connected to the WSN and a building automation bus, like LonWork, as in the current deployment site (CS7), the BMS detects the occupancy pattern at the current moment and the comfort status in the
D4.4: Report on developed BMS system
13
room, being able to determine when and how to switch on/off lights and/or HVAC system. In fact, in this particular case, the BMS is integrated into the current LonWorks monitoring system and it is acting as a data collector and a support of the algorithm, emitting the information to the LonWorks network able to actuate through the available actuators. Therefore, there is no pop-up channel of communciation, but a Web page with the status of the actuators in order to report the current state.
Once the technical limitations of the devices have been set, the other factor to be considered is the one related to the specific requirements of the historical buildings, particularly, those buildings involved in 3EnCult project. To gather all the requirements, a questionnaire was developed and sent to the buildings’ reponsibles in order to perfectly define the capabilities of the BMS, using as references all the common needs and limitations gathered from the 8 case studies. In most cases, the technical requirements are related to the need of enhancing the efficiency of the building’s systems, such as lighting and HVAC, whereas the limitations are set by the regulations protecting several of those systems being considered heritage themselves.
Finally, summing up all those common needs and limitations of the historic buildings and relating them with the technical features of the monitoring devices, a number of services have been defined and developed in the framework of this project. The following list contains those BMS services together with their main capabilities and outcomes.
Lighting Service:
The lighting service is designed in order to collect the light level data, as well as the actuator and sensor status sent back by the sensor network.
According to the recommendations, the BMS includes the calculation in near real-time of the best indoor condition which means, according the measurement and the value considered as lighting comfort level, the BMS suggests to switch on/off the light.
Additional functionality is the graphical visualization of the measurements that could help the user to manage te facilities in a better way.
HVAC Service:
With regard to the HVAC service, three different data points have been identified: temperature, Relative Humidity and the air quality (CO2 concentration). Moreover, the status of the sensor for each device is also gathered so as to know the quality of the measurements. This includes the graphical representation of the values in order to help the user to know the behaviour of the systems.
The control algorithms come from [19][20], and the BMS includes an additional statistic plug-in design for the calculation of working and users’ behaviour patters (if useful for the control algorithms), as well as recommendations of utilization of the systems in real-time (depending on the user’s actions).
Energy Monitoring Service:
About the energy service, the BMS collects the electricity and thermal consumption (if available) measured by the ZigBee sensors. With these variables and the price of the electricity, the service works the total costs out. Also, statistical analysis is designed, such as the calculation of average consumption, possible savings and so on. This functionality has not been completely included in the BMS because it depends on the deployment itself, i.e. country (electricity price, tarifs systems, etc.), specific control algorithm and requirements. Therefore, in function of the building, before installation, the service must be adapted to the needs.
In addition, the consumption and the costs are represented together in a graphical view.
Technical Alarms & Task Management Service:
At the moment of writing the deliverable, the ZigBee sensor are not ready to receive any control command, therefore, the task management service is not deployed but developed. This service allows the scheduling of any task to be performed, as for example, switching off the lights at 21:00 every day.
Regarding the technical alarms, the definition of set-points and thresholds for the variables of any device is available. Afterwards, this services creates a log of alarms when any restriction is violated which could be viewed in the service screen. Furthermore, the BMS sends a mail to the administrator of the system when a constraint is violated.
D4.4: Report on developed BMS system
14
1.2.2 Software Environment
The technology selected to BMS software application is the OSGi framework, based on SOA architecture.
SOA
Service-Oriented Architecture [5] is a set of methodologies for developing software through interoperable services. The SOA is oriented to interoperability and to work with standards-based development as a fundamental principle in order to be able to adapt to the continuous change of the business requisites. Therefore, in the SOA context, integration solutions can be developed using standard design techniques and then implemented using standards-based software components [21].
The SOA development proposes a set of roles: client, provider, aggregator and operator. On other hand several services level are defined: basic services, composed services and managed services [22]. The functionalities are dependent of the services level. Basic services functionalities are capacity, interface, QoS and services publication, services discovery, services selection and services binding [21][22]. Composed service level offers coordination, advanced QoS functionalities and monitoring services. Managed services level offer deployment and support functionalities.
The main feature of this architecture is the interest in the contract between the points, but not in the interfaces. So, the consumer is independent from the service implementation.
Other features of SOA are [21][22]:
• Reusable services: The services can be used in other developments because they are following the standards of OSGi.
• Loosely coupled services: The services are not highly coupled, being almost independent. • Possibility of service-wrapped: There is an ability to wrap several services for specific goals. • Possibility of services composition: A service could be compound of several simpler ones. • Stateless services: The services are lazy being instanciated only when needed. • Self-managed services: The services are managed itself without the intervention of users. • Exposed services: The services are exposed by well-established interfaces. • Dynamic discover: A service can discover dinamically another service.
OSGi
OSGi framework defines a standard, non-proprietary and free software SOA architecture for manufacturers, services providers and developers. The scope is the development of different platforms and interoperable components to provide multiple services [23] .
In OSGI framework different components run in a single JVM (minimizing the memory footprint and increasing performance). OSGi provides a flexible deployment Application Programming Interface (API) that controls the lifecycle of applications. Applications are installed with a standardized deployment format (.jar archive with JAVA code and other resources) and can then be started, stopped, updated, and uninstalled without requiring the JVM to be restarted.
OSGi framework allows applications to dynamically discover and use services provided by other applications running inside the same OSGi Service Platform [8][23]. Because of this cooperation OSGi components are much smaller than other java application servers (less memory requirements).
Besides, there are several implementations of OSGi frameworks with interoperable and standardized components and services already developed: Logging, Configuration, HTTP, XML, Wiring, IO, Event Handling, User Authentication...
D4.4: Report on developed BMS system
15
POSTGRESQL
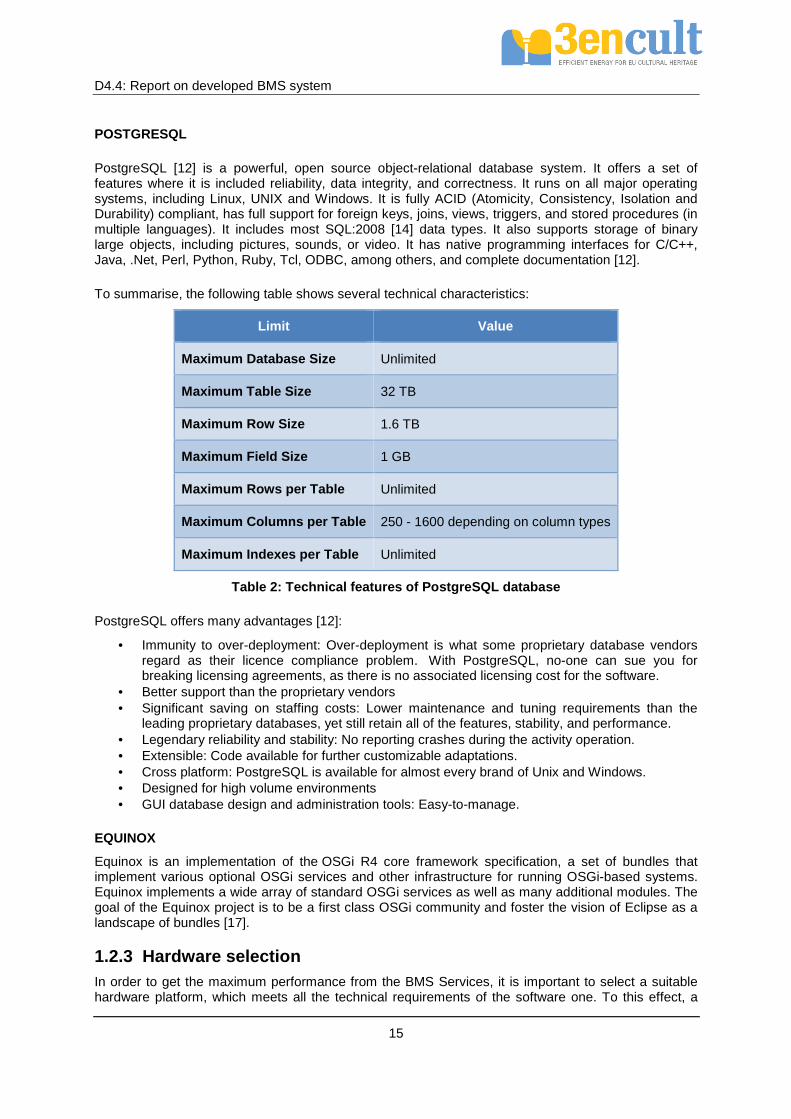
PostgreSQL [12] is a powerful, open source object-relational database system. It offers a set of features where it is included reliability, data integrity, and correctness. It runs on all major operating systems, including Linux, UNIX and Windows. It is fully ACID (Atomicity, Consistency, Isolation and Durability) compliant, has full support for foreign keys, joins, views, triggers, and stored procedures (in multiple languages). It includes most SQL:2008 [14] data types. It also supports storage of binary large objects, including pictures, sounds, or video. It has native programming interfaces for C/C++, Java, .Net, Perl, Python, Ruby, Tcl, ODBC, among others, and complete documentation [12].
To summarise, the following table shows several technical characteristics:
Limit Value
Maximum Database Size Unlimited
Maximum Table Size 32 TB
Maximum Row Size 1.6 TB
Maximum Field Size 1 GB
Maximum Rows per Table Unlimited
Maximum Columns per Table 250 - 1600 depending on column types
Maximum Indexes per Table Unlimited
Table 2: Technical features of PostgreSQL database
PostgreSQL offers many advantages [12]:
• Immunity to over-deployment: Over-deployment is what some proprietary database vendors regard as their licence compliance problem. With PostgreSQL, no-one can sue you for breaking licensing agreements, as there is no associated licensing cost for the software.
• Better support than the proprietary vendors • Significant saving on staffing costs: Lower maintenance and tuning requirements than the
leading proprietary databases, yet still retain all of the features, stability, and performance. • Legendary reliability and stability: No reporting crashes during the activity operation. • Extensible: Code available for further customizable adaptations. • Cross platform: PostgreSQL is available for almost every brand of Unix and Windows. • Designed for high volume environments • GUI database design and administration tools: Easy-to-manage.
EQUINOX
Equinox is an implementation of the OSGi R4 core framework specification, a set of bundles that implement various optional OSGi services and other infrastructure for running OSGi-based systems. Equinox implements a wide array of standard OSGi services as well as many additional modules. The goal of the Equinox project is to be a first class OSGi community and foster the vision of Eclipse as a landscape of bundles [17].
1.2.3 Hardware selection In order to get the maximum performance from the BMS Services, it is important to select a suitable hardware platform, which meets all the technical requirements of the software one. To this effect, a
D4.4: Report on developed BMS system
16
research has been done, analyzing all the possibilities available on the market. Among all these possibilities, the most suitable ones have been listed in this document:
• Embedded device: Using an embedded device to run these type of applications is very typical, given that it requires less physical space and, normally, the microprocessor requirements are not a key factor. In our case, the BMS requires a medium/high microprocessor performance, and other features listed below, so we discarded this choice. The limitations found are:
o Limited microprocessor performance.
o Little memory space to save the monitoring data and BMS configurations.
o Additional keyboard or touch panel to manage and set up the services.
• Netbook: The netbook fulfills part of the requirements which are not covered by the embedded devices; however, this type of devices also lack memory space and microprocessor performance, and finally, they include a screen, which is not a main feature to run the BMS.
• Personal Computer: After analyzing all these devices, we consider that the best solution to fulfill the BMS requirements is the use of a standard personal computer or touch panel, in which both the microprocessor performance and memory are enough powerful to guarantee the fluent and correct working of the system.
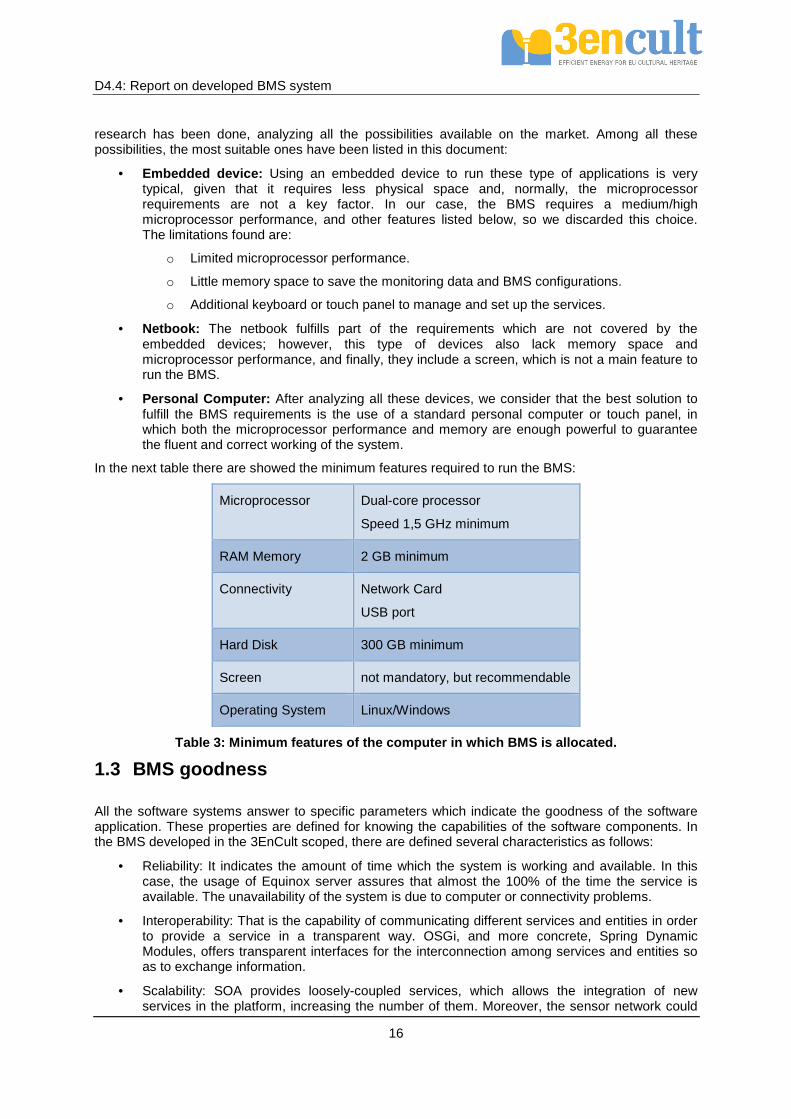
In the next table there are showed the minimum features required to run the BMS:
Microprocessor Dual-core processor
Speed 1,5 GHz minimum
RAM Memory 2 GB minimum
Connectivity Network Card
USB port
Hard Disk 300 GB minimum
Screen not mandatory, but recommendable
Operating System Linux/Windows
Table 3: Minimum features of the computer in which BMS is allocated.
1.3 BMS goodness
All the software systems answer to specific parameters which indicate the goodness of the software application. These properties are defined for knowing the capabilities of the software components. In the BMS developed in the 3EnCult scoped, there are defined several characteristics as follows:
• Reliability: It indicates the amount of time which the system is working and available. In this case, the usage of Equinox server assures that almost the 100% of the time the service is available. The unavailability of the system is due to computer or connectivity problems.
• Interoperability: That is the capability of communicating different services and entities in order to provide a service in a transparent way. OSGi, and more concrete, Spring Dynamic Modules, offers transparent interfaces for the interconnection among services and entities so as to exchange information.
• Scalability: SOA provides loosely-coupled services, which allows the integration of new services in the platform, increasing the number of them. Moreover, the sensor network could
D4.4: Report on developed BMS system
17
be incremented with the only limitation of the wireless sensor network because the BMS receives the information as data streams that can be managed by the services.
• Replicability: The development of the BMS has been done through open software and standards, therefore, the BMS could be replicated in any other building.
1.4 Interfaces definition
For the interoperability among all the bundles and modules deployed in the BMS, it is needed the definition of the interfaces for the communication. Thus, the following interfaces are identified:
1. I1 – ZigBee driver and business logic layer
This interface is in charge of the communication between the sensor network, which is compliant with ZigBee by means of using commands, and the business logic layer that represents the core of the BMS. As it will be explained in detail in the section 2, the communication is done through a set of commands for different purposes. Furthermore, the data is periodically sent to the BMS as a character stream with the information. The values have to be interpreted before being stored into the database, therefore, the format of the information must be known.
2. I2 – Services and business logic layer
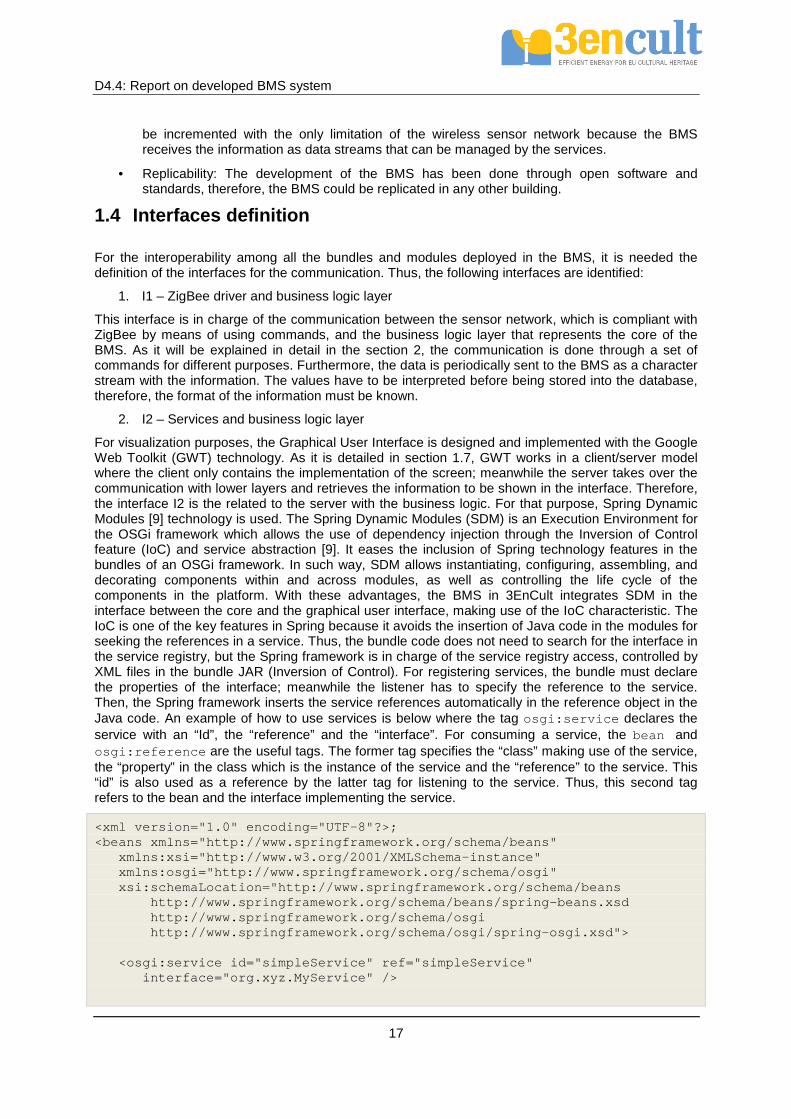
For visualization purposes, the Graphical User Interface is designed and implemented with the Google Web Toolkit (GWT) technology. As it is detailed in section 1.7, GWT works in a client/server model where the client only contains the implementation of the screen; meanwhile the server takes over the communication with lower layers and retrieves the information to be shown in the interface. Therefore, the interface I2 is the related to the server with the business logic. For that purpose, Spring Dynamic Modules [9] technology is used. The Spring Dynamic Modules (SDM) is an Execution Environment for the OSGi framework which allows the use of dependency injection through the Inversion of Control feature (IoC) and service abstraction [9]. It eases the inclusion of Spring technology features in the bundles of an OSGi framework. In such way, SDM allows instantiating, configuring, assembling, and decorating components within and across modules, as well as controlling the life cycle of the components in the platform. With these advantages, the BMS in 3EnCult integrates SDM in the interface between the core and the graphical user interface, making use of the IoC characteristic. The IoC is one of the key features in Spring because it avoids the insertion of Java code in the modules for seeking the references in a service. Thus, the bundle code does not need to search for the interface in the service registry, but the Spring framework is in charge of the service registry access, controlled by XML files in the bundle JAR (Inversion of Control). For registering services, the bundle must declare the properties of the interface; meanwhile the listener has to specify the reference to the service. Then, the Spring framework inserts the service references automatically in the reference object in the Java code. An example of how to use services is below where the tag osgi:service declares the service with an “Id”, the “reference” and the “interface”. For consuming a service, the bean and osgi:reference are the useful tags. The former tag specifies the “class” making use of the service, the “property” in the class which is the instance of the service and the “reference” to the service. This “id” is also used as a reference by the latter tag for listening to the service. Thus, this second tag refers to the bean and the interface implementing the service.
<xml version="1.0" encoding="UTF-8"?>; <beans xmlns="http://www.springframework.org/schema/beans" xmlns:xsi="http://www.w3.org/2001/XMLSchema-instance" xmlns:osgi="http://www.springframework.org/schema/osgi" xsi:schemaLocation="http://www.springframework.org/schema/beans http://www.springframework.org/schema/beans/spring-beans.xsd http://www.springframework.org/schema/osgi http://www.springframework.org/schema/osgi/spring-osgi.xsd"> <osgi:service id="simpleService" ref="simpleService" interface="org.xyz.MyService" />
D4.4: Report on developed BMS system
18
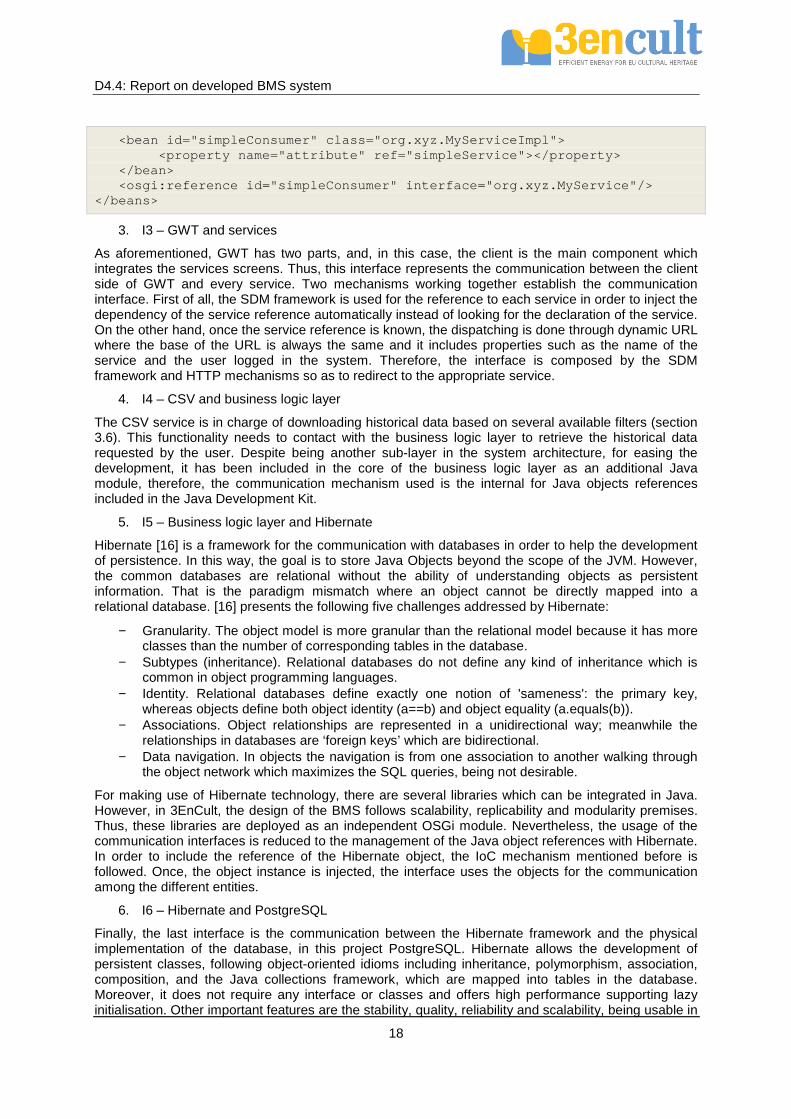
<bean id="simpleConsumer" class="org.xyz.MyServiceImpl"> <property name="attribute" ref="simpleService"></property> </bean> <osgi:reference id="simpleConsumer" interface="org.xyz.MyService"/> </beans>
3. I3 – GWT and services
As aforementioned, GWT has two parts, and, in this case, the client is the main component which integrates the services screens. Thus, this interface represents the communication between the client side of GWT and every service. Two mechanisms working together establish the communication interface. First of all, the SDM framework is used for the reference to each service in order to inject the dependency of the service reference automatically instead of looking for the declaration of the service. On the other hand, once the service reference is known, the dispatching is done through dynamic URL where the base of the URL is always the same and it includes properties such as the name of the service and the user logged in the system. Therefore, the interface is composed by the SDM framework and HTTP mechanisms so as to redirect to the appropriate service.
4. I4 – CSV and business logic layer
The CSV service is in charge of downloading historical data based on several available filters (section 3.6). This functionality needs to contact with the business logic layer to retrieve the historical data requested by the user. Despite being another sub-layer in the system architecture, for easing the development, it has been included in the core of the business logic layer as an additional Java module, therefore, the communication mechanism used is the internal for Java objects references included in the Java Development Kit.
5. I5 – Business logic layer and Hibernate
Hibernate [16] is a framework for the communication with databases in order to help the development of persistence. In this way, the goal is to store Java Objects beyond the scope of the JVM. However, the common databases are relational without the ability of understanding objects as persistent information. That is the paradigm mismatch where an object cannot be directly mapped into a relational database. [16] presents the following five challenges addressed by Hibernate:
− Granularity. The object model is more granular than the relational model because it has more classes than the number of corresponding tables in the database.
− Subtypes (inheritance). Relational databases do not define any kind of inheritance which is common in object programming languages.
− Identity. Relational databases define exactly one notion of 'sameness': the primary key, whereas objects define both object identity (a==b) and object equality (a.equals(b)).
− Associations. Object relationships are represented in a unidirectional way; meanwhile the relationships in databases are ‘foreign keys’ which are bidirectional.
− Data navigation. In objects the navigation is from one association to another walking through the object network which maximizes the SQL queries, being not desirable.
For making use of Hibernate technology, there are several libraries which can be integrated in Java. However, in 3EnCult, the design of the BMS follows scalability, replicability and modularity premises. Thus, these libraries are deployed as an independent OSGi module. Nevertheless, the usage of the communication interfaces is reduced to the management of the Java object references with Hibernate. In order to include the reference of the Hibernate object, the IoC mechanism mentioned before is followed. Once, the object instance is injected, the interface uses the objects for the communication among the different entities.
6. I6 – Hibernate and PostgreSQL
Finally, the last interface is the communication between the Hibernate framework and the physical implementation of the database, in this project PostgreSQL. Hibernate allows the development of persistent classes, following object-oriented idioms including inheritance, polymorphism, association, composition, and the Java collections framework, which are mapped into tables in the database. Moreover, it does not require any interface or classes and offers high performance supporting lazy initialisation. Other important features are the stability, quality, reliability and scalability, being usable in
D4.4: Report on developed BMS system
19
any environment. Finally, Hibernate enables the usage of Hibernate Query Language (HQL) instead of native SQL, avoiding the knowledge of this language [16].
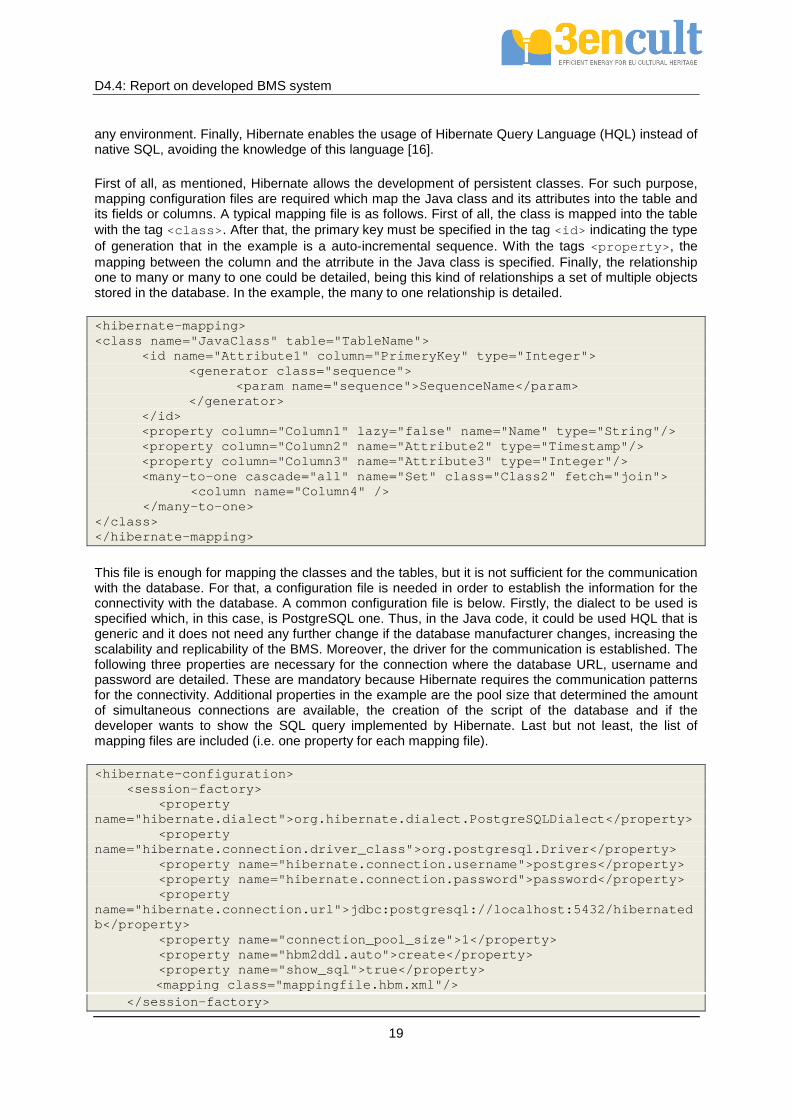
First of all, as mentioned, Hibernate allows the development of persistent classes. For such purpose, mapping configuration files are required which map the Java class and its attributes into the table and its fields or columns. A typical mapping file is as follows. First of all, the class is mapped into the table with the tag <class>. After that, the primary key must be specified in the tag <id> indicating the type of generation that in the example is a auto-incremental sequence. With the tags <property>, the mapping between the column and the atrribute in the Java class is specified. Finally, the relationship one to many or many to one could be detailed, being this kind of relationships a set of multiple objects stored in the database. In the example, the many to one relationship is detailed.
<hibernate-mapping> <class name="JavaClass" table="TableName"> <id name="Attribute1" column="PrimeryKey" type="Integer"> <generator class="sequence"> <param name="sequence">SequenceName</param> </generator> </id> <property column="Column1" lazy="false" name="Name" type="String"/> <property column="Column2" name="Attribute2" type="Timestamp"/> <property column="Column3" name="Attribute3" type="Integer"/> <many-to-one cascade="all" name="Set" class="Class2" fetch="join"> <column name="Column4" /> </many-to-one> </class> </hibernate-mapping>
This file is enough for mapping the classes and the tables, but it is not sufficient for the communication with the database. For that, a configuration file is needed in order to establish the information for the connectivity with the database. A common configuration file is below. Firstly, the dialect to be used is specified which, in this case, is PostgreSQL one. Thus, in the Java code, it could be used HQL that is generic and it does not need any further change if the database manufacturer changes, increasing the scalability and replicability of the BMS. Moreover, the driver for the communication is established. The following three properties are necessary for the connection where the database URL, username and password are detailed. These are mandatory because Hibernate requires the communication patterns for the connectivity. Additional properties in the example are the pool size that determined the amount of simultaneous connections are available, the creation of the script of the database and if the developer wants to show the SQL query implemented by Hibernate. Last but not least, the list of mapping files are included (i.e. one property for each mapping file).
<hibernate-configuration> <session-factory> <property name="hibernate.dialect">org.hibernate.dialect.PostgreSQLDialect</property> <property name="hibernate.connection.driver_class">org.postgresql.Driver</property> <property name="hibernate.connection.username">postgres</property> <property name="hibernate.connection.password">password</property> <property name="hibernate.connection.url">jdbc:postgresql://localhost:5432/hibernatedb</property> <property name="connection_pool_size">1</property> <property name="hbm2ddl.auto">create</property> <property name="show_sql">true</property> <mapping class="mappingfile.hbm.xml"/> </session-factory>

D4.4: Report on developed BMS system
20
</hibernate-configuration>
1.5 BMS Roles
In a typical BMS service is important to consider different roles in order to establish some access constraints, so that the information can be properly divided in different access levels. At the moment, four user profiles have been taken into account:
1. Admin : this user is set up to configure the application and database. Thus, values from database can be added, modified or updated in order to obtain devices identifiers, application fields and variables.
In addition, the administrator can configure the devices and sensors, which involve the ability to create, modify or delete devices/application fields or attributes data. Moreover, the administrator can enable/disable the sensors on devices, reset the network, establish sleep time and enable/disable the capability of the coordinator to join new devices.
The admin manages users and profiles from database. Furthermore, it can create new users, change profiles or delete users/profiles, which imply the possibility to change the user’s permission to access application context.
Apart from the configuration capabilities, the admin has total access to the rest of the interfaces defined, like those aimed to monitor and download data.
2. Project user : this kind of user is considered in order to give monitor and download data access to project members. Thus, the data can be studied by project members through graphical and table interfaces. Additionally, a user interface will be defined to monitor the variables from devices in real time.
3. External user : this user has permission to access to application by means of login/password or free login. The difference between that user and the previous one is the possibility to download data. Unlike project user, external users have not permission to download data from the application.
4. Maintenance user : a user defined to have total access to control devices. This role is an extended version of the project user, adding the ability to manage control devices, such as HVAC and lighting devices. Moreover, it is in charge of the confguration of the BMS such as application fields, users in the system, management of the sensor network, etc.
1.6 BMS database
The BMS needs a database to collect both the monitoring and configuration data. Furthermore, independent services need to save important information in the database, in order to guarantee a correct working.
In 3EnCult case, the database selected is SQL based, specifically PosgreSQL [12], which collects the attributes, variables and configuration data. The communication between the BMS Services with the database is performed through Hibernate.
In Figure 3 is represented the entity-relationship scheme which is the basis of the database. In this diagram the tables and the fields for each table are printed and they store the information of the BMS in the persistent way. These diagram is translated into a SQL data definition language in order to create the skeleton for the database and initialize the tables needed. On the other hand, it is shown the table attribute where the main data will be stored. However, in the representation does not appear, but in the final implementation there are monthly tables which store data for each month. That is a performance requirement because when the number of rows in a table exceeds an amount of data the response time is exponencially increased. By the way, less amount of data increases the performance of the database. The management of the concept of big data is a current problem in all the software platforms which store and read a lot of rows in a database. As explained before, Oracle performance is better than PostgreSQL in the management of big data. Nevertheless, a good maintenance and design of the database could afford with this problem. That is the reason why the attribute table has

D4.4: Report on developed BMS system
21
been divided into twelve instances, one for each month of the year. Moreover, the creation and usage of indexes and performance tools for database administrator speeds up the queries.
Figure 3: Entity-Relationship and table diagrams
1.7 GUI definition
Several approaches are available in the market for the development of Graphical User Interfaces: Swing, SwingX, AWT, SWT or GWT are some examples. The final decision is the use of Google Web Toolkit owing to the features presented. To summarise, GWT [11] is a development toolkit for building and optimizing complex browser-based applications and is open source, completely free, and used by thousands of developers around the world, therefore, the documentation is extensive. GWT enables productive and high-performance development of web-applications. It is based on JavaScript and Ajax languages, but avoiding the complexity of them. The developer implements the GUI in a common Java

D4.4: Report on developed BMS system
22
code through the Java APIs and the compiler is in charge of translating this code into optimized and stand-alone Ajax and JavaScript. The great advantage is that it can be run across all major browsers, but also mobile phones.
Always, a GWT project is divided into two parts following a client/server model. The client is a stand-alone compiled code which is downloaded into the browser as a cache provider in order to speed up the loading of the Web pages. On the other hand, the server is running remotely in some machine and it offers the functionality for communicating to external services, performing some calculations and so on. The internal communication between the client and the server is done through Remote Procedure Calls (RPC) that is a specific Web Service. The server could itself perform the action or delegate the operations. Thus, in the 3EnCult project, when the client is loading, it requests the information to the server side which delegates the operation to the business logic layer through the aforementioned interface.
The design of the Graphical User Interface has been based on the Figure 4, which represents the most generic screen for the whole BMS. The remaining screens have followed the same structure, but taking into account the privileges of each user in order to filter the possibilities of management. For this reason, it has been avoided the inclusion of all the graphical design that could increase the document too much without adding crucial information.
Figure 4: Generic screen for the 3EnCult GUI
D4.4: Report on developed BMS system
23
2 ZigBee specification and interface
The developed driver to connect with Zigbee devices is, obviously, JAVA based. The implementation has been completed by using the available Java libraries for the communication with the USB ports in a computer. More concrete, the Java Simple Serial Connector libraries available in Google Code blog [24] has been used. It is able to support several platforms: Win32 (Win98-Win8), Win64, Linux (x86, x86-64, ARM), Solaris (x86, x86-64), Mac OS X 10.5 and higher (x86, x86-64, PPC, PPC64) which increases the replicability of the system.
The driver contains the logic of program and communicates the physical Zigbee devices with the bottom layer of the BMS, allowing to share information between them. Additionally, it manages the events in the interface and the communication with database. Thus, it operates with the commands defined and interacts with the devices. The list of commands implemented in the driver are the following:
• p � Change the on board sensors on/off. It means enable or disable sensor measurements in a concrete device by sending, for instance, p001100. The example deactivates the two first sensors and the last two sensors, meanwhile the two intermediate sensors are enabled.
• r � Reset the network. • w � Set up the sleep time in the nodes. For example, sending w=600 means the sleep time in
the nodes is established to 10 minutes.
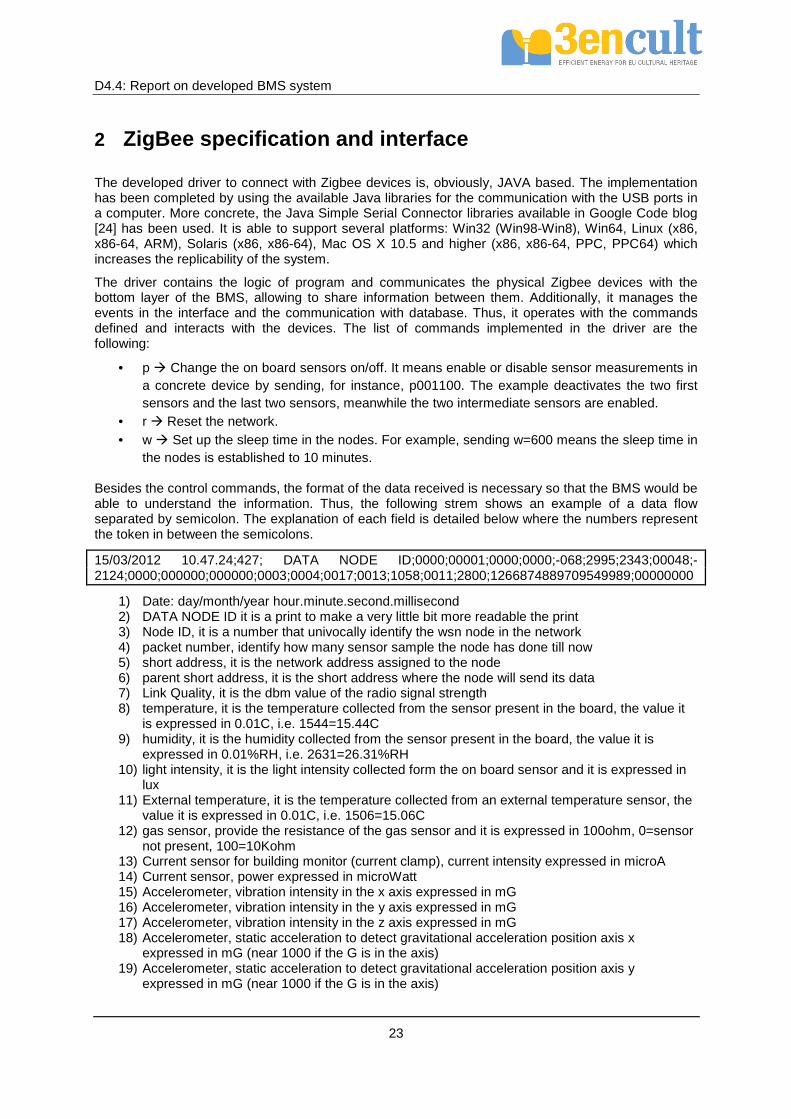
Besides the control commands, the format of the data received is necessary so that the BMS would be able to understand the information. Thus, the following strem shows an example of a data flow separated by semicolon. The explanation of each field is detailed below where the numbers represent the token in between the semicolons.
15/03/2012 10.47.24;427; DATA NODE ID;0000;00001;0000;0000;-068;2995;2343;00048;-2124;0000;000000;000000;0003;0004;0017;0013;1058;0011;2800;1266874889709549989;00000000
1) Date: day/month/year hour.minute.second.millisecond 2) DATA NODE ID it is a print to make a very little bit more readable the print 3) Node ID, it is a number that univocally identify the wsn node in the network 4) packet number, identify how many sensor sample the node has done till now 5) short address, it is the network address assigned to the node 6) parent short address, it is the short address where the node will send its data 7) Link Quality, it is the dbm value of the radio signal strength 8) temperature, it is the temperature collected from the sensor present in the board, the value it
is expressed in 0.01C, i.e. 1544=15.44C 9) humidity, it is the humidity collected from the sensor present in the board, the value it is
expressed in 0.01%RH, i.e. 2631=26.31%RH 10) light intensity, it is the light intensity collected form the on board sensor and it is expressed in
lux 11) External temperature, it is the temperature collected from an external temperature sensor, the
value it is expressed in 0.01C, i.e. 1506=15.06C 12) gas sensor, provide the resistance of the gas sensor and it is expressed in 100ohm, 0=sensor
not present, 100=10Kohm 13) Current sensor for building monitor (current clamp), current intensity expressed in microA 14) Current sensor, power expressed in microWatt 15) Accelerometer, vibration intensity in the x axis expressed in mG 16) Accelerometer, vibration intensity in the y axis expressed in mG 17) Accelerometer, vibration intensity in the z axis expressed in mG 18) Accelerometer, static acceleration to detect gravitational acceleration position axis x
expressed in mG (near 1000 if the G is in the axis) 19) Accelerometer, static acceleration to detect gravitational acceleration position axis y
expressed in mG (near 1000 if the G is in the axis)

D4.4: Report on developed BMS system
24
20) Accelerometer, static acceleration to detect gravitational acceleration position axis z expressed in mG (near 1000 if the G is in the axis)
21) Battery voltage expressed in mV, i.e. 2611=2.611V 22) Battery charge burned, the battery charge burned until now, expressed in microCoulomb
(divide to 3.600.000,00 to have mAh) 23) Debug field

D4.4: Report on developed BMS system
25
3 BMS Services
Before accessing to the platform, it is required the login making use of the main screen shown in the Figure 5 which contains fields for including the nickname and password owing to privileges definition. The right side of the picture displays the status of the system when the access is tried and the BMS is checking the privileges of the user.
Figure 5: Access screen to the Building Management System
3.1 Monitoring Service
The monitoring interface allows the users and admin access to the data collected using sensors and meters installed in a specific system and stored in a database. The main guidelines followed to develop the monitoring service are listed below:
• The monitoring data will be divided in the different application fields considered in 3EnCult Project: comfort, energy consumption and climate attack.
• Rapid transitions between different information (related to different rooms or systems) have been developed so that the user is able to collect the required data in an easy manner.
• Rapid access to download data through standard files (.csv files). Apart from an easy way to look up the data, a choice to download data in this standard file is available.
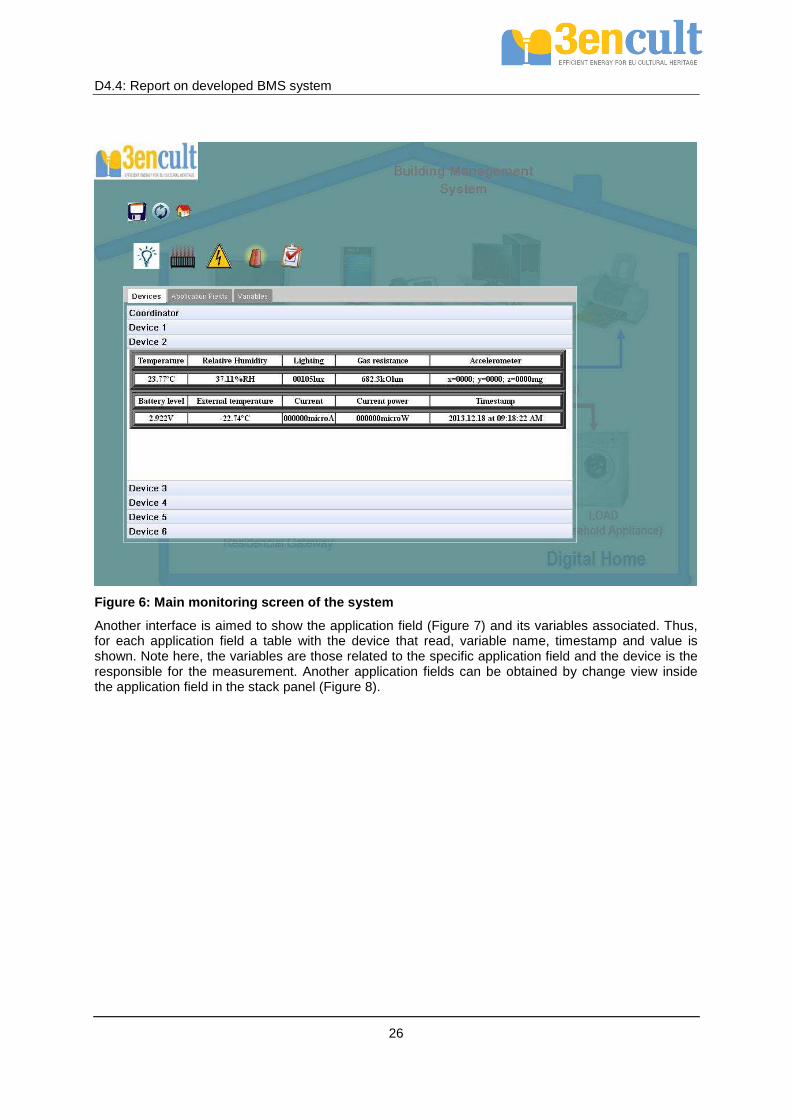
When login is correct, the next interface is shown; otherwise, an error message would pop up to inform user about the error. Figure 6 is the main monitoring interface that, by default, draws the devices tab and displays the list of devices jointly the latest values measured for each device, as well as the timestamp related to the measurement. In the top of the screen, there are the main controls for accessing to the services, downloading historical data, updating values and logging out.
All the monitoring updates are managed via “refresh” button. The coordinator collects data from sensors and update the database automatically. With the update, the application reads again the data in the database and shows latest values. All users have enabled this button to watch both attributes and values.
The services buttons allow the access to the different services, i.e. lighting service, HVAC, energy, alarms and task management.
D4.4: Report on developed BMS system
26
Figure 6: Main monitoring screen of the system
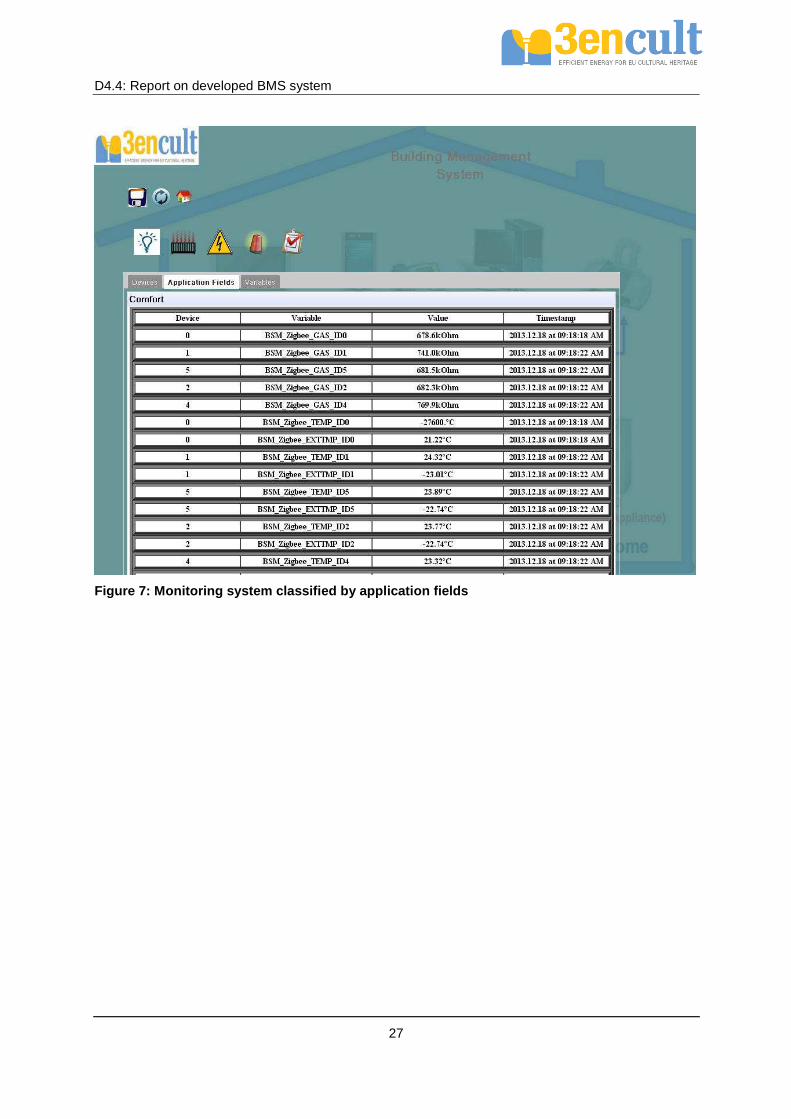
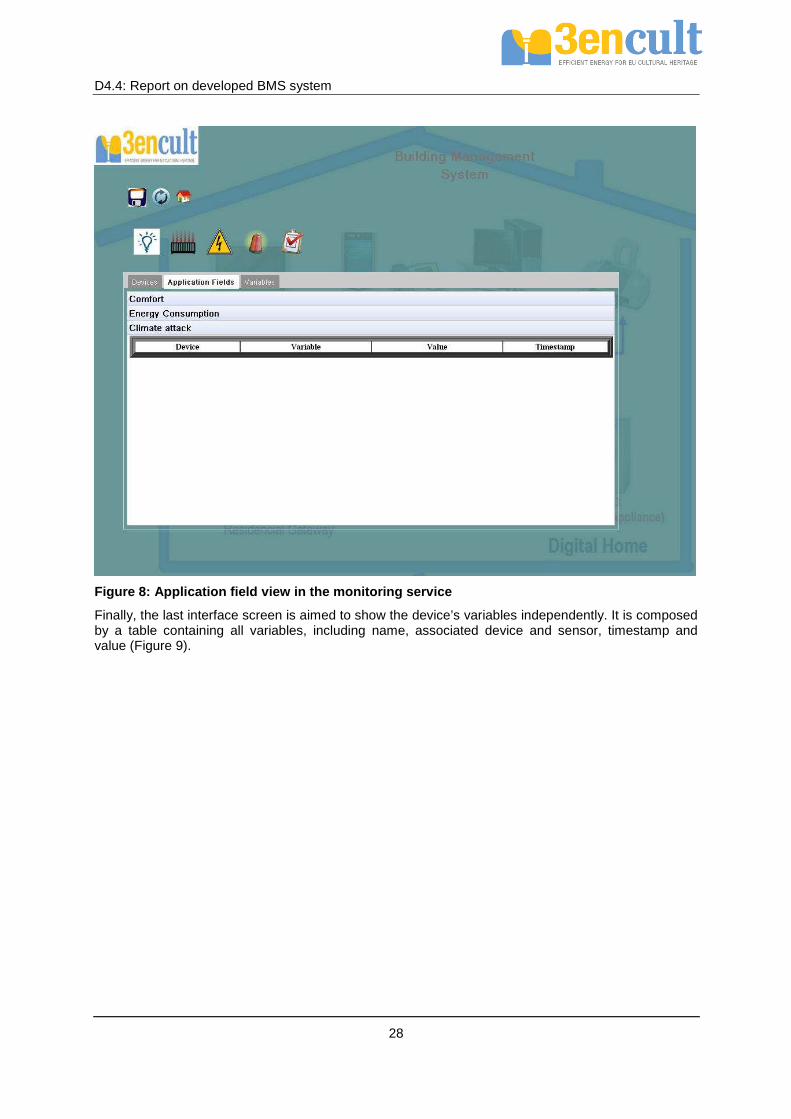
Another interface is aimed to show the application field (Figure 7) and its variables associated. Thus, for each application field a table with the device that read, variable name, timestamp and value is shown. Note here, the variables are those related to the specific application field and the device is the responsible for the measurement. Another application fields can be obtained by change view inside the application field in the stack panel (Figure 8).
D4.4: Report on developed BMS system
27
Figure 7: Monitoring system classified by applicati on fields
D4.4: Report on developed BMS system
28
Figure 8: Application field view in the monitoring service
Finally, the last interface screen is aimed to show the device’s variables independently. It is composed by a table containing all variables, including name, associated device and sensor, timestamp and value (Figure 9).

D4.4: Report on developed BMS system
29
Figure 9: List of variables in the monitoring syste m
3.2 Lighting Management Service
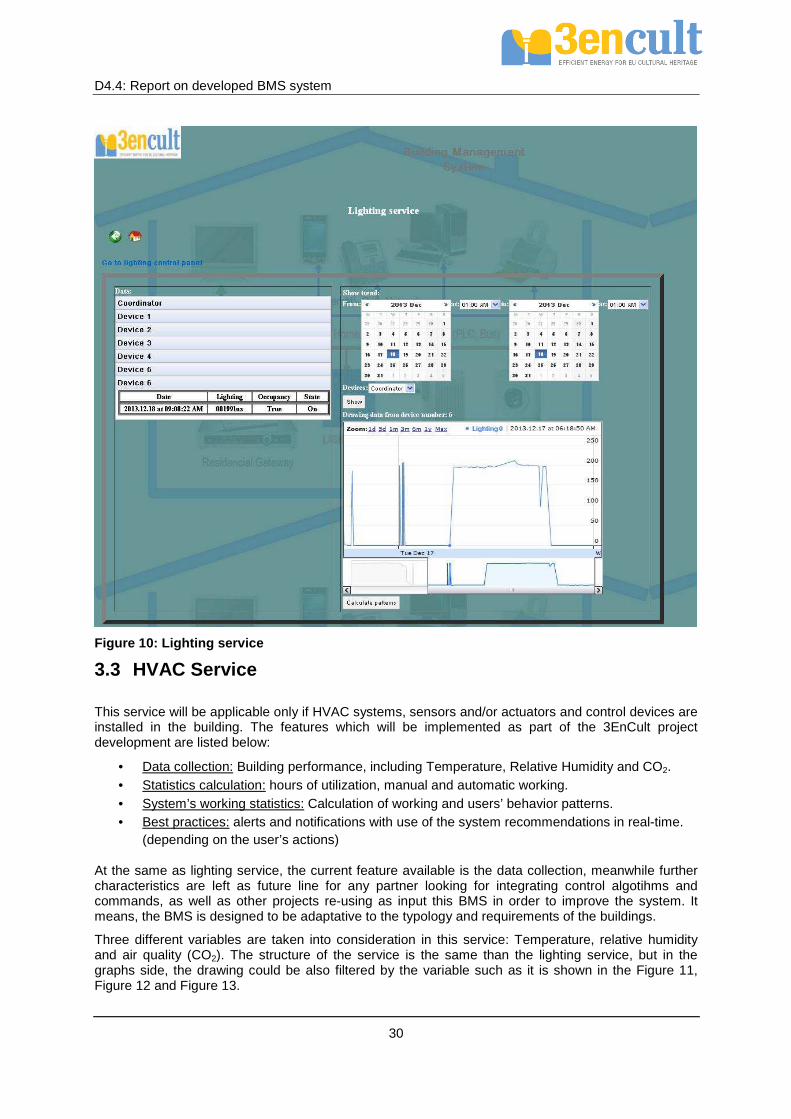
A typical monitoring interface consists of two main and separated parts, one aimed to access the historical data and download them in a file, and other part oriented to monitor the real-time variations of those parameters measured. For that purpose, Figure 10 divides the screen in these two parts. On the left side, the list of devices with the latest value for the light level and the timestamp is displayed. However, on the right side, a graph is drawn according to the filters selected (i.e. time slot and device to be represented). On the bottom, there is a button to calculate the patterns, but as aforementioned, these patters are not still deployed due to the specific requirements in every building (i.e. control algorithm).
Thus, the functionalities of this service will be applicable only if lighting sensors and/or actuators are installed and activated in the building. At the moment, only the lighting data collection and sensor status are shown. Nevertheless, as future line the following features are planned:
• Statistics calculation: hours of utilization, manual and automatic working. • System’s working statistics: Calculation of working and users’ behavior patterns. • Best practices: alerts with recommendations of utilization of the systems in real-time.
(depending on the user’s actions)
Finally, two links have been added, the former links to the monitoring in order to give to the user the possibility of downloading the data; the latter links with the control interface, which will be developed to support those case studies with light control devices installed.
D4.4: Report on developed BMS system
30
Figure 10: Lighting service
3.3 HVAC Service
This service will be applicable only if HVAC systems, sensors and/or actuators and control devices are installed in the building. The features which will be implemented as part of the 3EnCult project development are listed below:
• Data collection: Building performance, including Temperature, Relative Humidity and CO2. • Statistics calculation: hours of utilization, manual and automatic working. • System’s working statistics: Calculation of working and users’ behavior patterns. • Best practices: alerts and notifications with use of the system recommendations in real-time.
(depending on the user’s actions)
At the same as lighting service, the current feature available is the data collection, meanwhile further characteristics are left as future line for any partner looking for integrating control algotihms and commands, as well as other projects re-using as input this BMS in order to improve the system. It means, the BMS is designed to be adaptative to the typology and requirements of the buildings.
Three different variables are taken into consideration in this service: Temperature, relative humidity and air quality (CO2). The structure of the service is the same than the lighting service, but in the graphs side, the drawing could be also filtered by the variable such as it is shown in the Figure 11, Figure 12 and Figure 13.

D4.4: Report on developed BMS system
31
Figure 11: HVAC temperature service

D4.4: Report on developed BMS system
32
Figure 12: HVAC relative humidity service

D4.4: Report on developed BMS system
33
Figure 13: HVAC air quality service
3.4 Energy Consumption Management
Applicable only if consumption information is available or consumption meters and sensors are installed in the building. The features which will be implemented as part of the 3EnCult project development are listed below:
• Data collection: Electrical consumption information. • Calculations and graphical representation: consumptions, costs, averages. • Best practices: alerts and notifications with recommendations to save energy and money in
real-time.
At the moment of writing the document, the devices do not have any external probe in order to measure the electrical consumption, therefore, the values presented by the sensor are always ‘0’ (Figure 14). The service is represented in the same way than the previous ones. However, it is already worked out the costs taking into account the price of the electricity (configurable). Moreover, the electrical consumption and the associated costs in each application field are illustrated on the left side of the screen.
D4.4: Report on developed BMS system
34
Figure 14: Energy management service
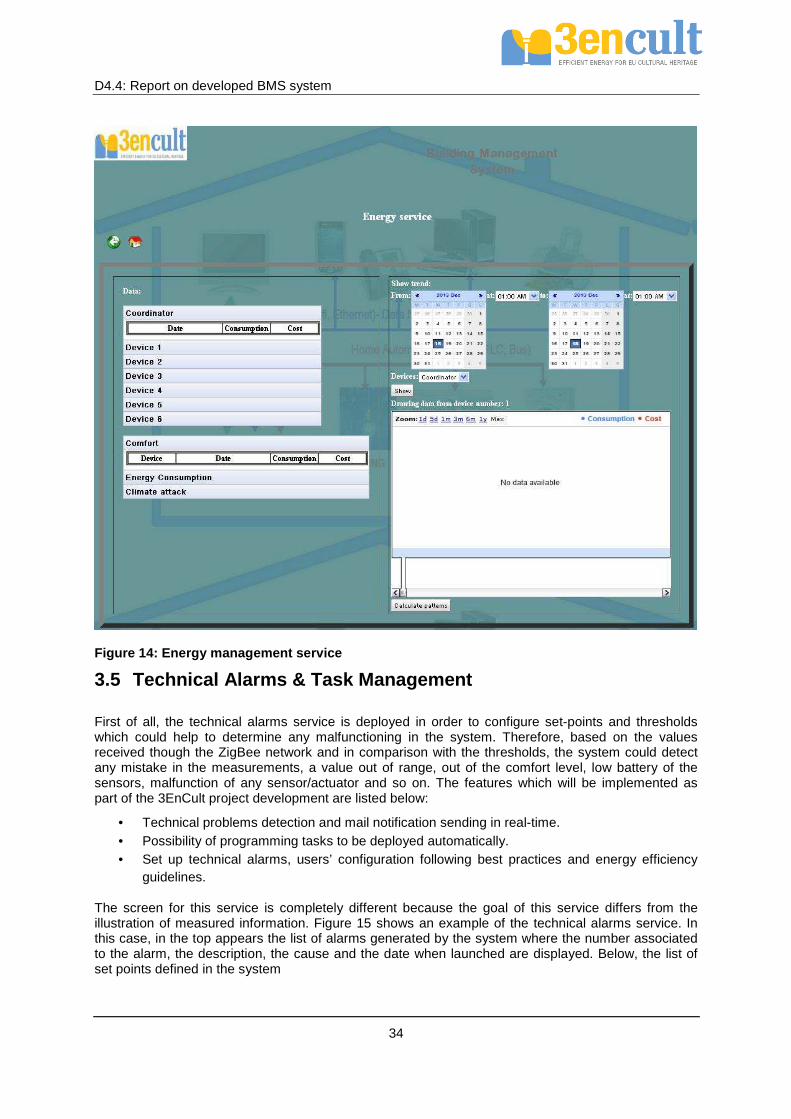
3.5 Technical Alarms & Task Management
First of all, the technical alarms service is deployed in order to configure set-points and thresholds which could help to determine any malfunctioning in the system. Therefore, based on the values received though the ZigBee network and in comparison with the thresholds, the system could detect any mistake in the measurements, a value out of range, out of the comfort level, low battery of the sensors, malfunction of any sensor/actuator and so on. The features which will be implemented as part of the 3EnCult project development are listed below:
• Technical problems detection and mail notification sending in real-time. • Possibility of programming tasks to be deployed automatically. • Set up technical alarms, users’ configuration following best practices and energy efficiency
guidelines.
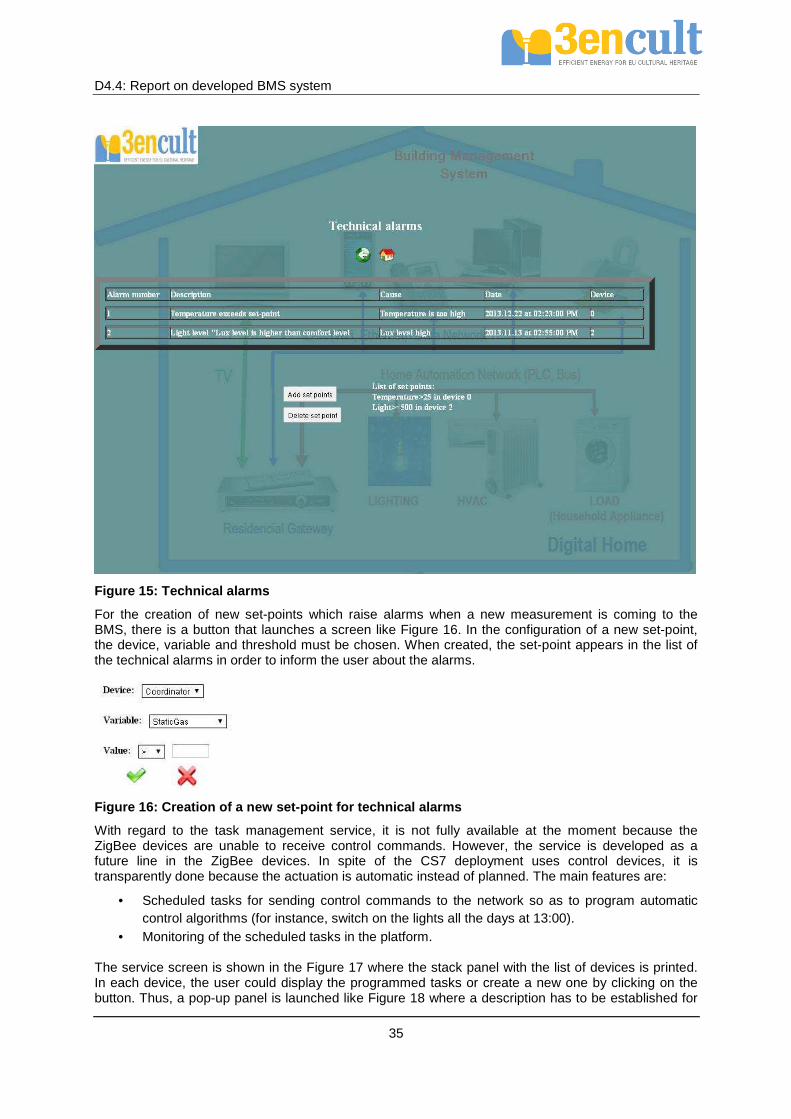
The screen for this service is completely different because the goal of this service differs from the illustration of measured information. Figure 15 shows an example of the technical alarms service. In this case, in the top appears the list of alarms generated by the system where the number associated to the alarm, the description, the cause and the date when launched are displayed. Below, the list of set points defined in the system
D4.4: Report on developed BMS system
35
Figure 15: Technical alarms
For the creation of new set-points which raise alarms when a new measurement is coming to the BMS, there is a button that launches a screen like Figure 16. In the configuration of a new set-point, the device, variable and threshold must be chosen. When created, the set-point appears in the list of the technical alarms in order to inform the user about the alarms.
Figure 16: Creation of a new set-point for technica l alarms
With regard to the task management service, it is not fully available at the moment because the ZigBee devices are unable to receive control commands. However, the service is developed as a future line in the ZigBee devices. In spite of the CS7 deployment uses control devices, it is transparently done because the actuation is automatic instead of planned. The main features are:
• Scheduled tasks for sending control commands to the network so as to program automatic control algorithms (for instance, switch on the lights all the days at 13:00).
• Monitoring of the scheduled tasks in the platform.
The service screen is shown in the Figure 17 where the stack panel with the list of devices is printed. In each device, the user could display the programmed tasks or create a new one by clicking on the button. Thus, a pop-up panel is launched like Figure 18 where a description has to be established for
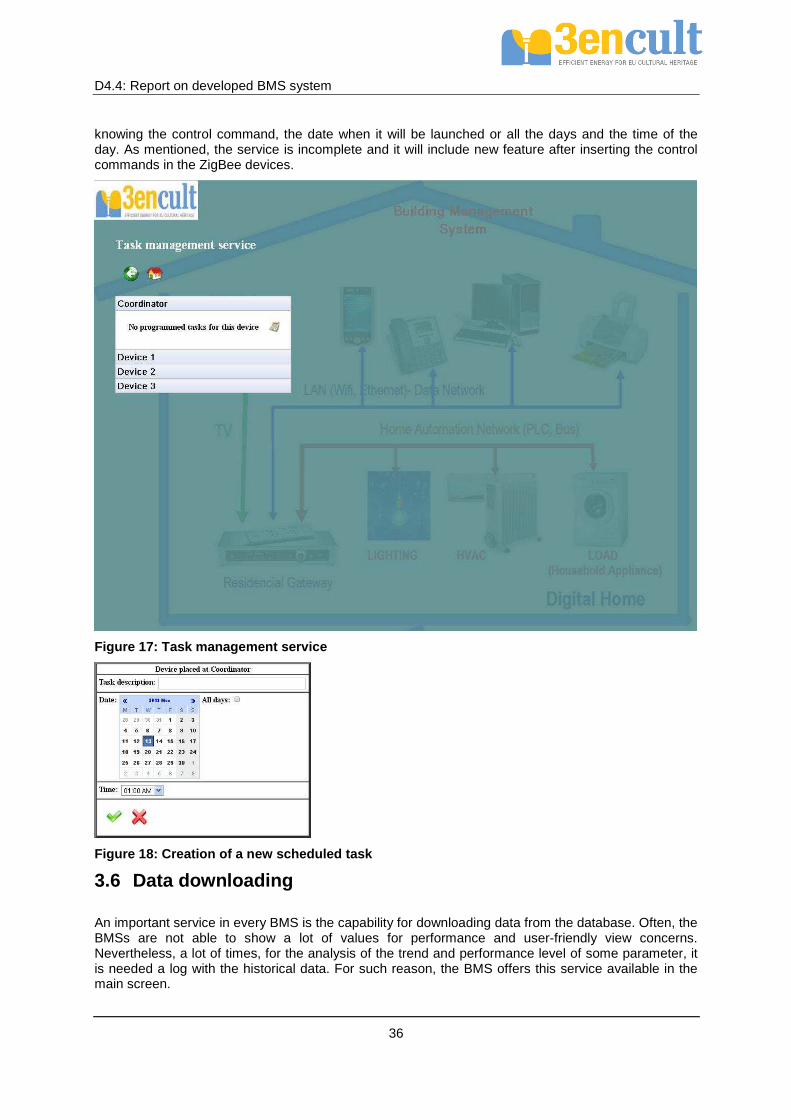
D4.4: Report on developed BMS system
36
knowing the control command, the date when it will be launched or all the days and the time of the day. As mentioned, the service is incomplete and it will include new feature after inserting the control commands in the ZigBee devices.
Figure 17: Task management service
Figure 18: Creation of a new scheduled task
3.6 Data downloading
An important service in every BMS is the capability for downloading data from the database. Often, the BMSs are not able to show a lot of values for performance and user-friendly view concerns. Nevertheless, a lot of times, for the analysis of the trend and performance level of some parameter, it is needed a log with the historical data. For such reason, the BMS offers this service available in the main screen.
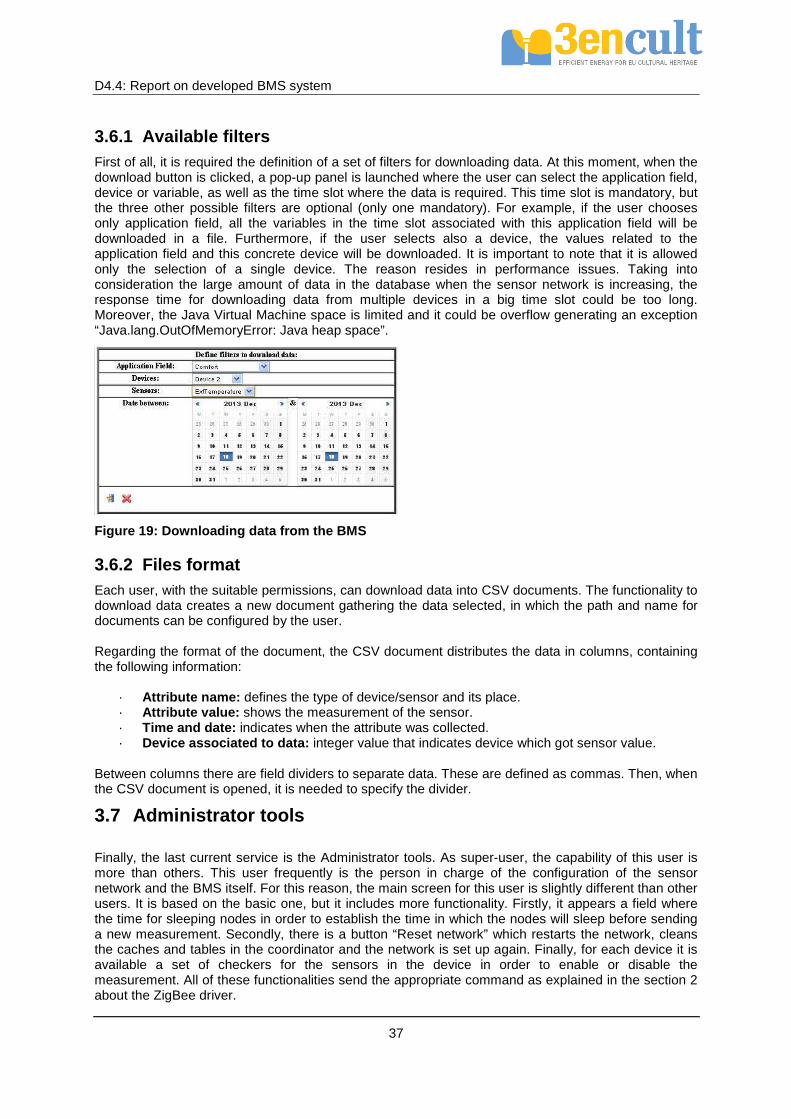
D4.4: Report on developed BMS system
37
3.6.1 Available filters First of all, it is required the definition of a set of filters for downloading data. At this moment, when the download button is clicked, a pop-up panel is launched where the user can select the application field, device or variable, as well as the time slot where the data is required. This time slot is mandatory, but the three other possible filters are optional (only one mandatory). For example, if the user chooses only application field, all the variables in the time slot associated with this application field will be downloaded in a file. Furthermore, if the user selects also a device, the values related to the application field and this concrete device will be downloaded. It is important to note that it is allowed only the selection of a single device. The reason resides in performance issues. Taking into consideration the large amount of data in the database when the sensor network is increasing, the response time for downloading data from multiple devices in a big time slot could be too long. Moreover, the Java Virtual Machine space is limited and it could be overflow generating an exception “Java.lang.OutOfMemoryError: Java heap space”.
Figure 19: Downloading data from the BMS
3.6.2 Files format Each user, with the suitable permissions, can download data into CSV documents. The functionality to download data creates a new document gathering the data selected, in which the path and name for documents can be configured by the user. Regarding the format of the document, the CSV document distributes the data in columns, containing the following information:
· Attribute name: defines the type of device/sensor and its place. · Attribute value: shows the measurement of the sensor. · Time and date: indicates when the attribute was collected. · Device associated to data: integer value that indicates device which got sensor value.
Between columns there are field dividers to separate data. These are defined as commas. Then, when the CSV document is opened, it is needed to specify the divider.
3.7 Administrator tools
Finally, the last current service is the Administrator tools. As super-user, the capability of this user is more than others. This user frequently is the person in charge of the configuration of the sensor network and the BMS itself. For this reason, the main screen for this user is slightly different than other users. It is based on the basic one, but it includes more functionality. Firstly, it appears a field where the time for sleeping nodes in order to establish the time in which the nodes will sleep before sending a new measurement. Secondly, there is a button “Reset network” which restarts the network, cleans the caches and tables in the coordinator and the network is set up again. Finally, for each device it is available a set of checkers for the sensors in the device in order to enable or disable the measurement. All of these functionalities send the appropriate command as explained in the section 2 about the ZigBee driver.
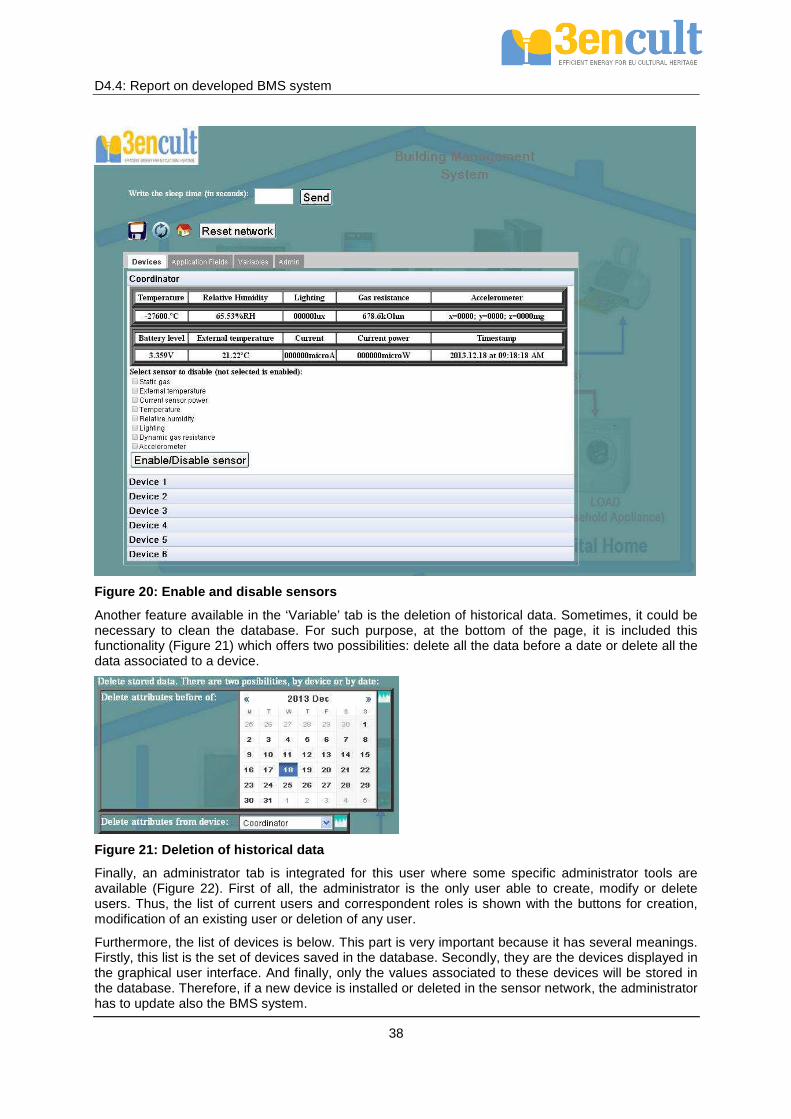
D4.4: Report on developed BMS system
38
Figure 20: Enable and disable sensors
Another feature available in the ‘Variable’ tab is the deletion of historical data. Sometimes, it could be necessary to clean the database. For such purpose, at the bottom of the page, it is included this functionality (Figure 21) which offers two possibilities: delete all the data before a date or delete all the data associated to a device.
Figure 21: Deletion of historical data
Finally, an administrator tab is integrated for this user where some specific administrator tools are available (Figure 22). First of all, the administrator is the only user able to create, modify or delete users. Thus, the list of current users and correspondent roles is shown with the buttons for creation, modification of an existing user or deletion of any user.
Furthermore, the list of devices is below. This part is very important because it has several meanings. Firstly, this list is the set of devices saved in the database. Secondly, they are the devices displayed in the graphical user interface. And finally, only the values associated to these devices will be stored in the database. Therefore, if a new device is installed or deleted in the sensor network, the administrator has to update also the BMS system.
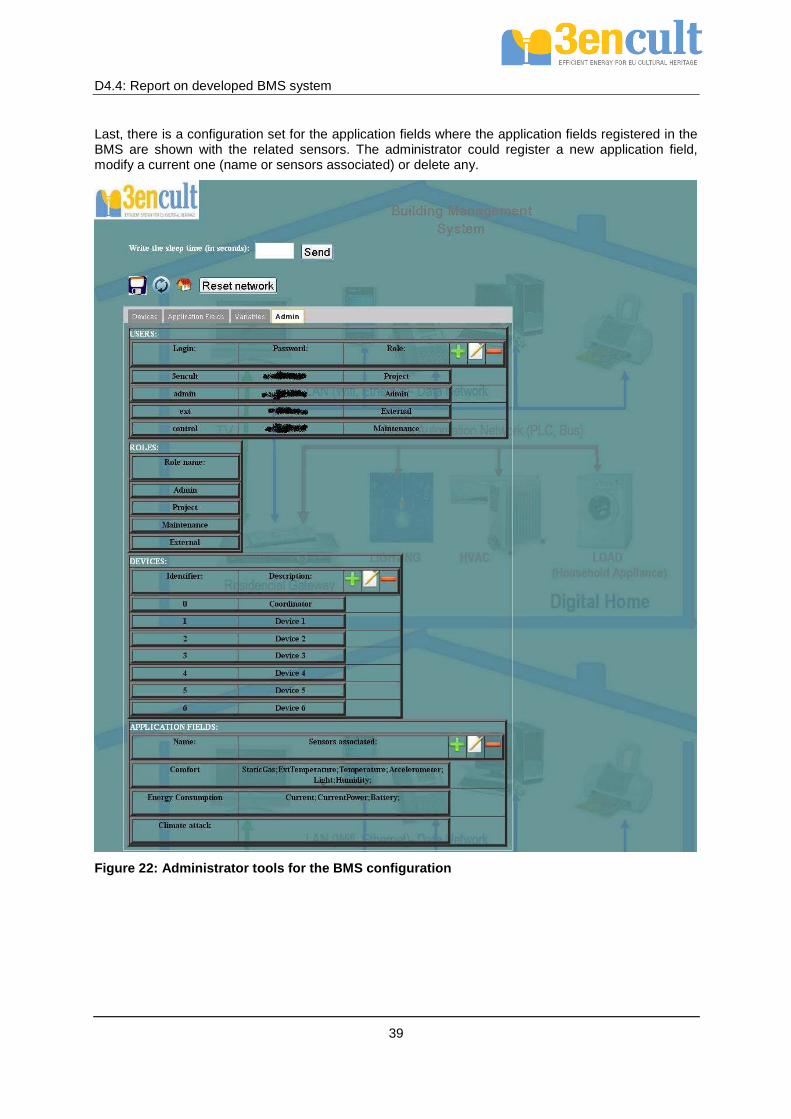
D4.4: Report on developed BMS system
39
Last, there is a configuration set for the application fields where the application fields registered in the BMS are shown with the related sensors. The administrator could register a new application field, modify a current one (name or sensors associated) or delete any.
Figure 22: Administrator tools for the BMS configur ation
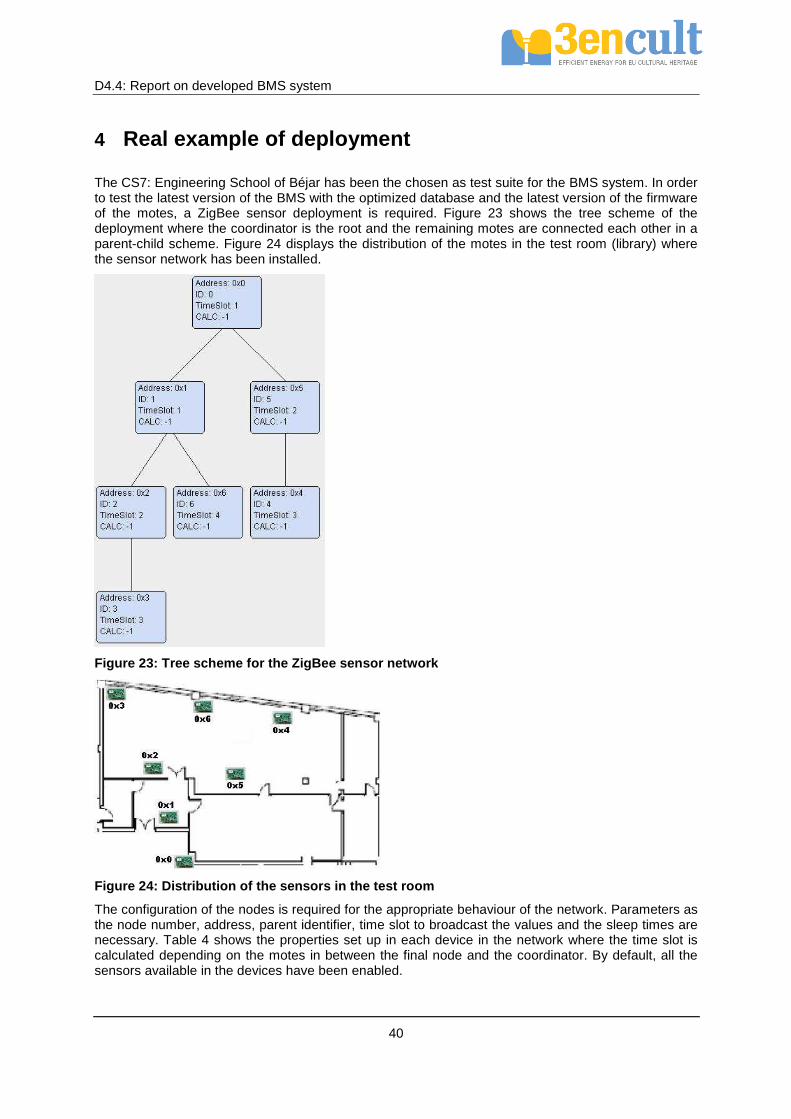
D4.4: Report on developed BMS system
40
4 Real example of deployment
The CS7: Engineering School of Béjar has been the chosen as test suite for the BMS system. In order to test the latest version of the BMS with the optimized database and the latest version of the firmware of the motes, a ZigBee sensor deployment is required. Figure 23 shows the tree scheme of the deployment where the coordinator is the root and the remaining motes are connected each other in a parent-child scheme. Figure 24 displays the distribution of the motes in the test room (library) where the sensor network has been installed.
Figure 23: Tree scheme for the ZigBee sensor networ k
Figure 24: Distribution of the sensors in the test room
The configuration of the nodes is required for the appropriate behaviour of the network. Parameters as the node number, address, parent identifier, time slot to broadcast the values and the sleep times are necessary. Table 4 shows the properties set up in each device in the network where the time slot is calculated depending on the motes in between the final node and the coordinator. By default, all the sensors available in the devices have been enabled.

D4.4: Report on developed BMS system
41
Node identifier Address Parent address Time slot Sleep time (sec)
1 0x0001 0x0000 1 600
2 0x0002 0x0001 2 600
3 0x0003 0x0002 3 600
4 0x0004 0x0005 3 600
5 0x0005 0x0000 2 600
6 0x0006 0x0001 4 600
Table 4: Configuration of the motes in the test sui te
The BMS is deployed since 28th of October 2013 and the behaviour is stable where measurements are collected periodically (each 10 minutes as recommended in [10]). The examples of services in the current document are taken directly from this deployment, being not needed the replication of the screen in this chapter.
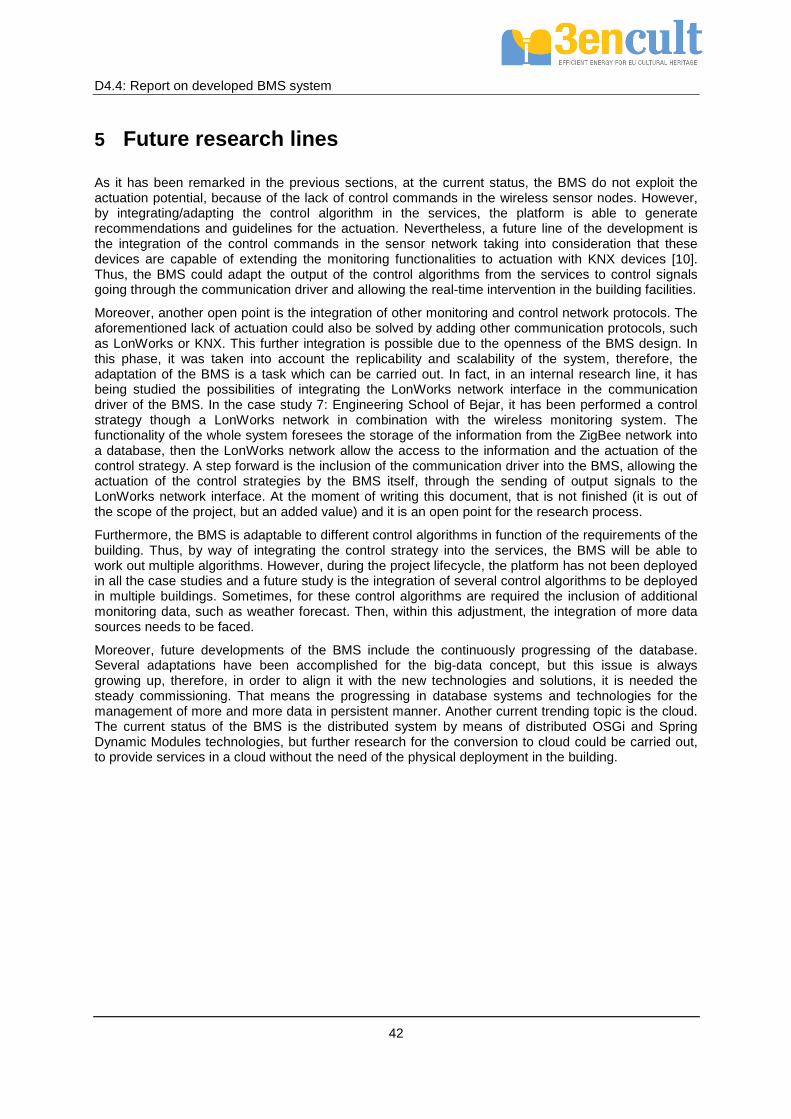
D4.4: Report on developed BMS system
42
5 Future research lines
As it has been remarked in the previous sections, at the current status, the BMS do not exploit the actuation potential, because of the lack of control commands in the wireless sensor nodes. However, by integrating/adapting the control algorithm in the services, the platform is able to generate recommendations and guidelines for the actuation. Nevertheless, a future line of the development is the integration of the control commands in the sensor network taking into consideration that these devices are capable of extending the monitoring functionalities to actuation with KNX devices [10]. Thus, the BMS could adapt the output of the control algorithms from the services to control signals going through the communication driver and allowing the real-time intervention in the building facilities.
Moreover, another open point is the integration of other monitoring and control network protocols. The aforementioned lack of actuation could also be solved by adding other communication protocols, such as LonWorks or KNX. This further integration is possible due to the openness of the BMS design. In this phase, it was taken into account the replicability and scalability of the system, therefore, the adaptation of the BMS is a task which can be carried out. In fact, in an internal research line, it has being studied the possibilities of integrating the LonWorks network interface in the communication driver of the BMS. In the case study 7: Engineering School of Bejar, it has been performed a control strategy though a LonWorks network in combination with the wireless monitoring system. The functionality of the whole system foresees the storage of the information from the ZigBee network into a database, then the LonWorks network allow the access to the information and the actuation of the control strategy. A step forward is the inclusion of the communication driver into the BMS, allowing the actuation of the control strategies by the BMS itself, through the sending of output signals to the LonWorks network interface. At the moment of writing this document, that is not finished (it is out of the scope of the project, but an added value) and it is an open point for the research process.
Furthermore, the BMS is adaptable to different control algorithms in function of the requirements of the building. Thus, by way of integrating the control strategy into the services, the BMS will be able to work out multiple algorithms. However, during the project lifecycle, the platform has not been deployed in all the case studies and a future study is the integration of several control algorithms to be deployed in multiple buildings. Sometimes, for these control algorithms are required the inclusion of additional monitoring data, such as weather forecast. Then, within this adjustment, the integration of more data sources needs to be faced.
Moreover, future developments of the BMS include the continuously progressing of the database. Several adaptations have been accomplished for the big-data concept, but this issue is always growing up, therefore, in order to align it with the new technologies and solutions, it is needed the steady commissioning. That means the progressing in database systems and technologies for the management of more and more data in persistent manner. Another current trending topic is the cloud. The current status of the BMS is the distributed system by means of distributed OSGi and Spring Dynamic Modules technologies, but further research for the conversion to cloud could be carried out, to provide services in a cloud without the need of the physical deployment in the building.
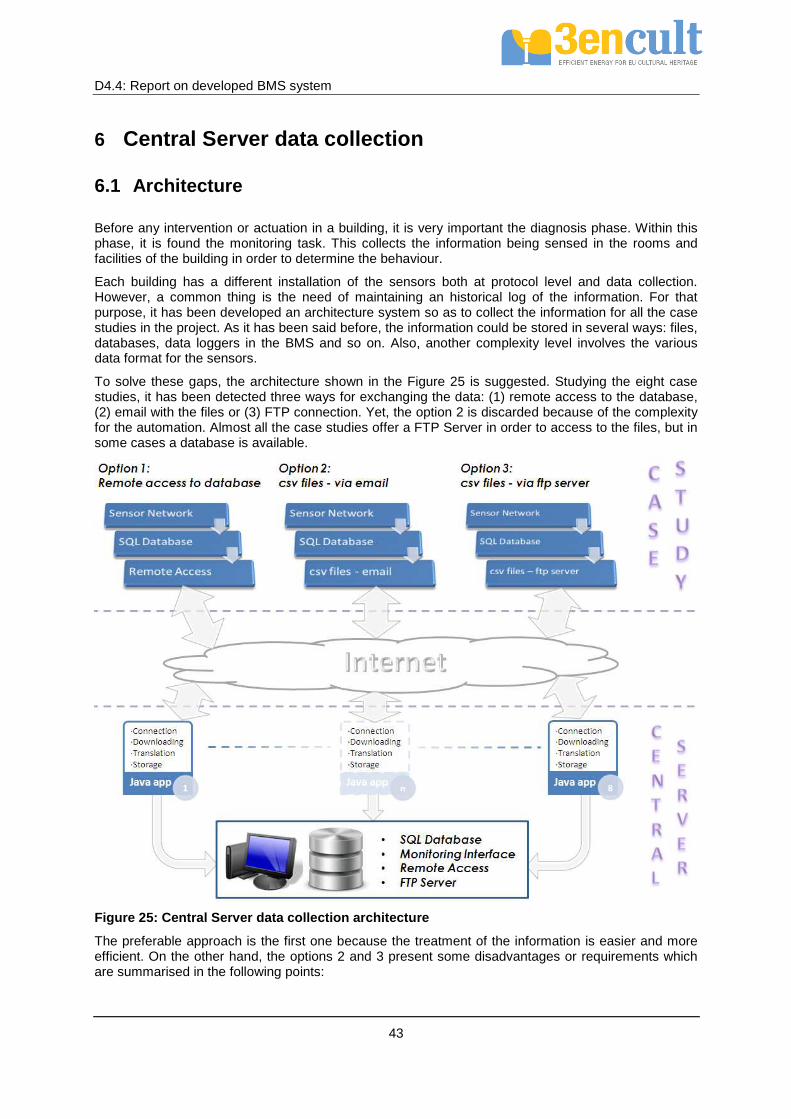
D4.4: Report on developed BMS system
43
6 Central Server data collection
6.1 Architecture
Before any intervention or actuation in a building, it is very important the diagnosis phase. Within this phase, it is found the monitoring task. This collects the information being sensed in the rooms and facilities of the building in order to determine the behaviour.
Each building has a different installation of the sensors both at protocol level and data collection. However, a common thing is the need of maintaining an historical log of the information. For that purpose, it has been developed an architecture system so as to collect the information for all the case studies in the project. As it has been said before, the information could be stored in several ways: files, databases, data loggers in the BMS and so on. Also, another complexity level involves the various data format for the sensors.
To solve these gaps, the architecture shown in the Figure 25 is suggested. Studying the eight case studies, it has been detected three ways for exchanging the data: (1) remote access to the database, (2) email with the files or (3) FTP connection. Yet, the option 2 is discarded because of the complexity for the automation. Almost all the case studies offer a FTP Server in order to access to the files, but in some cases a database is available.
Figure 25: Central Server data collection architect ure
The preferable approach is the first one because the treatment of the information is easier and more efficient. On the other hand, the options 2 and 3 present some disadvantages or requirements which are summarised in the following points:
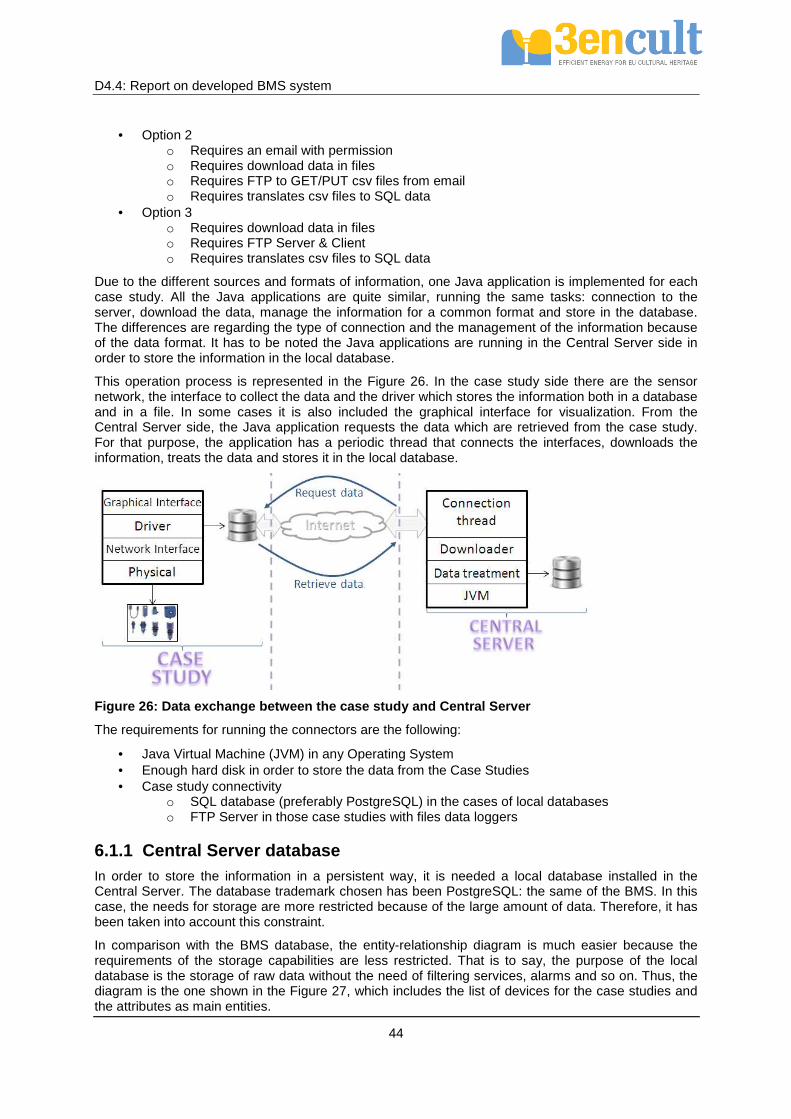
D4.4: Report on developed BMS system
44
• Option 2 o Requires an email with permission o Requires download data in files o Requires FTP to GET/PUT csv files from email o Requires translates csv files to SQL data
• Option 3 o Requires download data in files o Requires FTP Server & Client o Requires translates csv files to SQL data
Due to the different sources and formats of information, one Java application is implemented for each case study. All the Java applications are quite similar, running the same tasks: connection to the server, download the data, manage the information for a common format and store in the database. The differences are regarding the type of connection and the management of the information because of the data format. It has to be noted the Java applications are running in the Central Server side in order to store the information in the local database.
This operation process is represented in the Figure 26. In the case study side there are the sensor network, the interface to collect the data and the driver which stores the information both in a database and in a file. In some cases it is also included the graphical interface for visualization. From the Central Server side, the Java application requests the data which are retrieved from the case study. For that purpose, the application has a periodic thread that connects the interfaces, downloads the information, treats the data and stores it in the local database.
Figure 26: Data exchange between the case study and Central Server
The requirements for running the connectors are the following:
• Java Virtual Machine (JVM) in any Operating System • Enough hard disk in order to store the data from the Case Studies • Case study connectivity
o SQL database (preferably PostgreSQL) in the cases of local databases o FTP Server in those case studies with files data loggers
6.1.1 Central Server database In order to store the information in a persistent way, it is needed a local database installed in the Central Server. The database trademark chosen has been PostgreSQL: the same of the BMS. In this case, the needs for storage are more restricted because of the large amount of data. Therefore, it has been taken into account this constraint.
In comparison with the BMS database, the entity-relationship diagram is much easier because the requirements of the storage capabilities are less restricted. That is to say, the purpose of the local database is the storage of raw data without the need of filtering services, alarms and so on. Thus, the diagram is the one shown in the Figure 27, which includes the list of devices for the case studies and the attributes as main entities.
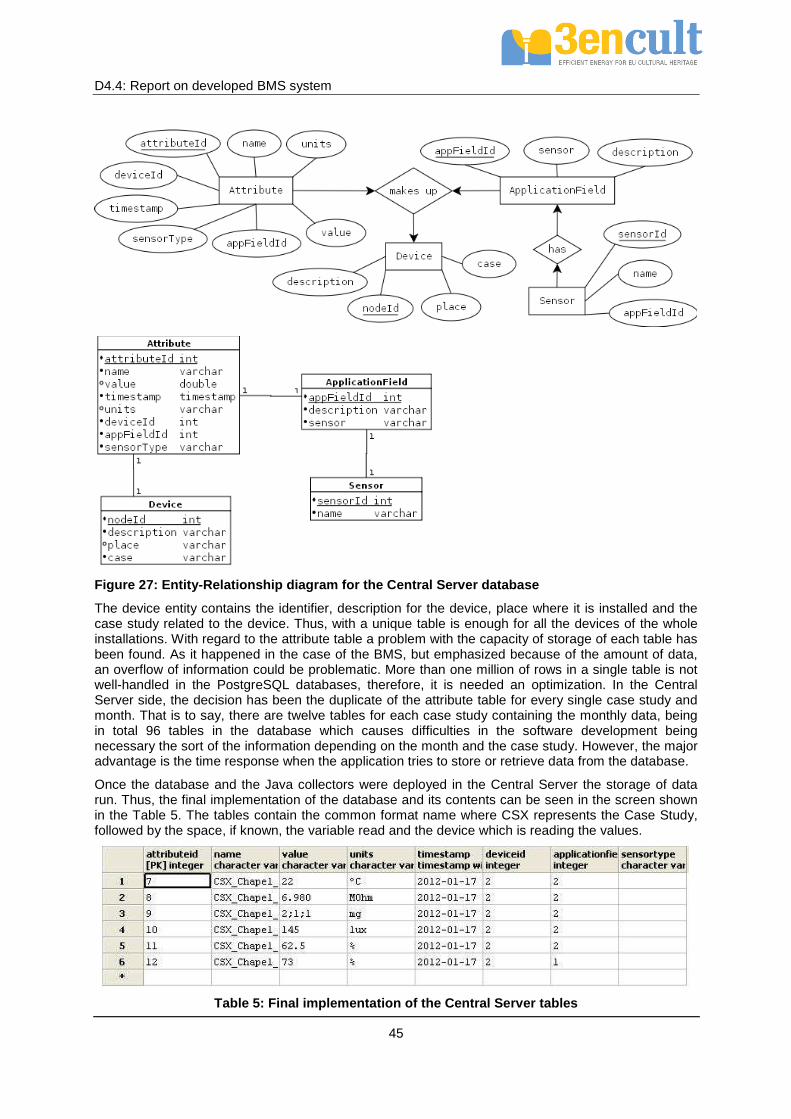
D4.4: Report on developed BMS system
45
Figure 27: Entity-Relationship diagram for the Cent ral Server database
The device entity contains the identifier, description for the device, place where it is installed and the case study related to the device. Thus, with a unique table is enough for all the devices of the whole installations. With regard to the attribute table a problem with the capacity of storage of each table has been found. As it happened in the case of the BMS, but emphasized because of the amount of data, an overflow of information could be problematic. More than one million of rows in a single table is not well-handled in the PostgreSQL databases, therefore, it is needed an optimization. In the Central Server side, the decision has been the duplicate of the attribute table for every single case study and month. That is to say, there are twelve tables for each case study containing the monthly data, being in total 96 tables in the database which causes difficulties in the software development being necessary the sort of the information depending on the month and the case study. However, the major advantage is the time response when the application tries to store or retrieve data from the database.
Once the database and the Java collectors were deployed in the Central Server the storage of data run. Thus, the final implementation of the database and its contents can be seen in the screen shown in the Table 5. The tables contain the common format name where CSX represents the Case Study, followed by the space, if known, the variable read and the device which is reading the values.
Table 5: Final implementation of the Central Server tables

D4.4: Report on developed BMS system
46
6.2 Case Study connectors specification
This chapter gives an overview about the files format for the case studies and a brief explanation regarding the collection of information through the Java application. Before, it is described some general issues about the connectors as a user’s guideline in order to run and perform every single application in the Central Server.
First of all, data translator application can be run into Windows or Linux/Unix operating systems. In first case, the running application are called “Process” whereas in second one “Daemon”. Specifically, it is a periodic application because of it being working when timer goes off. Both of them are the same concept and work with the same objective. That is downloading data from a remote computer which stores data from sensors, translating it into a common pattern and, finally, storing in a central server database. To do this, it is being followed a sequential scheme, as it is shown below. The first step is the creation of the connections between computer where application is running and remote server. Those can be FTP or database connection. Also, it is opened connection with local database so as to store the information. Next, it is downloaded data through database or FTP way. It depends on the manner in which data is stored. In function of the kind of data, translation is made in different way due to FTP needs to read files meanwhile database requires to read a set of columns in a special form because of the various tables. After that, data is set in a common language to be stored in central server database. Last but not least, connections are closed.
Figure 28: Sequence diagram for the retrieval of in formation from case studies
On the other hand, the Java connectors include a properties file for the suitable configuration of the application. First, it can be configured the timer for the periodic reading of data and it depends on the data logger in every case study. It means, for example, if the data logger stores data every day it does not make sense to run the collector every 12 hours, but more than one day. On the other hand, there is a property for the type of connection: FTP, DDBB or LOCAL. FTP means the connection through the FTP Server. With DDBB, it is established the communication with a database in the case study. Finally, LOCAL is a special FTP because the aim is read and copy local files in the computer. It is specific for the Case Study 1.
#Time value in millis for scheduled task general.timer=7200000 #Type of connection --> Possible values: FTP, DDBB or LOCAL general.connection=FTP
Afterwards, there are two databases to be configured. If the connection is DDBB, the two set of properties must be completed, but in the two remaining cases (FTP or LOCAL), the only set is about the local database (Central Server database). The information to be provided includes the address, name, port and user.
#Data for destination data general.subsistema2=localDDBB

D4.4: Report on developed BMS system
47
localDDBB.name=dbname localDDBB.IPAddress=ipaddress localDDBB.port=5432 localDDBB.user=user localDDBB.password=password localDDBB.type=postgresql #Properties for source data general.subsistema1=remoteDDBB remoteDDBB.name=ddbbname remoteDDBB.IPAddress=ipaddress remoteDDBB.port=5432 remoteDDBB.user=user remoteDDBB.password=password remoteDDBB.type=postgresql
If the connection is through FTP Server, the related properties have to be determined. That is to say, IP address, port, user, remote data path where the application will find the data log files, local data path where the application will copy the files in the local computer and the file type of the data logs (dat, txt, csv and so on).
#Remote datapath where files can be found ftp.remoteDataPath=/ #Local datapath where files are stored ftp.localDataPath=localDataPath ftp.IPAddress=ipaddress ftp.hostName=3encult ftp.port=21 ftp.user=user ftp.password=pass ftp.filetype=dat
Finally, the LOCAL way is a special one from the FTP. In such case, the only parameters are the data paths where the files are placed, where the files will be copied and the file type.
Finally, so that the connector runs it is needed the installation of the Java Virtual Machine. It has to be assured any Java version is installed in the computer. Once, it is ensured, with the command java –jar file_name.jar in a Windows terminal, in the same folder of the jar file, it is run the collector. In the new version it can be performed automatically through .bar files which start up when Windows is launched.
6.2.1 CS1: Public Waaghaus – Bolzano The Case Study 1 is a special case for the FTP connection because in the same computer it is stored the data logs for the sensor network. Then, it is not efficient to do a FTP connection with the same machine. To solve this performance issue the LOCAL manner has been deployed. In this case, the application copies the file from the source folder to a secondary temporal one.
These files have to be translated so that the information could be stored in the database. For that purpose, it is needed the format of these files. An example is shown in the Table 6 where a device is printed.
Measuring group TH AB01 416
Channel A1 A2 A3 A4
Device 0_0 0_1 0_2 0_3
Kind of sensor
ST ST ST
Sensor number
12 33 11
Sensor
2nd basement - room 1st basement - room 5 - 1st basement - room 5 -

D4.4: Report on developed BMS system
48
position 1 -Surface Temperature - north
Surface Temperature - south
Surface Temperature - west
Value number 0 1 2 3
01-02-2012 /00:01:16 -48.64 8.84 8.37 -76.45 9.42 75.42
Table 6: Case Study 1 information format example
Every device offers 12 channels where the information is read. However some channels are unused and this information has to be discarded in order not to overflow the database with inappropriate data. Next, the kind of sensor is specified: ST (Surface Temperature); AT (Air Temperature) and AH (Air Humidity) mainly. Also, the sensor number and the position are described jointly the data-point index. Thus, in the bottom of the Table 6, it is an example of the data stream following the file format.
6.2.2 CS2: Palazzo d’Accurso – Bologna In the case study 2 the communication is done through a FTP Server but it is not directly to the computer sited on the Palazzo d’Accurso. The CS2 arranges a MySQL database but it does not allow external connection, therefore, it is discarded. On the other hand, due to problems with the configuration of FTP Server in the case study, it has been enabled a folder in the computer for the CS7 where the files are put. Thus, the process for this case study is:
1. Backup of the information in the MySQL database in SQL format. 2. Renaming the file in txt format. 3. Copy weather files in the same folder than monitoring data. 4. Zip the files. 5. Send to the FTP Server in the CS7.
The scheme is the followed in the Figure 29.
Figure 29: Case study 2 data treatment
Once the files are in the server side at Case Study 7, the Java collector connects via FTP to the server to download the files in the Central Server computer. After that, the process is the same: read files, translate information and store data. As it happened in the previous case study, it is necessary the format of data for the files. In this case, there are two kinds of files. The first one is the monitoring information and the second is the Weather Station data.
The Table 7 shows the data format for the monitoring system in the CS2. There is a field for the number of the node in order to identify the sensor reading the variables. Also, there are several fields for the temperatures and relative humidity. These values are measured through a voltage in the inputs and these are not the final one. That is to say, it is needed a conversion for obtaining the temperature or relative humidity. The formulas are also described in the table and they are the major complexity in

D4.4: Report on developed BMS system
49
this connector because of the dependency between value and conversion. Thus, the Java application implements these equations in order to store the suitable value for each field in the data log file of the monitoring system in the CS2.
Table 7: Monitoring data format in the Case Study 2
On the other hand, the second file is related to the Weather Station in the CS2 and its format is shown in the Table 8. The yellow fields are the only available readings. Therefore, the application has to filter the unused variables and it should only store the suitable ones.
Column Item Format Comments
1 record number integer starts at 1 2 transfer date yyyy-mm-dd
hh:mm:ss date and time (according to computer, not weather station) of transfer from station to file
3 reading date yyyy-mm-dd hh:mm:ss
date and time of record. Appears to be derived from computer's clock at time of transfer
4 reading interval integer minutes since previous reading 5 indoor humidity integer relative humidity percent 6 indoor temperature floating point degrees centigrade 7 outdoor humidity integer relative humidity percent 8 outdoor temperature floating point degrees centigrade 9 dew point floating point degrees centigrade. See comments below
10 wind chill floating point degrees centigrade. See comments below 11 absolute pressure floating point millibars 12 relative pressure floating point millibars 13 wind average floating point metres / second 14 wind average integer Beaufort 15 wind gust floating point metres / second 16 wind gust integer Beaufort 17 wind direction integer 0 to 15. 0 is north, 1 is NNE, 8 is south, 15 is
NNW 18 wind direction text ENE appears as NEE, ESE appears as SEE 19 rain 'ticks' integer cumulative count of number of times rain
gauge has tipped. Resets to zero if station's batteries removed
20 rain total floating point mm rain total. Column 19 * 0.3, but does not reset to zero, stays fixed until ticks catch up
21 rain since last reading floating point mm

D4.4: Report on developed BMS system
50
22 rain in last hour floating point mm 23 rain in last 24 hours floating point mm 24 rain in last 7 days floating point mm 25 rain in last 30 days floating point mm 26 rain total or in last year? floating point mm. 27 status bit 0 integer 0 or 1 28 status bit 1 integer 0 or 1 29 status bit 2 integer 0 or 1 30 status bit 3 integer 0 or 1 31 status bit 4 integer 0 or 1 32 status bit 5 integer 0 or 1 33 status bit 6 - outdoor
readings invalid integer 0 or 1
34 status bit 7 integer 0 or 1 35 data address 6-digit
hexadecimal pointer to where in weather station's memory data came from. Range is 000100 to 00FFF0. After reaching 00FFF0, returns to 000100 - i.e. a circular or ring buffer.
36 raw data 16 2-digit hexadecimals
the raw data as it came from the weather station
1, 2012-04-23 10:54:13, 2012-04-09 07:01:08, 5, 40, 21.6, ---, ---, ---, ---, 988.4, 1001.1, ---, ---, ---, ---, ---, ---, 291, 87.3, 0.0, 0.0, 0.0, 0.0, 0.0, 0.0, 0, 0, 0, 0, 0, 0, 1, 0, 000160, 05 28 D8 00 FF FF FF 9C 26 FF FF FF 86 23 01 40
Table 8: Weather Station data format in the Case St udy 2
6.2.3 CS3: Palazzina della Viola – Bologna The CS3 is the used to deploy the ZigBee sensors developed in the task 4.3 [10]. The values of the ZigBee sensors are stored in a log file. These are monthly files and there is a FTP Server where the files are accessible. Thus, the data collector connects to the FTP, downloads the file and translates it. The format of the file is exactly the same of the BMS readings because the ZigBee sensors are the same (see ZigBee driver section).
6.2.4 CS5: Siegmair School – Innsbruck Here, the CS5 have to be distinguished between before and after refurbishment because the sensor network and, therefore, the files are not the same.
6.2.4.1 Before refurbishment
In the first step of the project, the monitoring system for the CS5 was deployed for the diagnosis of the status of the building. The problem in this network is the lack of Internet connection. Therefore, the application is not able to connect in order to download data logs. However, this information is shared in the FTP Server on the CS7 in order to enable the reading of values from the Central Server. Thus, all the files (notice the first monitoring phase is finished) are in the server. But, the complexity of the application is the diversity of log files, although all of them txt files. These txt files are named in the way, the application is able to know the sensor, place and the kind of measurements when naming the variables.
First of all, for the measurements of the daylight and artificial light of the classrooms, a matrix is drawn in the log file, as it is printed in the Table 9. In the first row and column, it is detailed the coordinate in where the data-point is measured.

D4.4: Report on developed BMS system
51
0.00 0.92 1.84
0.00 109 170 245
0.91 142 198 266
Table 9: Light measurements in the classrooms for t he case study 5
For the measurement of the status of the entrance or windows side and lights, the format is quite similar. The sensor offers several lines where the information is read. An example is in the Table 10 where the difficulties are related to filter the line which contains the measurement of the variables.
Number Date Time Line1 Line2 Line3
310 16.03.2011 08:36:40 - - 1
Table 10: Status measurements in the classrooms for the case study 5
For the remaining values such as thermal comfort and external measurements of temperature and relative humidity the format is the same than the status. That is to say, all the files show a header where the value measured can be found out. Mapping these headers and the readings, the application is able to store the suitable value, units and sensor related.
6.2.4.2 After refurbishment
In the case after refurbishment the monitoring system has been modified. During this second monitoring phase, the files format is .dat where the values are separated by spaces. Nevertheless, that is not a standard; therefore, a treatment before storing the data is needed. In this case, the spaces have been replaced by semicolon. Afterwards, it is necessary to know the meaning of every field. Table 11 summarises the meaning of the data stream for the first 12 data-points (up to 88), being a similar system than the CS8 one. It is displayed the device (measuring group), the channels of the device, the device connected to the channel, the position of the sensor and the data-point number.
Measuring group
Channel Device Kind of sensor
Sensor position Value number
R2a AB01 329 A1 0_0 ST Classroom 011 comfort level 0
A2 0_1 ST Classroom 012 comfort level 1
A3 0_2 ST Classroom 111 comfort level 2
A4 0_3 ST Classroom 214 comfort level 3
A5 1_0 AT Classroom 011 comfort level 4
A6 1_1 AH Classroom 011 comfort level 5
A7 1_2 AT Classroom 012 comfort level 6
A8 1_3 AH Classroom 012 comfort level 7
A9 2_0 AT Classroom 111 comfort level 8
A10 2_1 AH Classroom 111 comfort level 9
A11 2_2 ST Classroom 209 comfort level 10
A12 2_3 ST Classroom 209 comfort level 11
Table 11: CS5 after refurbishment data example
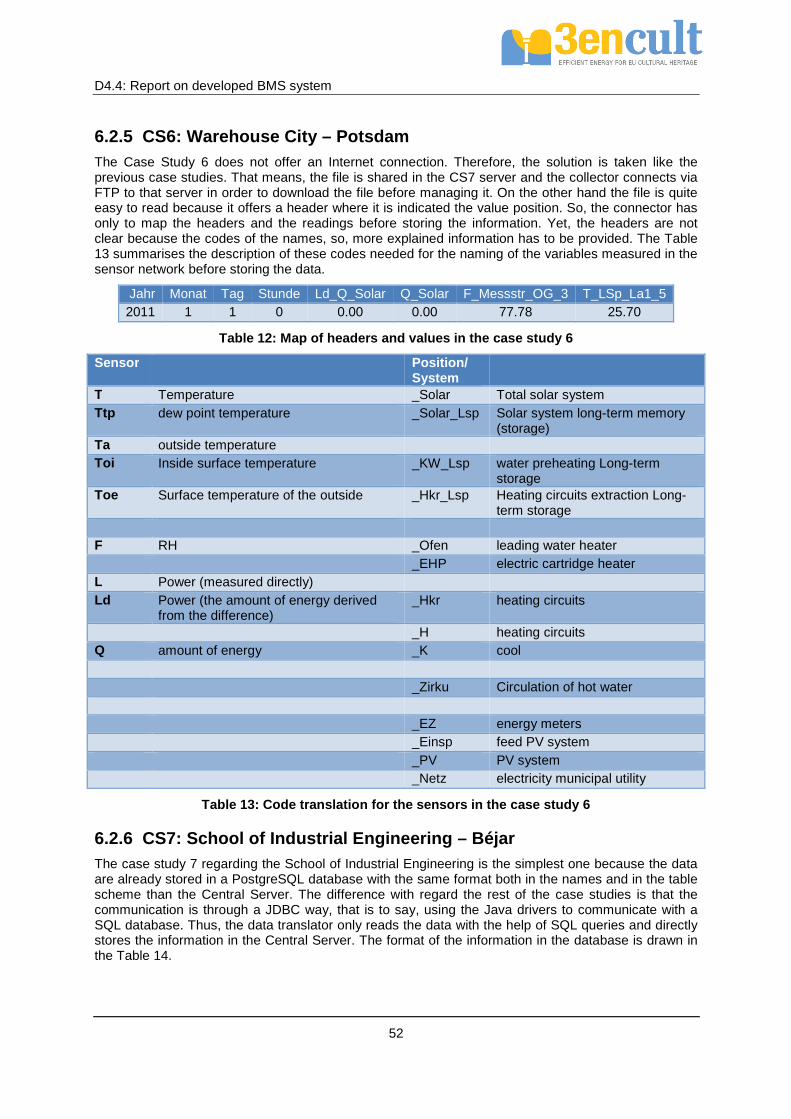
D4.4: Report on developed BMS system
52
6.2.5 CS6: Warehouse City – Potsdam The Case Study 6 does not offer an Internet connection. Therefore, the solution is taken like the previous case studies. That means, the file is shared in the CS7 server and the collector connects via FTP to that server in order to download the file before managing it. On the other hand the file is quite easy to read because it offers a header where it is indicated the value position. So, the connector has only to map the headers and the readings before storing the information. Yet, the headers are not clear because the codes of the names, so, more explained information has to be provided. The Table 13 summarises the description of these codes needed for the naming of the variables measured in the sensor network before storing the data.
Jahr Monat Tag Stunde Ld_Q_Solar Q_Solar F_Messstr_OG_3 T_LSp_La1_5 2011 1 1 0 0.00 0.00 77.78 25.70
Table 12: Map of headers and values in the case stu dy 6
Sensor Position/ System
T Temperature _Solar Total solar system Ttp dew point temperature _Solar_Lsp Solar system long-term memory
(storage) Ta outside temperature Toi Inside surface temperature _KW_Lsp water preheating Long-term
storage Toe Surface temperature of the outside _Hkr_Lsp Heating circuits extraction Long-
term storage F RH _Ofen leading water heater _EHP electric cartridge heater L Power (measured directly) Ld Power (the amount of energy derived
from the difference) _Hkr heating circuits
_H heating circuits Q amount of energy _K cool _Zirku Circulation of hot water _EZ energy meters _Einsp feed PV system _PV PV system _Netz electricity municipal utility
Table 13: Code translation for the sensors in the c ase study 6
6.2.6 CS7: School of Industrial Engineering – Béjar The case study 7 regarding the School of Industrial Engineering is the simplest one because the data are already stored in a PostgreSQL database with the same format both in the names and in the table scheme than the Central Server. The difference with regard the rest of the case studies is that the communication is through a JDBC way, that is to say, using the Java drivers to communicate with a SQL database. Thus, the data translator only reads the data with the help of SQL queries and directly stores the information in the Central Server. The format of the information in the database is drawn in the Table 14.
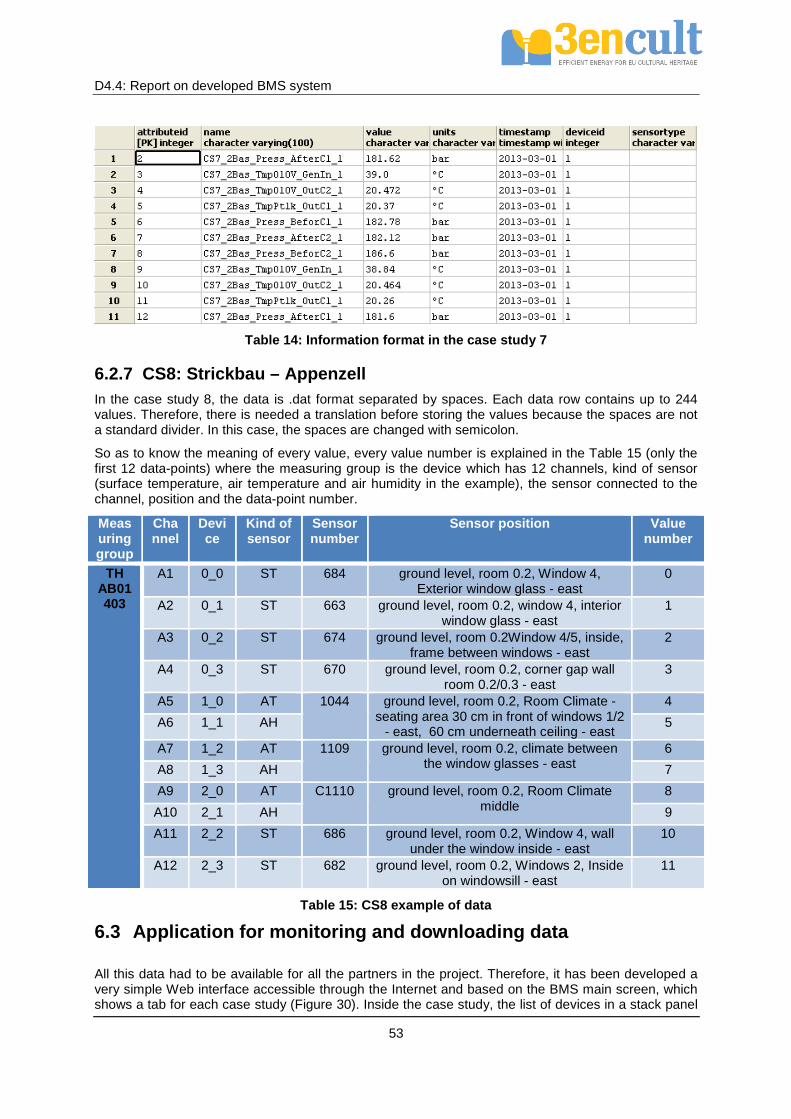
D4.4: Report on developed BMS system
53
Table 14: Information format in the case study 7
6.2.7 CS8: Strickbau – Appenzell In the case study 8, the data is .dat format separated by spaces. Each data row contains up to 244 values. Therefore, there is needed a translation before storing the values because the spaces are not a standard divider. In this case, the spaces are changed with semicolon.
So as to know the meaning of every value, every value number is explained in the Table 15 (only the first 12 data-points) where the measuring group is the device which has 12 channels, kind of sensor (surface temperature, air temperature and air humidity in the example), the sensor connected to the channel, position and the data-point number.
Measuring group
Channel
Device
Kind of sensor
Sensor number
Sensor position Value number
TH AB01 403
A1 0_0 ST 684 ground level, room 0.2, Window 4, Exterior window glass - east
0
A2 0_1 ST 663 ground level, room 0.2, window 4, interior window glass - east
1
A3 0_2 ST 674 ground level, room 0.2Window 4/5, inside, frame between windows - east
2
A4 0_3 ST 670 ground level, room 0.2, corner gap wall room 0.2/0.3 - east
3
A5 1_0 AT 1044 ground level, room 0.2, Room Climate - seating area 30 cm in front of windows 1/2
- east, 60 cm underneath ceiling - east
4
A6 1_1 AH 5
A7 1_2 AT 1109 ground level, room 0.2, climate between the window glasses - east
6
A8 1_3 AH 7
A9 2_0 AT C1110 ground level, room 0.2, Room Climate middle
8
A10 2_1 AH 9
A11 2_2 ST 686 ground level, room 0.2, Window 4, wall under the window inside - east
10
A12 2_3 ST 682 ground level, room 0.2, Windows 2, Inside on windowsill - east
11
Table 15: CS8 example of data
6.3 Application for monitoring and downloading data
All this data had to be available for all the partners in the project. Therefore, it has been developed a very simple Web interface accessible through the Internet and based on the BMS main screen, which shows a tab for each case study (Figure 30). Inside the case study, the list of devices in a stack panel

D4.4: Report on developed BMS system
54
is drawn and the latest values associated with the device in the current month are printed. The only exception is the CS7 because there is already a Web application accessible where both before and after refurbishment data is available. In this case, the URL for accessing the Web interface is detailed (Figure 31).
Figure 30: Monitoring interface for the Central Ser ver
Figure 31: CS7 tab in the Central Server Web interf ace

D4.4: Report on developed BMS system
55
7 References
[1] Dr. Abdulmohsen Al-Hammad, “Building Management System (BMS)“, College of environmental design, http://faculty.kfupm.edu.sa/ARE/amhammad/ARE-457-course-web/Building-Management-System.pdf, last visited on 29th of April 2013.
[2] Cser, J.; Beheshti, R.; van der Veer, P., "Towards the development of an Integrated Building Management System," Innovation in Technology Management - The Key to Global Leadership. PICMET '97: Portland International Conference on Management and Technology , vol., no., pp.740, 27-31 Jul 1997.
[3] I. Jacobson, The Unified Software Development Process, ser. Object technology series. Pearson Education, 1999.
[4] B. Bruegge and A. H. Dutoit, Object-Oriented Software Engineering Using U ML, Patterns, and Java, 3rd ed. Upper Saddle River, NJ, USA: Prentice Hall Press, 2009.
[5] Velte, Anthony T. (2010). Cloud Computing: A Practical Approach. McGraw Hill, ISBN 978-0-07-162694-1.
[6] Java. Learn About Java Technolog, http://www.java.com/en/about/, Java Web Site, last visiteded 29th of April 2013.
[7] T. Lindholm, F. Yellin, G. Bracha, A. Buckley, “The Java® Virtual Machine Specification”, Java SE7 Edition, 2013/02/28, http://docs.oracle.com/javase/specs/jvms/se7/html/, last visited 29th of April 2013.
[8] OSGi. (2013) OSGi Alliance. http://www.osgi.org, OSGi framework Web Site, last visited 29th of April.
[9] Spring Dynamic Modules 2009, http://www.springsource.org/osgi, Spring Dynamic Modules Web Site, last visited 29th of April 2013.
[10] 3ENCULT, “WP4_D4.3_20140330_P13_Wireless Sensor Network Nodes”, March 2014.
[11] Google Web Toolkit, https://developers.google.com/web-toolkit/, GWT Web Site, last visited 29th of April 2013.
[12] PostgreSQL Global Development Group, http://www.postgresql.org/, PostgreSQL Web Site, last visited 29th of April 2013.
[13] Oracle database, http://www.oracle.com/us/products/database/overview/index.html, Oracle Web Site, last visited 29th of April 2013.
[14] SQL:2008 now an approved ISO international standard, Sybase, 2008-7, http://iablog.sybase.com/paulley/2008/07/sql2008-now-an-approved-iso-international-standard/, last visited 29th of April.
[15] ISO/IEC 9075-11:2008: Information and Definition Schemas (SQL/Schemata), 2008, p.1.
[16] Hibernate, http://www.hibernate.org/, Hibernate – Jboss Community Web Site, last visited 29th of April 2013.
[17] Equinox OSGi, http://www.eclipse.org/equinox/, Equinox Eclipse OSGi Web Site, last visited 29th of April 2013.
[18] Apache Felix, http://felix.apache.org/, Apache Felix Web Site, last visited 29th of April.
[19] 3ENCULT, “WP4_D4.2_20140330_P23_Guideline for the implementation of monitoring system”, March 2014.
[20] 3ENCULT, “WP4_D4.5_20140330_P23_ Report on Monitoring & Automation concept”, March 2014.
[21] M Bell, “SOA Modeling Patterns for Service Oriented Discovery and Analysis”, Wiley, January 2010, ISBN: 978-0-470-48197-4.

D4.4: Report on developed BMS system
56
[22] World Wide Web Consortium, “Web Services Choreography Interface (WSCI) 1.0 Specification”, http://www.w3.org/, last visited 29th of April 2013.
[23] OSGi Alliance, “About the OSGi Service Platform” Technical Whitepaper, Revision 4.1 7, June 2007, http://www.osgi.org/wiki/uploads/Links/OSGiTechnicalWhitePaper.pdf.
[24] Java Simple Serial Connector, https://code.google.com/p/java-simple-serial-connector/, Google code Web site, last visited September 2013.