wp2 - modelling risks of renewable energy … - modelling risks of...the report “modelling risks...
TRANSCRIPT

Report of the project
Deriving Optimal Promotion Strategies for Increasing the Share of RES-E in a Dynamic European Electricity Market
Green-X
MODELLING RISKS OF RENEWABLE ENERGY INVESTMENTS
Work Package 2
within the 5th framework programme of the European Commission
supported by DG Research
Contract No: ENG2-CT-2002-00607
Hans Cleijne, Walter Ruijgrok – KEMA (The Netherlands)
FINAL VERSION
JULY 2004

This Energie publication is one of a series highlighting the potential for innovative non-nuclear energy technologies to become widely applied and contribute superior services to the citizen. European Commission strategies aim at influencing the scientific and engineering communities, policy-makers and key market players to create, encourage, acquire and apply cleaner, more efficient and more sustainable energy solutions for their own benefit and that of our wider society.
Funded under the European Union’s fifth framework programme for research, technological development and demonstration (RTD), Energie’s range of support covers research, development, demonstration, dissemination, replication and market uptake — the full process of converting new ideas into practical solutions to real needs. Its publications, in print and electronic form, disseminate the results of actions carried out under this and previous framework programmes, including former JOULE-Thermie actions. Jointly managed by the European Commission’s Directorates-General for Energy and Transport and for Research, Energie has a total budget of EUR 1 042 million over the period 1998-2002.
Delivery is organised principally around two key actions, ‘Cleaner energy systems, including renewable energies’ and ‘Economic and efficient energy for a competitive Europe’, within the theme ‘Energy, environment and sustainable development’, supplemented by coordination and cooperative activities of a sectoral and cross-sectoral nature. With targets guided by the Kyoto Protocol and associated policies, Energie’s integrated activities are focused on new solutions which yield direct economic and environmental benefits to the energy user, and strengthen European competitive advantage by helping to achieve a position of leadership in the energy technologies of tomorrow. The resulting balanced improvements in energy, environmental and economic performance will help to ensure a sustainable future for Europe’s citizens.
ENERGIE
with the support of the EUROPEAN COMMISSION
Directorate-General for Research
LEGAL NOTICE
Neither the European Commission, nor any person acting on behalf of the Commission,
is responsible for the use which might be made of the information contained in this publication. The views expressed in this publication have not been adopted or in any way approved by the Commission and should not be relied upon as a statement of the
Commission’s views.
© European Communities, 2004 Reproduction is authorised provided the source is acknowledged.
Printed in Austria
Elaborated by KEMA (The Netherlands).
List of Authors:
Hans Cleijne Walter Ruijgrok

The Green-X project:
Research project within the 5th framework programme of the European Commission, DG Research
Duration: October 2002 – September 2004
Co-ordination: Reinhard Haas, Energy Economics Group (EEG), Institute of Power Systems and Energy Economics, Vienna University of Technology.
Project partners: - EEG - Energy Economics Group, Institute of Power Systems and Energy Economics, Vienna University of Technology, Austria;
- IT Power, United Kingdom;
- KEMA - KEMA Nederland B.V., The Netherlands
- RISOE - Risoe National Laboratory, Denmark
- CSIC - The Spanish Council for Scientific Research (Institute of Economy and Geography), Spain
- FhG-ISI - Fraunhofer Institute for Systems and Innovation Research, Germany
- WIENSTROM GmbH, Austria
- EGL - Elektrizitäts-Gesellschaft Laufenburg AG, Switzerland
- EREC - European Renewable Energy Council, Belgium
Contact/Information: web-site: http://www.green-x.at or directly by contacting one of the project partners
Imprint:
The report “Modelling risks of renewable energy investments (D6 Report)” has been carried out by KEMA (Hans Cleijne, Walter Ruijgrok). Its completion was achieved in July 2004.

– 2 –

– 3 –
CONTENTS
Summary 6
1 Introduction 10
2 Dealing with uncertainties 12
2.1 Risk and upward potential 12
2.2 Sources of risk in renewable energy investments 13
2.3 Relevance of risks for investors in renewable energy projects 15
2.4 Relevance of risks in buying green energy 18
3 Modelling and measuring risks 19
3.1 Quantifying risk through scenarios 20
3.2 Quantifying value at risk 24
3.3 Quantifying required green price 26
3.4 Examples 28
4 Measures to deal with risks 38
4.1 Why risks influence cost 38
4.2 Project developer perspective 38
4.3 Banker’s perspective 40
4.4 Independent ratings 42
4.5 Risk management 46
5 Stake holder’s perception of risk and renewable energy 48
5.1 Introduction 48
5.2 Results of survey 48
5.3 Interviews 54
6 The role of risk in financing renewable energy projects 60
6.1 Introduction 60

– 4 –
6.2 The relation between support mechanism and project risk 60
6.3 Project finance through commercial bank debt 62
6.4 Return on Equity 65
6.5 Weighted average cost of capital 70

– 5 –
– 6 –
Summary
Background and aim The project Green-X, which is sponsored by the European Commission, aims at developing a model which can describe the dynamics of the implementation of renewable energy in Europe. An important element of the dynamics concerns the behaviour and decision making by stakeholders on investments in these renewable energy technologies. A major driving force in this decision making process by stakeholders is related to the risks which stakeholders perceive in the market. The aim of this report is to describe methods to describe and quantify the risks of investments in renewable energy technology. These methods and their results for various business cases will be used later as input for the model Green-X so this model is able to take investor behaviour and risk awareness into account.
What is risk? Risk in relation to investments in renewable energy projects can be described by the negative impact which uncertain future events may have on the financial value of a project or investment. Risks form the counterpart of the upward potential: the increase in value due to future events. Although both risk and upward potential are related to uncertainty of future events, risks usually play a more dominant role in investment decisions since investors are risk averse in most cases. When it comes to investment risks for renewable energy projects, three categories seem to play the most dominant role:
• regulatory risks which can be found in project development or are related to possible changes in the financial support for renewable energy due to changing government policies
• market and operational risks which are related to for instance increasing costs for operation or feedstock, such as biomass
• technological risks which follow from malfunctioning of the technology used and potentially can be large for some renewable energy technologies since these have entered only recently on the market.

– 7 –
How to quantify risks? As risks are closely related to the financial value of an investment, risks can best be quantified in financial terms and how they affect the value of a project. The net present value (NPV) is the most commonly used measure of the financial value of a project. To quantify risks we describe three methods in this report:
• scenario analyses
• value-at-risk or profit-at-risk assessments
• required green price calculations
Table S.1 shows some advantages and disadvantages of these methods.
Table S.1 Overview of advantages and disadvantages of various approaches to estimate risks
advantages disadvantages
scenario analysis • simple method
• easy to understand
• may overestimate risk
• no information on probability of risk
Value-at-Risk (or profit-at-risk)
• both risk and its probability is measured
• can calculate probability of loss/inadequate financial returns
• complex
• requires information on distribution of uncertain input
required green price
• allows calculation of risk premiums
• use is limited to some situations only
Stake holder perception The policy instruments which EU member states have currently put in place, aim at promoting investments in renewable energy sources by removing barriers and reducing risks. We have approached a group of more than 650 stakeholders who are involved in RES investments to obtain their views on the
– 8 –
risks and barriers for investments. The group we approached consisted of representatives in the electric power industry, renewable energy project developers and investors, manufacturers of RES technologies, banks, NGOs and governmental agencies across current and candidate EU member states.
In addition to the questionnaire we held a number of interviews with representatives from the renewable energy industry to discuss the relation between risk and investments. These included representatives from
• International banks specialised in financing in project finance and more particular finance of renewable energy projects
• Project developers in the fields of offshore wind energy, onshore wind energy and biomass
Topics discussed were the role in investment and debt provision decisions of
• Technology risk of the various renewable electricity options
• Regulatory risk in terms of support mechanisms
The role of the support mechanism The two predominant support mechanisms in the EU are:
• systems where a guaranteed feed-in tariff is paid for renewable electricity for a period of time
• generators receive certificates when renewable electricity is fed into the grid. These certificates may be sold in the market to (1) offset a renewable portfolio obligation or (2) to provide buyers of electricity with certified green electricity.
In terms of financial return and risk these schemes have different characteristics, which are listed in table S.2.
– 9 –
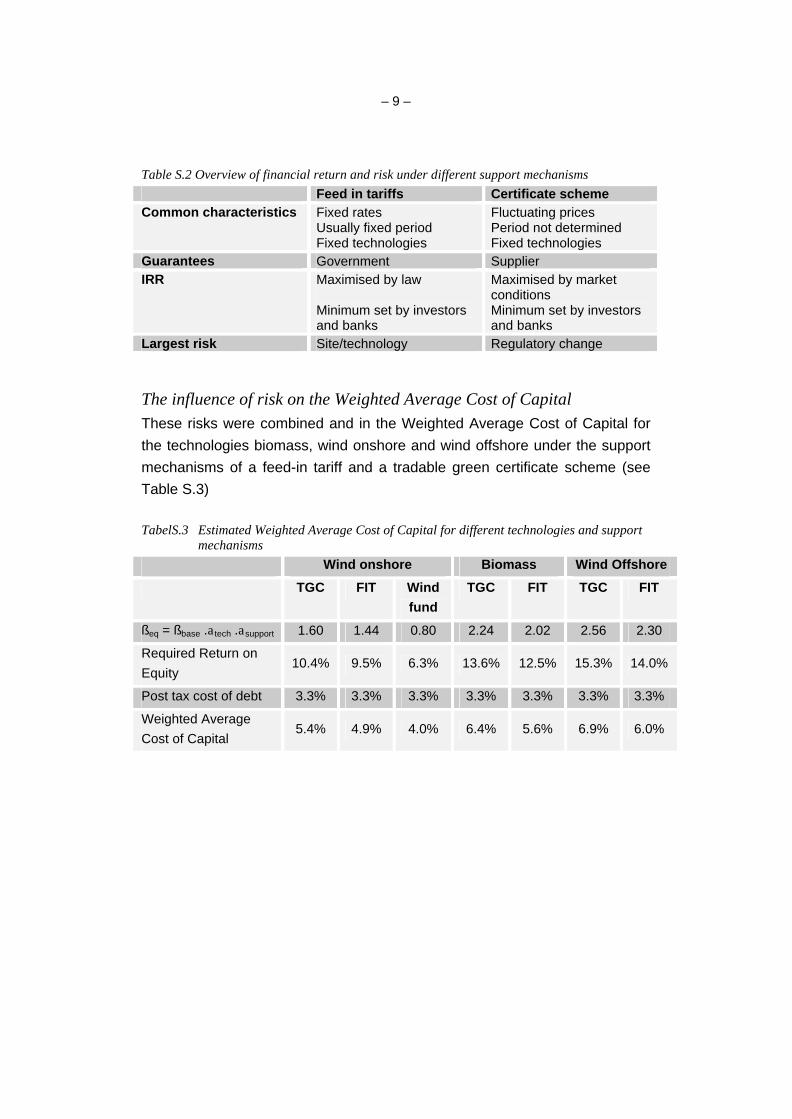
Table S.2 Overview of financial return and risk under different support mechanisms Feed in tariffs Certificate scheme Common characteristics Fixed rates
Usually fixed period Fixed technologies
Fluctuating prices Period not determined Fixed technologies
Guarantees Government Supplier IRR Maximised by law
Minimum set by investors and banks
Maximised by market conditions Minimum set by investors and banks
Largest risk Site/technology Regulatory change
The influence of risk on the Weighted Average Cost of Capital These risks were combined and in the Weighted Average Cost of Capital for the technologies biomass, wind onshore and wind offshore under the support mechanisms of a feed-in tariff and a tradable green certificate scheme (see Table S.3)
TabelS.3 Estimated Weighted Average Cost of Capital for different technologies and support mechanisms
Wind onshore Biomass Wind Offshore
TGC FIT Wind fund
TGC FIT TGC FIT
ßeq = ßbase .a tech .asupport 1.60 1.44 0.80 2.24 2.02 2.56 2.30
Required Return on Equity
10.4% 9.5% 6.3% 13.6% 12.5% 15.3% 14.0%
Post tax cost of debt 3.3% 3.3% 3.3% 3.3% 3.3% 3.3% 3.3%
Weighted Average Cost of Capital
5.4% 4.9% 4.0% 6.4% 5.6% 6.9% 6.0%
– 10 –
1 Introduction
Background The project Green-X, which is sponsored by the European Commission, aims at developing a model which can describe the dynamics of the implementation of renewable energy in Europe. An important element of the dynamics concerns the behaviour and decision making by stakeholders on investments in these renewable energy technologies. A major driving force in this decision making process by stakeholders is related to the risks which stakeholders perceive in the market.
Aim of this report The aim of this report is to describe methods to assess and quantify the risks of investments in renewable energy technology. The methods presented are used to analyse different business cases in order to obtain risk profiles and parameters which relate to different technologies and policy support mechanisms for renewable energy.
A second important item is the risk perception by stakeholders and how this influences their behaviour as entrepreneurs in the renewable energy market. These results give important insights in how the different aspects of risk (technological risk, regulatory and market risk) interplay and influence decision-making by stakeholders.
Finally the results of the analysis and the market consultation are combined in a model to quantify the costs of risk. The Weighted Average Cost of Capital is proposed as the factor to absorb the influence of risk. In this way it is possible to incorporate the results of this study into the Green-X model. The WACC influences the cost of renewables in the model and hence a higher or lower WACC results in a higher or lower development rate.
Structure of this report
Chapter 2 describes the concept of risk and upward potential. It gives an overview of the various sources of risk and its influences on the renewable energy market. The position of different market players is described.
– 11 –
Chapter 3 describes different methods to assess and model the effects of risk on the financial performance of a project. It introduces scenario analysis, Value-at-Risk and risk premiums.
Chapter 4 gives an overview how different stakeholders handle risk and how it influences overall costs of renewable energy development.
Chapter 5 describes the main conclusions from the stakeholder consultation. The stakeholder consultation consists of an inventory around important topics of decision making and the role of risk and a number of interviews where these aspects were discussed in more detail.
Chapter 6 is devoted to the role of risk in the financing of renewable energy projects. The cost of debt and the cost of equity are treated separately and then combined into a model for the WACC. The model is applied to different technologies under different support mechanisms.
– 12 –
2 Dealing with uncertainties
2.1 Risk and upward potential
Risk in relation to investments in renewable energy projects can be described by the negative impact which uncertain future events may have on the financial value of a project or investment. Risks form the counterpart of the upward potential: the increase in value due to future events. It is important to note that risk is not identical to uncertainty. Uncertainty of the financial value of a project can be both positive and negative in comparison with the expected value. The term ‘risk’, however, relates exclusively to the events which might occur and would lower the expected financial value. Events which may take place and would increase the expected value, form the ‘upward potential’.
Although both risk and upward potential are related to the uncertainty of future events, risks usually play a more dominant role in investment decisions since investors are risk averse in most cases. When it comes to investment risks for renewable energy projects, three categories seem to play the most dominant role:
• regulatory risks which can be found in project development or are related to possible changes in the financial support for renewable energy due to changing government policies
• market and operational risks which are related to for instance increasing costs for operation or feedstock, such as biomass
• technological risks which follow from malfunctioning of the technology used and potentially can be large for some renewable energy technologies since these have entered only recently on the market.
It is important to note that we discuss risks as perceived by stakeholders in renewable electricity. This is a different viewpoint than the one taken by

– 13 –
Awerbuch et al1. who have applied portfolio theory to EU electricity planning and policy-making. They remark that adding wind, PV and other fixed-cost renewables to a portfolio of conventional generating assets serves to reduce overall portfolio cost and risk, even though their stand-alone generating cost may be higher. For energy planning purposes the relative value of generating assets should be determined not by evaluating alternative resources, but by evaluating alternative resource portfolios.
2.2 Sources of risk in renewable energy investments
A serious issue in the development of renewable energy projects is how future events affect the value of the project and which risks are involved for the investment planned. Figure 2.1 illustrates the total risk a company in operation may face. Dealing with risk (i.e. uncertainties in future developments which have a negative impact on the operation and profit of a company) is a key element when it comes to value a new project and decide on investing in it. This situation applies not only to the actual investor, but also to other stakeholders who are involved, such as banks, insurance companies, suppliers of the technology and the off-takers of the energy. The sources of risk and its impact, however, can differ substantially for each of these stakeholders.
1 Applying portfolio theory to EU electricity planning and policy-making, Simon
Awerbuch and Martin Berger, IEA working paper EET/2003/03, Paris February 2003

– 14 –
Figure 2.1 A variety of risk sources make up the total risk of a company2
2 Taken from L. Meulbroek (2000). Total strategies for company-wide risk control. In:
Mastering risk (vol. 3). Financial Times Mastering Series, London.
Operational risk•installation breaks down•product defects increase•weather affects operation•grid imbalance increases
Input risk•input prices rise•labour strikes•key employees leave•supplier fails
Product market risk•customor loss•product obsolesence•compitition increases•prpduct demand decreases
Financial risk•capital costs increase•exchange rates change•inflation•covenant violation•default debt Legal risk
•product liability•restraints of trade changes•shareholder law suits
Tax risk•income tax rises•revenue bonds end•sale tax rises
Regulatory risk•environmental laws change•price support ends•import protection ceases•stricter anti trust enforcement
Total company
risk
Total Total company company
riskrisk

– 15 –
The importance of each risk category depends strongly on the nature of the company and the sector and market in which it operates. For trading in green electricity, we may distinguish the following risk sources which are relevant for sellers and buyers on the market:
producer of green energy buyer of green energy (in case of a certificate system)
operational risk prediction capability of load and grid imbalance is crucial
for less mature technology performance is a risk factor
depends on banking strategy of certificates, otherwise possibly relatively low risk
product market risk demand expected to rise (favourable), but at same time competition may increase strongly as well
demand expected to rise (favourable), but at same time competition may increase strongly as well
input risk bio-energy options: fuel costs important wind and hydro: varies with climate
large profits at risk when long-term contracts are closed and prices change
regulatory risk very important: profit strongly depends on price support import protection
very important: profit & sales strongly depends on price support / tax breaks
financial risk in particular relevant without long-term contracts and for sources where capital costs dominate (wind, hydro)
depends on inventory size (banking) and portfolio of contracts
2.3 Relevance of risks for investors in renewable energy projects
A more detailed overview of risk elements which are relevant for investors in renewable energy projects in table 2.1. This overview includes a selection of measures which can be taken to minimise these risks.
For generators trading in green electricity, we may distinguish the following risk sources which directly affect prices (besides other risks we mentioned):
• price development of electricity which is determined by supply and demand of electricity on the one hand and by fossil fuel prices on the other
– 16 –
• price development of green certificates which is determined in part by supply and demand, but to a large extent also by changes in government policy, subsidies and regulation.
Uncertainties in price developments due to supply and demand are relatively easy to quantify and translate into a risk premium based on historic developments. Fluctuations in prices due to developments on the world’s fossil fuel market are more difficult to capture, but a tradition for this has been developed and can be incorporated through different scenarios. Also, for the value of green electricity, such developments are probably of lesser importance.
The most important and most difficult source of uncertainty, in particular for the long term, concerns the role of government policy. This is most likely to change, as can be learned from the past, but it is difficult to predict when, in what direction and to which extent. However, for the value of green electricity these developments can be crucial.

– 17 –
Table 2.1 Overview of risks with which an investor in renewable electricity is confronted when his installation is in operation. For every risk we have indicated whether the generator can influence this risks and which measures he can take to limit the risk (within the company or externally on the market)
type of risk description of the risk can be influenced external measure internal measure
imbalance in delivery to the grid yes outsource load balancing planning & management load forecasting
larger maintenance yes guarantees equipment supplier maintenance strategy
lower plant availability yes guarantees equipment supplier load management apply conservative budgeting
operational risks
lower generation efficiency yes guarantees equipment supplier optimise apply conservative budgeting
lower demand partly hedging pricing policy
market monitoring marketing pricing policy
higher fuel purchase prices yes contract length & conditions hedging
market monitoring purchase policy
lower market prices yes ditto market monitoring pricing policy load forecasting
market risks
new entrants no ditto market monitoring
change in renewable energy policy no
changes in specific regulation no
regulatory risks
decrease in financial support no
long-term contracting fixed pricing
apply risk analysis monitor value-at-risk profit requirements rate of return requirements
– 18 –
2.4 Relevance of risks in buying green energy
Buyers of green energy, such as green suppliers for voluntary demand or suppliers with a government obligation to buy and sell a certain amount, are confronted, like investors in projects, with risks. However, the risk profile can be different. First of all, buyers of green energy are likely to be exposed to risks of the wholesale market for electricity (or heat or gas). Also, regulatory risks due to changes in government policies related to price support of renewables apply as well and are equally important and dominating.
In addition, however, green suppliers also face risk on the retail market. This risk is in part determined by changes in government policies to promote and support renewables and in part by the dynamics of the retail market. Considering the liberalisation process of the energy market, risk on the retail market can be expected to increase in the near future compared with the present situation. Driving forces for this risk are:
• switching behaviour of customers
• increased competition between suppliers
• new entrants in the market.
The short-term dynamics of developments on the retail market (in e.g. prices, market share, customer preferences) may impose conflicts with the current situation to contract renewable electricity in long-term contracts.
When furthermore regulatory risk comes on top of retail market risk, green suppliers have to consider a suitable bidding and pricing strategy to close long-term contracts with generators. Otherwise their profit-at-risk (PaR) may run out of control and a potential loss-making situation can emerge if certain risks become reality in the future.

– 19 –
3 Modelling and measuring risks
In order to understand and quantify risks which may affect investments in renewable energy a number of methods is used in the market. A qualitative assessment of potential risks and threats forms the basic step in understanding the importance of risk factors and how they may affect the financial value of an investment. When a picture is available of the risk factors affecting a (potential) project, an attempt can be made to quantify these risks.
For investments the most logical step is to make this analysis in financial terms. In this way, the feasibility of a project can be judged and options for mitigation or improvement considered. A number of methods is available and used to quantify risks for investments, such as:
• scenario analyses
• value-at-risk or profit-at-risk assessments
• required green price calculations
Table 3.1 shows some advantages and disadvantages of these methods.
Table 3.1 Overview of advantages and disadvantages of various approaches to estimate risks
advantages disadvantages
scenario analysis • simple method
• easy to understand
• may overestimate risk
• no information on probability of risk
Value-at-Risk (or profit-at-risk)
• both risk and its probability is measured
• can calculate probability of loss/inadequate financial returns
• complex
• requires information on distribution of uncertain input
required green price • allows calculation of risk premiums
• use is limited to some situations only

– 20 –
3.1 Quantifying risk through scenarios
The simplest approach to estimate the impact of risks on the value of a renewable energy investment is by calculating the net present value (NPV) of the expected cash flow under various scenarios. These scenarios express different future developments which may be possible. Usually, these scenarios reflect a worst case, best guess and optimistic estimate of future development which affect the value of the project. Assumptions may include elements such as the future price of electricity, green prices available for renewable production, the expected output of the project (in terms of kWh or GJ produced) and costs for operation and maintenance.
When simple cash flow calculations are used with multiple scenarios, risks can be determined by the difference between the net present value which is considered the best guess and the worst case or lowest outcome. The difference between the best guess and the highest outcome does not represent a risk for the investor, but gives an indication of the upward potential if the actual developments turn out to be more optimistic than expected. It is important to remark that risk and upward potential do not have to be equal in magnitude.
Figure 3.1 Schematic representation of the risk and upward potential derived from scenario analyses with a cash flow model
risk
upward potential
worst case
best guess
optimistic case
Net present
value
(expected in
scenario)

– 21 –
Text box 1 explains how the net present value of a project can be calculated from its expected cash flow under a given scenario. Such a cash flow model with scenarios can be easily implemented in standard spreadsheets. Because of its simplicity, the approach also allows to analyse the impact of single state variations of each variable of scenario. The results of these single state variations can help to understand which factor has the largest influence on the risk and value of the project. When ranked on magnitude in a graph, the outcomes for each single state variation form a so-called “tornado diagram” (see fig. 3.2).
In this way, the scenario approach provides information on the magnitude of potential risks and which factors contribute most to the overall risk of the project. There is, however, one important drawback of the scenario approach. It does not provide any information on the probability of events. To include probabilities the method has to be modified and turns in the approach which we will describe in the next section.
Figure 3.2 Tornado diagram showing the largest risk factors (red bars) in a scenario based risk assessment. The thick black line shows the expected value under best guess estimates.
0 10 20 30 40 50 60 70 80 90 100
net present value
all parameters
etc.
maintenance costs
expected production
electricity price

– 22 –
Text box 1: Cash flow calculations
The cashflow or income of a project before tax is calculated as follows:
IBTt = (GPt + PEt + PPt - VCt)Qt - RCt (1)
With:
IBTt Income Before Tax in year t
GPt Green Price in year t
PEt Reference electricity price in year t
PPt Production support level per unit production in year t
VCt Variable production costs per unit production in year t
RCt Fixed production costs in year t
Qt Production in year t
The taxable income can be reduced by the tax deductions: the depreciation and the interest payments to the bank.
Using linear depreciation (constant over time) the income after tax will be:
IATt = (1-τ) IBTt + τ (DEPt + Rt) (2)
DEPt = C/L if t ≤ L (3)
DEPt = 0 if t > L
With:
DEPt Depreciation in year t
IATt Income After Tax in year t
τ Tax rate
L Depreciation time
Rt Interest payment over debt in year t
The net present value (NPV) of the casfhlow after tax, can now be calculated as:
∑= +
=n
tt
p
tp r
IATPV
1 )1( (4)

– 23 –
0
)1(1
=−+
=−= ∑=
Cr
IATCPVNPV
n
tt
p
tpp (5)
With:
PVp The Present Value of the project
rp Project rate of return
n Lifetime of the project
If only the equity part of the investment is considered these equations are as follows:
∑= +
−=
n
tt
e
te r
AIATPV
1 )1( (6)
0.)1(
.1
=−+
−=−= ∑
=
CEr
AIATCEPVNPV
n
tt
e
tee (7)
With:
PVe The Present Value of the equity part of the project
re The required Return On Equity
A The annuity of the debt part of the investment
E The Equity share
Furthermore:
A = Rt + Pt (constant over time) (8)
D.C + E.C = C
With:
Pt The payoff of the debt part of the investment in year t
D The Debt share
– 24 –
3.2 Quantifying value at risk
In the previous section we described a simple approach to quantify the risks which may lower the value of an investment in renewable energy. An important drawback of this approach is the lack of probability of outcomes. To characterise the role of risks and provide information on probabilities on occurrence, Monte Carlo simulations have been introduced in cash flow analyses. Instead of building separate scenarios which describe different views on the future, Monte Carlo analyses build on distribution functions for each input variable which is subject to uncertainty. In a Monte Carlo analysis a large number of cash flow calculations are made (10,000+). For each calculation, a new set of input data is drawn randomly from the distribution function for each input parameter.
Each calculation results in an outcome for the net present value of the project which can be used in the final analysis. By ranking all outcomes (from to small to large) it then becomes possible to characterise the probability function of the net present value of the project under uncertain conditions. The expected net present value is then given by the median value of the distribution function:
Expected NPV = NPV (P = 50%)
It is important to note that the expected NPV defined in this way, may differ (strongly) from the average NPV in case of a skewed distribution function. Under these conditions, the median value represents a better estimate for the expected value than the average value.
The available distribution function for the NPV of the project also allows to examine the certainty of the expected value. We can define an uncertainty range which tells between which values the expected value may vary at a certain probability level. Similarly, we can identify a measure of risk: risks correspond to the lower band of the uncertainty range, while opportunities correspond to the upper band of the uncertainty range.
In this way, we can calculate the value-at-risk (VaR) which can be defined by:
VaR = NPV (P=50%) – NPV (P=10%).

– 25 –
The value-at-risk, defined in this way, covers 80% of the investment risk and reflects a commonly used definition. This definition, however, leaves a possibility that the actual risk may be larger. For stricter measures, one may apply a different definition which includes the impact of events with a low probability.
Finally, the Monte Carlo approach allows an estimate of the probability, that the investment does not meet the requirements of the investor on financial returns. (i.e. the net present value is negative). This probability is given by:
P(loss) = S [ P (NPV<0) ]
Figure 3.3 gives an illustration of the Monte Carlo approach applied to an investment in a biomass plant. In this example, the expected net present value is calculated at 14 million Euro. The Value-at-Risk (VaR) lays around 24 mln Euro (i.e. the difference between the NPV with 10% probability and the expected value). In this case the VaR is larger than the expected NPV indicating that this investment has a large probability of not meeting the requirements on financial returns. This situation has a probability of 30% in this example.

– 26 –
Figure 3.3 Example of the probability distribution for the net present value of a renewable energy project based on a Monte Carlo approach. The expected value (P=50%) is 14 mln Euro. The Value-at-Risk(VaR) is 24 mln Euro in this case (VaR = NPV(50%) – NPV(10%) = 14 – (-10) = 24 mln. The analysis also shows that this investor has 30% probability of not meeting his internal financial return targets (NPV < 0).
3.3 Quantifying required green price
RGP and cash flow calculations The Required Green Price (RGP) is the average minimal green price that investors wants to obtain from the market over the lifetime of the project so his demands regarding financial returns are met and the investment is feasible. The RGP is calculated from the cash flow of the project, in which all relevant factors are included such as O&M costs and policy parameters. An estimate of the required green price is particularly useful in markets where the financial support
0%
10%
20%
30%
40%
50%
60%
70%
80%
90%
100%
-20 -10 0 10 20 30 40 50
net present value (in mln euro)
cumulative probability
– 27 –
for renewable energy is not fixed by the government (e.g. through feed-in tariffs), but depends on market dynamics.
The result of a cash flow calculation is usually the rates of return of a project. When the potential income is given over the lifetime of the project, the attractiveness of the project can be measured by the project rate of return or, if only the equity part is considered, the return on equity (ROE). The internal rate of return indicates the situation in which the Net Present Value (NPV) of the project is zero; the price for which the product (in this case electricity) is accounted for in the calculations is then the cost price.
However, if a RGP calculation has to be made, the potential income is not known because the RGP is not known. Therefore the calculations have to be made with required rates of return to be able to calculate the RGP backwards. The resulting price (sum of market price of electricity, the RGP and production support) will equal the cost price; with this price the required returns on investments are just met. Therefore the RGP will be calculated for the situation in which the NPV is zero, using required rates of return:
NPV(RGP) = PV(RGP) - C = 0 (1)
With:
NPV(RGP) Net Present Value as a function of the RGP
PV(RGP) Present Value as a function of the RGP
C Total investment
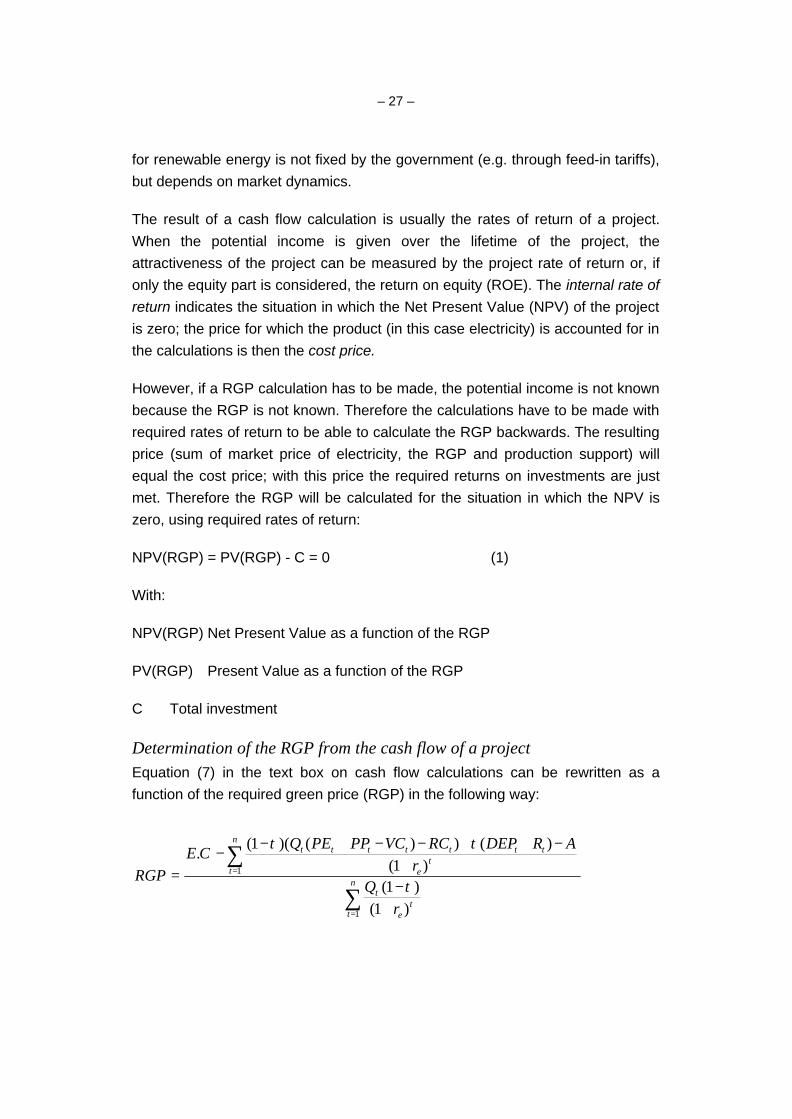
Determination of the RGP from the cash flow of a project Equation (7) in the text box on cash flow calculations can be rewritten as a function of the required green price (RGP) in the following way:
∑
∑
=
=
+−+
−++−−+−−
= n
tt
e
t
n
tt
e
ttttttt
rQ
rARDEPRCVCPPPEQ
CERGP
1
1
)1()1(
)1()())()(1(
.
τ
ττ

– 28 –
The calculation of the RGP can be combined with a Monte Carlo approach. This combined method then results in risk premiums, which an investor (or any other stakeholder which is involved in a renewable energy project) may try to ask in the market to cover his risks.
Table 3.2 gives an illustration of the results one can obtain with a combined RGP-Monte Carlo approach. In this case risk premiums have been calculated for three types of risks: operational, market and regulatory risks of wind and biomass projects in the Netherlands. The example shows that regulatory risks translate into substantial risk premiums for wind energy and biomass (in comparison with required risk premiums for operational and market risk). The value of these risks will vary between individual generators, sources, countries and, most importantly, with the period for which they are considered. To cover all these risks, a generator would like to see them covered by a risk premium on top of the minimum price he needs for a profitable operation under ‘normal’ (i.e. less risky) conditions.
Table 3.2 Indication of risk premiums for various risk sources for investments in wind energy and biomass3
type of risk wind energy biomass
operational risk 0,1 €ct/kWh 0,5 €ct/kWh
market risk 0,2 €ct/kWh 0,2 €ct/kWh
regulatory risk 1,2 – 2,5 €ct/kWh 1,2 – 2,5 €ct/kWh
3.4 Examples
Scenario versus VaR-analysis To illustrate the differences between the scenario based discounted cash flow (DCF) analysis with the Monte Carlo based Value-at-Risk (VaR) approach, we
3 From: W. Ruijgrok e.a. (2001). How profitable is renewable energy? Need and
possibilities for financial support with a view on Europe. KEMA, Arnhem, report for Minsitry of Economic Affairs.

– 29 –
turn to a simplified example for a wind project which is considered of being developed. The project size intended is 20 MW, but the investor has key uncertainties regarding:
• investment costs
• expected wind speed and power production
• maintenance costs
• power price available.
Based on available information at the planning stage, the investor has formulated three scenarios with input parameters for a DCF analysis:
worst case best guess optimistic case
investment costs 24 mln 22 mln 18 mln
power production 42 GWh 50 GWh 55 GWh
O&M costs 1,0 mln/year 0,8 mln/year 0,7 mln/year
power price 5.9 ct/kWh 6.3 ct/kWh 6.7 ct/kWh
As input for the Monte Carlo based VaR-approach, the following distribution functions are used which are consistent with the ranges used in the scenario cases:
distribution mean standard deviation
investment costs normal 22 mln 2.5 mln
power production normal 50 GWh 3.5 GWh
O&M costs normal 0,8 mln/year 0,05 mln/year
power price normal 6.3 ct/kWh 0.3 ct/kWh
Table 3.3 Differences in outcomes for the scenario-based DCF analysis and the Monte Carlo based VaR analysis of the risk for a wind farm
Scenario DCF Monte Carlo
worst case -6.7 mln VaR (p=10%) -3.1 mln
best guess 0.6 mln Expected NPV 0.6 mln
– 30 –
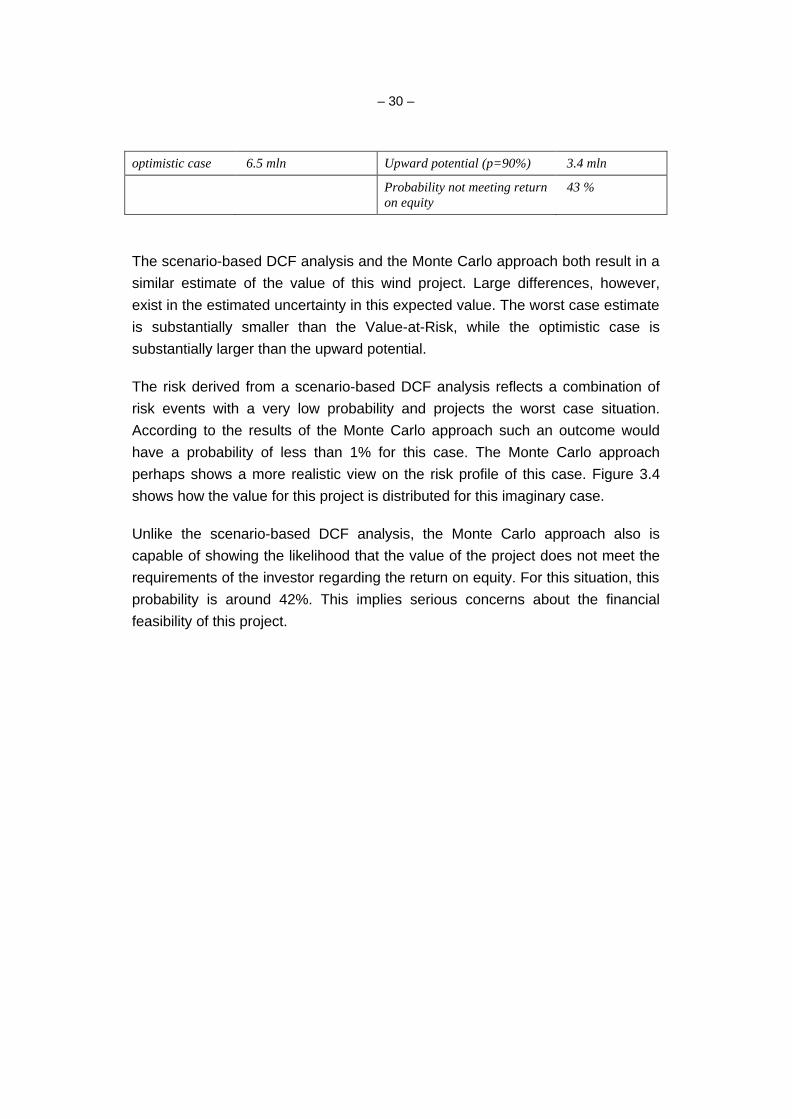
optimistic case 6.5 mln Upward potential (p=90%) 3.4 mln
Probability not meeting return on equity
43 %
The scenario-based DCF analysis and the Monte Carlo approach both result in a similar estimate of the value of this wind project. Large differences, however, exist in the estimated uncertainty in this expected value. The worst case estimate is substantially smaller than the Value-at-Risk, while the optimistic case is substantially larger than the upward potential.
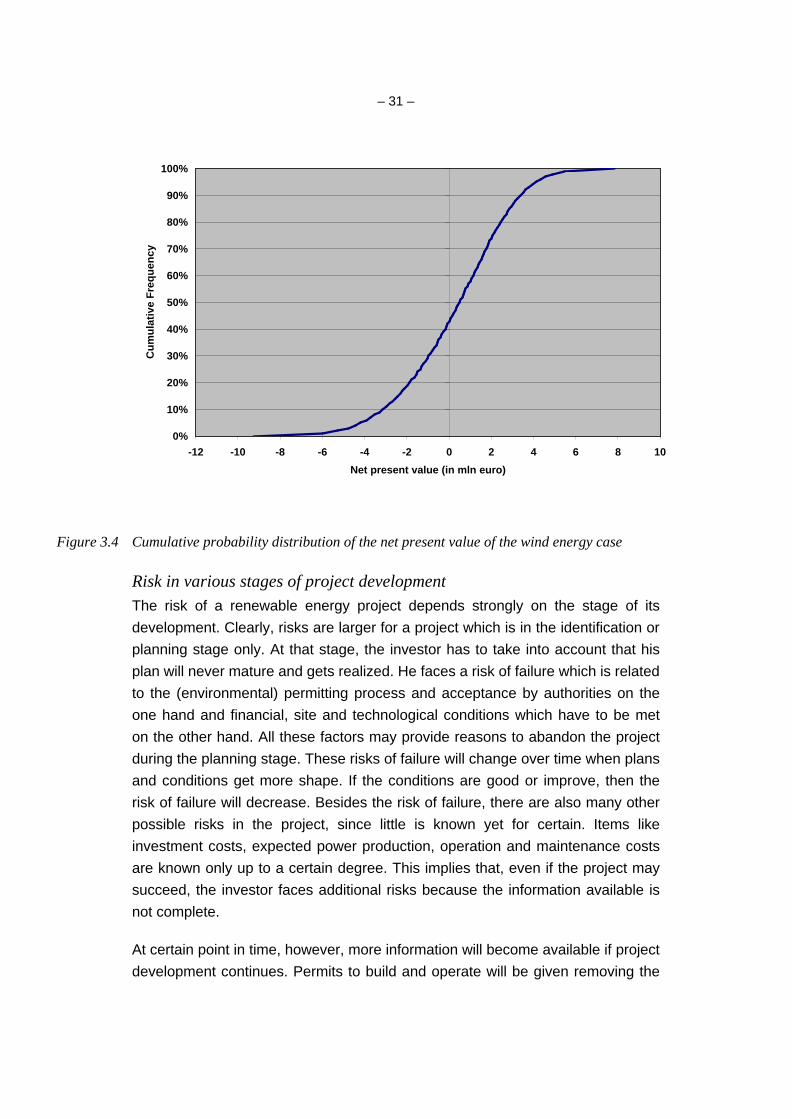
The risk derived from a scenario-based DCF analysis reflects a combination of risk events with a very low probability and projects the worst case situation. According to the results of the Monte Carlo approach such an outcome would have a probability of less than 1% for this case. The Monte Carlo approach perhaps shows a more realistic view on the risk profile of this case. Figure 3.4 shows how the value for this project is distributed for this imaginary case.
Unlike the scenario-based DCF analysis, the Monte Carlo approach also is capable of showing the likelihood that the value of the project does not meet the requirements of the investor regarding the return on equity. For this situation, this probability is around 42%. This implies serious concerns about the financial feasibility of this project.
– 31 –
0%
10%
20%
30%
40%
50%
60%
70%
80%
90%
100%
-12 -10 -8 -6 -4 -2 0 2 4 6 8 10
Net present value (in mln euro)
Cu
mu
lati
ve F
req
uen
cy
Figure 3.4 Cumulative probability distribution of the net present value of the wind energy case
Risk in various stages of project development The risk of a renewable energy project depends strongly on the stage of its development. Clearly, risks are larger for a project which is in the identification or planning stage only. At that stage, the investor has to take into account that his plan will never mature and gets realized. He faces a risk of failure which is related to the (environmental) permitting process and acceptance by authorities on the one hand and financial, site and technological conditions which have to be met on the other hand. All these factors may provide reasons to abandon the project during the planning stage. These risks of failure will change over time when plans and conditions get more shape. If the conditions are good or improve, then the risk of failure will decrease. Besides the risk of failure, there are also many other possible risks in the project, since little is known yet for certain. Items like investment costs, expected power production, operation and maintenance costs are known only up to a certain degree. This implies that, even if the project may succeed, the investor faces additional risks because the information available is not complete.
At certain point in time, however, more information will become available if project development continues. Permits to build and operate will be given removing the
– 32 –
risk of failure due to regulatory restrictions. Investment, operation and maintenance costs will become clear when a supplier has been selected and contracts have been closed. These steps will also remove parts of the risk for the investor, but not all.
Some items still may remain uncertain and provide risk. For instance, the expected price for power sales4, actual power production level, inflation rate and maintenance in the long run. Some of these risk elements may be removed when the project starts to operate.
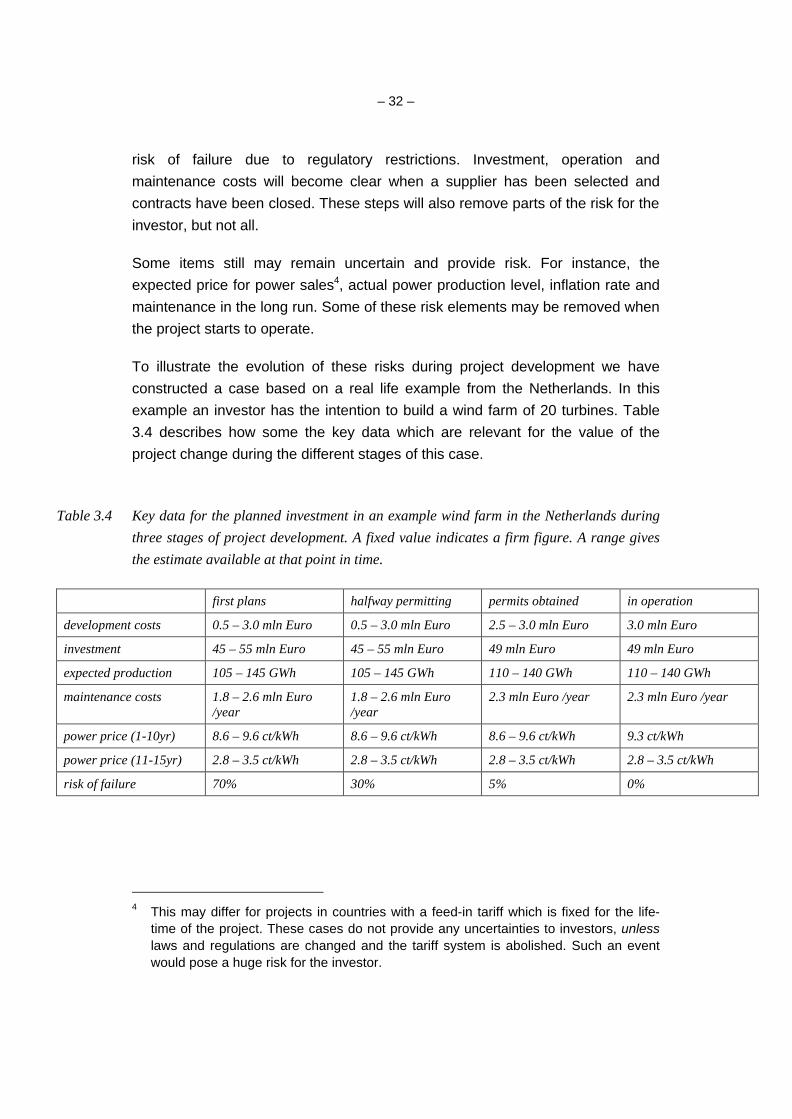
To illustrate the evolution of these risks during project development we have constructed a case based on a real life example from the Netherlands. In this example an investor has the intention to build a wind farm of 20 turbines. Table 3.4 describes how some the key data which are relevant for the value of the project change during the different stages of this case.
Table 3.4 Key data for the planned investment in an example wind farm in the Netherlands during three stages of project development. A fixed value indicates a firm figure. A range gives the estimate available at that point in time.
first plans halfway permitting permits obtained in operation
development costs 0.5 – 3.0 mln Euro 0.5 – 3.0 mln Euro 2.5 – 3.0 mln Euro 3.0 mln Euro
investment 45 – 55 mln Euro 45 – 55 mln Euro 49 mln Euro 49 mln Euro
expected production 105 – 145 GWh 105 – 145 GWh 110 – 140 GWh 110 – 140 GWh
maintenance costs 1.8 – 2.6 mln Euro /year
1.8 – 2.6 mln Euro /year
2.3 mln Euro /year 2.3 mln Euro /year
power price (1-10yr) 8.6 – 9.6 ct/kWh 8.6 – 9.6 ct/kWh 8.6 – 9.6 ct/kWh 9.3 ct/kWh
power price (11-15yr) 2.8 – 3.5 ct/kWh 2.8 – 3.5 ct/kWh 2.8 – 3.5 ct/kWh 2.8 – 3.5 ct/kWh
risk of failure 70% 30% 5% 0%
4 This may differ for projects in countries with a feed-in tariff which is fixed for the life-
time of the project. These cases do not provide any uncertainties to investors, unless laws and regulations are changed and the tariff system is abolished. Such an event would pose a huge risk for the investor.

– 33 –
Figure 3.5 Value-at-Risk (VaR), expected NPV and upward potential estimated using a Monte Carlo approach for the development of a wind farm with 20 turbines in the Netherlands
Figure 3.5 shows how Value-at-Risk, expected NPV and upward potential change during the different stages of project development. The expected value of the project (in NPV terms) is negative in the initial stages of development due to the large risk of failure of the project, leaving the investor with developments costs and no returns from the project. When plans become more mature and the risk of failure decreases, the expected value will start to rise. At that stage, there is, however, still a possibility that the project has to be abandoned, which leaves the investor with a loss as indicated by the negative VaR.
This situation improves when a permit has been obtained and quotations from the supplier for turbines and maintenance are available. The VaR shows a large shift upwards, illustrating the significant reduction of risk failure and risks in investment and maintenance costs. Also note that the expected value of the project improves because more information is available. However, the upward potential is slightly reduced when more is known.
When the project has entered the stage of operation, again additional information has become available. As a result, uncertainty decreases, which brings the value-at-risk up and upward potential down. In this case, the expected value is slightly affected upward. Due to a conservative approach in estimating uncertain factors, expectations which were previously used were slightly lower than the actual
NPV in mln euro
-5
0
5
10
15
20
25
30
First plans Halfway Permit In operation
VaRExpected NPVUpward potential

– 34 –
values. This leads to a positive effect on the expected NPV when better information came available.
Risk in the portfolio of a green supplier The previous examples took a view on the risk of an investor who is considering an investment in a single renewable energy project. When an investor wants to build a portfolio of projects, for instance in different renewable energy options in different European countries, he may be confronted with additional issues such as:
• how do you build a sensible portfolio from different projects and different countries
• how do risks accumulate in building a portfolio
• is there a limit in portfolio size (considering risks and return on investment or value of the portfolio)?
We will illustrate the possibilities of the Monte Carlo based profit-at-risk approach to assess the risks of a portfolio of projects. The example is based on the evaluation of a portfolio with candidate projects of a European investor5. This portfolio of candidate projects contained projects in wind energy, biomass (landfill, co-firing in coal powered station, biomass CHP) and small scale hydro power in England, Norway, Sweden, Finland, Denmark, Germany, the Netherlands, France, Spain and Italy.
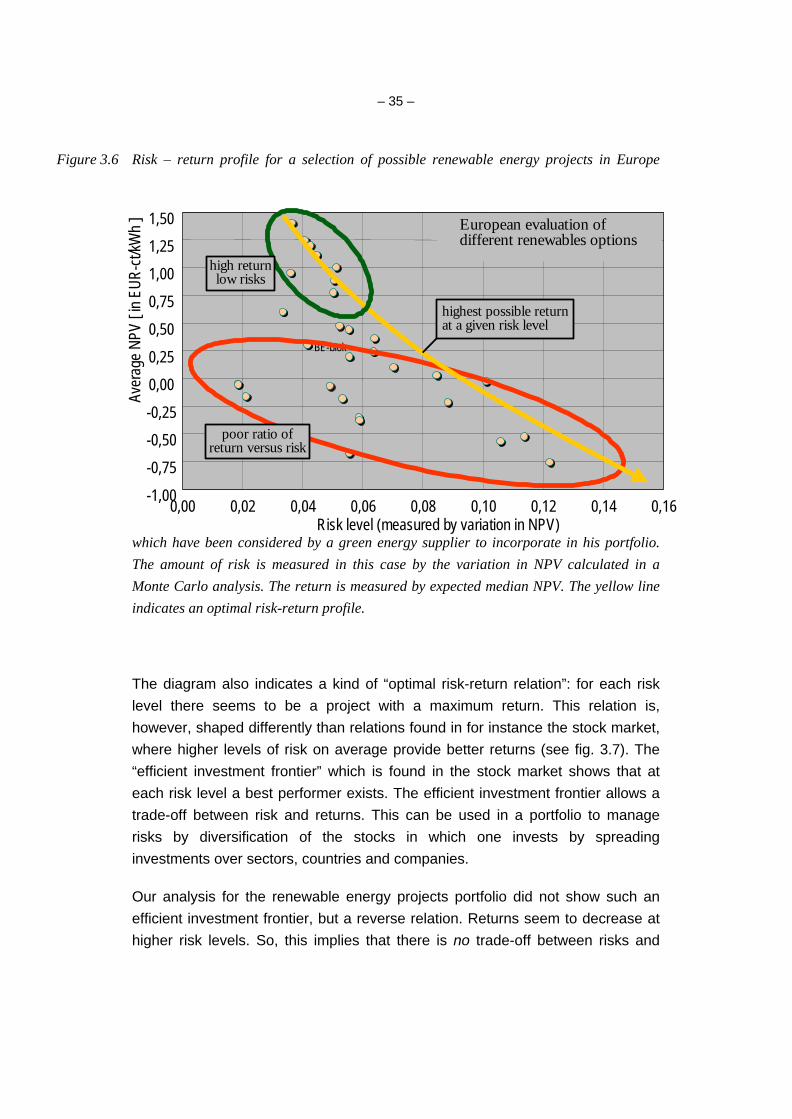
For each potential project, the expected net present value and a measure of risk were assessed using a Monte Carlo approach. A plot of these results provides a risk – return diagram (see fig. 3.6), which shows how the various projects are distributed. There appears to be a selected group of projects (contained in the green circle in fig. 5.3) which share a relatively high return and low risk in comparison with all other projects. Similarly, there is a group of projects with a relatively poor ratio of returns versus risk.
5 Results are based on projects which have been analysed for a European investor in
KEMA, 2003 (M. Vosbeek, W. Ruijgrok and H. Cleijne). The market for renewable energy in Europe. Country and price information on wind energy, biomass and hydro power. Confidential report.
– 35 –
Figure 3.6 Risk – return profile for a selection of possible renewable energy projects in Europe
which have been considered by a green energy supplier to incorporate in his portfolio. The amount of risk is measured in this case by the variation in NPV calculated in a Monte Carlo analysis. The return is measured by expected median NPV. The yellow line indicates an optimal risk-return profile.
The diagram also indicates a kind of “optimal risk-return relation”: for each risk level there seems to be a project with a maximum return. This relation is, however, shaped differently than relations found in for instance the stock market, where higher levels of risk on average provide better returns (see fig. 3.7). The “efficient investment frontier” which is found in the stock market shows that at each risk level a best performer exists. The efficient investment frontier allows a trade-off between risk and returns. This can be used in a portfolio to manage risks by diversification of the stocks in which one invests by spreading investments over sectors, countries and companies.
Our analysis for the renewable energy projects portfolio did not show such an efficient investment frontier, but a reverse relation. Returns seem to decrease at higher risk levels. So, this implies that there is no trade-off between risks and
BE-biok
-1,00
-0,75
-0,50
-0,25
0,00
0,25
0,50
0,75
1,00
1,25
1,50
0,00 0,02 0,04 0,06 0,08 0,10 0,12 0,14 0,16Risk level (measured by variation in NPV)
Aver
age
NPV
[ in
EUR-
ct/k
Wh
]
poor ratio ofreturn versus risk
highest possible returnat a given risk level
European evaluation ofdifferent renewables options
high returnlow risks

– 36 –
returns. Risk management for this portfolio means that managing risks always means opting for the projects with the highest possible returns.
Figure 3.7 Difference in risk-return relation between stock market and investing in projects in renewable energy market. In the stock market an efficient investment frontier exists, which allows higher returns at higher risk levels.
The question now is how a portfolio of projects can be built and how much risk is associated with possible sizes of that portfolio. Considering the risk management lesson we noted earlier (“always opt for the projects with highest returns to minimize risk”), projects were ranked according to their return-risk ratio with best performing projects selected first. As the next step, for each project the expected net present value and downside risk were calculated based on project size. In this way it becomes possible to assess the cumulative value of the portfolio and absolute risk level (see fig. 3.8).
Results shows that the value of the portfolio rise up to a certain size of the portfolio (around 1,700 GWh in this case), then stabilize more or less if the portfolio increases in size and after a certain size starts falling again. There appears to be a maximum value of the portfolio (around 1,700 GWh) beyond which further growth either increases the absolute risk to which this investor is exposed or risk increases and value even decreases. At least this end of the portfolio should always be avoided in a sensible investment strategy.
risk
retu
rn
Stock market
risk
retu
rn
Renewable projects

– 37 –
Although a maximum portfolio value can be observed, this maximum level does not automatically imply that this value could serve as the natural limit for the portfolio of this investor. The diagram also shows that while value still increases the absolute amount of risk to which this investor is exposed also continues to grow. From risk management perspectives and requirements from the financial situation of the investor limits may follow for the absolute amount of risk which are seen as acceptable. In this case, these limits on risk tolerance result in an indicative target to which the portfolio may grow. This risk-limited project portfolio is smaller in size than the size which leads to the maximum value.
Figure 3.8 Cumulative value of the possible project portfolio of a European investor in renewable energy in relation to the size of the portfolio (green line). The red line shows how risk accumulates with portfolio size.
3.000.000
6.000.000
9.000.000
12.000.000
15.000.000
Valu
e po
rtfol
io *
[ in
EUR,
cum
ulat
ive ]
0 500 1.000 1.500 2.000 2.500 3.000 3.500 4.000 4.500 5.000
Size portfolio * [ in GWh, cumulative ]
Expectation NPV (cumulative)Risk (cumulative)
Avoid theseoptions
in portfolio -they lower valueand increase risk
Value portfolio at 1.250 GWh as target size
– 38 –
4 Measures to deal with risks
4.1 Why risks influence cost
The heart of entrepreneur-ship is that there is no financial return without associated risks. On the other hand it does not make sense to take risks if there are no expected returns that can be envisaged are negligible.
The level of risk that a project developer is able and willing to absorb depends on many factors and is difficult to judge. They entail evaluation not just of economic capital capacity, but also liquidity considerations, tolerance for earnings volatility, creditor and shareholder awareness of and tolerance for risk-taking, management capacity to maintain business investment plans, and even on occasion, regulatory acceptance.
Project risk does not come without a price. Project developers have higher financial demands in case of high risk projects, which leads to higher cost price for the energy produced. Bankers, who run the risks that their loans or interested cannot be paid by the borrowers, will charge more for the debt capital they provide.
4.2 Project developer perspective
Renewable energy projects with a high Value-at-Risk may be unacceptable from the perspective of a project developer’s perspective. For the project developer, one way to decrease the VaR is to ask a higher price for the energy produced, and hence increase the expected value for his returns. The difference between the risk-free price and the actual market price is called the risk premium.
Figure 4.1 shows the effect a risk premium has on the VaR. The risk premium on the energy price shifts the range of possible returns to the right. This leads to higher value for the average return or to a lower risk of negative returns, hence a lower Value-at-Risk. The conclusion is that the need for the project developer to cover up his risks leads to higher prices for the buyer of the electricity.

– 39 –
0
0.25
0.5
0.75
1
Risk Premium
Return
VAR to zero
Figure 4.1 Risk premium for an investment project. The risk premium equals the increased return required for making the project risk free (VAR = 0).
In case the government subsidizes the production of renewable energy for reaching national goals, the risk premium will not be transferred to the end consumer, but will have to lead to a higher subsidy level. Long term feed-in contracts may reduce the project developer’s risk considerably, because the guarantee a constant cash-flow over a longer period, removing (partly) the risk premium and hence the subsidy level can be lower.
The risk premium is not always made explicit, but is a result of another approach adopted by project developers. For higher risk level a higher rate is used for discounting the future cash flows. Thus, the future cash flows have to increase to obtain the same net present value, which can only be realized when the energy is sold at a higher price. Table 4.1 shows the different levels project discount rates for countries in the EU under different subsidy schemes

– 40 –
Table 4.1 Example of discount rates used by investors/project developers in EU countries as a function of the subsidy scheme.
Country IRR
Austria <2%
Germany 2% 5%
Denmark 4% 7%
Spain 4% 7%
France 7% 11%
Feed In
Netherlands 7% 11%
UK 7% 11%
Belgium 8% 15%
Certificate
4.3 Banker’s perspective
Debt Service Coverage Ratio Banks face the risk that borrowers are not able to pay back loans or interest terms and in contrast to having an equity position in a project, a loan does not offer banks any upward potential. Therefore banks are very eager to remove all the risks that can endanger the incoming cash flow of a project. Therefore they put high requirements on technical availability of the facility, ask for insurance to cover the cost of machine failure and loss of production, and require that suitable maintenance programs are in place.
The main measure for a bank to judge whether a client is able to fulfill his obligations is the Debt Service Coverage Ratio. This ratio is defined by
DSCR = cashflow / (interest + loan repayment)
A DSCR higher than unity means that the borrower is able to fulfill his requirements. Dependent on a bank’s risk perception of a project, they will require a higher DSCR level before they give out a loan. In principle the bank is not so much interested, whether a project is profitable, but the only thing they

– 41 –
want to make sure is that they get their money back. Of course there is a strong link between the profitability of a project and the available cash flows.
Table 4.2 Levels of required DSCR for wind energy projects.
Type of project Required DSCR
onshore wind energy project 1.3-1.4
complex terrain wind energy project 1.6
offshore wind energy project 2.0
Table 4.2 gives values for the required DSCR values for different types of wind energy projects. Clearly the uncertain offshore wind energy projects, which have hardly any proven track record, have the highest level. Complex terrain wind energy projects often have a larger uncertainty of the available wind resource and the environmental loads on the machines compared to an onshore wind energy project in “normal” terrain.
Requirement for more equity One way for a bank to deal with the risk of a DSCR is to limit the size of the loan and therefore require the equity in the project to be increased. For the same cash flow level, the terms for interest and loan repayment decrease and hence the DSCR increases. In this way the risk for the bank is brought back to an acceptable level.
However, for the project this means that the equity to debt ratio increases. Since the dividends for equity providers are higher than the interests for debt, the cost of capital increases leading again to a higher cost price for the energy produced.
A project developer may reduce the bank’s risk by putting the investment on the balance sheet. If the company’s credit is good the bank will be willing to loan more money (at more attractive rates), leading again to lower capital costs.
Interest rates A common way for banks to hedge against higher risks is the use of higher interest rates. The higher interest rate then covers for the probability of project failure. This is not so much applicable to project finance, where a single project must be able to fulfill all its obligations, but more applicable to a situation where a

– 42 –
project developer has a portfolio of projects. The total risk profile of the portfolio then determines the applicable interest rate.
4.4 Independent ratings
Independent credit rating agencies such as Moody’s and Standard & Poor’s traditionally issue independent ratings for credit. This system is broadly used to rate companies’ solvency. With the arrival of project finance for large projects (e.g. in the oil and gas industry) the rating system has been extended to include large infrastructural works as well. It is nowadays being used in the power industry and in the renewable energy sector. Banks often have their own rating systems for evaluating the portfolio risk, but these systems are quite similar to the one described here. Ratings are given traditionally given on a letter scale, where AAA or Aaa is the highest ranking and C or D is the lowest ranking. The scale measures the probability that a company or company is able to fulfil its debt payments timely. Default of payment is therefore defined as missing a single payment. A triple A rating is given to loans for which payment of debt services is beyond doubt. Usually AAA ratings or only given to governments. A few exceptions exist where companies have an AAA rating. Recently, being the last oil and gas company with a triple A rating, Shell was downgraded to an AA status. In case of a C or D rating the probability of default is very high. Table 4.3 gives an overview of typical annual default rates for the various rating classes. Ratings are divided in two classes. BBB or Baa ratings and above are called Investment Grade. Lower grades are called Speculative Grade (sometimes called “junk”). This distinction is important as it determines the amount of capital available for loans. Some investors are not allowed to invest in speculative grade loans.

– 43 –
Table 4.3 Rating system
Moody’s S&P Interpretation
Aaa AAA Highest quality Aa AA High Quality A A Strong payment capacity
Investment grade
Baa BBB Adequate payment capacity Ba BB Adverse conditions could lead to
payment difficulties B B Adverse conditions will likely lead to
payment difficulties Caa CCC Moody’s: sometimes default; S&P
vulnerable to default Ca CC Moody’s: often default; S&P highly
vulnerable to default C C Moody’s: lowest rated; S&P bankruptcy
filed without default
Speculative grade
D Payment is in default
The higher probability of default is reflected in the higher interest rates demanded for speculative grade loans. The difference between interest rate and the risk free interest rate is called the spread. The spread (or in case of bonds the effective interest rate reflected in lower bond prices) is the only way to cover the cost of defaults. It is noteworthy that the interest rates for investment grade loans do not differ considerably. There are strong theoretical arguments to assume that there is a relation between credit spreads and the risk-free interest rate level. First, under the simplifying assumptions that investors are risk-neutral and the recovery rate given default is constant and known, there exists a purely mathematical relation between the two. Consider for simplicity a one period risky bond and assume that the recovery rate given default is zero. If EDF denotes the expected default frequency (or the probability of default), market equilibrium implies
)1()1()1( YTMEDFi +⋅−=+

– 44 –
where i is the risk-free one period rate and YTM the promised yield on the risky debt. This relation impliess the following for the credit spread sp:
EDFEDF
iiYMsp−
+=−=1
)1(
This formula implies that the spread is exactly high enough to recover the losses due to defaults. In practice the interest is determined by many other factors: historical interests, the state of the economy, the recovery rate of debts in default, etc. Public bonds are not completely comparable to bank loans. There is evidence that bank loans have higher recovery rates than public bonds, once in default. This is probably due to the fact that the companies which have bank loans are more closely followed and that often the loans are better secured with banks having senior rights over the assets of the company. Therefore the interest spreads for bank loans are usually lower than for public bonds. In fact the interest spread for investment grades are almost independent of the rating. Figure 4.2 gives an overview of the recovery rates for the different types of loans in the market.
Figure 4.2 Recovery rates for defaulted debt

– 45 –
Figure 4.3 Historical default rates for corporate bonds6
Average default rates refer to the number of defaults per year in a given rating class. It is also interesting to look at average cumulative default rates in rating classes. Figure 4.4 gives an overview of the default rates for 5, 10, 15 and 20 years. The graph shows again that the default rates increase remarkably with the initial rating class.
6 Historical Default Rates of Corporate Bond Issuers, 1920-1999, S.C. Keanan,
Moody’s, January 2000.

– 46 –
Figure 4.4 Cumulative default rate for 5-, 10-, 15 and 20-years
4.5 Risk management
While the prime objective of risk management in project finance is to ensure that the project remains financially viable, there are other risks involved that cannot be tackled solely with using the standard tools of financial risk management. Although the final risk structure will vary from project to project according to the negotiation positions of the various parties, the fundamental principle of project finance remains the same: each risk should be allocated to the party that can best control or manage it. Sources of risks are varied and extend through all the phases of a project. Project risks cover:
− development and construction
− operation and maintenance
− financial risks
− force majeure

– 47 –
The development and construction of renewable energy plants can be a phase where high risks are involved. For most of types of contracts the risks for the developer have been covered either by turnkey contracts or strong Engineering, Procurement and Construction contracts, where included schedule and performance liquidated damages that involve monetary compensation for failure to meet deadlines or predetermined performance levels. In case of the offshore wind farms, it is not obvious who should manage the risks. Instead of EPC contracting, some parties are now discussing other types of contracts where the various contractors each bear their own risks, but where they are bound to each other by strong interface contracts.
The assessment of risks over the second major phase in the life of the project – operation and maintenance – is fundamental because these affect its long term viability and determine the level of funds that both sponsors and lenders will receive throughout its life. The risk that the project fails to meet specific performance criteria is best mitigated by making these criteria a part of the construction agreement with contractor. However, addressing maintenance risk is equally important to ensure undisturbed cash flows from the facility. Most of the time the contractor will offer a guarantee during the first period after commissioning. After that a maintenance contract will cover normal repairs and maintenance. In the wind industry manufacturers start to offer full-service maintenance contracts for the first period of operation, but also for the period from 5 to 10 years, because this eases the negotiations with the banks.
Of course, the primary risk that a project faces is economic: will it generate sufficient revenue to meet its financial obligations by certain dates. In many cases it is worth the cost to narrow down the uncertainties as much as possible. A detailed assessment of the possibility to get the required permits and consents and a consequent go/nogo decision can limit the investment in projects that have a low risk of ever being completed. A wind resource assessment may considerably narrow down the uncertainty in the wind farm energy yield giving more confidence to investors and banks by reducing the risk of low performance.
– 48 –
5 Stake holder’s perception of risk and renewable energy
5.1 Introduction
In many cases it is possible to develop a quantitative measure of the risk involved in the development or the investment of a project. However, these decisions are made by people, who have their own perception of the risk involved in these projects.
The goal of this chapter is to develop an idea
• how different stakeholders look at renewable projects
• how they perceive the risks involved in these projects in terms of
− technology maturity
− market risk
− regulatory risk
To this end we have carried out a survey among 650 stakeholders and carried out a number of in-depth interviews with key-players in the market.
5.2 Results of survey
The policy instruments which EU member states have currently put in place, aim at promoting investments in renewable energy sources by removing barriers and reducing risks. We have approached a group of more than 650 stakeholders who are involved in RES investments to obtain their views on the risks and barriers for investments. The group we approached consisted of representatives in the electric power industry, renewable energy project developers and investors, manufacturers of RES technologies, banks, NGOs and governmental agencies across current and candidate EU member states. The questionnaire asked their opinion on the following main items:
– 49 –
- which risks (technological, market and regulatory) are relevant for investments in renewables
- which sources are least and most subject to such risks
- which countries provide least and most risks for investments
- which barriers are faced in project development.
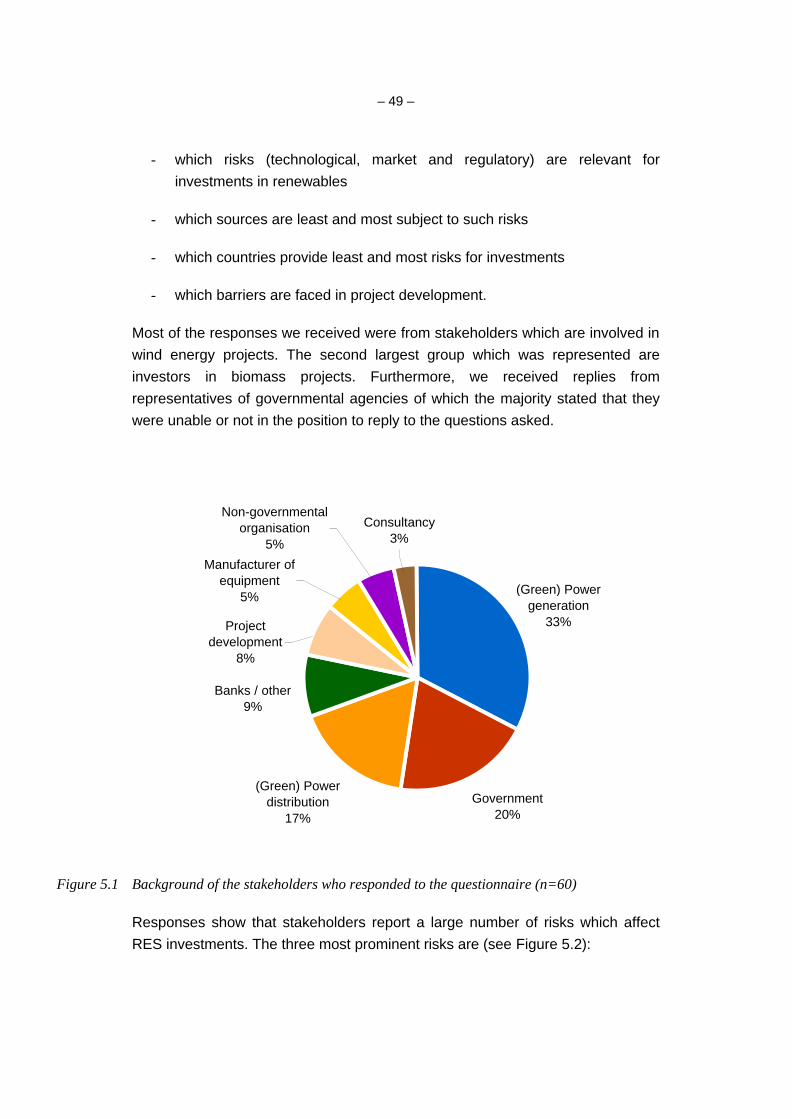
Most of the responses we received were from stakeholders which are involved in wind energy projects. The second largest group which was represented are investors in biomass projects. Furthermore, we received replies from representatives of governmental agencies of which the majority stated that they were unable or not in the position to reply to the questions asked.
(Green) Power generation
33%
Government20%
(Green) Power distribution
17%
Banks / other9%
Project development
8%
Consultancy3%
Manufacturer of equipment
5%
Non-governmental organisation
5%
Figure 5.1 Background of the stakeholders who responded to the questionnaire (n=60)
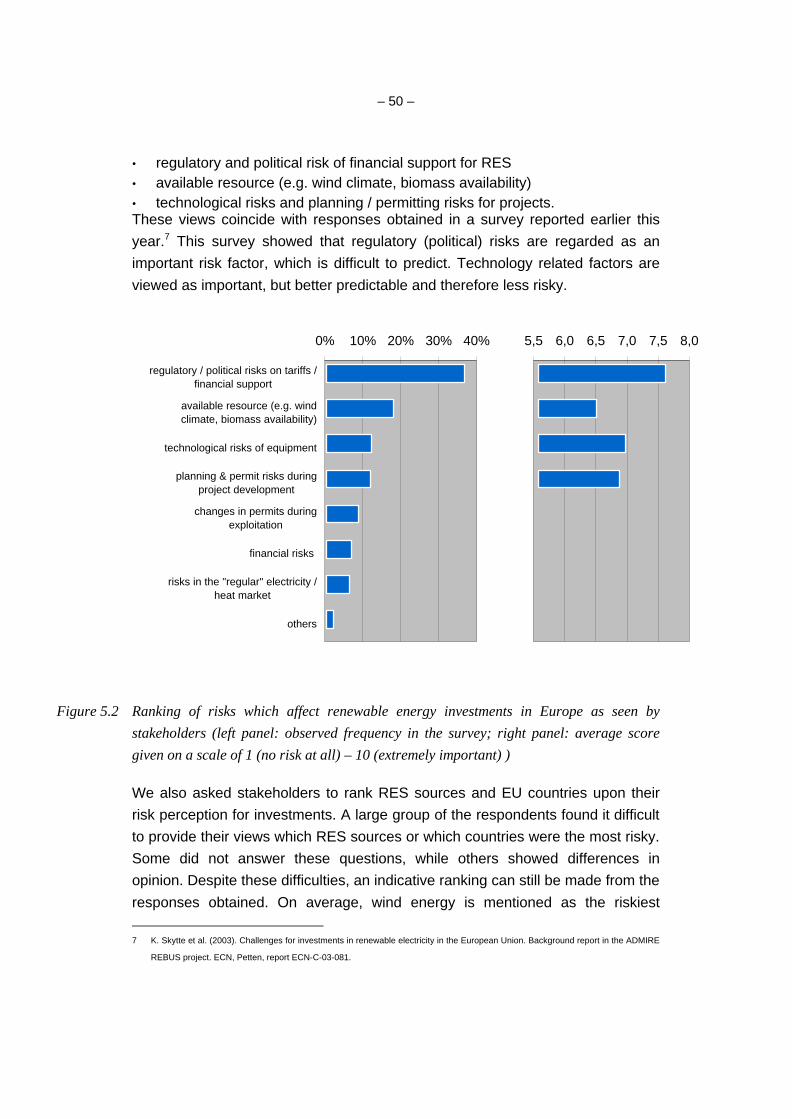
Responses show that stakeholders report a large number of risks which affect RES investments. The three most prominent risks are (see Figure 5.2):
– 50 –
• regulatory and political risk of financial support for RES • available resource (e.g. wind climate, biomass availability) • technological risks and planning / permitting risks for projects. These views coincide with responses obtained in a survey reported earlier this year.7 This survey showed that regulatory (political) risks are regarded as an important risk factor, which is difficult to predict. Technology related factors are viewed as important, but better predictable and therefore less risky.
5,5 6,0 6,5 7,0 7,5 8,0
regulatory / political risks on tariffs /financial support
available resource (e.g. windclimate, biomass availability)
technological risks of equipment
planning & permit risks duringproject development
0% 10% 20% 30% 40%
regulatory / political risks on tariffs /financial support
available resource (e.g. windclimate, biomass availability)
technological risks of equipment
planning & permit risks duringproject development
changes in permits duringexploitation
financial risks
risks in the "regular" electricity /heat market
others
Figure 5.2 Ranking of risks which affect renewable energy investments in Europe as seen by stakeholders (left panel: observed frequency in the survey; right panel: average score given on a scale of 1 (no risk at all) – 10 (extremely important) )
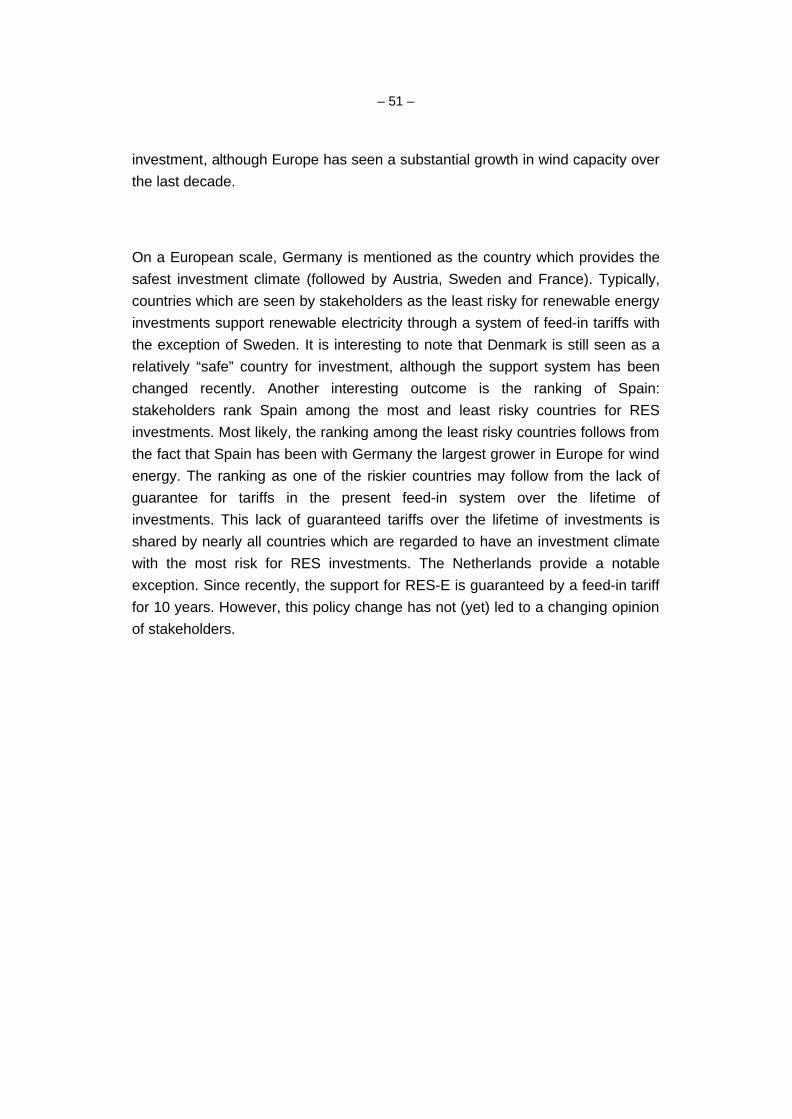
We also asked stakeholders to rank RES sources and EU countries upon their risk perception for investments. A large group of the respondents found it difficult to provide their views which RES sources or which countries were the most risky. Some did not answer these questions, while others showed differences in opinion. Despite these difficulties, an indicative ranking can still be made from the responses obtained. On average, wind energy is mentioned as the riskiest 7 K. Skytte et al. (2003). Challenges for investments in renewable electricity in the European Union. Background report in the ADMIRE
REBUS project. ECN, Petten, report ECN-C-03-081.
– 51 –
investment, although Europe has seen a substantial growth in wind capacity over the last decade.
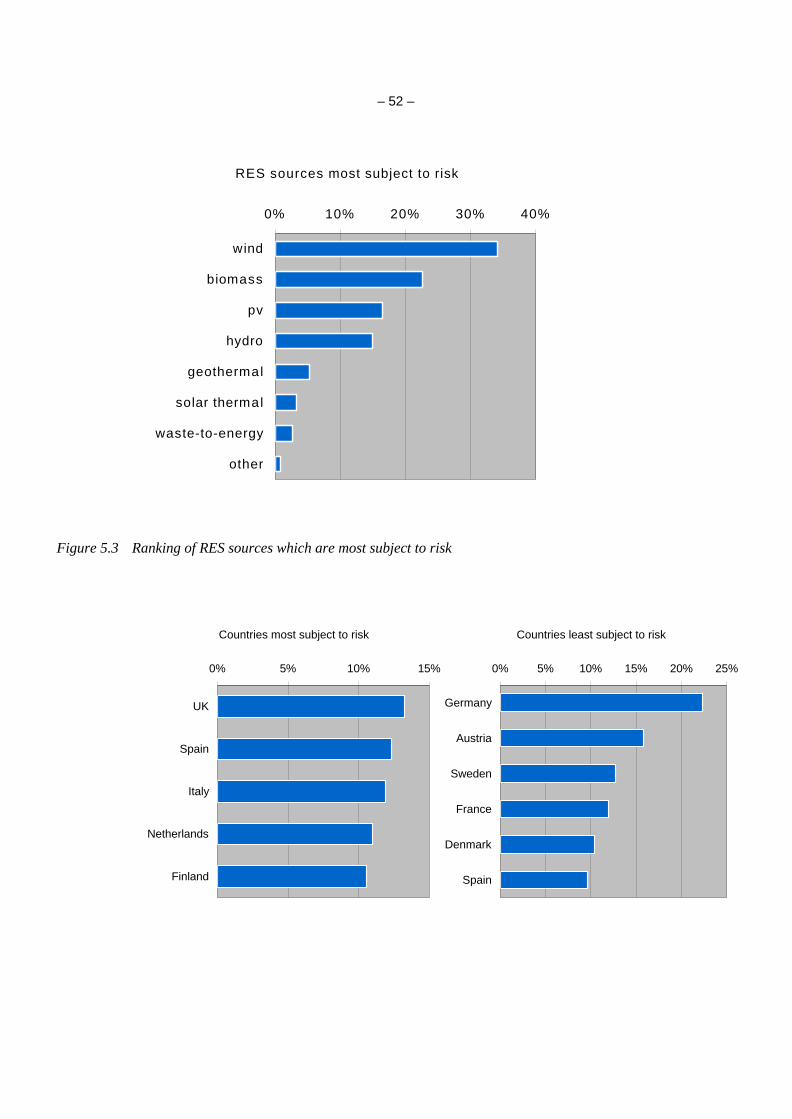
On a European scale, Germany is mentioned as the country which provides the safest investment climate (followed by Austria, Sweden and France). Typically, countries which are seen by stakeholders as the least risky for renewable energy investments support renewable electricity through a system of feed-in tariffs with the exception of Sweden. It is interesting to note that Denmark is still seen as a relatively “safe” country for investment, although the support system has been changed recently. Another interesting outcome is the ranking of Spain: stakeholders rank Spain among the most and least risky countries for RES investments. Most likely, the ranking among the least risky countries follows from the fact that Spain has been with Germany the largest grower in Europe for wind energy. The ranking as one of the riskier countries may follow from the lack of guarantee for tariffs in the present feed-in system over the lifetime of investments. This lack of guaranteed tariffs over the lifetime of investments is shared by nearly all countries which are regarded to have an investment climate with the most risk for RES investments. The Netherlands provide a notable exception. Since recently, the support for RES-E is guaranteed by a feed-in tariff for 10 years. However, this policy change has not (yet) led to a changing opinion of stakeholders.
– 52 –
RES sources most subject to risk
0% 10% 20% 30% 40%
wind
biomass
pv
hydro
geothermal
solar thermal
waste-to-energy
other
Figure 5.3 Ranking of RES sources which are most subject to risk
Countries most subject to risk
0% 5% 10% 15%
UK
Spain
Italy
Netherlands
Finland
Countries least subject to risk
0% 5% 10% 15% 20% 25%
Germany
Austria
Sweden
France
Denmark
Spain

– 53 –
Figure 5.4 Ranking of countries upon risk perception for RES investments (left panel: most risky countries; right panel: least risky countries)
In order to minimize risks stakeholders mention a combination of measures they take. The most important combination of risk mitigation measures contains the following strategies:
• we select projects carefully 24% • we require higher returns on investments 14% • we use contracts with guarantees 14% • we do not invest in renewables 12% • we are required to finance our investment with a larger equity share 12% • we invest only in selected renewable energy technologies 12%
and exclude others • we invest only in selected EU member states and exclude others 9% • we are required to pay a higher interest rate on loans 4%
Finally, stakeholders provided their opinion on barriers which they face in project development. It is evident that financial barriers in any form have impact on the development of new RES projects. Insecurity, either through uncertainties of investment subsidies or lack of guarantee of tariffs, is the most dominant barrier. Nearly 60% of the respondents have to deal with these uncertainties in project development.
Connection to the grid is another barrier for project development. Around 75% of the respondents mention barriers which are related to grid connection. However, weak grid conditions are reported in only 19% of the cases. The majority concerns unclear rules and monopolistic behavior of the grid operator. A promising signal, however, is that in nearly 25% of the cases grid connection is not seen as a barrier for project development.
Spatial planning and environmental procedures also provide barriers for project development. Unlike the situation for grid connection, nearly everybody reports barriers in this field: in only 4-5% of the cases spatial planning and environmental procedures do not form a barrier. Complexity of regulation and lengthy procedures are seen as the most important factors.
The situation of spatial planning and environmental procedures as a barrier for project development is to a large degree also reflected in the view on social
– 54 –
acceptance. Legal appeal procedures which follow spatial planning and environmental permitting procedures are mentioned by nearly 50% of the respondents as a lack of social acceptance for project development. The role of authorities is seen by nearly 25% as the second largest barrier. Only a minority, 14%, reports that lack of (local) social acceptance does not apply in their case.
5.3 Interviews
In addition to the questionnaire we held a number of interviews with representatives from the renewable energy industry to discuss the relation between risk and investments. These included representatives from
- International banks specialised in financing in project finance and more particular finance of renewable energy projects
- Project developers in the fields of offshore wind energy, onshore wind energy and biomass
This section gives an overview of the opinions expressed during these interviews.
From the interviews it became clear that the criteria that banks use for rating projects are more or less the same throughout the EU.
Technical risks for projects do not vary much over Europe and are judged on a European level. Regulatory risks do vary considerably over Europe. In a regulatory assessment the stability and the height of the support is taken into account. Long term feed-in tariffs are judged as being the most stable form of subsidy. Certificate system are considered less stable, but can still be a basis for project finance if the loans are shaped according to the length of the subsidy period.
The ability to pay the debt service is the driving force to judge projects. Various criteria are assessed to see whether a project will be able to make payments in time. The Debt Service Coverage Ratio is the most important financial yardstick to judge this and is the driving force for shaping the finance of projects. Higher risk projects are required to have a higher DSCR, meaning that these projects will have a lower gearing.

– 55 –
Offshore wind energy Offshore wind energy has not come of age yet. The track record for offshore wind power plants is very limited.
The Horns Rev project is the main reference project for banks and developers to gauge the risks and the technological status of offshore wind energy projects. Recently, the project owner Elsam announced that the nacelles of all the turbines will be removed and taken to shore for maintenance and overhaul. According to Elsam problems arose with the transformers in autumn 2003 and later it turned out that a large number of generators have production defects.
Since offshore wind energy has no proven track record it is not possible to obtain non-recourse project finance for new projects. This has a number of reasons:
- Offshore wind turbines are new type turbines having larger size than onshore wind turbines. They have no track record for offshore conditions yet.
- There is little experience with the logistics (both installation and operation & maintenance) of offshore wind energy installations and operation.
For this reason banks require a strong financial backing by the project sponsors before they are willing to give loans to offshore wind project. The construction and/or technological risks must be born by the wind turbine manufacturer or the EPC constructor, who is constructing the wind farm. After successful construction and a sufficient number of production hours there are possibilities for refinancing the projects through bank loans. At present debt in offshore projects is limited to 30% of the investment cost at a minimum Debt Service Coverage Ratio of 2.
The economies of scale would seem to drive offshore wind farms to larger sizes. This applies to manufacturing the turbines, the logistics of the installation and O&M, the electrical connection to the grid. However, the risk profile of the projects will probably limit the size of the wind farms to something n the order of 500 MW per project or 1 billion Euros per project. Banks prefer to build a portfolio of projects and prefer to spread their risks over a number of projects. A typical share in a project loan (through a participation in a bank syndicate) is in the order of 50 million Euros. Moreover most wind turbine manufacturers, lack sufficiently strong balance sheets to give the necessary guarantees for proper operation of the wind farms. The need for financially strong parties in offshore wind

– 56 –
development could lead to (further) mergers in the wind industry, or it might limit the growth of offshore wind.
Onshore wind energy The boom in the development of onshore wind energy has been accompanied with increased confidence in project developers and technologies. The largest risk in the development of onshore wind energy is still in the development or planning stage. In most countries getting consent is the most important (financial) risk.
Although the procedures for estimating the wind resource have long been developed, the wind resource remains also a prime source for financial risk. Sources of wind resource uncertainty are:
− The lack of reliable reference data to estimate the long term wind resource
− Uncertainty when modelling complex, mountainous terrain
− Annual variations in the energy output of wind farms due to bad and good wind years.
In countries with flat terrain it is possible to estimate the wind resource either from meteorological measurements, or by comparing the estimates with the output of wind farms in the vicinity of the planned wind farm. In other locations, more complex terrain it is essential and required by the financial institutions to obtain reliable wind speed measurements for estimating the wind resource. The uncertainty in the wind farm power output ranges from 8-10% for the most precise estimates to 20-30% under difficult circumstances. This uncertainty in the energy yield prediction is taken into account by the banks. For estimating the cash flow from the project, banks will generally use the P90-estimate (the cash flow with a 90% probability of being exceeded).
The participants in the interviews explained that the majority of wind farms were corporate financed. Those that received project finance obtained higher debt to equity ratios but the criteria for getting finance are more severe. They stressed that in order to obtain project finance debt service had to be secured by water tight contracts with suppliers, wind turbine manufacturers and offtakers.
Banks explained that they used internal risk assessment procedures, which were reviewed by external rating agencies on a regular basis. The procedures and
– 57 –
criteria followed were in line with the procedures described by e.g. Standard and Poor’s criteria for the rating of power projects (see also chapter 4).
Some interviewed persons expressed concern about the fast developments in wind energy technology. Under pressure of the offshore wind energy development has rapidly increased the size of the turbines. This is in itself not a problem as the size of wind turbines has been increasing since the beginning of wind turbine development. However, up to now most wind turbine manufacturer have scaled up their turbines, using thoroughly tested and well understood technology. However, the new generation large wind turbines has been build involving most of the time an important shift in technology8. Banks are following these developments with care. In order to be rated as mature technology, they require that new type wind turbines are operated for one year without problems.
Typical IRR’s required for onshore wind farms are in the range from 12-15%.
Biomass According to the interviewed banks biomass projects are in a critical phase. Review of the existing projects reveals that in most cases they do not meet the initial expectations in terms of production. Most installations need more oversight and maintenance than originally planned resulting in lower electricity generation. The next new biomass plant is seen as a benchmark for rating biomass projects. In case a new plant will not be successful, this could have a negative effect on the biomass sector. Banks could then decide to withdraw from giving loans to new projects.
Given this situation typical IRR’s for new biomass projects were estimated at 20-25%.
Support mechanisms Presently, all renewable energy options require some kind of financial support. Both banks and project developers favour stable support mechanisms, since this secures the cash flows from the projects.
Stability of the support mechanism consists of two elements:
8 Are wind turbines growing to fast, G.A.M. van Kuik, Delft University of Technology,
EWEC proceedings.

– 58 –
- Stability of the regulatory framework
- Stability of the level of support
From the interviews it became clear that the market needs time to adapt to new regulatory conditions. It takes time to get used to new conditions, develop financial structures that are the best response to the market conditions and develop a track record that offers the participants the experience from which they can assess the market risk. People prefer a stable, non-perfect system over systems that never get the time to settle.
In general the length of the loan period offered by banks is related to the stability of the guaranteed support period. The loans in Italy and the Netherlands have a shorter tenor than in Germany. In the Netherlands the loan tenor is restricted to the period over which the subsidy is granted.
It is considered to be an advantage if the level of the support is fixed. In this case the incoming cash flow can be determined with a high level of confidence. In case of a certificate system the price of the certificates is determined by the market conditions, i.e. the obligation the government sets for buying certificates. In case of project finance banks will require projects to secure the income by closing long term projects for the off-take of certificates. This means that other parties take over the market risk involved.
Banks and risk portfolio The way banks have to take into account risk in their loan portfolio has recently changed considerably. Traditionally, banks were obliged to reserve 8% of outstanding loans on their balance as coverage for credit risk, irrespective of the actual risk of the loans. Following serious bank crises in the 90’s it was realised that this does not reflect the real risk of a bank portfolio. The so-called Basel treaty now prescribes that bank use a quantitative method to assess the credit risk of their portfolio. For high risk projects banks have to set aside more money than for less risky projects. This is considered to have important consequences for the way banks handle their portfolio risk. One of the consequences is for risky project the bank’s return on equity will decrease; the interest spread remains the same, while the equity reserved for the project increases, hence the return on such a project decreases.
– 59 –
Conclusion From the interviews it became clear that the criteria that banks use for rating projects are more or less the same throughout the EU.
Technical risks for projects do not vary much over Europe and are judged on a European level. Regulatory risks do vary considerably over Europe. In a regulatory assessment the stability and the height of the support is taken into account. Long term feed-in tariffs are judged as being the most stable form of subsidy. Certificate system are considered less stable, but can still be a basis for project finance if the loans are shaped according to the length of the subsidy period.

– 60 –
6 The role of risk in financing renewable energy projects
6.1 Introduction
Meeting the EU’s renewable objectives requires large-scale investments. The Commission’s white paper on renewable energy predicted an investment requirement of approximately € 150 billion between 1997 and 2010.
It is generally accepted that risk levels are reflected in the cost of capital required for funding renewable projects. There are two main reasons for this observation:
• Higher project risks limit the amount of debt that can be raised for a project. In general equity is more expensive than debt
• Higher project risks imply that equity providers require higher returns in the project
In this chapter we use the WACC (Weighted Average Capital Cost) as measure for the cost of capital. WACC is composed of the debt interest rates and required returns on equity. We will look at the influence of risk on both sources of capital.
6.2 The relation between support mechanism and project risk
The two predominant support mechanisms in the EU are:
• systems where a guaranteed feed-in tariff is paid for renewable electricity for a period of time
• generators receive certificates when renewable electricity is fed into the grid. These certificates may be sold in the market to (1) offset a renewable portfolio obligation or (2) to provide buyers of electricity with certified green electricity.
In terms of financial return and risk these schemes have different characteristics, which are listed in table 6.1.

– 61 –
Table 6.1 Overview of financial return and risk under different support mechanisms Feed in tariffs Certificate scheme Common characteristics Fixed rates
Usually fixed period Fixed technologies
Fluctuating prices Period not determined Fixed technologies
Guarantees Government Supplier IRR Maximised by law
Minimum set by investors and banks
Maximised by market conditions Minimum set by investors and banks
Largest risk Site/technology Regulatory change
In case of feed-in tariffs, the government takes over an important part of the risk a generator faces. A generator receives a fixed price (guaranteed by the government) for the power he generates during a usually fixed period. The height of the feed-in tariff is set by the government and generally determined such that the generator is able to make a reasonable profit taking into account the reduced risk he is exposed to.
In case of a certificate scheme, the price a generator can get for the renewable electricity produced is not fixed. Instead the price is determined by the demand in the market for renewable electricity, which can either be an artificial demand created by either a renewable portfolio obligation or by creating generous price conditions for consumers of renewable electricity. The market conditions are reflected in price uncertainty, but the financial return of generators is not limited by price level set by the government. The largest risk a generator faces is the regulatory risk because the market conditions can dramatically change, e.g. in case the governments changes future targets, or new entrants of competing renewable electricity generators enter the market with competing price offers.
In general it is seen that the cost of capital in certificate markets is higher, because:
• Maximum debt is limited because cash flows are less secure.
• Investors require a higher risk premium because the expected project returns are less certain.
– 62 –
As participants (banks, investors, etc.) build up experience with the market conditions, confidence in the system may grow leading to a decrease in the required risk premiums.
6.3 Project finance through commercial bank debt
Until now, the majority of debt finance has been provided by commercial banks. Most large renewable energy projects have been financed on balance sheet by large companies, or have been project financed using commercial bank debt. Lately, wind energy projects have been refinanced after they had been brought together in a portfolio of wind energy projects. The portfolio of wind energy has a better risk profile which gave the opportunity of financing new projects at advantageous criteria.
Given the size of the investments and the funds needed in the future, the capital market could become an alternative for providing finance in an efficient and competitive manner. At present this option is not being used for financing renewable power projects. It seems that for the time being bank loans provide a readily available, large source of finance.9 We concentrate therefore on the role of bank loans as the major source of debt for renewable energy projects. We look at the role of risk for providing finance to projects. This is done for the two types of bank loans that we consider, i.e. project finance and corporate finance.
Different ways for raising commercial bank debt Power projects have generally raised finance by two main methods: loans to a developer backed by the cash flow from ownership of a number of assets, or project loans backed by the revenue of individual generating plant. In this section we compare two financing routes for renewable energy: on balance sheet and off balance sheet financing. Off balance sheet finance is also referred to as project finance.
9 Exploring capital markets and securisation for renewable energy projects, Haggard et al.
Impax Capital Corporation Ltd., ETSU K/BD/0215/REP, 2000.
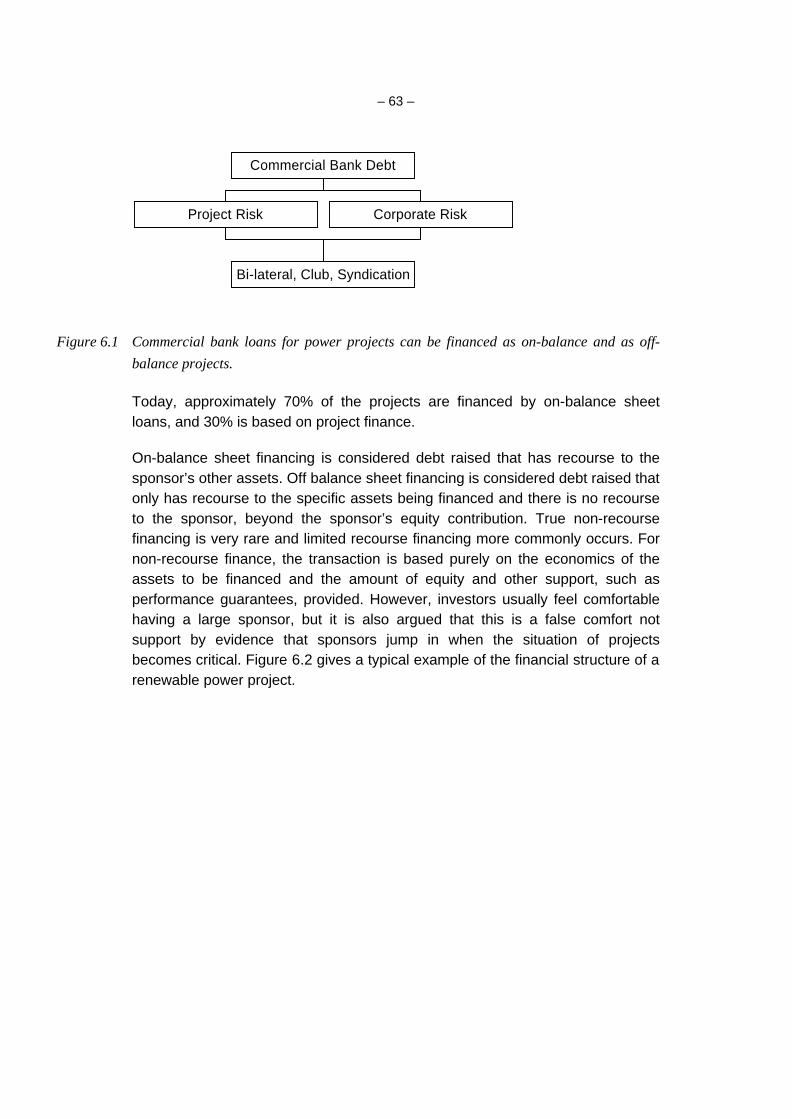
– 63 –
Project Risk Corporate Risk
Bi-lateral, Club, Syndication
Commercial Bank Debt
Figure 6.1 Commercial bank loans for power projects can be financed as on-balance and as off-balance projects.
Today, approximately 70% of the projects are financed by on-balance sheet loans, and 30% is based on project finance.
On-balance sheet financing is considered debt raised that has recourse to the sponsor’s other assets. Off balance sheet financing is considered debt raised that only has recourse to the specific assets being financed and there is no recourse to the sponsor, beyond the sponsor’s equity contribution. True non-recourse financing is very rare and limited recourse financing more commonly occurs. For non-recourse finance, the transaction is based purely on the economics of the assets to be financed and the amount of equity and other support, such as performance guarantees, provided. However, investors usually feel comfortable having a large sponsor, but it is also argued that this is a false comfort not support by evidence that sponsors jump in when the situation of projects becomes critical. Figure 6.2 gives a typical example of the financial structure of a renewable power project.

– 64 –
Figure 6.2 Example of a structure of a power project
The amount that can be borrowed through the balance sheet is directly linked to the size of that balance sheet and the existing level of borrowing. Off-balance sheet funds are in theory a function of the credit quality of the underlying cash flows and the coverage ratios required, therefore size is hardly a constraint.
For on-balance sheet finance the ratio of loan and equity is usually kept below 70% and in many cases below 30%. This is due to the fact that the cash flows are less well defined and that the company has the freedom to apply those cash flows in any area of business. However, in evaluating projects, companies often use a 30/70 debt/equity ratio as a starting point for their financial assessment and regard it internally as a non-recourse project. In contrast, most non-recourse financing starts at 70% gearing and may achieve up to 95% gearing. This is due to long term contracts that match the financing tenor and provide predictable revenue flows that are only linked to operating efficiency. The result of higher loan to equity ratios is improved Return on Equity as interest rates are mostly lower that required RoE.
Special Purpose Vehicle
Offtakers
Contractor
Security Trustee
Shareholder
Shareholder
Government
Shareholders’ agreement Offtake
agreement
Construction contract
Loan Agreement
Security Agreements
Direct Agreement
Direct Agreement
Subsidy Lenders

– 65 –
Interest cost On balance sheet financing is concerned with the credit standing of the entire company and as a result this tends to favor established, large companies. The interest rates at which the companies are able to finance their projects are in the range of 0.35%-0.60% above EURIBOR interest rates.
In general, due to the limited possibilities for recovery in case of a project default the interest rates for project finance are higher. Non-recourse transactions have a higher interest rate spread at approximately 1% over EURIBOR.
Bankability Bankability is not directly an issue for debt issued through the balance sheet, as the bankability is determined mainly to the sponsor’s size and balance sheet strength. For projects, it refers to the credit worthiness of each party and the contractual links of those parties to the project. Banks will look into this carefully, and take care that contracts with suppliers, EPC and off-takers build in warranties for the project and keep risks to acceptable limits. Banks and independent rating agencies use formal and informal ways to assess the credit risk of a project. Projects have to meet minimum criteria in order to bankable through commercial debt; at least a BB or Ba grade is required to attract commercial debt. Assuming that the risk factors are sufficiently mitigated, it is ultimately the free cash flow that determines how much debt a project is able to carry. As described in chapter 4 renewable energy technologies having different risk profiles force banks to require different debt service coverage ratios. Further, under the restriction of maximum DSCR the length and height of loans is influenced by the price level, duration and stability of the support mechanism in a country.
It is important to note that contracts and warranties are not sufficient to guarantee a bankable project. In general it is better to mitigate potential risk, such as supplier risk, than to secure them through contracts. This is an important factor in obtaining bankable projects.
6.4 Return on Equity
Investors, who provide equity in renewable energy options, require a financial return on the capital they provide. The return they expect to receive is dependent on the risk they expect to be exposed to. Both the expected return and the perceived risk are not absolute figures, but are viewed in relation to other investment opportunities. A widely used way of expressing the relationship
– 66 –
between investment risk and financial return is given by the CAPM-theory. The fundamental idea underlying the CAPM is that risk-averse investors demand higher returns of assuming additional risk, and higher-risk assets are priced to yield higher expected returns than lower-risk assets. The CAPM quantifies the additional return, or risk premium, required for bearing incremental risk, and provides a risk-return relationship anchored on the basic idea that only market risk matters, as measured by ß. According to the CAPM, assets are priced such that the expected return is the sum of a risk-free rate plus a risk premium, according to:
)( fmfi RRRR −⋅+= β
in which Ri denotes expected Return on Equity, is the risk-free rate and Rm denotes the average return in the financial market. According to CAPM-theory, the factor ß is a sufficient and complete measure of risk for diversified investors. It measures the volatility or risk in the asset’s return relative to that of the financial market as a whole.
To apply the CAPM, we need three quantities, the risk-free rate Rf, the ß-factor and the risk premium Rf – Rm. Estimates on the risk premium can be obtained from e.g. studies of historical stock and bond returns over long term periods of time. Table 6.2 gives an overview of historical risk premiums in various countries around the world. Germany, Italy and Japan have high risk premiums, which should be corrected for historical events bringing them in the same range as the other countries. For Europe the risk premium ranges from 2.7% in Denmark to 5.8% in France. However, it is argued in Dimson et al. that for future calculations, one should use the world risk premium instead of the country-by-country figures, since these have been influenced by historic events, which are not likely to recur. Therefore, we suggest using a risk premium of 5% in the calculations for returns on equity.
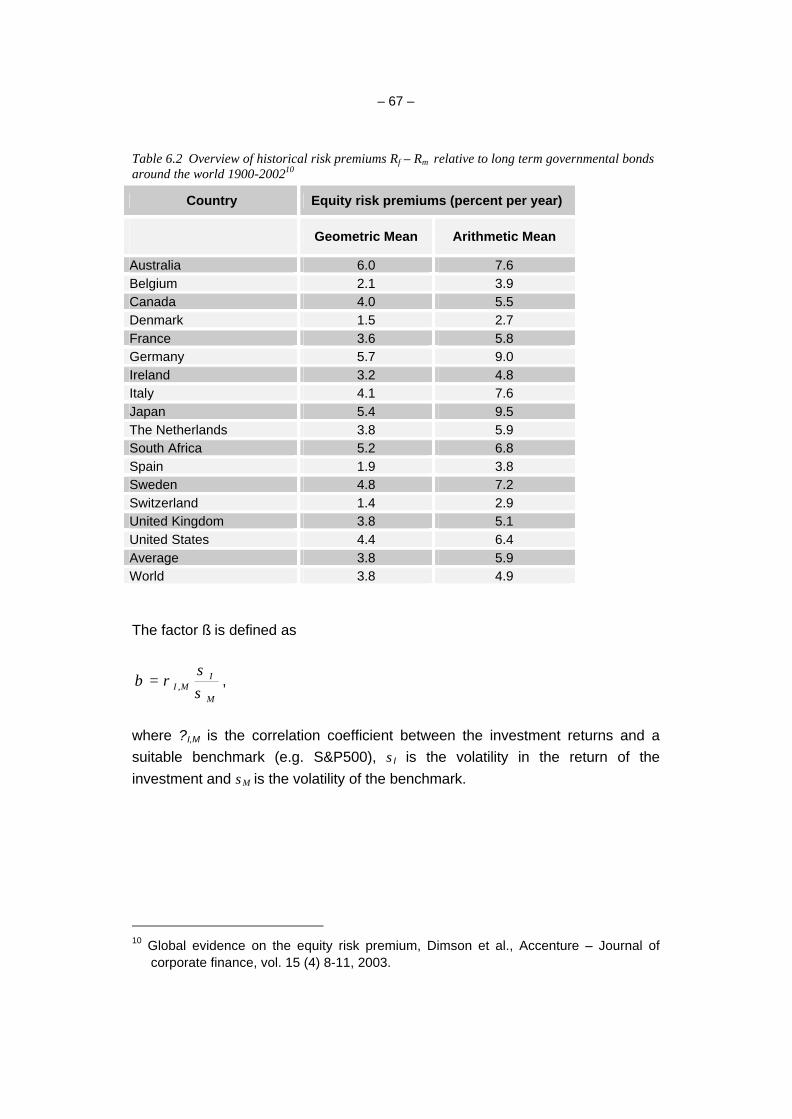
– 67 –
Table 6.2 Overview of historical risk premiums Rf – Rm relative to long term governmental bonds around the world 1900-200210
Country Equity risk premiums (percent per year)
Geometric Mean Arithmetic Mean
Australia 6.0 7.6 Belgium 2.1 3.9 Canada 4.0 5.5 Denmark 1.5 2.7 France 3.6 5.8 Germany 5.7 9.0 Ireland 3.2 4.8 Italy 4.1 7.6 Japan 5.4 9.5 The Netherlands 3.8 5.9 South Africa 5.2 6.8 Spain 1.9 3.8 Sweden 4.8 7.2 Switzerland 1.4 2.9 United Kingdom 3.8 5.1 United States 4.4 6.4 Average 3.8 5.9 World 3.8 4.9
The factor ß is defined as
M
IMI σ
σρβ ,= ,
where ?I,M is the correlation coefficient between the investment returns and a suitable benchmark (e.g. S&P500), s I is the volatility in the return of the investment and sM is the volatility of the benchmark.
10 Global evidence on the equity risk premium, Dimson et al., Accenture – Journal of
corporate finance, vol. 15 (4) 8-11, 2003.
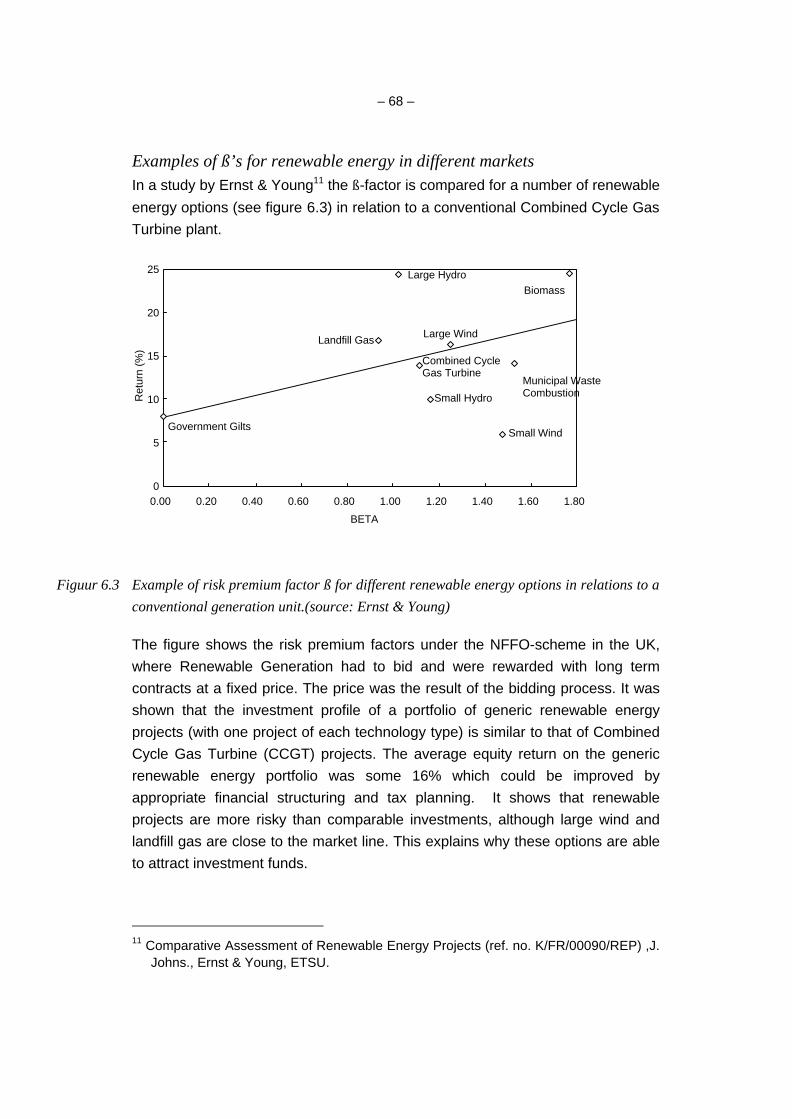
– 68 –
Examples of ß’s for renewable energy in different markets In a study by Ernst & Young11 the ß-factor is compared for a number of renewable
energy options (see figure 6.3) in relation to a conventional Combined Cycle Gas Turbine plant.
Figuur 6.3 Example of risk premium factor ß for different renewable energy options in relations to a conventional generation unit.(source: Ernst & Young)
The figure shows the risk premium factors under the NFFO-scheme in the UK, where Renewable Generation had to bid and were rewarded with long term contracts at a fixed price. The price was the result of the bidding process. It was shown that the investment profile of a portfolio of generic renewable energy projects (with one project of each technology type) is similar to that of Combined Cycle Gas Turbine (CCGT) projects. The average equity return on the generic renewable energy portfolio was some 16% which could be improved by appropriate financial structuring and tax planning. It shows that renewable projects are more risky than comparable investments, although large wind and landfill gas are close to the market line. This explains why these options are able to attract investment funds.
11 Comparative Assessment of Renewable Energy Projects (ref. no. K/FR/00090/REP) ,J.
Johns., Ernst & Young, ETSU.
BETA
Ret
urn
(%)
Government Gilts
Landfill Gas Large Wind
Combined Cycle Gas Turbine
Small Hydro
Small Wind
Biomass Large Hydro
0.00 0.20 0.40 0.60 0.80 1.00 1.20 1.40 1.60 1.80
5
10
15
20
25
0
Municipal Waste Combustion

– 69 –
In a Bear & Stearns12 study different wind energy developing companies in Germany are compared to each other. Table 6.3 gives an overview of the comparison.
Table 6.3 Comparison of wind energy development companies in Germany Debt-to-
Equity ratio Beta Cost of
Equity WACC
Energiekontor 0.00% 0.86 9.21% 9.21% Planbeck 0.00% 0.76 8.79% 8.79% P&T Technology 0.00% 1.04 10.06% 10.06% Umweltkontor 9.26% 0.78 8.79% 8.37% Risk free rate 4.98% German Risk Premium 4.91% Base Rate (Industry Beta) 0.69 source: Bear & Stearns International Ltd.
The table shows that the beta perceived in Germany for the development of wind energy is considerable lower than the one described above. Wind farms developers make their profits for a combination of high value-added wind farm projecting with a transfer of assets usually to a high number of individual high tax-payers in a so-called wind fund. This combination enables wind farm developers to realise significant margins during project design and wind farm maintenance phase, because individuals can deduct start-up losses from wind farms from their taxable income. The guaranteed feed-in tariff offers long term certainty on future cash flows. Wind funds typically offer 7-8% return on investment. Although wind fund investors incur all risks tat are associated with their wind farm, a wind fund from a will-maintained wind farm that was planned with conservative wind forecasts resembles a bond fund. It is expected that the future market conditions require wind farm developers to offer more than just closed-end wind funds to the investment community with their bond fund character. Such funds require a high level of cash flow prediction into the long-term future. Changes in the market conditions and or the move to offshore wind development should be perceived as generally more risky, requiring a higher return on investment.
12 German wind farm developers, BearStearns, August 2001.

– 70 –
6.5 Weighted average cost of capital
In this paragraph we develop a model which links the risk level of a project to the Weighted Average Capital Cost (WACC). WACC is often used as an estimate of the internal discount rate of a project or the overall rate of return desired by all investors (equity and debt providers) in a company. It is defined as:
rTROEWACC ⋅−⋅−+⋅= )1()1( αα
where ROE denotes the desired return on equity, r is the interest rate, a denotes the equity percentage in the investment and T is the relevant tax rate for the company. This can either be company tax or income tax if the project is sponsored by private funders. The reason the tax rate appears in the formula is that interests are accounted for as project cost and result in lower taxes being paid by the project.
The WACC is an input to the GreenX-model to predict the future growth of renewable energy options. In this way the risk level of projects can be incorporated in the cost curves of the various renewable energy options, both as a function of the technology and the country of implementation.
In table 6.4 we give an overview of typical WACC under different support mechanisms and for different technologies. The basic assumptions for the WACC calculation are:
• As base case has been used wind onshore under a TGC (Tradable Green Certificate) scheme. For this case ß is taken equal to that of an a Combined Cycle Gas Plant13, i.e. ß = 1.6
• For biomass and offshore wind modifiers are used to reflect the higher risks for these technologies:
− ßoffshore = 1.4 ßonshore
• For a feed-in tariff scheme a ß is reduced by a factor 0.9 to reflect the higher stability and less risk in the financial return. In the special case of a wind fund
13 Best new entrant price 2002, Commission Decision, Commission for Electricity
Regulation, CER/01/180, December 2001

– 71 –
ß is further reduced to reflect the higher certainty of these funds and the lower required return
− ßFIT = 0.9 ßTGC
− ßWIND FUND = 0.5 ßTGC
• A debt/equity ratio of 70/30 is adopted as the base case, being the higher limit for on-balance finance and the lower limit for off-balance finance. In practice much higher gearing may be obtained for off-balance finance. In case of feed-in tariff scheme a 75/25 debt equity ratio is used.
• Other assumptions:
− risk free rate 4.7%
− equity risk premium 5.0%
− corporate tax rate 30.0%
Table 6.4 Estimated Weighted Average Cost of Capital for different technologies and support mechanisms
Wind onshore Biomass Wind Offshore
TGC FIT Wind fund
TGC FIT TGC FIT
ßeq = ßbase .a tech .asupport 1.60 1.44 0.80 2.24 2.02 2.56 2.30
Required Return on Equity
10.4% 9.5% 6.3% 13.6% 12.5% 15.3% 14.0%
Post tax cost of debt 3.3% 3.3% 3.3% 3.3% 3.3% 3.3% 3.3%
Weighted Average Cost of Capital
5.4% 4.9% 4.0% 6.4% 5.6% 6.9% 6.0%
Reducing WACC by increasing Debt-Equity ratio WACC can be significantly reduced by increasing the Debt-Equity ratio. By borrowing money the effective ß of the project is increased and a higher return on equity is realised. However, the higher ß is also a measure of the risk involved in
providing equity to the project. Hence, increasing the leverage increases the expected return of the project, at the price of a higher risk profile. Ultimately,

– 72 –
leverage is limited by the lenders, who have to remain sufficiently confident that the project is able to pay the debt service at all times.