wp 6 deliverable 6.6 report on integrated sustainability ... · bioethanol is sugarcane. however,...
TRANSCRIPT

Seventh framework programme Food, Agriculture and Fisheries, and Biotechnology
Specific International Co-operation Actions
Small or medium scale focused research project
WP 6
Deliverable 6.6 : Report on integrated sustainability assessment
Composition of the consortium
CIRAD ICRISAT EMBRAPA KWS IFEU UNIBO UCSC ARC-GCI UANL WIP
SWEETFUEL / Grant Agreement n° 227422
Acknowledgements
The authors would like to thank all SWEETFUEL partners for the provision of the data and information, for their fruitful discussions, collaborations and cooperation, which form the basis of this report.
This work was supported by the European Commission’s Seventh Framework Programme (FP7) under Grant agreement no. 227422 (Duration 01/01/2009 – 30/06/2014).
Contact
Institute for Energy and Environmental Research Heidelberg (IFEU)
Wilckensstraße 3 69120 Heidelberg, Germany Phone: +49-6221-4767-0 Fax: +49-6221-4767-19 [email protected] www.ifeu.de
Suggested citation
Reinhardt, G., Keller, H. et al. 2014: Report on integrated sustainability assessment of the SWEETFUEL project, www.sweetfuel-project.eu, Heidelberg, 2014

SSSSweetweetweetweet FFFFueluelueluelSSSSweetweetweetweet FFFFueluelueluel
SWEETFUEL: Sweet Sorghum: an alternative energy crop
Deliverable 6.6: Report on integrated sustainability assessment Authors:
Reinhardt, Guido IFEU (WP-Leader) Keller, Heiko IFEU
With contributions of: Amaducci, Stefano UCSC Basavaraj, G. ICRISAT-IN Braconnier, Serge CIRAD Buschmann, Raoul KWS Cornelius, Christine IFEU Detzel, Andreas IFEU Garcia-Zambrano, Eduardo A. UANL Gutierrez-Diez, Adriana UANL Janssen, Rainer WIP Khawaja, Cosette WIP Magalhaes, Jurandir EMBRAPA Monti, Andrea UNIBO Parrella, Rafael EMBRAPA Parthasarathy Rao, P. ICRISAT-IN Purcino, Antonio Alvaro C. EMBRAPA Reddy, Belum V.S. ICRISAT-IN Rettenmaier, Nils IFEU Rodrigues, Jose A. Santos EMBRAPA Rutz, Dominik WIP Schaffert, Robert EMBRAPA Shargie, Nemera ARC Simeone, Maria Lucia F. EMBRAPA Snijman, Wikus ARC Srinivasa Rao, P. ICRISAT-IN Trevino-Ramirez, Jose Elias UANL Trouche, Gilles CIRAD Zacharias, Arndt KWS Zavala-Garcia, Francisco UANL Zegada-Lizarazu, Walter UNIBO
Heidelberg, 30 June 2014


Table of contents i
SSSSweetweetweetweet FFFFueluelueluelSSSSweetweetweetweet FFFFueluelueluel
Table of contents – overview*
Executive summary 1
1 Introduction, goal and scope 3
2 Methodology 5
2.1 General procedure, specifications, definitions and settings 5
2.2 Integrated sustainability assessment 8
3 Description of scenarios 13
3.1 Sweet sorghum scenarios 13
3.2 Biomass sorghum scenarios 21
3.3 Summary: scenario overview 25
4 Results 27
4.1 Summary: Environmental assessment 27
4.2 Summary: Economic assessment 38
4.3 Summary: SWOT analysis 41
4.4 Integrated sustainability assessment 46
5 Conclusions, recommendations and outlook 62
5.1 Conclusions 62
5.2 Recommendations 69
5.3 Outlook 72
6 References 74
7 Annex 78
7.1 Scenario data 78
7.2 Additional results 79
7.3 Methodology environmental assessment 81
7.4 Methodology economic assessment 88
7.5 Methodology SWOT analysis 93
8 Glossary and abbreviations 97
* for a detailed table of content see next page
ii SWEETFUEL: Report on integrated sustainability assessment
SSSSweetweetweetweet FFFFueluelueluelSSSSweetweetweetweet FFFFueluelueluel
Table of contents
Executive summary 1
1 Introduction, goal and scope 3
2 Methodology 5
2.1 General procedure, specifications, definitions and settings 5
2.2 Integrated sustainability assessment 8
2.2.1 General approach 8
2.2.2 Collection of indicators and results 9
2.2.3 Additional indicators 9
2.2.4 Benchmarking 12
2.2.5 Overall comparison 12
3 Description of scenarios 13
3.1 Sweet sorghum scenarios 13
3.1.1 Cane fallow scenarios 13
3.1.2 Grain to food scenarios 15
3.1.3 Syrup production scenario 19
3.2 Biomass sorghum scenarios 21
3.2.1 Biogas and biomethane production 21
3.2.2 Second generation ethanol 22
3.2.3 Direct combustion 23
3.2.4 Gasification 24
3.3 Summary: scenario overview 25
4 Results 27
4.1 Summary: Environmental assessment 27
4.1.1 Global / regional environmental impacts 27
4.1.2 Local environmental impacts 32
4.1.2.1 Sweet sorghum scenarios 33
4.1.2.2 Biomass sorghum scenarios 36
4.2 Summary: Economic assessment 38
4.2.1 Sweet sorghum to ethanol 38
4.2.2 Biomass sorghum to biogas and biomethane 40
4.2.3 Biomass sorghum to alternate products 40
Table of contents iii
SSSSweetweetweetweet FFFFueluelueluelSSSSweetweetweetweet FFFFueluelueluel
4.3 Summary: SWOT analysis 41
4.3.1 Complementary results: Ethical assessment 43
4.4 Integrated sustainability assessment 46
4.4.1 Selection of indicators 46
4.4.2 Additional indicators 48
4.4.3 Overview of data 49
4.4.4 Categorisation 52
4.4.5 Comparison energy sorghum vs. conventional products 52
4.4.6 Benchmarking of energy sorghum scenarios 55
5 Conclusions, recommendations and outlook 62
5.1 Conclusions 62
5.1.1 General 62
5.1.2 Sweet sorghum 64
5.1.3 Biomass sorghum 66
5.2 Recommendations 69
5.2.1 Specific recommendations for sweet sorghum 69
5.2.2 Specific recommendations for biomass sorghum 70
5.2.3 General recommendations for energy sorghum 71
5.3 Outlook 72
6 References 74
7 Annex 78
7.1 Scenario data 78
7.2 Additional results 79
7.3 Methodology environmental assessment 81
7.3.1 Life cycle assessment (LCA) 81
7.3.1.1 Settings for Life cycle Impact Assessment (LCIA) 81
7.3.1.2 System boundaries 83
7.3.1.3 Further methodological issues 83
7.3.1.4 Data origin and data quality 84
7.3.2 Life cycle environmental impact assessment (LC-EIA) 84
7.4 Methodology economic assessment 88
7.4.1 Conceptual framework for economic assessment 88
7.4.2 Cost categories 88
7.4.3 Cost and revenue estimation 88

iv SWEETFUEL: Report on integrated sustainability assessment
SSSSweetweetweetweet FFFFueluelueluelSSSSweetweetweetweet FFFFueluelueluel
7.4.4 Geographical differences and Exchange Rates 89
7.4.5 Cost aggregation 90
7.4.6 Discounting 90
7.4.7 Uncertainty in cost data and sensitivity analysis 90
7.4.8 Capital and Operational cost and assumptions for economic assessment 91
7.4.9 Systematic exclusions in the study for economic assessment 91
7.4.10 Data origin and data quality 92
7.5 Methodology SWOT analysis 93
7.5.1 The SWOT analysis 93
7.5.2 Objective of the analysis 93
7.5.3 Stakeholder involvement 94
7.5.4 Structure of the SWOT analysis 94
8 Glossary and abbreviations 97

Executive summary 1
SSSSweetweetweetweet FFFFueluelueluelSSSSweetweetweetweet FFFFueluelueluel
Executive summary
Increasing world market prices for fossil fuels, driven by limited reserves, growing demand and instability in producing regions make renewable fuels such as bioethanol or biogas eco-nomically more attractive. Bioethanol is one of the most prevalent biofuels in the world and represents an actual alternative fuel for the transport sector. Worldwide, the main source of bioethanol is sugarcane. However, the cultivation of this crop cannot be realised in water-limited regions. On this background , sweet sorghum (Sorghum bicolor (L.) Moench) has several advantages due to its efficiency in both water use and nutrient uptake. Another vari-ant of this plant, termed biomass sorghum, is adapted to high biomass yields especially in temperate regions. It is a promising alternative feedstock for biogas production. The SWEETFUEL project funded by the European Commission mainly aims at developing sweet sorghum cultivars for tropical and semi-arid regions and biomass sorghum cultivars for tem-perate environments. The production of these variants and the use of their products such as bioethanol or biogas may represent a sustainable alternative to meet future energy needs.
An integrated sustainability assessment is performed as part of the SWEETFUEL project. It primarily analyses whether a mature and large-scale cultivation and use of sweet and bio-mass sorghum in 2020 provides benefits from environmental, economic and social perspec-tives primarily compared to the use of fossil fuels. This sustainability assessment applies a generic and scenario-based comparison of whole life cycles from cradle to grave. It collects, joins and extends results of the preceding environmental and economic assessments as well as of the SWOT analysis, which covers further sustainability aspects especially in the social domain, and the ethical assessment. These results are integrated into an overall picture us-ing multi-dimensional comparison metrics and a structured transparent discussion to be able to derive consistent recommendations and highlight potential conflicts.
Several scenarios regarding the production and use of sweet and biomass sorghum were defined as a common basis for all assessments of individual sustainability aspects (environ-mental, economic, social) and for the integrated assessment. Three different approaches of sweet sorghum cultivation and use are assessed in several scenarios each: Cultivation on fallows between cycles of sugarcane with a focus on fuel production also from grains (“Cane fallow”), substitution of grain sorghum cultivation with co-production of food and fuel (“Grain to food”), and non-mechanised cultivation with a focus on keeping a big part of the fuel value chain in the villages through concentrating sugar juice to syrup (“Syrup production”). In all scenarios, the main product is ethanol. The main biomass sorghum scenarios involve cultiva-tion that aims at high biomass yields for biogas production. Alternatively, the combustion of the biomass and the production of second generation fuels is analysed (second generation ethanol via fermentation and synthetic Fischer Tropsch fuels via gasification).
Results of the integrated sustainability assessment show that the production and use of sweet and biomass sorghum can cause a wide spectrum of potential impacts ranging from significant benefits to distinctly detrimental impacts. Responsible for the individual outcome are factors such as the use of the by-products (for sweet sorghum scenarios), the choice and

2 SWEETFUEL: Report on integrated sustainability assessment
SSSSweetweetweetweet FFFFueluelueluelSSSSweetweetweetweet FFFFueluelueluel
configuration of the conversion process (for all scenarios) but also external factors like land availability, prices and the way energy is produced elsewhere. The observed variability of results leads to concrete recommendations under which conditions and, if so, how sweet and biomass sorghum cultivation and use should be implemented.
In general, social impacts are mostly neutral to positive as long as land rights are respected. The results of the economic assessment show that there are options to produce and use both sweet and biomass sorghum profitably via the approaches “Cane fallow” and “Grain to food” (sweet sorghum) or via biogas production (biomass sorghum). For “Syrup production” (sweet sorghum) and 2nd generation fuel production (biomass sorghum), profitability is not immediately achievable and requires more or less substantial process improvements or sub-sidies depending on the assessed scenario. The profitable scenarios mostly also come along with the highest climate change mitigation and energy resource savin gs potentials be-cause energy efficiency is very important for all of these aspects. To realise these potentials for environmental benefits, further optimisations are needed like the prevention of methane leaks from biogas plants, which may result in some extra costs but should not prevent profit-ability as such. Therefore, an implementation of sorghum-based fuel and energy production does not require continuous financial support beyond existing programs but some regulatory guidelines to improve sustainability. However, all scenarios lead to additional environmen-tal burdens mainly caused by intensive agriculture such as acidification, excess nutrient inputs into ecosystems or detrimental local effects on soils and biodiversity. This pattern of environmental advantages and disadvantages is common for most biofuels from annually cultivated biomass. A political process is needed in each concerned region to decide how far these disadvantages are acceptable in return for the advantages.
A further major limitation for sweet and biomass sorghum cultivation is the availability of agricultural land . In any case, direct or indirect clearing of valuable ecosystems for its culti-vation and violation of land rights have to be avoided. In this respect, specific advantages of sorghum should be taken advantage of to mitigate competition about land: For sweet sorghum, the use of co-products such as grains and surplus bagasse, which is not required for powering the conversion process, as feed or food can reduce the demand of land for separate food / feed production elsewhere. This way, an integrated production of these prod-ucts and fuels on the same land using sweet sorghum may in some cases even suffice with less total area than separate cultivation without fuel production. For biomass sorghum, drought tolerance and resistance against a certain pest may open up opportunities for culti-vation, which are not available to competing energy crops such as maize. To take ad-vantages of these particular properties, energy sorghum cultivation has to be integrated into overall strategies for land and biomass use on a regional and national level. This requires a full sustainability assessment for any concretely planned and publicly supported large scale energy sorghum cultivation project.
In summary , the production and use of sweet and biomass sorghum as studied in the SWEETFUEL project can be designed largely sustainably. However, several environmental disadvantages typical for many biofuels have to be accepted by society. Particular opportuni-ties for sweet and biomass sorghum cultivation arise from the plants’ properties. Thus, sweet and biomass sorghum are a valuable addition to the portfolio of energy crops. Specific op-tions for the realisation of this potential have been identified.
1 Introduction, goal and scope 3
SSSSweetweetweetweet FFFFueluelueluelSSSSweetweetweetweet FFFFueluelueluel
1 Introduction, goal and scope
Bioethanol contributes to the increasing use of biofuels. Worldwide, sugarcane is the main source of bioethanol. However, the cultivation of this crop cannot be realised in water-limited regions. On this background, sweet sorghum (Sorghum bicolor (L.) Moench) has several advantages due to its efficiency in both water use and nutrient uptake. Furthermore, the pro-duction of food, feed and fuel can be combined in one crop. This is an important asset on the background of the currently increasing discussion on fuel production and food security. An-other variant of Sorghum bicolor (L.) Moench, termed biomass sorghum, is adapted to high biomass yields especially in temperate regions. Drought tolerance and resistance against specific pests make it a promising alternative feedstock for biogas production.
As the more widespread use of sweet and biomass sorghum for bioethanol and biogas pro-duction is primarily limited by the lack of variants specifically bred for this purpose, a project funded by the European Commission with the title “SWEETFUEL: Sweet Sorghum: an alter-native energy crop” was launched (Grant agreement no. 227422). The SWEETFUEL project aims at developing sweet sorghum cultivars for tropical and semi-arid regions and biomass sorghum cultivars for temperate environments. The focus lies on tolerance to cold, drought and acidic soil as well as on a high production of stalk sugars, easily digestible biomass or grains – depending on the climatic region the crop shall be cultivated in and depending on the purpose it shall be used for. Properties and cultivation conditions of energy sorghum are described in the energy sorghum handbook /Khawaja et al. 2014/. This project was split in seven work packages (WPs). WPs 1-5 focussed on breeding aspects as well as cultivation and harvest practices. Based on the results of WPs 1-5, WP 6 performed a global assess-ment while WP 7 transferred project results to the stakeholders.
WP 6 “Integrated assessment” of the SWEETFUEL project provided a multi-criteria sustaina-bility assessment of several sorghum production and use pathways taking into account tech-nological, environmental, economic and social aspects.
This report is the outcome of Task 6.5 “Integrated assessment”. It was composed by IFEU with contributions from all SWEETFUEL partners, namely ARC, CIRAD, EMBRAPA, ICRISAT, KWS, UANL, UCSC, UNIBO and WIP. The report joins and integrates results from all other tasks of WP 6, which assessed individual sustainability aspects covering environ-mental, economic and social sustainability. While environmental and economic assessment results originate from the respective reports /Reinhardt et al. 2014/, /Basavaraj, Parthasara-thy Rao et al. 2014/, social aspects were covered in the SWOT analysis /Rutz & Janssen 2012a/. Furthermore, the picture is complemented by technological aspects of feasibility and risks /Braconnier et al. 2013/. The report on technological aspects also includes common scenarios based on common definitions and settings, which are the basis for all assessments of individual sustainability aspects.
The report on integrated sustainability assessment provides answers to the following core question:

4 SWEETFUEL: Report on integrated sustainability assessment
SSSSweetweetweetweet FFFFueluelueluelSSSSweetweetweetweet FFFFueluelueluel
• Which are the most sustainable options to use sweet and biomass sorghum as energy crops ?
To address the core question, the following issues were assessed:
• What are the advantages and disadvantages of the different sweet and biomass sorghum cultivation systems investigated in this project?
• What are the main influencing life cycle steps and where are the main optimisation potentials ?
• How do different usage pathways of the by-products affect the overall results? Which usage should be preferred considering all sustainability aspects?
The following chapter of the report defines general specifications and settings chosen to ad-dress these questions as well as the methodology of the integrated sustainability assessment (chapter 2). In chapter 3, short descriptions of sweet and biomass sorghum scenarios are presented. Results of the environmental assessment, the economic assessment, the SWOT analysis and the ethical assessment are summarised in chapter 4 followed by further results of the integrated sustainability assessment. Conclusions based on these results as well as recommendations and an outlook are presented in chapter 5. Chapter 6 lists references and in the annex (chapter 7), supplementary material can be found. Chapter 8 contains the glos-sary and abbreviations.

2 Methodology 5
SSSSweetweetweetweet FFFFueluelueluelSSSSweetweetweetweet FFFFueluelueluel
2 Methodology
This chapter describes the general procedure and defines general specifications and settings (subchapter 2.1) as well as the methodology of the integrated sustainability assessment (subchapter 2.2). The methodologies of the environmental and economic assessments as well as of the SWOT analysis are summarised in subchapters 7.3 to 7.5 in the annex.
2.1 General procedure, specifications, definitions and settings
The sustainability assessment in the SWEETFUEL project is based on the so called integrat-ed life cycle sustainability methodology (see /Keller et al. 2014/). For this project it was modi-fied to the needs of all goal and scope questions: it follows a three stage approach (see Fig. 2-1). First, scenarios, general definitions and settings were described in the technologi-cal assessment /Braconnier et al. 2013/. These settings are summarised in the following par-agraphs of this subchapter. In a second stage, individual sustainability aspects were as-sessed based on these settings in the environmental assessment, economic assessment and SWOT analysis with further input from an ethical assessment /Reinhardt et al. 2014/, /Basavaraj, Parthasarathy Rao et al. 2014/, /Rutz & Janssen 2012a/, Bursztyn 2014/. This way, consistency of the assessments of individual sustainability aspects can be ensured. In the third stage, all sustainability aspects are joined in the integrated sustainability assess-ment, which is subject of this report.
Fig. 2-1 Overview of the sustainability assessment approach in SWEETFUEL. SWOT: Strengths, Weaknesses, Opportunities, Threats.
Integrated assessment of sustainability
Technological assessment
Ethical assessment
Economic assessment
SWOT analysis
Environmentalassessment

6 SWEETFUEL: Report on integrated sustainability assessment
SSSSweetweetweetweet FFFFueluelueluelSSSSweetweetweetweet FFFFueluelueluel
Definition of sorghum variants
Sorghum is a crop which has quite a large diversity in phenotypic variability and composition. In the SWEETFUEL project the following terminologies are used:
Sweet sorghum : Sorghum cultivars with juicy stems and high juice sugar content in their stalks; potentially used as an energy and / or food crop.
Biomass sorghum : Sorghum cultivars with high lignocellulosic biomass yield, potentially used as energy crop.
Energy sorghum : Sweet and biomass sorghum cultivars used in this project.
Grain sorghum : Sorghum cultivars with high grain yield established as food and feed crop.
Fibre sorghum : Sorghum cultivars with a high content of fibre; potentially used as fibre or energy crop.
This project mainly focuses on sweet and biomass sorghum, whereas grain sorghum is treated as reference system. Fibre sorghum is not investigated in this project.
Time frame
In this project the use of sweet and biomass sorghum for both 1st generation and 2nd genera-tion fuel technologies is assessed. The former, i.e. the production of bioethanol, is already well-established. In contrast, second generation technologies such as the production of eth-anol from lignocellulose or the biomass gasification for so-called BtL (Biomass-to-Liquid) fuels are not yet commercially available, however, pilot and demonstration plants are operat-ed in some countries (e.g. Europe, USA, Brazil, China, India). In this project prospective conditions given in the year 2020 are considered as main scenario since it is expected that the technology described will be mature then and thus comparable with other 1st generation ethanol production technologies. Additionally, the situation in 2015 is described for some scenarios since this reflects the state of the art at the end of the project, which is currently existent in Brazil for instance.
Geographical coverage
Sweet sorghum: In general, sweet sorghum is a manifold plant which can be cultivated in many parts of the world. Due to its high efficiency in water use and light exploitation it is par-ticularly suitable for semi-arid and subtropical areas. Additionally, however, it is also thor-oughly suitable for tropical regions. Thus, the following definitions are set for sweet sorghum cultivation:
• Subtropical / semi-arid climate with around 700 mm rainfall
• Tropical climate with around 1,200 mm rainfall per year.
Biomass sorghum: In future, biomass sorghum will be mainly cultivated to obtain high bio-mass yields for biogas production. This requires protruding growing conditions. Coming along with the recent discussion on fuel versus food as well as political regulations, biomass

2 Methodology 7
SSSSweetweetweetweet FFFFueluelueluelSSSSweetweetweetweet FFFFueluelueluel
sorghum has a high potential to be cultivated especially in temperate regions. Thus, for this investigation biomass sorghum scenarios are only settled in those areas.
Within the regions investigated in this project, there might be great variations due to differ-ences in environmental conditions as well as due to varying production practices and condi-tions in different countries. These differences are captured by sub-scenarios and sensitivity analyses taking into account various yields, uses of products and by-products or production costs etc. It is outside the scope of the project to analyse every single country where sweet or biomass sorghum could be produced.
Functional unit
The functional unit has to be chosen depending on the questions to be answered. As the project aims at increasing the output of the crop by developing improved cultivars and since land usually is the limiting factor, the use of sorghum cultivars from 1 hectare of land in 1 year is assessed.
Alternative land use options
The alternative land use defines how the land would be used if energy sorghum was not cul-tivated. It also comprises any change in land cover induced by the cultivation of energy sor-ghum. As agricultural land is becoming increasingly scarce, more and more natural land (e.g. forests or grass land) is transformed into arable land. Such land use and land cover changes may have considerable influences on the outcomes of the environmental assessment since e.g. the area’s carbon stock or biodiversity are influenced. For example, a decline in above-ground and below-ground carbon stocks leads to greenhouse gas emissions, which have to be included in the greenhouse gas balance. Beside direct land use changes also indirect changes can occur. This is the case if for example the cultivation of sweet sorghum displaces the production of a food crop to other areas. Depending on use and / or land cover of that area, the displacement can cause different environmental effects.
In this project, the standard scenario refers to reference systems where the difference in car-bon stock between initial vegetation and energy sorghum cultivation is close to zero. This includes reference systems such as degraded soils, degraded pastures or land that becomes free due to the intensification of existing land use. Furthermore, also idle land can be used to cultivate energy sorghum. In the further course of the report all these land use options are referred to as “idle land” .
In order to derive a bandwidth of different vegetation types for the alternative land use, two reference systems are identified, which are captured by sensitivity analyses:
• Dense thickets / sparse forests (carbon loss around 60 t carbon / hectare)
• Wooded grassland / planted pastures / (carbon loss around 15 t carbon / hectare)
This classification is mainly oriented at the carbon difference which occurs if reference vege-tation is replaced by energy sorghum cultivation. The carbon loss given here serves the pur-pose to characterise the reference systems. It does not reflect real carbon contents but serves as an indicative differentiation between the different reference systems defined.

8 SWEETFUEL: Report on integrated sustainability assessment
SSSSweetweetweetweet FFFFueluelueluelSSSSweetweetweetweet FFFFueluelueluel
Since the alternative land use differs among scenarios, more detailed descriptions are speci-fied within respective scenario descriptions (see subchapters 3.1 and 3.2).
Technical reference
The technical reference describes the technology to be assessed in terms of plant capacity and development status / maturity. As the investigated scenarios cover both “central” and “decentralised production at village level” two main technical references were defined:
• 25,000 – 120,000 t ethanol per year production capacity in the case of centralised pro-duction.
• 3 t syrup per day in the case of decentralised production.
• For all plant capacities, mature, full-scale industrial plants are assessed.
2.2 Integrated sustainability assessment
This subchapter describes the methodology of the integrated sustainability assessment, which builds on results from previous assessments of individual sustainability aspects in en-vironmental and economic assessment as well as SWOT analysis /Reinhardt et al. 2014/, /Basavaraj, Parthasarathy Rao et al. 2014/, /Rutz & Janssen 2012a/. The methodologies of the assessments of individual sustainability aspects are summarised in subchapters 7.3 to 7.5 in the annex.
2.2.1 General approach
Energy sorghum can be cultivated and used in several ways. These options are represented in this assessment in the form of scenarios. On each scenario, various indicators on econom-ic aspects, environmental aspects (assessed via screening LCA and LC-EIA), social aspects (assessed via SWOT analysis) and additionally technological aspects are made available in this study. All these aspects are integrated into an overall picture to facilitate comparisons between the options.
There are two general options to integrate this information:
Weighting and mathematical integration
All indicators could be mathematically combined into one score using weighting factors or ranked otherwise according to a weighting algorithm. These approaches cannot be entirely based on scientific facts but depend on personal value-based choices defined beforehand. Furthermore, conflict situations do not become apparent and decisions regarding these conflicts depend on weighting factors, which are hard to understand for decision makers not involved in the study. Therefore, this approach is not applied.
2 Methodology 9
SSSSweetweetweetweet FFFFueluelueluelSSSSweetweetweetweet FFFFueluelueluel
Structured discussion
All strengths, weaknesses and conflicts of the options can be discussed verbally argumenta-tively. This can make conflicts transparent and enable their active management. Considering the amount of options and indicators, this requires a structured approach. This approach is followed in this study. This section describes the methodology used for the structured com-parison and presentation of decision options based on a multi criteria analysis.
2.2.2 Collection of indicators and results
Indicators and results for all scenarios are provided by the individual assessments /Braconnier et al. 2013/, /Reinhardt et al. 2014/, /Basavaraj, Parthasarathy Rao et al. 2014/, /Rutz & Janssen 2012a/. They are collected in overview tables. In some cases, indicators are selected or aggregated by the authors of the respective individual assessment to focus on the most relevant aspects for decision support. No further adjustments are made except for rescaling quantitative data to a common basis if necessary. Thus, all specific settings, meth-odological choices including underlying estimates, and data sources apply unchanged as documented in the respective reports.
For comparability to qualitative indicators, quantitative indicators are categorised and the table is coloured accordingly. Results are rated advantageous (green) if the assessed sce-nario is better than the respective conventional reference scenario and the difference is big-ger than 10 % of the bandwidth of all results for this indicator under standard conditions. Dis-advantageous results are rated analogously and the rest is rated neutral. Net land use is categorised as disadvantageous if it is as high as the direct land use, advantageous if it is below zero and neutral for values in between. The investment sum is not categorised be-cause there is no reference value.
2.2.3 Additional indicators
Climate protection under the condition of limited financial resources has to use the available financial resources as efficiently as possible. Efficiency means here to achieve the highest possible greenhouse gas (GHG) emission savings with the lowest monetary expenditures necessary for that. CO2 avoidance costs are frequently used as indicator for this purpose. CO2 avoidance costs are defined as quotient of the differential costs for a CO2 reduction measure and the avoided CO2 emissions by this measure.
In analogy to CO2 avoidance costs, similar additional efficiency indicators can be defined for other quantitative sustainability indicators. In this case, such indicators are available from the screening LCA like for example acidification (basis for SO2 avoidance costs) or resource de-pletion (basis for non-renewable energy savings costs). The same methods apply for those indicators as discussed in the following for the example of CO2 avoidance costs.
CO2 avoidance costs are used for microeconomic decisions as well as for the decisions in energy policy. Microeconomic decisions are always based on business analyses. If political decisions like the implementation of support programmes are concerned, the valuation is often more difficult, as the macroeconomic dimension, possible external effects as well as

10 SWEETFUEL: Report on integrated sustainability assessment
SSSSweetweetweetweet FFFFueluelueluelSSSSweetweetweetweet FFFFueluelueluel
second- and third-round effects have to be considered. For the determination of CO2 avoid-ance costs, different methodological characteristics have to be considered concerning:
• The determination of a reference, which is e.g. for biofuels the use of fossil fuels.
• The inclusion of different cost items (e.g. full costs vs. additional costs).
• The inclusion of temporal dynamics of systems under consideration (e.g. developments of investment costs of systems, of prices for energy carriers, etc.).
• The different perspectives – especially microeconomic and macroeconomic approaches.
However, the sole consideration of CO2 avoidance costs is often not sufficient to come to sustainable decisions. On the one hand, they do not contain any information about the amount of emissions that can be avoided and on the other hand, they do not take other envi-ronmental impacts into account. Therefore, CO2 avoidance costs do not represent a single combined indicator resulting from the sustainability assessment but only one additional crite-rion.
CO2 avoidance costs from a microeconomic perspective are calculated as follows:
)(referenceemissionsGHGemissionsGHG)(reference costscosts
costsavoidanceCO2 −−−−−−−−====
CO2 avoidance costs are expressed in euro per tonne of CO2 equivalents. Costs refer to the support in € maximally required to make an investment attractive (i.e. to reach an expected rate of return of 25 % without green premium product prices unless specified otherwise) and greenhouse gas emissions (GHG emissions) expressed in CO2 equivalents.
One methodological option is to discount the avoided CO2 emissions for the calculation of the avoidance costs as well, in order to create a preference for temporally preceding measures. Otherwise a later realisation of the measure could be reasonable for decision makers. More-over, a discounting reflects an assumed uncertainty about the degree and the time point of the environmental impact.
∑∑∑∑++++
====−−−−====
n
0tti1
temGHGbenchmarkemGHGemGHG
)(
)()(
∆
Generally, a discounting of the environmental costs results in higher CO2 avoidance costs as without discounting. However, for further calculations in this study it is assumed that the dis-counting is neutralised by the fact that the environmental impact increases parallel to the so called social preference rate. The social preference rate consists of the time discounting and the growth accounting /Nordhaus 1994/, /IPCC 1996/, /Fankhauser 1995/. Therefore, the method without discounting is used.
As CO2 avoidance costs represent an efficiency indicator, they are only defined in the case that the primary goal is met, this is, that there are greenhouse gas emission savings by the process under investigation compared to the benchmark. If the goal is not met, one obviously cannot define an indicator on how efficiently the goal is reached. This means, the CO2 avoid-ance costs can be interpreted or not depending on the results of the numerator and the de-nominator.

2 Methodology 11
SSSSweetweetweetweet FFFFueluelueluelSSSSweetweetweetweet FFFFueluelueluel
Fig. 2-2 shows that out of nine possible result options only two allow an interpretation of the avoidance costs. If negative avoidance costs occur it has to be reconsidered if this results from the lower total costs or from the possibly higher emissions. Differences approaching zero make a calculation of avoidance costs impossible. If two differences are compared to each other, it can lead to disproportional influences of uncertainties. This is especially the case if either the emissions or the costs of the compared pathways are very similar. If for example the CO2 emissions of the two pathways differ by 10 % then a 5 % error of estimating these emissions can lead to a deviation in CO2 avoidance costs of 100 %. Furthermore, small emission savings mathematically lead to very high and at the same time very uncertain avoidance costs. Therefore, avoidance costs are only then a reliable indicator if the uncer-tainties of emissions and the costs are small compared to the respective differences between the pathways.
Fig. 2-2 Different result options for the calculation of CO2 avoidance costs (modified from /Pehnt et al. 2010/).
The second limitation is that avoidance costs are very prone to changes in the course of time because they can generally be very sensitive to changes as discussed above and they de-pend on the technological developments as well as market changes for two different sys-tems. Therefore, it is especially important only to compare avoidance costs if they are deter-mined for the same timeframe and under the same conditions. This makes it difficult to find comparable avoidance costs outside of this study although there is plenty of data on avoid-ance costs in literature. This especially applies to analyses of technologies not yet imple-mented for a timeframe more than a decade ahead as it is the case in this study.
Taken together, avoidance costs for environmental burdens such as greenhouse gas emis-sions can help to decide how mitigations of environmental burdens can be reached for the lowest price or even with profits. However, avoidance costs have to be interpreted carefully because in many situations their robustness and comparability are poor.
For further details and a critical review of the method see /Pehnt et al. 2010/.
∆ profit
∆ emissions
> 0 ≈ 0 < 0
< 0calculation possible(less costs than for
reference)
no calculation possible
calculation possible
≈ 0no calculation
possible
no calculation possible
(similar systems)
no calculation possible
> 0no CO2 avoidance
(not defined)no CO2 avoidance
(not defined)no CO2 avoidance
(not defined)

12 SWEETFUEL: Report on integrated sustainability assessment
SSSSweetweetweetweet FFFFueluelueluelSSSSweetweetweetweet FFFFueluelueluel
2.2.4 Benchmarking
For the comparison of many different processes, a common benchmark has to be defined. This benchmark has to be chosen according to the questions to be answered and the re-spective perspectives of various stakeholders. In this case, the benchmark could for example be the economically or environmentally most favourable pathway, or the currently most used option.
For all quantitative indicators, the benchmarking process involves calculating the differences between the respective scenario and the benchmark. These comparisons should serve as a decision support to answer the question whether a scenario performs better than the bench-mark regarding a certain indicator. Therefore, these quantitative differences are categorised into very advantageous [++], advantageous [+], neutral [0], disadvantageous [-], or very dis-advantageous [--]. A certain minimum difference was chosen as a cut off value for the cate-gory neutral. According to the purpose, this threshold is set as a percentage of the bandwidth from the best results to the worst result among all scenarios regarding a specific indicator. The certainty of this rating is evaluated by additionally taking the bandwidth of the data into account. If the scenario under consideration achieves better results under less favourable conditions than the benchmark does under standard conditions, it is rated very advantageous [++]. If not, but all direct comparisons under identical conditions show e.g. 10 % better results than the benchmark, it is rated advantageous [+]. If there is no bandwidth available for the scenario under consideration, it is rated very advantageous [++] if it is e.g. 10 % better than the benchmark under favourable conditions. For all qualitative indicators, rating of differences is done analogously but without applying minimum differences.
2.2.5 Overall comparison
For an overall comparison, a verbal argumentative discussion of decision options is support-ed by structured overview tables containing the integrated assessment results.
The integrated sustainability assessment of this project is based on six qualitative technolog-ical indicators originating from SWOT analysis, ten quantitative and five qualitative environ-mental indicators from environmental assessment, four quantitative economic indicators from economic assessment supplemented by two additional quantitative efficiency indicators with-in the integrated assessment, and seven qualitative social indicators from SWOT analysis and ethical assessment. These are a subset of all possible indicators, which were assessed in previous steps of the sustainability assessment and found to be relevant for the decision process. Depending on the question to be answered, overview tables may contain all or a part of these selected indicators and scenarios. Furthermore, the unit of reference is chosen according to the question.
3 Description of scenarios 13
SSSSweetweetweetweet FFFFueluelueluelSSSSweetweetweetweet FFFFueluelueluel
3 Description of scenarios
This project investigates several sweet and biomass sorghum cultivations and use pathways to determine optimised and sustainable sweet and biomass sorghum production and use systems. The systems under investigation are described in subchapters 3.1 and 3.2. Further details can be found in the report on technological assessment /Braconnier et al. 2013/.
3.1 Sweet sorghum scenarios
Generally, sweet sorghum cultivation and use is described in three different scenarios: cane fallow, grain to food and syrup production. In all scenarios the main product is ethanol. How-ever, the scenarios differ with respect to the processing of the sugar juice and the use of the by-products. In the cane fallow and syrup scenarios (see subchapters 3.1.1 and 3.1.3) grains are either used as fertiliser, for ethanol production or as feed. In the syrup production scenar-io the sugar juice is boiled down in a first processing step to syrup, which is used to produce ethanol in a further conversion process. The focus of the grain to food scenario (see sub-chapter 3.1.2) lies on the use of sweet sorghum as a multi-purpose crop to limit food / fuel trade-offs. This means that the grains are used as food whereas juice is used for energy pro-duction. In the following subchapters all scenarios are described in detail.
3.1.1 Cane fallow scenarios
In this project prospective conditions imaginable for the year 2020 are considered as main cane fallow scenario. Additionally, the situation in 2015 is described since this reflects the state of the art at the end of the project. Both scenarios are almost identical except the use of grains. In 2020, it is expected that the grains of sweet sorghum are used for ethanol produc-tion; however, in 2015 grains of sweet sorghum remain on the field, thus reducing the de-mand of mineral fertiliser.
Cane fallow
An overview of the cane fallow scenario is given in Fig. 3-1. After harvest, the sweet sorghum stalks and grains are transported from the villages to centralised ethanol facilities. The leaves either remain on the field (1 a) replacing mineral fertiliser or are used for energy production (1 b).
In the central ethanol production units, the sweet sorghum stalks are crushed and the juice is pressed out, leaving bagasse. The juice is fermented into ethanol which is used as transport fuel, replacing conventional gasoline.

14 SWEETFUEL: Report on integrated sustainability assessment
SSSSweetweetweetweet FFFFueluelueluelSSSSweetweetweetweet FFFFueluelueluel
Fig. 3-1 Schematic overview of the cane fallow scenario; numbers indicate scenario num-bers (for a summary of assessed scenarios see Table 3-1).
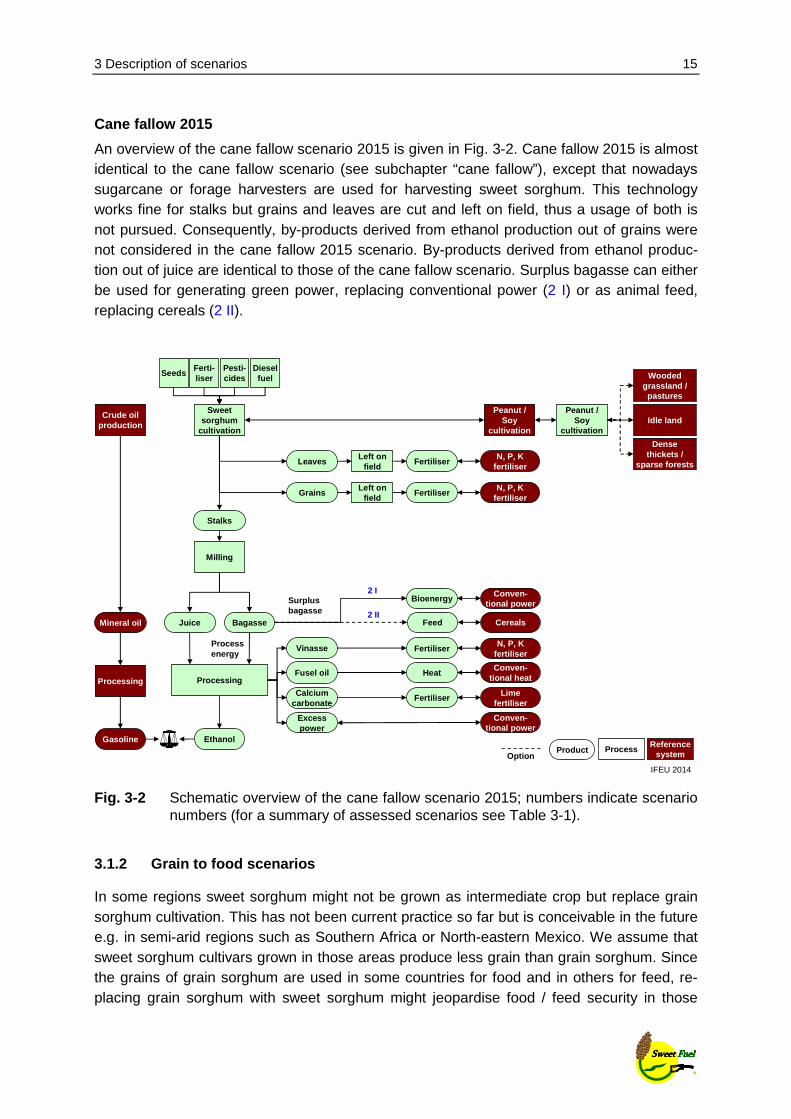
From the bagasse process energy is generated which is used internally in the ethanol pro-duction process. Surplus bagasse is either used for generating green power that is fed into the power grid, replacing conventionally produced electricity (1 I) or as animal feed, replacing cereals (1 II). In certain regions, bagasse is a very popular animal feed.
Other by-products derived during ethanol production are vinasse, stillage, excess power, fusel oils and carbonation lime. Vinasse is obtained as a by-product if sugar juice is pro-cessed and can be used as fertiliser, replacing mineral fertiliser. Stillage is a by-product, which occurs if grains are processed to ethanol and can be used as feed, replacing soy meal. Excess power can occur while process energy is generated from the bagasse, replac-ing conventional power. For energy generation, bagasse is combusted in a combined heat and power unit. If the heat demand is covered but less power is needed for the conversion process, excess power occurs which can be sold. Fusel oils are converted into heat, replac-ing conventional heat. In case of ethanol production from juice, carbonation lime is also de-rived as a by-product. Carbonation lime is used as fertiliser, replacing lime fertiliser.
Sweet sorghum
cultivation
Crude oilproduction
Processing
Product Process Reference system
Mineral oil
Peanut / Soy
cultivation
Stalks
Peanut / Soy
cultivation
Leaves Left on field
Fertiliser N, P, K fertiliser
Pesti-cides
Ferti-liser
Seeds Diesel fuel
Ethanol
Juice
Milling
BioenergyConven-
tional power
Vinasse
Fusel oil
Calcium carbonate
Fertiliser
Fertiliser
Heat
N, P, K fertiliser
Conven-tional heat
Lime fertiliser
Process energy
Feed Cereals
Gasoline
Surplusbagasse
Stillage
Fusel oil
Feed
Heat
Soy meal
Conven-tional heat
Processing
Processing
Grains
1 a
1 b
1 I
1 II
Dense thickets /
sparse forests
Wooded grassland /
pastures
Idle land
Option
Bagasse
Excess power
Conven-tional power
IFEU 2014
3 Description of scenarios 15
SSSSweetweetweetweet FFFFueluelueluelSSSSweetweetweetweet FFFFueluelueluel
Cane fallow 2015
An overview of the cane fallow scenario 2015 is given in Fig. 3-2. Cane fallow 2015 is almost identical to the cane fallow scenario (see subchapter “cane fallow”), except that nowadays sugarcane or forage harvesters are used for harvesting sweet sorghum. This technology works fine for stalks but grains and leaves are cut and left on field, thus a usage of both is not pursued. Consequently, by-products derived from ethanol production out of grains were not considered in the cane fallow 2015 scenario. By-products derived from ethanol produc-tion out of juice are identical to those of the cane fallow scenario. Surplus bagasse can either be used for generating green power, replacing conventional power (2 I) or as animal feed, replacing cereals (2 II).
Fig. 3-2 Schematic overview of the cane fallow scenario 2015; numbers indicate scenario numbers (for a summary of assessed scenarios see Table 3-1).
3.1.2 Grain to food scenarios
In some regions sweet sorghum might not be grown as intermediate crop but replace grain sorghum cultivation. This has not been current practice so far but is conceivable in the future e.g. in semi-arid regions such as Southern Africa or North-eastern Mexico. We assume that sweet sorghum cultivars grown in those areas produce less grain than grain sorghum. Since the grains of grain sorghum are used in some countries for food and in others for feed, re-placing grain sorghum with sweet sorghum might jeopardise food / feed security in those
Sweet sorghum
cultivation
Crude oilproduction
Processing
Product Process Reference system
Mineral oil
Peanut / Soy
cultivation
Stalks
Peanut / Soy
cultivation
LeavesLeft on
fieldFertiliser
N, P, K fertiliser
Left on field
FertiliserN, P, K
fertiliser
Pesti-cides
Ferti-liser
SeedsDiesel
fuel
Ethanol
Juice
Milling
Bagasse
Process energy
Gasoline
Processing
Grains
Bioenergy Conven-tional power
Vinasse
Fusel oil
Calcium carbonate
Fertiliser
Fertiliser
Heat
N, P, K fertiliser
Conven-tional heat
Lime fertiliser
Feed Cereals
Surplus bagasse
2 I
2 II
Dense thickets /
sparse forests
Wooded grassland /
pastures
Idle land
Option
Excess power
Conven-tional power
IFEU 2014

16 SWEETFUEL: Report on integrated sustainability assessment
SSSSweetweetweetweet FFFFueluelueluelSSSSweetweetweetweet FFFFueluelueluel
areas (Fig. 3-3, “Initial situation”). To further guarantee food / feed security, differences in grain yield need to be balanced by cultivating additional grain sorghum. This requires an ad-ditional area which is e.g. in Southern Africa, transformed out of idle land that becomes free due to the intensification of existing land use or that is not used at present (see Fig. 3-3, “Grain to food”). For example: if the grain yield of sweet sorghum is 2.5 t / ha / year and of grain sorghum 3 t / ha / year, an additional area of 0.17 ha is needed to balance the differ-ence of 0.5 t of grain yield (see Fig. 3-3). Some people argue that there are sweet sorghum hybrids which produce more grains than grain sorghum if cultivated on the same ground and under similar cultivation and climate conditions. However, this is far of today’s reality and there is still a lot of research and breeding work necessary to be able to use such hybrids commercially. Thus, as it cannot be foreseen whether those breeding efforts can be success-ful, especially since grain sorghum can also be further developed, this scenario is not con-sidered in this report.
Fig. 3-3 Schematic overview of the grain to food scenario. Numbers are examples for illustration, see text.
An overview of the grain to food scenario is given in Fig. 3-4. As described above, in this scenario grains of sweet sorghum are used as food / feed to guarantee food / feed security. Leaves are separated during harvest and remain on the field, replacing mineral fertiliser (3 a). Since also the use of leaves as animal feed is promoted and might be an option in some regions, also this use was assessed. In this case, cereals are replaced as feed (3 b). Stalks are processed in a central ethanol production unit which correspond to the processing (including all by-products) described in the cane fallow scenario (see Fig. 3-1 and corre-sponding descriptions).
Sweet sorghum cultivation
Grain sorghum cultivation
Grain sorghum
cultivation
+=
To guarantee food / feedsecurity additional area isneeded
Grain sorghum replacement, food / feed security is notguaranteed
Sweet sorghum cultivation
Grain sorghum cultivation
GrainsGrains
Grains –food/feed
Grains –food/feed
Grains –food/feed
Grain to food
Initial situation
1 ha1 ha
1 ha 1 ha 0.17 ha
2.5 t3 t 0.5 t
3 t 2.5 t
Original area Replacement Additional area
IFEU 2014

3 Description of scenarios 17
SSSSweetweetweetweet FFFFueluelueluelSSSSweetweetweetweet FFFFueluelueluel
Fig. 3-4 Schematic overview of the grain to food scenario; numbers indicate scenario numbers (for a summary of assessed scenarios see Table 3-1). Large numbers are examples for illustration, see text.
Extra high yield scenarios
Besides semi-arid regions grain sorghum is also cultivated in regions such as Central-western Mexico with conditions preferable for an extra high yield. Three land use options are conceivable in those regions as described in the following paragraphs (Fig. 3-5).
Option I
This option is identical to the grain to food scenario described before (see Fig. 3-3 and Fig. 3-4 and corresponding explanations); however regions such as Central-western Mexico are characterised by preferable environmental conditions (e.g. high annual precipitation) which allow high grain yields of about 10 t per hectare per year. Since in those regions sweet sorghum yield might also be higher than in semi-arid regions grain sorghum is here replaced by high-yield sweet sorghum.
Sweet sorghum
cultivation
Crude oilproduction
Processing
Product Process Reference system
Mineral oil
Grain sorghum
cultivation
Stalks
Left on field
Fertiliser N, P, K fertiliser
Ethanol
Juice
Milling
Bagasse
Vinasse
Fusel oil
Calcium carbonate
Fertiliser
Fertiliser
HeatConven-
tional heat
Lime fertiliser
Gasoline
Processing
Leaves
GrainsGrains
Grains
Grain sorghum
cultivationIdle land
BioenergyConven-
tional power
Feed Cereals
Surplusbagasse
N, P, K fertiliser
Process energy
3 a
Feed Cereals3 b
3 I
3 II
Option
Pesti-cides
Ferti-liser
SeedsDiesel
fuelPesti-cides
Ferti-liser
SeedsDiesel
fuelPesti-cides
Ferti-liser
SeedsDiesel
fuel
1 ha1 ha
0.17 ha
0.17 ha
Excess power
Conven-tional power
IFEU 2014

18 SWEETFUEL: Report on integrated sustainability assessment
SSSSweetweetweetweet FFFFueluelueluelSSSSweetweetweetweet FFFFueluelueluel
However, since there is no idle land in Central-western Mexico anymore, the additional area needs to be recruited in other regions where yields are expected to be lower. For example: if the grain yield of sweet sorghum is 7 t / ha / year and of grain sorghum 5 t / ha / year an ad-ditional area of 0.6 ha is needed to balance the difference of 3 t of grain yield if grain sor-ghum is cultivated (Fig. 3-5).
Fig. 3-5 Schematic overview of the two land use options of the extra high scenario. Blue numbers are examples for illustration, see text.
Option II
The same production area as in option I is assumed (Fig. 3-5, option II). Grain sorghum is not replaced and sweet sorghum is only grown on the additional area. Grains of grain sor-ghum are used as food / feed to guarantee food / feed security, whereas grains and juice of sweet sorghum are processed to ethanol in a central ethanol production unit, which corre-sponds to the processing described in the cane fallow scenario (see Fig. 3-1 and corre-sponding descriptions). For example: high grain yield of grain sorghum cultivation is about 10 t and grain yield of sweet sorghum cultivation on the additional area is about 2.4 t, if high case sweet sorghum cultivation as described in the grain to food scenario (grain yield: 4 t / ha / year is taken as a basis.
Sweet sorghum cultivation
Grain sorghum cultivation
GS SS
IINo replacement, additional area isused for sweet sorghum cultivation
III
Partial replacement, additional area is used for sweet sorghumcultivation, food / feed securityis guaranteed
Grains -ethanol
Grains –food/feed
Options
Sweet sorghum cultivation
Grains –food/feed
Grains –food/feed
Grains –food/feed ++
1 ha 0.6 ha
0.8 ha 0.6 ha
Sweet sorghum cultivation
Grain sorghum cultivation
Grain sorghum cultivation
+=
Extra high grain yield
Grains –food/feed
Grains –food/feed
Grains –food/feed
1 ha 1 ha 0.6 ha
7 t10 t 3 t
I
10 t 2.4 t
2.4 t
0.2 ha
5.6 t2 t
Original area Replacement Additional area
IFEU 2014

3 Description of scenarios 19
SSSSweetweetweetweet FFFFueluelueluelSSSSweetweetweetweet FFFFueluelueluel
Option III
Another option, assuming again the same production area as in option I, contains a partial replacement of grain sorghum (Fig. 3-5, option III). Thus, sweet sorghum is cultivated on parts of the original grain sorghum cultivation area and on the additional area. The proportion was chosen in the way that grains out of sweet and grain sorghum cultivation still guarantee food / feed security. Thus, grains from grain and sweet sorghum are used as food or feed and the juice of sweet sorghum is processed in a central ethanol production unit which corre-sponds to the processing described in the cane fallow scenario 2015 (see Fig. 3-2 and corre-sponding descriptions). For example: if grain yield of sweet sorghum that is cultivated on the additional area is about 2.4 t, sweet sorghum can be grown on 0.8 ha (if high yield sweet sorghum as described in option I is taken as a basis) and grain sorghum on 0.2 ha (if extra high yield grain sorghum as described in option I is taken as a basis) of the original area to gain still a grain yield of 10 t in total.
3.1.3 Syrup production scenario
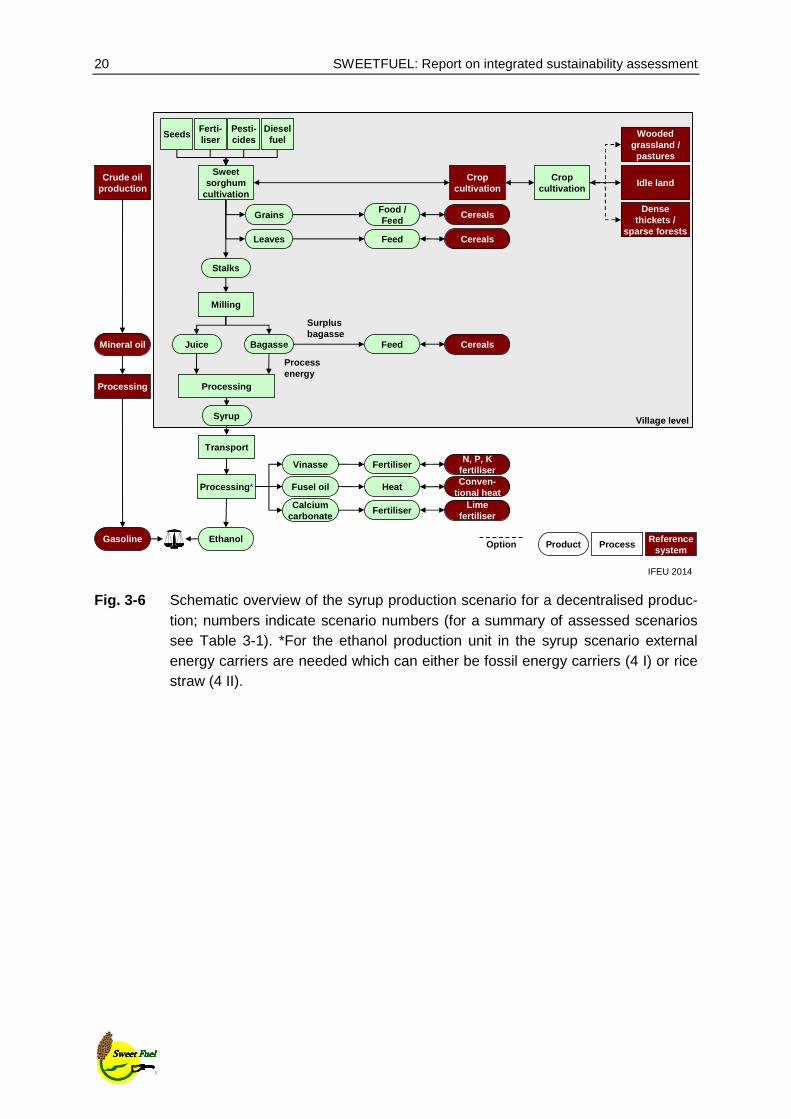
In some cases, infrastructure for biomass transportation to large centralised production units may be insufficient or not existent. Therefore, partially decentralised processing might be another option to grow and use sweet sorghum. Additionally, central ethanol producers often face the difficulty of a rather narrow production window where large amounts of sweet sor-ghum need to be processed. In such cases the syrup production from sweet sorghum juice might be an advantage. Since the syrup can be stored slightly longer than the sweet sor-ghum juice, the ethanol production facility can ease production and expand the production window. In this scenario the sweet sorghum stalks are milled at village level and the juice is further processed into syrup, which is transported to central ethanol units. The grains are separated before harvest and used as feed or food, replacing cereals. The leaves are used as feed, replacing also cereals. The bagasse which is obtained during stalk milling is used at village level for heat production that is needed to concentrate the juice into syrup. If there is surplus bagasse, it is used as animal feed, replacing cereals. The syrup is transported to a centralised ethanol production unit and it is treated just as the juice in the cane fallow scenar-io. For the central ethanol unit, external energy carriers need to be used since the bagasse from syrup production is left in the villages. External energy carriers can either be fossil en-ergy carriers such as coal and oil or rice straw. An overview of the syrup scenario is given in Fig. 3-6.
20 SWEETFUEL: Report on integrated sustainability assessment
SSSSweetweetweetweet FFFFueluelueluelSSSSweetweetweetweet FFFFueluelueluel
Fig. 3-6 Schematic overview of the syrup production scenario for a decentralised produc-tion; numbers indicate scenario numbers (for a summary of assessed scenarios see Table 3-1). *For the ethanol production unit in the syrup scenario external energy carriers are needed which can either be fossil energy carriers (4 I) or rice straw (4 II).
Sweet sorghum
cultivation
Crude oilproduction
Processing
Product Process Reference system
Mineral oil
Crop cultivation
Stalks
Crop cultivation
Grains
Leaves
Food / Feed
Feed
Cereals
Cereals
Pesti-cides
Ferti-liser
Seeds
Processing
Diesel fuel
Ethanol
Juice
Milling
Bagasse
Vinasse
Fusel oil
Calcium carbonate
Fertiliser
Fertiliser
Heat
N, P, K fertiliserConven-
tional heatLime
fertiliser
Processenergy
Feed Cereals
Gasoline
Surplusbagasse
Syrup
Transport
Processing *
Village level
Option
Dense thickets /
sparse forests
Wooded grassland / pastures
Idle land
IFEU 2014

3 Description of scenarios 21
SSSSweetweetweetweet FFFFueluelueluelSSSSweetweetweetweet FFFFueluelueluel
3.2 Biomass sorghum scenarios
Besides sweet sorghum, biomass sorghum is also considered in this project. Biomass sor-ghum is cultivated mainly to gain high biomass yields for biogas production.
The target systems are centralised, mechanised systems in industrialised settings. The focus lies on high biomass yields, whereas sugar content and grain yields are of less importance. Accordingly, the crop is used as a whole. Several options of energy production from biomass sorghum were assessed in order to give a bandwidth on different use options and to include both first and second generation technologies. The main focus was laid on biogas and bio-methane production. Alternatively, the combustion of the biomass and the production of fuel is analysed with the focus on second generation technologies. Two options were assessed here: a) second generation ethanol produced from lignocellulose and b) biomass gasification with the synthesis of the gas into biofuel.
Biomass sorghum is mainly cultivated on land which becomes free due to the intensification of existing land use. Also idle land can be used to grow biomass sorghum. In the further course of the report all these land use options are referred to as “idle land”. Forest conver-sion is forbidden in all countries within Europe. Thus, no sensitivity analyses for alternative land use options were conducted.
The yield differences due to multiple climatic conditions in the temperate zone were as-sessed via sensitivity analyses.
3.2.1 Biogas and biomethane production
An overview of biogas and biomethane production is given in Fig. 3-7. For the biogas produc-tion, the biomass sorghum is chopped and ensilaged after harvest. Subsequently, the silage is fermented into biogas. Biomass sorghum can be fermented together with co-substrates such as manure or corn. However, the main objective is to assess the use of biomass sor-ghum from a certain area. Therefore, biomass sorghum digestion was assessed without any co-substrate. The biogas is either used for heat and power (5 I A) or only for power produc-tion (5 I B), replacing conventionally produced heat and power or power only, respectively.
Alternatively, the biogas can be further processed into biomethane and used
• for heat and power production, which replaces conventional heat and power (5 II A), or
• as a transport fuel replacing conventional gasoline (5 II B) and natural gas (5 II C), re-spectively.
In all processes, digestate is produced as a by-product. It is used as fertiliser replacing min-eral fertilisers.

22 SWEETFUEL: Report on integrated sustainability assessment
SSSSweetweetweetweet FFFFueluelueluelSSSSweetweetweetweet FFFFueluelueluel
Fig. 3-7 Schematic overview of biogas production from biomass sorghum for the temper-ate climate; numbers indicate scenario numbers (for a summary of assessed scenarios see Table 3-2).
3.2.2 Second generation ethanol
An alternative to the conversion of biomass sorghum into biogas or biomethane is the pro-duction of ethanol from the lignocellulosic fraction of biomass sorghum (5 a). An overview of this scenario is given in Fig. 3-8. The biomass is harvested and pre-treated in order to render the cellulose and hemicellulose accessible for a subsequent hydrolysis step. After the hy-drolysis of the cellulose and hemicellulose for breaking down the long chains into C6 sugars (e.g. glucose) and C5 sugars (e.g. xylose), the substrate is fermented. The ethanol is used as transport fuel, replacing conventional gasoline.
Biomass sorghum
cultivation
Bio-methane
Biogas
Sorghum silage
Fermen-tation
Digestate
Pesti-cides
Ferti-liser
SeedsDiesel
fuel
Idle land
Biomass harvest /
silage
FertiliserN, P, K
fertiliser
Transport fuel
Natural gas
Gasoline
Heat / power
Conventional heat / power
Product ProcessReference
system
PowerConventional
power
Heat / power
Conventional heat / power
5 II B
5 I B
5 II A
5 I A
5 II C
Option

3 Description of scenarios 23
SSSSweetweetweetweet FFFFueluelueluelSSSSweetweetweetweet FFFFueluelueluel
Fig. 3-8 Schematic overview of second generation ethanol production from biomass sor-ghum lignocellulose for the temperate climate; numbers indicate scenario num-bers (for a summary of assessed scenarios see Table 3-2).
3.2.3 Direct combustion
Another option to convert biomass sorghum into energy is direct combustion (Fig. 3-9). Since this process requires comparatively dry biomass, direct combustion is especially feasible in the southern regions of Europe such as in the southern part of Spain, Italy or Greece. Here, the stalks remain on the field after harvest for drying. After collection, they can be directly used for combustion in the direct combustion process.
During the combustion process, heat and power are produced that replace conventionally produced heat and power (5 b I). Furthermore, either power or heat can be produced sepa-rately. Power production replaces conventional power (5 b II) while heat production either replaces natural gas (5 b III A) or fuel oil (5 b III B).
In all processes ash is produced as a by-product which has to be disposed in landfills.
Biomass sorghum
cultivation
Pesti-cides
Ferti-liser
SeedsDiesel
fuel
Ethanol
Pre-treatment, enzymatic hydrolysis,
fermentation, distillation
Sorghum biomass
Idle land
Product ProcessReference
system
Crude oilproduction
Processing
Mineral oil
Gasoline
5 a
IFEU 2014

24 SWEETFUEL: Report on integrated sustainability assessment
SSSSweetweetweetweet FFFFueluelueluelSSSSweetweetweetweet FFFFueluelueluel
Fig. 3-9 Schematic overview of direct combustion of biomass sorghum for the temperate climate; numbers indicate scenario numbers (for a summary of assessed scenar-ios see Table 3-2).
3.2.4 Gasification
Besides direct combustion, dry biomass is also needed for biomass sorghum gasification (Fig. 3-10).
For biomass gasification, two options are analysed: first the direct gasification (5 c I), second the gasification with a prior pyrolysis of the biomass (5 c II).
For both options, the biomass needs to be comparatively dry as a precondition. For drying the biomass could either be longer left on the field or waste heat from the gasification pro-cess could be used as energy supply in the case of direct gasification. For the pyrolysis, however, external energy supply is needed. As a next step, the biomass or the pyrolysis oil is gasified into a synthesis gas. It is a mixture of hydrogen and carbon monoxide. After cleaning the gas, it is synthesised into the so-called BtL fuels. The standard synthesis is the Fischer-Tropsch synthesis where FT diesel is produced as a main product. If there is surplus bioen-ergy from the process, it is fed into the grid and replaces conventional energy.
Biomass sorghum
cultivation
Pesti-cides
Ferti-liser
SeedsDiesel
fuel
Heat / power
Direct combustion
Ash
Sorghum biomass
Disposal
Idle land
Product Process Reference system
Power
Heat
Conventional power
Natural gas
Fuel oil
Conventional heat / power
5 b II
5 b III A
5 b III B5 b I
Option
IFEU 2014

3 Description of scenarios 25
SSSSweetweetweetweet FFFFueluelueluelSSSSweetweetweetweet FFFFueluelueluel
Fig. 3-10 Schematic overview of FT diesel production from biomass sorghum gasification for the temperate climate; numbers indicate scenario numbers (for a summary of assessed scenarios see Table 3-2).
3.3 Summary: scenario overview
Table 3-1 and Table 3-2 summarise all scenarios selected for the integrated assessment. Further sensitivity analyses were assessed in the preceding assessments of individual sus-tainability aspects (environmental and economic assessment as well as SWOT analysis, which includes social aspects /Reinhardt et al. 2014/, /Basavaraj, Parthasarathy Rao et al. 2014/, /Rutz & Janssen 2012a/).
Biomass sorghum
cultivation
FT synthesis
FT diesel
Synthesis gas
Product Process Reference system
Sorghum biomass
GasificationSurplus
bioenergy
Pesti-cides
Ferti-liser
SeedsDiesel
fuel
Idle land
Conventional power
Conventional diesel
Option
5 c I Pyrolysis 5 c II
IFEU 2014

26 SWEETFUEL: Report on integrated sustainability assessment
SSSSweetweetweetweet FFFFueluelueluelSSSSweetweetweetweet FFFFueluelueluel
Table 3-1 Overview of all sweet sorghum scenarios. Bold: Main scenarios.
Sweet sorghum
Scenario Option Use of surplus bagasse
Option** Use of leaves
1 Cane fallow 1 I Bioenergy
1 I a Fertiliser (left on field) 1 I b Together with bagasse
1 II Feed 1 II a Fertiliser (left on field) 1 II b Together with bagasse
2 Cane fallow 2015 2 I Bioenergy
Fertiliser (left on field) 2 II Feed
3 Grain to food 3 I Bioenergy
3 I a Fertiliser (left on field) 3 I b Feed
3 II Feed 3 II a Fertiliser (left on field) 3 II b Feed
4 Syrup 4 I* Feed
Feed 4 II* Feed
* For the ethanol production unit in the syrup scenario external energy carriers are needed which can either be fossil energy carriers (4 I) or rice straw (4 II).
** The option numbers listed here are combinations of the alternative use pathways of surplus ba-gasse and of leaves.
Table 3-2 Overview of all biomass sorghum scenarios. Bold: Main scenario.
Biomass sorghum
Conversion pro-cess
Option Main product / method
Option* Use of main product
5 Biogas production
5 I Biogas 5 I A Heat and power 5 I B Power
5 II Biomethane
5 II A Heat and power
5 II B Transport fuel replacing gasoline
5 II C Transport fuel replacing natural gas
Alternatives
5 a 2G ethanol pro-duction
5 a Ethanol Transport fuel
5 b Direct combustion
5 b I Heat & power Heat and power 5 b II Power Power
5 b III Heat 5 b III A Natural gas 5 b III B Fuel oil
5 c Gasification 5 c I Direct gasification Transport fuel
5 c II Gasification with prior pyrolysis
Transport fuel
* The option numbers listed here are combinations of the alternative methods of biomass conversion and of the use pathways of the main product.

4 Results 27
SSSSweetweetweetweet FFFFueluelueluelSSSSweetweetweetweet FFFFueluelueluel
4 Results
4.1 Summary: Environmental assessment
This subchapter summarises the results of the environmental assessment report /Reinhardt et al. 2014/. For further details please refer to the original report.
4.1.1 Global / regional environmental impacts
The results of the life cycle assessment can be summarised as follows:
I) General aspects of sweet sorghum and biogas prod uction scenarios
The production and use of sweet and biomass sorghum as energy crops can cause a wide spectrum of potential impacts ranging from significant environmental benefits to distinctly detrimental environmental impacts compared to conventional energy carriers. In the cane fallow, grain to food and biogas production scenarios, results for the impact categories deple-tion of non-renewable energy resources and greenhouse effect are mostly advantageous compared to fossil equivalents, whereas the results for the other investigated impact catego-ries (acidification, terrestrial and aquatic eutrophication, ozone depletion and human toxicity (in case of the sweet sorghum scenarios) cause additional environmental burdens (see Fig. 4-1 and Fig. 4-2). For the syrup production scenario, however, mostly disadvantageous results can be observed for all investigated impact categories. Thus, to improve bioethanol and biogas production in all scenarios, optimisation is necessary to reduce disadvantages and increase advantages.
Some life cycle stages are particularly relevant to numerous environmental impact categories and therefore represent starting points for optimising bioethanol production. Most important for sweet sorghum and biogas production scenarios are the following life cycle stages (see Fig. 4-3 and Fig. 4-4, respectively):
• Fertilisation (especially nitrogen) and field emissions (influenced by fertilisation)
• Credits given for the avoided expenses for the use of conventional energy carriers.
• For most sweet sorghum scenarios also the use of the by-products are important life cy-cle steps. For biogas production scenarios, digestate storage and digestate incorporation into the soil are decisive life cycle steps.
For both sweet sorghum (except for syrup production) and biogas production scenarios counts that high biomass yields can help to save greenhouse gases and fossil energy car-riers. Thus, one way to optimise bioethanol production includes aiming at higher yields. Since all categories in all sweet sorghum and biogas production scenarios are strongly influenced by the amount of applied mineral fertilisers (especially N fertiliser), another optimisation po-tential is to reduce the nutrient content in the harvested biomass while still sustainable cul-tivation practices are guaranteed.

28 SWEETFUEL: Report on integrated sustainability assessment
SSSSweetweetweetweet FFFFueluelueluelSSSSweetweetweetweet FFFFueluelueluel
Fig. 4-1 Net results for sweet sorghum bioethanol production in the cane fallow scenario per hectare per year normalised to inhabitant equivalents (IE).
How to read the first bar in Fig. 4-1:
If bioethanol is produced from 1 ha sweet sorghum and replaces fossil gasoline, as much of non-renewable energy resources are saved as about 1.3 European inhabitants con-sume each year.
Fig. 4-2 Overview of net results for the biogas scenario per hectare per year normalised to inhabitant equivalents (IE). Results include all investigated environmental im-pact categories and are based on typical cultivation and conversion conditions.
-2 -1.5 -1 -0.5 0 0.5 1 1.5 2 2.5
Resource depletion: energy
Greenhouse effect
Acidification
Terrestrial eutrophication
Aquatic eutrophication
Photosmog
Ozone depletion
Human toxicity: particulates
IE per hectare
Disadvantages →← Advantages
IFEU 2014
-5 -4 -3 -2 -1 0 1 2 3 4
Resource depletion: energy
Greenhouse effect
Acidification
Terrestrial eutrophication
Aquatic eutrophication
Photosmog
Ozone depletion
Human toxicity: particulates
IE per hectare
Disadvantages →← Advantages
IFEU 2014

4 Results 29
SSSSweetweetweetweet FFFFueluelueluelSSSSweetweetweetweet FFFFueluelueluel
Fig. 4-3 Sweet sorghum to bioethanol: Contributions of individual life cycle steps (col-oured sections) to the overall net result (light brown bar) of sweet sorghum etha-nol production in the cane fallow scenario for the environmental impact category greenhouse effect. Results are based on typical cultivation and conversion condi-tions.
Fig. 4-4 Biomass sorghum to biogas: Contributions of individual life cycle steps (coloured sections) to the overall net result (light brown bar) of biogas production in the en-vironmental impact category greenhouse effect. Results are based on typical cul-tivation and conversion conditions.
-12 -10 -8 -6 -4 -2 0 2 4 6 8
t CO2 equiv. / (ha × yr)
Agriculture: diesel Agriculture: fertiliser Agriculture: field emissions Agriculture: reference system Agriculture: remainder Transports Conversion: material input Conversion: grains Grain sorghum cultivation Surplus bagasse Leaves Credits: vinasse Credits: grains Credits: fusel oil Credits: calcium carbonate Credits: excess power Energy supply Use phase Fossil equiv. production Fossil equiv. usage Net result
← Credits Expenditures →
Disadvantages →← Advantages
IFEU 2014
-25 -20 -15 -10 -5 0 5 10 15
t CO2 equiv. / (ha × yr)
Agriculture: diesel Agriculture: fertiliser Agriculture: field emissionss Agriculture: reference system Agriculture: remainder Transport Emissions: digestate storage Conversion / dig. incorporation Credits: digestate Credits: power Credits: heat Net result
← Credits Expenditures →
← Advantages Disadvantages →
IFEU 2014

30 SWEETFUEL: Report on integrated sustainability assessment
SSSSweetweetweetweet FFFFueluelueluelSSSSweetweetweetweet FFFFueluelueluel
The transportation distance has only little influence on the outcome of the overall results in all investigated impact categories and for all sweet sorghum and biogas production scenari-os.
Variability throughout the whole life cycles of energy sorghum cultivation and use lead to considerable bandwidths of possible environmental impacts (see Fig. 4-5 and Fig. 4-6 exem-plarily for greenhouse effect). Thus, all life cycle steps, which have been identified as im-portant for the overall result, should be optimised thoroughly.
II) Specific results for sweet sorghum scenarios
• The overall bandwidth of results and thus the optimisation potential throughout the whole life cycle is higher for the cane fallow than for the grain to food and the syrup pro-duction scenario (Fig. 4-5).
• Since the impact of the conversion efficiency on the overall results is relatively small for the sweet sorghum scenarios, the conversion efficiency holds only a small potential for optimising bioethanol production.
• The different use options of the by-products represent a huge optimisation potential in the sweet sorghum scenarios (mainly cane fallow). It is suggested that in future leaves and surplus bagasse should be used for bioenergy production while grains should be processed into ethanol.
• As long as there are no optimisation arrangements in the syrup production scenario to reduce especially the expenditures (e.g. by reducing the nutrient content of harvested bi-omass or by decreasing expenses from external energy carriers), aiming at higher yields should not be pursued in the first place.
• In the syrup production scenario external energy carriers are needed to convert sugar juice into ethanol since the bagasse has already been used to boil down the sugar juice into syrup. From a climate protection point of view a renewable energy resource out of residual products such as rice straw should be used for energy provision where possible.
• If land cover changes are involved, the outcome of the greenhouse gas balance de-pends largely on the carbon stocks of the area. If a piece of land is developed for sweet sorghum cultivation, a reduction of the carbon inventory of this area must be prevented.
• If sweet sorghum is cultivated in traditional grain sorghum cultivation regions, there is no big difference in the overall results if grain sorghum is totally or only partially replaced.

4 Results 31
SSSSweetweetweetweet FFFFueluelueluelSSSSweetweetweetweet FFFFueluelueluel
Fig. 4-5 Bandwidths of net results (typical, low, high) in the impact category greenhouse effect for the sweet sorghum scenarios cane fallow, grain to food and syrup pro-duction.
Fig. 4-6 Bandwidths of net results (typical, low, high) for biogas production for the impact category greenhouse effect.
-18 -16 -14 -12 -10 -8 -6 -4 -2 0 2 4
Typical
Low
High
Bandwidth
Typical
Low
High
Bandwidth
Typical
Low
High
Bandwidth
t CO2 equiv. / (ha × yr)
← Advantages
Cane fallow
Grain to food
Syrup production
Disadvantages →
IFEU 2014
-30 -25 -20 -15 -10 -5 0 5 10
Typical
Low
High
Bandwidth
t CO2 equiv. / (ha × yr)
← Advantages Disadvantages →
IFEU 2014

32 SWEETFUEL: Report on integrated sustainability assessment
SSSSweetweetweetweet FFFFueluelueluelSSSSweetweetweetweet FFFFueluelueluel
III) Specific results for biomass sorghum scenarios
• To gain optimised conversion conditions for biogas production, digestate storage tanks should be covered and closed gas-tight. Additionally, the digestate should be incorpo-rated into the soil within 1 hour.
• The more fossil carbon, emitted during the combustion of the fossil energy carrier, can be saved, the more advantageous is the outcome in most investigated impact categories. However, since the energy carrier can mostly not be influenced by the plant operator, the optimisation potential is relatively low.
• From an environmental perspective, biogas and its use in a CHP unit should be fa-voured over the other biogas use options, as far as biogas is produced under the same conditions as biomethane. In case biogas is further refined into biomethane , the use of biomethane in a combined heat and power unit should be favoured over a use as a natu-ral gas substitute or fuel.
• A direct combustion of biomass sorghum and its use in a CHP unit performs best com-pared to all other use options in almost all categories. Also 2nd generation ethanol as a fuel cannot reach those levels of environmental advantages (see also /Reinhardt 2013/). Thus, from an environmental protection point of view the direct combustion should be fa-voured over the processing of biomass sorghum into biogas, but only if both heat and power can be produced and used (Fig. 4-7).
Fig. 4-7 Comparison of all investigated alternative scenarios on bioenergy production from biomass sorghum with biogas production for the environmental impact cate-gory greenhouse effect. Results are based on typical cultivation conditions. For detailed descriptions of alternative scenarios see subchapters 3.2.2 to 3.2.4.
4.1.2 Local environmental impacts
The methodological approach developed for the assessment of local environmental impacts in SWEETFUEL is labelled a Life Cycle - Environmental Impact Assessment (LC-EIA). The main idea of this approach is to apply major elements of EIA to a complete life cycle on a
-35 -30 -25 -20 -15 -10 -5 0
Biogas (typical, CHP)
Biogas (closed dig./heat 100%)
2nd gen ethanol
Direct combustion (CHP)
Direct combustion (power only)
Direct combustion (heat only)
Direct combustion (heat only: fuel oil)
Gasification
Gasification (pyrolysis)
t CO2 equiv. / (ha × yr)
Greenhouse effect
← Advantages
4 Results 33
SSSSweetweetweetweet FFFFueluelueluelSSSSweetweetweetweet FFFFueluelueluel
generic basis /Rettenmaier et al. 2013/, /Kretschmer et al. 2012/. Due to this approach, it is possible to supplement the Life Cycle Assessment (LCA) by elements of EIA.
The main features of the LC-EIA approach can be summarised as follows (for further details see /Reinhardt et al. 2014/):
• The intensity and resolution of the environmental effects can be arranged between the classical project-related EIA and the strategic environmental assessment (SEA).
• The outcomes of the LC-EIA are fully compatible to LCA. Results of the LC-EIA give a new quality to the environmental impact category "land use" within the standardised methodology of LCA, by not only balancing the area needed for the application of a new technology but additionally giving information on the quality of the land use change and its possible impacts on local environmental factors.
• LC-EIA is broadening the scope of EIA (as well as SEA) in terms of assessment of a whole life cycle. The local approach of classical EIA usually prevents the inclusion of lo-cal environmental effects outside of certain administrative boundaries and thus possibly neglects important environmental effects, e.g. on biodiversity.
• Due to the generic, technology-focussed approach, different scenarios can be assessed and compared more quickly and easily.
• Therefore, an assessment of overall sustainability of a new technology can be carried out more easily and the optimisation of technology implementation by finding the best options or possibilities to remedy environmental effects can be done more effectively.
• Within the framework of SWEETFUEL and other related projects a comparable method-ology for the analysis of biomass production and conversion can be used.
In the following, the main results of the LC-EIA are summarised. Subchapter 4.1.2.1 focuses on the main results regarding the cultivation and use of sweet sorghum while subchap-ter 4.1.2.2 presents the main results regarding the cultivation and use of biomass sorghum. An overall conclusion and a reflection of the LC-EIA results in the broad context of the SWEETFUEL project is given in chapter 5.
4.1.2.1 Sweet sorghum scenarios
Local environmental impacts are primarily dominated by 'biomass provision'. The other life cycle stages such as the provision of fertilisers or biomass conversion in ethanol facilities play only a subordinate role. Where sweet sorghum is cultivated on what was previously ag-ricultural land, field crops are displaced. Assuming constant demand they must then be culti-vated elsewhere. From an accounting perspective, for this purpose only land comes into question that has not been used agriculturally yet (see subchapter 3.1). These areas are referred to as the agricultural reference system. During the conversion and subsequent agri-cultural exploitation of these areas a variety of local environmental impacts occur, depending on the agricultural reference system. Sweet sorghum cultivation therefore indirectly leads to field conversion, which is thus also referred to as indirect land use change (iLUC).
• If the reference system is based on 'idle land’, land use changes and land cultivation can negatively impact the soil (e.g. erosion, compaction, nutrient extraction), the hydrologic

34 SWEETFUEL: Report on integrated sustainability assessment
SSSSweetweetweetweet FFFFueluelueluelSSSSweetweetweetweet FFFFueluelueluel
balance (for example nutrient input, pesticide input, water demand), and flora, fauna and biodiversity (e.g. habitat destruction, soil compaction, pesticides) (Table 4-1).
• If the reference system is based on habitats with a comparatively high ecological value such as pastures or wooded areas, for example, the local impacts on flora, fauna and bi-odiversity can be much more serious, whereby additional negative impacts on local cli-
mate regulation and the landscape may occur.
From a purely qualitative perspective, the environmental impacts caused by sweet sorghum cultivation are very similar across all the investigated sweet sorghum scenarios (given the same reference system). In comparison, from a quantitative perspective, the local environ-mental impacts of the 'grain to food' scenario are substantially less grave than the local envi-ronmental impacts of the other two scenarios (‘cane fallow’ and ‘syrup production’). The rea-son for this is the considerably lower coverage of cultivated area by the indirect land use change: only approximately 0.2 ha of compensation area are required to cultivate 1 ha of sweet sorghum in the 'grain to food' scenario compared to 1 ha respectively in the 'cane fal-low' and 'syrup production' scenarios.
Table 4-1 Risks associated with the cultivation of sweet sorghum compared to the refer-ence system idle land
Type of risk
Affected environmental factors
Soil Ground water
Surface water
Plants/ Biotopes Animals
Climate/ Air
Land-scape
Human health and recrea-
tion
Bio-diversity
Soil erosion negative1/ neutral2
negative1/ neutral2
Soil compaction negative negative negative negative negative
Loss of soil organic matter
negative1/ neutral
negative1/ neutral2
negative1/ neutral2
negative1/ neutral2
Soil chemis-try / fertiliser negative negative
Nutrient leaching
negative
Eutrophi-cation negative negative negative negative negative negative
Water de-mand
negative neutral neutral neutral
Weed con-trol / pesti-cides’
negative negative negative negative negative
Loss of landscape elements
neutral neutral neutral neutral neutral neutral
Loss of habitat types
neutral/ negative
neutral/ negative
neutral/ negative
Loss of species
neutral/ negative
neutral/ negative
neutral/ negative
Foot notes: 1: Negative if sweet sorghum leaves are removed from field after harvest 2: Neutral if sweet sorghum leaves are left on the field after harvest

4 Results 35
SSSSweetweetweetweet FFFFueluelueluelSSSSweetweetweetweet FFFFueluelueluel
In order to fundamentally reduce the local environmental impacts of sweet sorghum cultiva-tion, the following demand arises: care should be taken that the substitute areas for field crop cultivation (for example soya or peanuts in the 'cane fallow' scenario, grain sorghum in the 'grain to food' scenario and a variety of field crops in the 'syrup production' scenario) are of comparatively low ecological value. Under no circumstances sweet sorghum should be culti-vated on areas classified as biodiversity hot spots, or on land that has a high carbon invento-ry, performs a special hydrologic balance function, or is characterised by a remarkable land-scape.
As already noted briefly above, less grave local environmental impacts arise from other life cycle stages, for example from the use of agricultural materials and fuels or from transport
infrastructure conditions:
• Local environmental impacts created by sweet sorghum cultivation's material and fuel demand at the material and fuel production location comprise, among other things, the water demand at that location, exhaust gas emissions, disposable wastes and wastewaters. Because only a small proportion of the overall production at the respective material and fuel production locations is used for sweet sorghum cultivation, the local en-vironmental impacts occurring at those locations are only of subordinate relevance to the analysis of sweet sorghum cultivation.
• Because in all three scenarios sweet sorghum is cultivated on land previously used agri-culturally, it can be assumed that sufficient road infrastructure already exists and can be utilised, so that no local environmental impacts occur in these areas. Depending on the location of the substitute area, where either soya / peanuts (‘cane fallow’), grain sorghum (‘grain to food) or possibly other field crops (‘syrup scenario’) are cultivated, additional road infrastructure must be built. Inasmuch as additional road infrastructure must be built, local environmental impacts on flora, fauna and biodiversity (habitat destruction and fragmentation), as well as on the soil and the hydrologic balance (surface sealing), must be anticipated.
• Due to the sugar content in the sweet sorghum stalks their storage tolerance is strongly limited which requires immediate processing. In contrast to the central ethanol plant ("cane fallow" and "grain to food" scenarios, respectively), in the syrup production scenar-io additional - however insignificant - impacts are expected caused by the need for syrup storage facilities. The construction of the small tanks to store the syrup produced at vil-lage level imposes negative impacts on soil, water, animals and plants due to clearing, sealing and compaction of soil. On the other hand, due to the concentration of the sweet sorghum juice in the scenario “syrup production”, less biogenic material needs to be transported to the central ethanol plant compared to the scenarios “cane fallow” and “grain to food”, which both encompass direct delivery of sweet sorghum stalks to the eth-anol plant.
• Compared to conventional gasoline, the energy content of ethanol is significantly lower. The consequence of this is an overall increase in refuelling frequency and thus an in-crease in traffic volume, which is in turn associated with a greater noise nuisance and exhaust emissions that might lead to local environmental impacts on the soil, flora, fauna,
air quality and human health.

36 SWEETFUEL: Report on integrated sustainability assessment
SSSSweetweetweetweet FFFFueluelueluelSSSSweetweetweetweet FFFFueluelueluel
Life cycle stage „biomass conversion“: With respect to the construction of the central bioeth-anol plant major impacts on soil, water, flora, fauna, biodiversity and landscape are to be expected due to clearing, sealing and material inputs needed. During operation of the bio-ethanol plant, environmental impacts on water, soil and air are to be expected due to the water demand and the wastewater discharge, the release of gases and fine dust as well as potential accidents. Since ethanol substitutes for conventionally produced gasoline, the sweet sorghum conversion can be compared to the conversion of crude oil in a crude oil re-finery. Greater emissions of unfavourable gases as well as a higher risk of hazardous acci-dents due to the production of dangerous substances, the long-distance transportation of oil and the processing at high pressure and temperature conditions can be identified.
It can be summarised that, depending upon life cycle stages, different local environmental impacts develop that differ in their respective intensity – from less serious to extremely unfa-vourable.
4.1.2.2 Biomass sorghum scenarios
In Europe, conversion of forest areas is prohibited by law and conversion of grasslands only possible to a small degree. 'Idle land' is therefore adopted exclusively as the agricultural ref-erence scenario for biomass sorghum cultivation.
As discussed above for the sweet sorghum scenarios, the local environmental impacts in the biomass sorghum scenarios are essentially determined by the cultivation of the biomass. These are cultivation-related impacts on the soil (for example erosion, compaction, nutrient extraction), the hydrologic balance (for example nutrient input, pesticide input, water de-mand) and flora, fauna and biodiversity (for example habitat destruction, soil compaction, pesticides). In addition, extra local environmental impacts, some quite serious, may occur, in particular with regard to soil quality and local biodiversity, as a result of increasing land pres-sure or monocultures. Developments in this direction are likely to occur in two cases:
• Increase in conversion efficiency with the consequence that larger facilities are built as a general rule. Since larger facilities require more charging material, more biomass sor-ghum must be cultivated. However, due to logistical and cost reasons this should occur within a given radius around the facility.
• Biomass sorghum is harvested comparatively wet for biogas and biomethane production, meaning that from an economical perspective the harvested crop displays only low trans-portability. For large, and therefore efficient, biogas facilities, large quantities of biomass sorghum must therefore be cultivated spatially close to the biogas facility.
In contrast to this, less grave local environmental impacts arise from other life cycle steps, in particular from the use of agricultural materials and fuels, as well as from transport infrastruc-ture conditions:
• Among other things, the local environmental impacts ensuing from the production of ma-terials and fuel comprise water demand, exhaust gas emissions, disposable wastes and wastewaters. However, these local environmental impacts are of only subordinate rele-vance.

4 Results 37
SSSSweetweetweetweet FFFFueluelueluelSSSSweetweetweetweet FFFFueluelueluel
• Because Europe represents the spatial context for biomass sorghum production, it is as-sumed that sufficiently well-developed transport infrastructure already exists, meaning that no local environmental impacts occur as a result of road building.
• If biogas or biomethane are produced from biomass sorghum, the relatively wet-harvested biomass is ensilaged in bunker silos and then transported as needed to the bi-ogas facility. Relatively little infrastructure is associated with this process. The situation is different if second generation ethanol or synthetic fuels are produced, or biomass sor-ghum is exploited for energy production (scenarios: '2G ethanol', 'direct combustion' and 'gasification'). Here, biomass sorghum is harvested dry and large warehouses or stores are required. Their construction leads to environmental impacts on flora and fauna (habi-tat destruction), as well as on the soil and the hydrologic balance (soil compaction, seal-ing).
• If second generation ethanol is produced from biomass sorghum ('2G ethanol' scenario), the result is an overall increase in refuelling frequency and thus an increase in traffic vol-ume as a result of the lower energy content of ethanol compared to conventional gaso-line. This is associated with a greater noise nuisance and exhaust emissions that might lead to local environmental impacts on the soil, flora, fauna, air quality and human health.
In contrast to this, the 'biomass conversion' life cycle stage displays greater local environ-mental impacts: When building the various biomass sorghum exploitation technologies (a biogas and a 2G bioethanol facility, a CHP plant for direct combustion and a BtL facility for the gasification scenario), (serious) impacts, on the soil, the hydrologic balance, flora, fauna, biodiversity, and the landscape must be anticipated. As a result of the operation of these facilities also local environmental impacts on the soil, the hydrologic balance and air quality can be expected due to the water demand, the production of wastewater, waste disposal, exhaust gas and particulate emissions as well as the possibility of accidents.
Thus, it can be summarised that, depending upon life cycle phase, different local environ-mental impacts develop that differ in their respective intensity – from less serious to extreme-ly unfavourable.

38 SWEETFUEL: Report on integrated sustainability assessment
SSSSweetweetweetweet FFFFueluelueluelSSSSweetweetweetweet FFFFueluelueluel
4.2 Summary: Economic assessment
This subchapter summarises the results of the economic assessment report /Basavaraj, Par-thasarathy Rao et al. 2014/. For further details please refer to the original report.
Sweet sorghum (Sorghum bicolor (L.) Moench) is a promising energy crop due to its efficien-cy in both, high water use and nutrient uptake. Furthermore, the production of food, feed and fuel can be combined in one crop /Basavaraj et al. 2012a/, /Basavaraj et al. 2013a/. This is an important asset on the background of the currently increasing discussion on energy pro-duction and food security /Basavaraj et al. 2012b/, /Basavaraj et al. 2013b/, /Basavaraj et al. 2013c/.
Economic feasibility of ethanol from sweet sorghum is analysed for different scenarios name-ly ethanol from sweet sorghum stalk, stalk+ grain, grain for food, and syrup at village level to ethanol along with the impacts of by-products on use pathways. The analysis is carried out under varying values of key production and processing parameters by defining low, typical and high case values. The key parameters are varied within a given bandwidth under each case related to feedstock yield, sugar content in sweet sorghum stalk, processing efficiency and ethanol / power recovery etc.
4.2.1 Sweet sorghum to ethanol
Comparison of calculated net variable cost of ethanol (after allowing credits for by-products) generated from sweet sorghum stalk, stalk + grain, grain for food and syrup scenarios with market price of ethanol indicates that the ethanol output in the scenario from stalk + grain under typical and high case is competitive and a realistic scenario in 2020. Also, ethanol pro-duction under the grain to food scenario is competitive in all cases. Under the grain to food scenario the value of grain significantly reduces the cost of ethanol production after due cred-it is given to grain value. With the on-going debate on food vs. fuel, sweet sorghum as a feedstock is found to be economically promising when the grain is utilized for food and stalk to ethanol. Ethanol production using syrup route is most uneconomical while production from stalk is competitive under the high case scenario only. For the syrup route the extraction of syrup at village level is still not commercially viable adding to the overall cost of production. In all cases feedstock costs is the major contributor to the variable production costs of etha-nol followed by processing costs, labour and other maintenance and operational costs. Inter-est costs etc. make up the rest (Fig. 4-8). Feedstock costs however, tend to come down as we move from low to high case due to higher yields under the high case compared to the low case.

4 Results 39
SSSSweetweetweetweet FFFFueluelueluelSSSSweetweetweetweet FFFFueluelueluel
Fig. 4-8 Breakup of operational costs for selected sweet sorghum scenarios, typical case
Among the different by-products generated while producing ethanol from stalk only or stalk + grain scenarios, electricity generation from surplus bagasse, excess power and CaO account for a major share followed by vinasse, fusel oil etc. Under the stalk + grain scenario, spent grain additionally accounts for a small share in the total value of by-products. As we move from low to high case the share of electricity from surplus bagasse declines significantly as the available quantity of surplus bagasse declines. Under the food to grain scenario grain value makes a significant contribution to the by-product value followed by all others like in the stalk only scenario. The use of surplus bagasse as feed does not alter the economics signifi-cantly as the value of bagasse as feed is lower than when it is used to generate electricity. The contribution of leaves left on the field via fertilizer though important is small in all scenar-ios.
A fifteen year cash flow analysis shows that the NPV (net present value) of investment for the stalk only scenario is negative under the low and typical cases and positive under the high case. For the stalk + grain scenario, the NPV is positive under typical and high cases with an IRR (internal rates of return) ranging from 70 % to 148 %. Under the grain to food scenario the NPV’s are positive with IRR ranging from 67 % in the typical case to 120 % in the high case. The IRRs are lower when surplus bagasse is used for feed. In the case of syr-up to ethanol scenario the NPV’s are negative in all cases.
Break-even price analysis (i.e., the price where the project NPV becomes zero) is calculated over all the cases by simulating ethanol price. The break-even price ranges from 0.86 € / litre under the low case to 0.44 € / litre under the high case for the stalk to ethanol scenario. The break even prices are much higher under the syrup to ethanol scenario ranging from 1.43 € / litre under low case to 0.63 € / litre under high case.
Cane Fallow Stalk to Ethanol Scenario
Feedstock cost
Processing cost
Labor costs
Interest
Rent
Other pay on wc
Other costs
Grain to food ScenarioFeedstock cost
Processing cost
Labor costs
Interest
Rent
Other pay on wc
Other costs
Syrup to Ethanol Scenario
Feedstock cost
Processing cost
Labor costs
Interest
Rent
Other pay on wc
Other costs
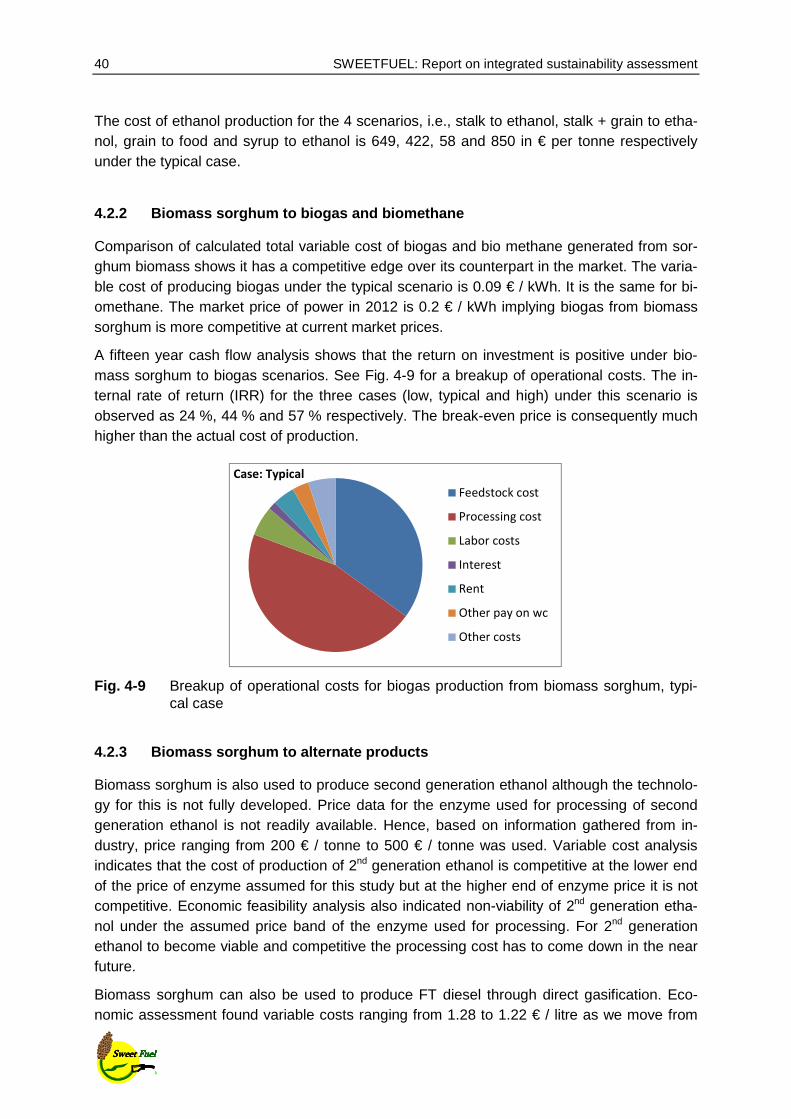
40 SWEETFUEL: Report on integrated sustainability assessment
SSSSweetweetweetweet FFFFueluelueluelSSSSweetweetweetweet FFFFueluelueluel
The cost of ethanol production for the 4 scenarios, i.e., stalk to ethanol, stalk + grain to etha-nol, grain to food and syrup to ethanol is 649, 422, 58 and 850 in € per tonne respectively under the typical case.
4.2.2 Biomass sorghum to biogas and biomethane
Comparison of calculated total variable cost of biogas and bio methane generated from sor-ghum biomass shows it has a competitive edge over its counterpart in the market. The varia-ble cost of producing biogas under the typical scenario is 0.09 € / kWh. It is the same for bi-omethane. The market price of power in 2012 is 0.2 € / kWh implying biogas from biomass sorghum is more competitive at current market prices.
A fifteen year cash flow analysis shows that the return on investment is positive under bio-mass sorghum to biogas scenarios. See Fig. 4-9 for a breakup of operational costs. The in-ternal rate of return (IRR) for the three cases (low, typical and high) under this scenario is observed as 24 %, 44 % and 57 % respectively. The break-even price is consequently much higher than the actual cost of production.
Fig. 4-9 Breakup of operational costs for biogas production from biomass sorghum, typi-cal case
4.2.3 Biomass sorghum to alternate products
Biomass sorghum is also used to produce second generation ethanol although the technolo-gy for this is not fully developed. Price data for the enzyme used for processing of second generation ethanol is not readily available. Hence, based on information gathered from in-dustry, price ranging from 200 € / tonne to 500 € / tonne was used. Variable cost analysis indicates that the cost of production of 2nd generation ethanol is competitive at the lower end of the price of enzyme assumed for this study but at the higher end of enzyme price it is not competitive. Economic feasibility analysis also indicated non-viability of 2nd generation etha-nol under the assumed price band of the enzyme used for processing. For 2nd generation ethanol to become viable and competitive the processing cost has to come down in the near future.
Biomass sorghum can also be used to produce FT diesel through direct gasification. Eco-nomic assessment found variable costs ranging from 1.28 to 1.22 € / litre as we move from
Case: Typical
Feedstock cost
Processing cost
Labor costs
Interest
Rent
Other pay on wc
Other costs

4 Results 41
SSSSweetweetweetweet FFFFueluelueluelSSSSweetweetweetweet FFFFueluelueluel
low to high case. The costs are higher under the gasification with prior pyrolysis. With world diesel prices at 0.85 € / litre the production FT diesel through gasification is not economical. Consequently the returns from the investment i.e., net present value is negative. The break even prices range from 1.2 to 1.5 € / litre as we move from high to low case.
4.3 Summary: SWOT analysis
This subchapter summarises the results of the SWOT analysis report /Rutz & Janssen 2012a/. For further details please refer to the original report.
The SWOT analysis collects and presents qualitative arguments for the cultivation of sweet and biomass sorghum for the conversion into ethanol as energy carrier. This is important as current discussions on the sustainability of biofuel value chains mainly focus on environmen-tal and quantifiable aspects. The evaluation of socio-economic and qualitative impacts is generally more challenging /Rutz et al. 2011/, /Rutz & Janssen 2012b/, /Rutz & Janssen 2012c/ and thus, a SWOT analysis is a good method to present a comprehensive picture of these aspects.
The results of this SWOT analysis contain important information on social sustainability as-pects but also several qualitative technical aspects of the sorghum to energy value chain. In total, more than 450 arguments have been collected and categorised into strengths, weak-nesses, opportunities and threats. Thereby, a clear categorisation was not always possible and repetitions of similar arguments occur in some tables. General arguments given for and against sweet sorghum as energy crop are exemplarily shown in Table 4-2. The analysis can be further extended and completed with additional arguments. For this report, further aspect from a separate ethical assessment (see subchapter 4.3.1) and from /Rutz & Janssen 2014/ were taken into account. For the integrated sustainability assessment, arguments on social sustainability were grouped and categorised. This lead to the selection of seven most im-portant social indicators and a qualitative rating for the assessed scenarios (see also Ta-ble 4-3).
The aim to show different qualitative aspects of sorghum cultivation and processing was suc-cessfully achieved. The SWOT analysis shows a very broad picture of many aspects associ-ated with some key value chains of sorghum use for ethanol and other biofuels. This shall help stakeholders and decision makers building their own opinion about this topic.

42 SWEETFUEL: Report on integrated sustainability assessment
SSSSweetweetweetweet FFFFueluelueluelSSSSweetweetweetweet FFFFueluelueluel
Table 4-2 SWOT for sweet sorghum as energy crop. S: sorghum / energy sorghum, SS: sweet sorghum, BS: biomass sorghum
S1 High genetic variability of S provides good breed-ing opportunities in order to create new improved va-rieties.
S2 S is permitting multiple breeding generations per year due to a short growth cycle (3-4 months).
S3 Genetics of S are relatively well known , genetic diversity is extensive and maintained.
S4 S can grow in a broad environmental range from tropical to temperate regions. S could be a promising energy crop in both developed and developing coun-tries as well as for small and large scale value chains.
S5 S as energy crop can be cultivated and further pro-cessed at very different scales , thus smallholders, but also industry could benefit.
S6 S is characterized by high water, radiation and nutrient use efficiency in comparison to other ener-gy crops (e.g. maize, sugarcane)
S7 S is also suitable for cultivation on marginal soils , thus reducing potential LUC and ILUC impacts. How-ever, yields are lower on marginal soils.
S8 As an efficient C4 plant , S is one of the most effi-cient crops to convert atmospheric CO2 into sugar and starch.
S9 S is an annual crop with a short growth cycle , which can be easily integrated in many cultivation systems. In tropical climates the short growth cycle facilitates several harvests per year, creating oppor-tunities for double cropping.
S10 In tropical and sub-tropical climates S is very suitable to be integrated with sugarcane cultivation . This leads to strong interest of sugarcane producers (e.g. in Argentina, Colombia) in S cultivation.
S11 The crop rotation cycle of S is very flexible facilitat-ing many different crop sequences.
S12 S is suitable for intercropping .
S13 S can be well adapted to no ‐‐‐‐till planting .
S14 Full mechanization of S cultivation is possible, thus, allowing for industrialized value chains.
S15 All aboveground parts of the plant (stalk, leafs, grain) are valuable products . Since the potential use of S is very broad, it can be used for the produc-tion of food (sugar, grains), 1st and 2nd generation ethanol, biomaterials, electricity from bagasse com-bustion, thermochemical biofuels and products, bio-gas, feed and fodder.
S16 Commercial technologies are available for ethanol production from S.
S17 Bagasse and leaves can be used as fuel for process energy and power generation, thus creating a good GHG balance.
S18 Bagasse and leaves can be used as fodder , which is an opportunity to subsistence agriculture of small-scale farmers.
W1 Specific S varieties for ethanol production are insufficient. Availability of commercial seeds of well-defined SS cultivars is limited.
W2 Specific traits important for the ethanol industry (e.g. yield of juice, sugar, ligno-cellulose, grain, total biomass) still need to be defined for rapid genetic improvements. Thereby cul-ture and conditions in growing countries and regions have to be taken into account.
W3 For the improvement of the S value chain, research on new cultivars is needed.
W4 Genetic improvement and crop management of S for sugar yield increases has lagged behind other crops.
W5 Lack of better understanding of interaction of genetic factors (associated with sugar and juice potential) with en-vironmental factors.
W6 There exists a knowledge gap on S biotic and abiotic stress management (e.g. weeds, insects, pathogens, soil, water).
W7 Breeding efforts risk being mainly achieved for cultivars in developed countries (temperate to sub-tropical regions), but not for cultivars in developing countries (sub-tropical to tropical regions) due to the lack of resources.
W8 Intellectual Property (IP) issues hinder free sharing of germplasm among S researchers.
W9 The release of new industrially developed hybrids risks of being not affordable for small-scale farmers .
W10 Introduction of newly developed S cultivars may pose risks for traditional cultivation activities of the rural population.
W11 S as energy crop is still relatively new to many farmers. If not actively promoted there is a threat to be not sufficiently recognized by farmers.
W12 Large scale S cultivation for industry needs many hectares that are difficult to be organized for a centralised industrial plant.
W13 Large-scale industrial S producers may not be interested in the production of both food and ethanol and thus may have a negative impact on (local) food security .
W14 Environmental risks of large-scale S cultivation may in-clude (depending on the cultivation system) negative im-pacts on biodiversity, soil erosion, soil compaction, soil fertili-ty as well as surface and ground water resources. Monocul-tures have negative impacts on the landscape.
W15 As SS is a new crop, wrong agricultural practices could lead to environmental problems (to high application of fertilizers and pesticides/herbicides, wrong irrigation, etc.)
W16 Sugars of SS rapidly degrade . The fresh stalks have to be processed quickly and cannot be stored for a long period.
W17 Simple and cheap methods to stabilise SS juice have not yet been developed.
W18 Harvesting technologies for separate seed, stalk and leaf harvest are not yet mature. If no new harvesting technolo-gies for separate seed, stalk and leaf harvest is developed, SS risks of being only sugar or starch crop and not both.
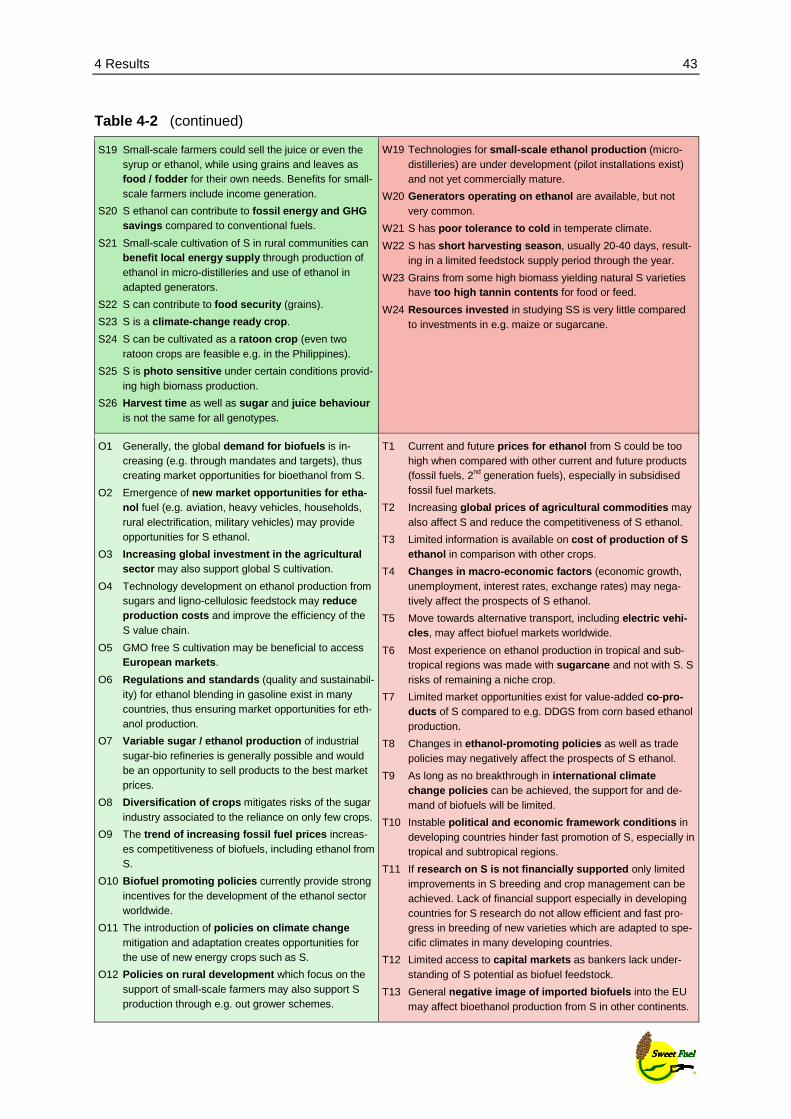
4 Results 43
SSSSweetweetweetweet FFFFueluelueluelSSSSweetweetweetweet FFFFueluelueluel
Table 4-2 (continued)
S19 Small-scale farmers could sell the juice or even the syrup or ethanol, while using grains and leaves as food / fodder for their own needs. Benefits for small-scale farmers include income generation.
S20 S ethanol can contribute to fossil energy and GHG savings compared to conventional fuels.
S21 Small-scale cultivation of S in rural communities can benefit local energy supply through production of ethanol in micro-distilleries and use of ethanol in adapted generators.
S22 S can contribute to food security (grains).
S23 S is a climate-change ready crop .
S24 S can be cultivated as a ratoon crop (even two ratoon crops are feasible e.g. in the Philippines).
S25 S is photo sensitive under certain conditions provid-ing high biomass production.
S26 Harvest time as well as sugar and juice behaviour is not the same for all genotypes.
W19 Technologies for small-scale ethanol production (micro-distilleries) are under development (pilot installations exist) and not yet commercially mature.
W20 Generators operating on ethanol are available, but not very common.
W21 S has poor tolerance to cold in temperate climate.
W22 S has short harvesting season , usually 20-40 days, result-ing in a limited feedstock supply period through the year.
W23 Grains from some high biomass yielding natural S varieties have too high tannin contents for food or feed.
W24 Resources invested in studying SS is very little compared to investments in e.g. maize or sugarcane.
O1 Generally, the global demand for biofuels is in-creasing (e.g. through mandates and targets), thus creating market opportunities for bioethanol from S.
O2 Emergence of new market opportunities for etha-nol fuel (e.g. aviation, heavy vehicles, households, rural electrification, military vehicles) may provide opportunities for S ethanol.
O3 Increasing global investment in the agricultural sector may also support global S cultivation.
O4 Technology development on ethanol production from sugars and ligno-cellulosic feedstock may reduce production costs and improve the efficiency of the S value chain.
O5 GMO free S cultivation may be beneficial to access European markets .
O6 Regulations and standards (quality and sustainabil-ity) for ethanol blending in gasoline exist in many countries, thus ensuring market opportunities for eth-anol production.
O7 Variable sugar / ethanol production of industrial sugar-bio refineries is generally possible and would be an opportunity to sell products to the best market prices.
O8 Diversification of crops mitigates risks of the sugar industry associated to the reliance on only few crops.
O9 The trend of increasing fossil fuel prices increas-es competitiveness of biofuels, including ethanol from S.
O10 Biofuel promoting policies currently provide strong incentives for the development of the ethanol sector worldwide.
O11 The introduction of policies on climate change mitigation and adaptation creates opportunities for the use of new energy crops such as S.
O12 Policies on rural development which focus on the support of small-scale farmers may also support S production through e.g. out grower schemes.
T1 Current and future prices for ethanol from S could be too high when compared with other current and future products (fossil fuels, 2nd generation fuels), especially in subsidised fossil fuel markets.
T2 Increasing global prices of agricultural commodities may also affect S and reduce the competitiveness of S ethanol.
T3 Limited information is available on cost of production of S ethanol in comparison with other crops.
T4 Changes in macro-economic factors (economic growth, unemployment, interest rates, exchange rates) may nega-tively affect the prospects of S ethanol.
T5 Move towards alternative transport, including electric vehi-cles , may affect biofuel markets worldwide.
T6 Most experience on ethanol production in tropical and sub-tropical regions was made with sugarcane and not with S. S risks of remaining a niche crop.
T7 Limited market opportunities exist for value-added co -pro-ducts of S compared to e.g. DDGS from corn based ethanol production.
T8 Changes in ethanol-promoting policies as well as trade policies may negatively affect the prospects of S ethanol.
T9 As long as no breakthrough in international climate change policies can be achieved, the support for and de-mand of biofuels will be limited.
T10 Instable political and economic framework conditions in developing countries hinder fast promotion of S, especially in tropical and subtropical regions.
T11 If research on S is not financially supported only limited improvements in S breeding and crop management can be achieved. Lack of financial support especially in developing countries for S research do not allow efficient and fast pro-gress in breeding of new varieties which are adapted to spe-cific climates in many developing countries.
T12 Limited access to capital markets as bankers lack under-standing of S potential as biofuel feedstock.
T13 General negative image of imported biofuels into the EU may affect bioethanol production from S in other continents.

44 SWEETFUEL: Report on integrated sustainability assessment
SSSSweetweetweetweet FFFFueluelueluelSSSSweetweetweetweet FFFFueluelueluel
Table 4-2 (continued)
O13 Globally the importance for increased research initiatives on agricultural commodities is acknowledged. This may also lead to available fund-ing to further improve S varieties.
O14 Support for biofuels from ligno-cellulosic feed-stock (e.g. through the “double counting” under the RED) may stimulate S as energy crop in temperate regions.
O15 Global sustainability certification schemes for biofuels are established (e.g. Bonsucro, ISCC, RSB) facilitating proof of sustainability to positively influ-ence public perception.
O16 Discussions on food-fuel conflicts create opportu-nities for double purpose crops such as S (ethanol, grains). This may also improve public acceptance for ethanol from S.
O17 Increased droughts and increasing water scarcity due to climate change favour water use efficient plants such as S.
O18 For most crops yield increases are achieved over time due to cultivation improvements. This may facili-tate competitiveness of S ethanol.
O19 Alternative valorisation chains are under develop-ment for S based hydrogen production .
O20 Alternative valorisation chains are under develop-ment for S based biomaterials production (building material, car industry).
O21 Opportunities exist for breeding high yielding varie-ties of S for staggered sowing and for post rainy season .
O22 Opportunities exist for valuation/quantification of environmental benefits to be incorporated with economic and sustainability perspectives.
O23 Incentives to the industry focused on bioenergy, such as land use or tax rates .
O24 Alternative products of SS can be potable alcohol (a high proof alcohol that is drinkable), syrup as a sweetener from the juice, and beer. Stalks can be al-ternatively used as cooking fuel. The farmer has generally different market choices.
T14 General increasing resource competition (land, water) for food, fuel, and fibres may lead to conflicts and reduce avail-able land for S cultivation.
T15 Barriers to entry and licensing issues in developing coun-tries act as a threat for viability of ethanol production from centralized production systems.
T16 Lack of policy support in the initial years will lead to indus-try exiting the business.
T17 Social instability may affect land productivity in general.
T18 Lack of adequate infrastructure may limit the S from field to refinery.
T19 Large-scale industrial S production may lead to land use conflicts between industrial operators and small-scale farmers.
4.3.1 Complementary results: Ethical assessment
A separate assessment of potential ethical issues around the SWEETFUEL project has been conducted /Bursztyn 2014/. Its results were taken into account for the assessments of social sustainability partially supporting and partially extending results of the SWOT analysis.
The importance of ethics as an issue to be considered in research projects is growing. Ethics committees are now part of the institutional framework of the most important academic and non-academic research institutions. This means that together with the definition and imple-mentation of projects their implications must be considered. Moreover researchers are facing the need to submit their activities to the evaluation and compliance to ethical and deontologi-cal regulations. Their responsibility now is not only reaching the results proposed in the pro-
4 Results 45
SSSSweetweetweetweet FFFFueluelueluelSSSSweetweetweetweet FFFFueluelueluel
jects, but also foreseeing the consequences and preventing negative side effects. There is an overall consensus among researchers that such considerations are necessary.
Ethical aspects have been assessed by a conclusive evaluation using questionnaires sup-ported by case studies.
Several ethical issues were addressed in questionnaires to all members of the SWEETFUEL consortium about their perceptions and opinions about ethical implications of their activities. Please see the report for a detailed evaluation of these questionnaires /Bursztyn 2014/.
Apart from the interaction and survey on the views of the members of the consortium, two case studies were previously set by the SWEETFUEL project: India & Brazil. In both cases research was already being carried on previous to SWEETFUEL project and both had their own collection of material to be developed (Brazil – EMBRAPA, India – ICRISAT). Neverthe-less their implications are rather different.
Some aspects raised during the visit to both institutions deserve to be highlighted:
• In India, sweet sorghum is very disseminated among farmers; in Brazil sorghum is a known crop, complementary to other crops (such as maize), but for feeding cattle (grains).
• In India, SS is produced in small scale by small holders; in Brazil, the target of EMBRAPA are large scale sugarcane farmers.
• In India the use of ethanol blended with gasoline is recent and still small. A governmental recommendation from 2012 set the rate of 5 %, but this rate is still to be reached.
• In Brazil ethanol (from sugarcane) is a national policy since the 1970s, both for the supply of ethanol vehicles and to blend with gasoline (25 %). Since 2013 all cars made in Brazil for the national market are flex-fuel.
• In India the “risks” of disruption for the peasants’ economy are to be considered, as they must manage trade-offs between self-consumption and market strategies; in Brazil this is not a risk, but rather an opportunity, as SS is meant to be complementary to sugarcane in large scale farms. But there are risks associated to the increase in the production of sug-arcane in Brazil, as is the case of deforestation. One can consider that the introduction of sweet sorghum may slow the pressure on forests.
• Both ICRISAT and EMBRAPA don’t aim at making profit from the outcomes of their re-search.

46 SWEETFUEL: Report on integrated sustainability assessment
SSSSweetweetweetweet FFFFueluelueluelSSSSweetweetweetweet FFFFueluelueluel
4.4 Integrated sustainability assessment
The integrated assessment of sustainability is a structured way of comparing several sus-tainability aspects into a holistic picture with the aim to provide decision support to politicians and stakeholders. This methodology has been successfully applied in several projects before /Reinhardt et al. 2012/, /Kretschmer et al. 2013a/, /Rettenmaier et al. 2014/. The integrated assessment of sustainability consists of the following steps:
• Selection of relevant scenarios and indicators (subchapter 4.4.1)
• Addition of suitable additional indicators such as CO2-avoidance costs (subchapter 4.4.2)
• Compilation of data (subchapter 4.4.3)
• Categorisation of quantitative data (subchapter 4.4.4)
• Analysis of comparisons of energy sorghum scenarios to a conventional provision of equivalent products (subchapter 4.4.5)
• Analysis of comparisons of energy sorghum scenarios to each other (subchapter 4.4.6)
4.4.1 Selection of indicators
Various aspects of environmental, economic and social sustainability have been studied in individual assessments, which form the basis of this integrated sustainability assessment. These are the environmental and economic assessment as well as SWOT analysis, which includes social aspects /Reinhardt et al. 2014/, /Basavaraj, Parthasarathy Rao et al. 2014/, /Rutz & Janssen 2012a/. Additionally, technological aspects are taken into account originat-ing from /Braconnier et al. 2013/. The impact of the SWEETFUEL life cycles and the conven-tional reference systems on all these aspects is quantified or qualitatively rated using various indicators. The suitability and scientific validity of the indicators has been verified in the indi-vidual assessments. In the integrated sustainability assessment, those indicators were se-lected that provide the most relevant information for decisions between the assessed op-tions. Partially, related specific (qualitative) indicators were merged into a more general indi-cator if values showed similar patterns. For an overview and a short description of the indica-tors see Table 4-3.

4 Results 47
SSSSweetweetweetweet FFFFueluelueluelSSSSweetweetweetweet FFFFueluelueluel
Table 4-3 Overview of sustainability indicators
Impact category Short description Technology
Cultivation experience Experience of farmers with optimal timing, fertilisation etc.
Harvest technology (maturity)
Technical maturity / availability of adapted harvesters.
Conversion technology (maturity)
Technical maturity of fuel / energy production processes.
GMO plant use Potential risks through use of genetically modified plants (++ indicates: not used).
Breeding potential Potential to improve plant properties by conventional breeding.
Storage facilities Need for construction of short-term and seasonal storage facilities for bio-mass.
Environment
Resource depletion: energy
Depletion of non-renewable energy resources, i.e. fossil fuels such as min-eral oil, natural gas, coal and uranium ore.
Climate change Global warming as a consequence of the anthropogenic release of green-house gases. Besides carbon dioxide (CO2), a number of other gases like methane (CH4) and nitrous oxide (N2O) are included.
Acidification Shift of the acid / base equilibrium in soils by acidifying gases like sulphur dioxide, nitrogen oxides and ammonia (keyword ‘acid rain’).
Aquatic eutrophication Input of nutrients into surface water (marine and freshwater) directly or via input into soils and gaseous emissions. E.g. nitrogen and phosphorous species contribute to this (keyword ‘algal bloom’).
Photosmog Formation of specific reactive substances, e.g. ozone, in presence of nitro-gen oxides, volatile hydrocarbons and solar radiation in the lower atmos-phere (keyword ‘ozone alert’ or ‘summer smog’).
Human toxicity (particu-late matter emissions)
Damage to human health due to air pollutants such as fine, primary parti-cles and secondary particles (mainly from NOX, NH3 and SO2, keyword ‘winter smog’ or ‘London smog’).
(Stratospheric) Ozone depletion
Loss of the protective ozone layer in the stratosphere by certain gases such as CFCs or nitrous oxide (keyword ‘ozone hole’).
Direct land use Occupation of agricultural land by production of crops.
Net land use Direct land use minus agricultural land that may not be cultivated anymore elsewhere because co-products of the assessed process like feed replace dedicated feed crops.
Water Local water availability for ecosystems and its quality.
Soil Soil quality is affected e.g. by erosion, compaction or organic matter con-tent.
Fauna Local biodiversity among animals is affected e.g. by the presence of di-verse habitats.
Flora Biodiversity among plants on and around cultivated areas is affected e.g. by weed control measures.
Landscape Characteristics and diversity of the landscape.
48 SWEETFUEL: Report on integrated sustainability assessment
SSSSweetweetweetweet FFFFueluelueluelSSSSweetweetweetweet FFFFueluelueluel
Table 4-3 (continued)
Impact category Short description
Economy
Total capital investment Sum of invested capital for the biorefinery facility including utilities.
NPV The net present value is the sum of expenses and future returns discounted at a rate of 10 % per year (in this case).
Profit Profits for the conversion plant operator. Negative values indicate support that would be necessary to reach a break-even (no profit / no loss) based on prices indicated in /Basavaraj, Parthasarathy Rao et al. 2014/.
IRR (Internal Rate of Return)
The Internal Rate of Return is defined as the discount rate at which the NPV is just equal to zero. The higher the IRR, the more favourable the in-vestment project appears.
CO2 avoidance costs Losses (or profits if indicator result is negative) per unit of avoided green-house gas emissions. This indicator is not defined if no greenhouse gas emissions are avoided.
Energy resource savings costs
Losses per unit of saved non-renewable energy resources (analogous to CO2 avoidance costs).
Society
Food security Influence on local food security via food or feed production.
Income for farmers / local community
Income in the agricultural sector through (by-) product sales.
Access to land, land rights
Availability of land and legal / contractual basis of land use.
Access to jobs Job creation / conservation, here mostly related to biorefineries.
Acceptance by farmers Perception and preferences among farmers.
Acceptance by general society
Perception and preferences in the general public. This also includes as-pects like expected national revenues.
Innovation Innovation by development and implementation of new processes.
4.4.2 Additional indicators
There are indicators like CO2 avoidance costs, which connect aspects of more than one pillar of sustainability (here: environment and economy) so that they can only be added in the inte-grated assessment.
CO2 avoidance costs1 are based on greenhouse gas emission savings and the price support per tonne of biomass that is needed to make an investment attractive (i.e. an internal rate of return of 10 % is reached). As another example, energy resource savings costs are derived in the same way from the indicator “Resource savings: energy” (energy demand from non-renewable resources).
1 The name of this indicator is applied here because of its common use. Nevertheless, greenhouse gases besides CO2 are taken into account as well for its calculation.

4 Results 49
SSSSweetweetweetweet FFFFueluelueluelSSSSweetweetweetweet FFFFueluelueluel
Such indicators can give additional information but may also lead to wrong conclusions if they are not interpreted carefully (see subchapter 2.2.3 for details). In this case, it is very important that both avoidance / savings costs indicators can only indicate the efficiency of reaching a certain target (e.g.: How expensive is it to avoid greenhouse gas emissions under certain conditions?) but not the efficacy of reaching it (e.g.: How certain is that such emis-sions are avoided at all?). For political decisions, however, the latter question should be more important.
4.4.3 Overview of data
Available data for all scenarios and indicators under typical conditions is shown in Table 4-4 and Table 4-5. N/D indicates that there is no data on a particular aspect. In contrast, N/A indicates that the indicator is not applicable under those particular conditions. This is for ex-ample the case for CO2 avoidance costs if there are no greenhouse gas emission savings or for the IRR if there is no overall profit. Further data for the sub-scenarios “low” and “high” is shown in Table 7-2 in the annex.

50 SWEETFUEL: Report on integrated sustainability assessment
SSSSweetweetweetweet FFFFueluelueluelSSSSweetweetweetweet FFFFueluelueluel
Table 4-4 Overview of selected indicators and results for sweet sorghum scenarios in comparison to conventional systems under typical conditions. GMO: genetically modified organism, NPV: net present value, IRR: internal rate of return, N/A: not applicable, N/D: no data, *: see text (subchapter 4.4.5).
Can
e fa
llow
Can
e fa
llow
(L
eave
s to
en
ergy
)
Can
e fa
llow
(S
urpl
us b
agas
se
to f
eed)
Can
e fa
llow
(M
ax.
feed
)
Can
e fa
llow
201
5 (n
o gr
ain
use)
Can
e fa
llow
(la
nd
use
chan
ge)
Gra
in t
o fo
od
Gra
in t
o fo
od
(Lea
ves
to f
eed)
Gra
in t
o fo
od
(Sur
plus
bag
asse
to
fee
d)
Gra
in t
o fo
od
(Max
. fe
ed)
Syr
up p
rodu
ctio
n
Syr
up p
rodu
ctio
n (f
uel:
rice
stra
w)
Grain use Ethanol Ethanol Ethanol Ethanol Fertil. Ethanol Food Food Food Food Food FoodSurplus bagasse use
Energy Energy Feed Feed Energy Energy Energy Energy Feed Feed Feed Feed
Leaves use Fertil. Energy Fertil. Feed Fertil. Fertil. Fertil. Feed Fertil. Feed Feed FeedArea Indicator Unit
Cultivation experience ─ - - - - - - - - - - - -
Harvest technol. (maturity) ─ - - - - + - - - - - N/A N/A
Conversion technol. (maturity) ─ + + + + + + + + + + + +
GMO plant use ─ ++ ++ ++ ++ ++ ++ ++ ++ ++ ++ ++ ++Breeding potential ─ + + + + + + + + + + + +Storage facilities ─ - - - - - - 0 - - - - - - - N/A N/A
Resource depletion: energy GJ / (ha × yr) -109 -163 -84 -88 -84 -109 -67 -70 -36 -39 8 -30
Climate change t CO2 eq. /
(ha × yr)-4.5 -7.2 -3.8 -4.4 -2.6 3.2 -2.0 -2.5 -1.2 -1.6 1.4 -1.2
Acidification kg SO2 eq. /
(ha × yr)44 43 36 32 39 44 30 27 19 16 22 30
Terrestrial eutrophication
kg PO4 eq. /
(ha × yr)7.1 7.0 6.0 5.3 6.1 7.1 4.6 4.0 3.2 2.7 3.1 3.4
Aquatic eutrophication
kg PO4 eq. /(ha × yr)
19 20 18 18 16 19 12 12 11 11 19 19
Photosmog kg ethene eq. /(ha × yr)
-3.6 -4.0 -3.5 -3.6 -1.8 -3.6 -1.3 -1.3 -1.1 -1.2 -0.7 -1.5
Human toxicity kg PM10 eq. /(ha × yr)
25 21 23 21 22 25 16 14 13 11 18 23
Ozone depletion g R11 eq. /(ha × yr)
154 169 118 100 144 154 111 98 65 52 44 59
Direct land use ha × yr /(ha × yr)
1 1 1 1 1 1 1 1 1 1 1 1
Net land use net ha × yr /(ha × yr)
0.9 0.9 -0.1 N/D 1.0 0.9 0.2 N/D -1.1 N/D N/D N/D
Water ─ - - - - - - - 0 * 0 * 0 * 0 * - -
Soil ─ - - - - - - - - 0 * 0 * 0 * 0 * - - - -
Fauna ─ - - - - - - - 0 * 0 * 0 * 0 * - -
Flora ─ - - - - - - - - - - - - - * - * - * - * - - - -
Landscape ─ - - - - - - - 0 * 0 * 0 * 0 * - -
Total capital investment
Million € / plant 58 58 58 58 58 58 58 58 58 58 58 58
NPV Million € / plant 225 N/D 181 N/D -68 225 214 N/D 164 N/D -147 N/DProfit € / (ha × yr) 453 N/D 364 N/D -196 453 464 N/D 356 N/D -424 N/D
IRR % 70% N/D 59% N/D N/A 70% 67% N/D 54% N/D N/A N/D
CO2 avoidance costs
€ / t CO2 eq. -101 N/D -96 N/D 77 N/A -228 N/D -303 N/D N/A N/D
Energy resource savings costs € / GJ -4 N/D -4 N/D 2 -4 -7 N/D -10 N/D N/A N/D
Food security ─ 0 0 + + 0 - + + ++ ++ ++ ++Income for farmers / local community
─ + + + + 0 0 + + + + ++ ++
Access to land, land rights ─ - - - - - - 0 0 0 0 0 0
Access to jobs ─ + + + + + 0 + + + + ++ ++Acceptance by farmers
─ 0 0 0 0 0 0 + + + + + +
Acceptance by general society ─ 0 0 + + 0 0 + + + + ++ ++
Innovation ─ 0 + + + - + ++ ++ ++ ++ + +
Sweet sorghum scenarios
Soc
iety
Eco
nom
yE
nviro
nmen
tT
echn
olog
y

4 Results 51
SSSSweetweetweetweet FFFFueluelueluelSSSSweetweetweetweet FFFFueluelueluel
Table 4-5 Overview of selected indicators and results for biomass sorghum scenarios in comparison to conventional systems under typical conditions. For abbreviations see Table 4-4.
Bio
gas
(CH
P)
Bio
gas
(Pow
er)
Bio
met
hane
(C
HP
)
Bio
met
hane
(f
uel)
Bio
met
hane
(n
atur
al g
as)
2nd g
en.
etha
nol
Dire
ct
com
bust
ion
(CH
P)
Dire
ct
com
bust
ion
(pow
er)
Dire
ct
com
bust
ion
(hea
t)
Gas
ifica
tion
Gas
ifica
tion
(Pyr
olys
is)
Area Indicator Unit
Cultivation experience ─ - - - - - - - - - - -
Harvest techn. (maturity) ─ + + + + + + + + + + +
Conversion techn. (maturity) ─ + + + + + - 0 0 0 - - - -
GMO plant use ─ ++ ++ ++ ++ ++ ++ ++ ++ ++ ++ ++Breeding potential ─ ++ ++ ++ ++ ++ ++ ++ ++ ++ ++ ++Storage facilities ─ 0 0 0 0 0 0 0 0 0 0 0
Resource depletion: energy GJ / (ha × yr) -357 -336 -385 -165 -162 -71 -546 -304 -351 -148 -51
Climate change t CO2 eq. / (ha × yr) -11.2 -9.8 -17.9 -10.1 -5.7 -1.8 -28.9 -12.2 -22.4 -5.9 -0.2Acidification kg SO2 eq. / (ha × yr) 53 54 43 71 97 80 28 37 72 35 53Terrestrial eutrophication kg PO4 eq. / (ha × yr) 16.1 16.2 13.9 12.6 16.5 10.3 5.5 6.7 8.5 8.0 9.6
Aquatic eutrophication kg PO4 eq. / (ha × yr) 31 31 32 32 32 30 23 23 23 23 23
Photosmog kg ethene eq. / (ha × yr) -0.8 -0.3 -3.3 -17.5 -3.6 -4.8 -7.5 -1.8 -5.9 -2.0 -1.9Human toxicity kg PM10 eq. / (ha × yr) 1 2 1 29 54 52 -7 3 40 17 37Ozone depletion g R11 eq. / (ha × yr) 180 180 176 162 183 253 230 235 234 169 172Direct land use ha × yr / (ha × yr) 1 1 1 1 1 1 1 1 1 1 1Net land use net ha × yr / (ha × yr) 1.0 1.0 1.0 1.0 1.0 1.0 1.0 1.0 1.0 1.0 1.0Water ─ - - - - - - - - - - -
Soil ─ - - - - - - - - - - - - - - - -
Fauna ─ - - - - - - - - - - -
Flora ─ - - - - - - - - - - - - - - - - - - - - - -
Landscape ─ 0 0 0 0 0 0 0 0 0 0 0
Total capital investment
Million € / plant 2 N/D N/D N/D N/D 112 N/D N/D N/D 56 56
NPV Million € / plant 4 N/D 3 N/D N/D -105 N/D N/D N/D -363 -847Profit € / (ha × yr) 1575 N/D 1118 N/D N/D -762 N/D N/D N/D -1313 -3062
IRR % 44% N/D 34% N/D N/D N/A N/D N/D N/D N/A N/A
CO2 avoidance
costs€ / t CO2 eq. -140 N/D -62 N/D N/D 417 N/D N/D N/D 223 12774
Energy resource savings costs € / GJ -4 N/D -3 N/D N/D 11 N/D N/D N/D 9 60
Food security ─ N/A N/A N/A N/A N/A N/A N/A N/A N/A N/A N/AIncome for farmers / local community
─ + 0 + + + + + N/D N/D + +
Access to land, land rights ─ - - - - - - - N/D N/D - -
Access to jobs ─ + + + + + + + N/D N/D + +Acceptance by farmers ─ + + + + + 0 0 N/D N/D 0 0
Acceptance by general society ─ 0 - + + + + 0 N/D N/D + +
Innovation ─ + 0 ++ ++ ++ ++ + N/D N/D ++ ++Soc
iety
Biomass sorghum scenarios
Tec
hnol
ogy
Env
ironm
ent
Eco
nom
y
52 SWEETFUEL: Report on integrated sustainability assessment
SSSSweetweetweetweet FFFFueluelueluelSSSSweetweetweetweet FFFFueluelueluel
4.4.4 Categorisation
For comparability to qualitative indicators, quantitative indicators are categorised and the table is coloured accordingly (Table 4-4 and Table 4-5). Results are rated advantageous (green) if the assessed scenario shows lower burdens or higher advantages than the respec-tive conventional reference scenario under typical conditions. Depending on the indicator, this can be at either negative net results (for indicators showing burdens) or at positive net results (for indicators showing advantages). Disadvantageous results are analogously col-oured red. The investment sum is not categorised because there is no reference value. Net land occupation is categorised in three steps: If there is no reduction compared to direct land occupation (1 net ha x yr / (ha x yr)), the result is rated disadvantageous (red). If net land occupation is negative, it is rated advantageous (green) and otherwise it is rated neutral (yel-low).
4.4.5 Comparison energy sorghum vs. conventional pr oducts
The data tables (Table 4-4 and Table 4-5) show, which advantages or disadvantages of en-ergy sorghum cultivation and use exist compared to providing conventional equivalent prod-ucts, which are mostly of fossil origin. As there is no scenario without disadvantages, political processes with all involved stakeholders are needed to decide, which disadvantages are acceptable in return for the advantages.
Several typical patterns of results can be identified in the data:
For sweet sorghum and biomass sorghum
• Regarding global and regional environmental impacts, a specific pattern of impacts can be observed: Savings in greenhouse gas emissions, non-renewable energy consumption and photosmog are contrasted by additional environmental burdens regarding acidifica-tion, eutrophication, human toxicity through inhalation of particulate matter and ozone depletion.
• Economic indicators generally point into the same direction as they display various facets of the same aspect profitability.
For sweet sorghum
• Differences in technological aspects mostly arise from varying by-product use in sweet sorghum scenarios.
• For sweet sorghum, net land use shows variable outcomes depending on the use of co-products.
For biomass sorghum
• In biomass sorghum scenarios, differences in technological aspects are mostly related to the used conversion technology and its requirements.

4 Results 53
SSSSweetweetweetweet FFFFueluelueluelSSSSweetweetweetweet FFFFueluelueluel
Table 4-6 Overview of results per net area occupation for sweet sorghum scenarios in comparison to conventional systems. For abbreviations see Table 4-4.
Can
e fa
llow
Can
e fa
llow
(L
eave
s to
en
ergy
)
Can
e fa
llow
20
15 (
no
grai
n us
e)
Can
e fa
llow
(la
nd u
se
chan
ge)
Gra
in t
o fo
od
Grain use Ethanol Ethanol Fertil. Ethanol FoodSurplus bagasse use Energy Energy Energy Energy EnergyLeaves use Fertil. Energy Fertil. Fertil. Fertil.
Area Indicator Unit
Cultivation experience ─ - - - - -
Harvest technology (maturity) ─ - - + - -
Conversion technology (maturity) ─ + + + + +
GMO plant use ─ ++ ++ ++ ++ ++Breeding potential ─ + + + + +Storage facilities ─ - - - 0 - -
Resource depletion: energy GJ / (net ha × yr) -125 -188 -84 -125 -402
Climate change t CO2 eq. / (net ha × yr) -5.2 -8.3 -2.5 3.6 -12.2Acidification kg SO2 eq. / (net ha × yr) 51 50 39 51 177Terrestrial eutrophication kg PO4 eq. / (net ha × yr) 8.1 8.1 6.1 8.1 27.2
Aquatic eutrophication kg PO4 eq. / (net ha × yr) 22 23 16 22 70Photosmog kg ethene eq. / (net ha × yr) -4.2 -4.6 -1.8 -4.2 -7.5Human toxicity kg PM10 eq. / (net ha × yr) 29 24 22 29 96Ozone depletion g R11 eq. / (net ha × yr) 177 195 144 177 662Direct land use ha × yr / (net ha × yr) 1.2 1.2 1.0 1.2 6.0Net land use net ha × yr / (net ha × yr) 1 1 1 1 1Water ─ - - - - - -
Soil ─ - - - - - - -
Fauna ─ - - - - - -
Flora ─ - - - - - - - - - -Landscape ─ - - - - - -
Total capital investment Million € / plant 58 58 58 58 58NPV Million € / plant 225 N/D -68 225 214Profit € / (net ha × yr) 523 N/D -195 523 2770IRR % 70% N/D N/A 70% 67%CO2 avoidance costs € / t CO2 eq. -101 N/D 77 N/A -228Energy resource savings costs € / GJ -4 N/D 2 -4 -7
Food security ─ 0 0 0 - +Income for farmers / local community ─ + + 0 0 +
Access to land, land rights ─ - - - - 0
Access to jobs ─ + + + 0 +Acceptance by farmers ─ 0 0 0 0 +Acceptance by general society ─ 0 0 0 0 +
Innovation ─ 0 + - + ++
Eco
nom
yS
ocie
ty
Sweet sorghum scenarios
Tec
hnol
ogy
Env
ironm
ent

54 SWEETFUEL: Report on integrated sustainability assessment
SSSSweetweetweetweet FFFFueluelueluelSSSSweetweetweetweet FFFFueluelueluel
For some sweet sorghum scenarios, net land use deviates strongly from direct land use and even leads to negative results in some cases. The reason is that some by-products are used as feed or food and replace feed / food, which is conventionally cultivated separately. These areas for separate feed / food cultivation are not needed any more if feed / food are instead provided by sweet sorghum. Originally, the unit of reference “per ha per yr of direct land use” for all quantitative impacts has been chosen because the used agricultural land is the limiting factor for energy sorghum cultivation. The most efficient climate change mitigation is thus achieved by those scenarios, which show the highest greenhouse gas emission savings per area of land used. If net land use deviates strongly from direct land use, all other impacts should be compared on the basis of net land use rather than direct land use because the former is limiting overall achievable benefits (Table 4-6). However, these figures should be interpreted carefully for the following reasons:
• Figures for net land use are less certain than figures for direct land use. They vary in their quality depending on whether the replacement is direct (sweet sorghum vs. grain sor-ghum in “Grain to food” scenarios) or indirect (feed replaces variable conventional feed sources on the regional market).
• Net land use can only be smaller than direct land use if alternative cultures are replaced in reality. This means for example, that feed is really cultivated separately in the respec-tive region and is not a co-product of another process, a residue like food waste or simi-lar. Furthermore, the separate feed production needs to be given up instead of increasing meat or dairy production.
• In the case of very small or negative results for net land use, it does not make sense to express other impacts per net land use because land use is not limiting any more. This is reflected in meaningless results of other indicators per net land use, which tend towards infinity (for very small net land use) or change their sign (for negative net land use). Thus, respective scenarios were omitted in Table 4-6.
• In some cases, figures related to net land use are more decisive: Although qualitative results are formally independent of reference units, some ratings are based on the pre-condition that idle land is taken into use for cultivation. This especially applies to local en-vironmental impacts, which are mostly negative if idle land is taken into use. Thus, these ratings are most relevant on a net land use basis if similar cultures are replaces (e.g. grain sorghum by sweet sorghum). For consistency, respective ratings on a direct land use basis are modified to reflect lower net impacts in the “Grain to food“ scenarios (marked with asterisks).
In summary, all energy sorghum scenarios show advantages and disadvantages, which re-quires a political decision process. Yet, it is possible under certain conditions to achieve sweet sorghum cultivation without additional land because co-products can be used to re-place area-intensive conventional cultures.

4 Results 55
SSSSweetweetweetweet FFFFueluelueluelSSSSweetweetweetweet FFFFueluelueluel
4.4.6 Benchmarking of energy sorghum scenarios
Not all energy sorghum scenarios, which provide advantages over conventional products, can be realised on a big scale because land availability is limited. Thus, the best of these competing scenarios have to be identified. In theory, that scenario is best, which is clearly better than all other scenarios in all indicators under all conditions. However, such a scenario does not exist among the assessed energy sorghum cultivation and use scenarios. Thus, each candidate scenario has some disadvantages compared to several alternatives. These conflicts are important to know for decision makers but not immediately available from the result tables (Table 4-4 and Table 4-5). For this purpose, candidate scenarios are compared to all other scenarios in a benchmarking process. In this process, suitable benchmarks (can-didate scenarios) and a comparison metric is identified. This metric should provide infor-mation on:
• whether a scenario is better or worse than the benchmark regarding a certain indicator,
• whether this holds true in the high and low cases, too, if data is available (see Table 7-2 in the annex),
• whether the differences are robust.
The metric is described in detail in subchapter 2.2.4. It provides the following results from very advantageous (++) to very disadvantageous (--) compared to the benchmark. As the reference always is another energy sorghum scenario, which was selected as benchmark, the rating does not state whether advantages compared to the conventional reference (e.g. fossil fuels) occur. For example, a (-) for “Cane fallow 2015 (no grain use)” compared to “Cane fallow” in Table 4-7 means that the early implementation scenario without grain use is worse than the mature scenario with grain use regarding the achieved mitigation of climate change (per ha per yr), although both achieve considerable mitigations compared to gasoline etc..
No difference (0) between two scenarios means for quantitative indicators that the difference is smaller than 5 % of the overall range of results among all scenarios. This threshold is cho-sen to reflect variability and uncertainty. However, a threshold cannot reflect aspects of un-certainty arising from data quality issues. In this regard, all comparisons between scenarios containing agricultural systems regarding the impacts on aquatic eutrophication, photosmog and ozone depletion have to be interpreted carefully. These impacts strongly depend on few input parameters, which are associated with a relatively high uncertainty.
All quantitative indicators used in the benchmarking process are expressed per directly used agricultural area as this is the limited resource, about which the scenarios are competing. Although qualitative results do not have units, this is important because a different unit of the input (e.g. per t of ethanol) would lead to different results. Net land occupation is given as indicator instead of using it as unit of reference because results are not very certain as dis-cussed in subchapter 4.4.5.
Besides the definition of a suitable comparison metric, the decision context specifies which scenarios have to be compared to each other and which benchmark is suitable for each comparison. The following decision contexts and scenario selections were identified:

56 SWEETFUEL: Report on integrated sustainability assessment
SSSSweetweetweetweet FFFFueluelueluelSSSSweetweetweetweet FFFFueluelueluel
• Which scenario is best for cultivating sweet sorghum as part of sugarcane crop rotation schemes?
→→→→ Comparison of all “Cane fallow” scenario variants with the main scenario “Cane fallow” as benchmark (Table 4-7).
• Which scenario is best for cultivating sweet sorghum instead of grain sorghum?
→→→→ Comparison of all “Grain to food” scenario variants with the main scenario “Grain to food” as benchmark (Table 4-8).
• Which are general advantages and disadvantages of the three sweet sorghum cultivation and use approaches “Cane fallow”, “Grain to food” and “Syrup production” (as a guideline in other decision contexts)?
→→→→ Comparison of all respective main scenarios with “Cane fallow” as benchmark (Table 4-9).
• Which scenario is best for cultivation and use of biomass sorghum?
→→→→ Comparison of all biomass sorghum scenarios with the main scenario “Biogas (CHP)” as benchmark (Table 4-10), which highlights differences between those scenarios studied in detail. Furthermore, comparison to the most efficient scenario “Direct combustion (CHP)” as benchmark (Table 4-11), to highlight overall per-spectives.
All results, conclusions and recommendations resulting from the shown comparison tables are discussed in detail in chapter 5.
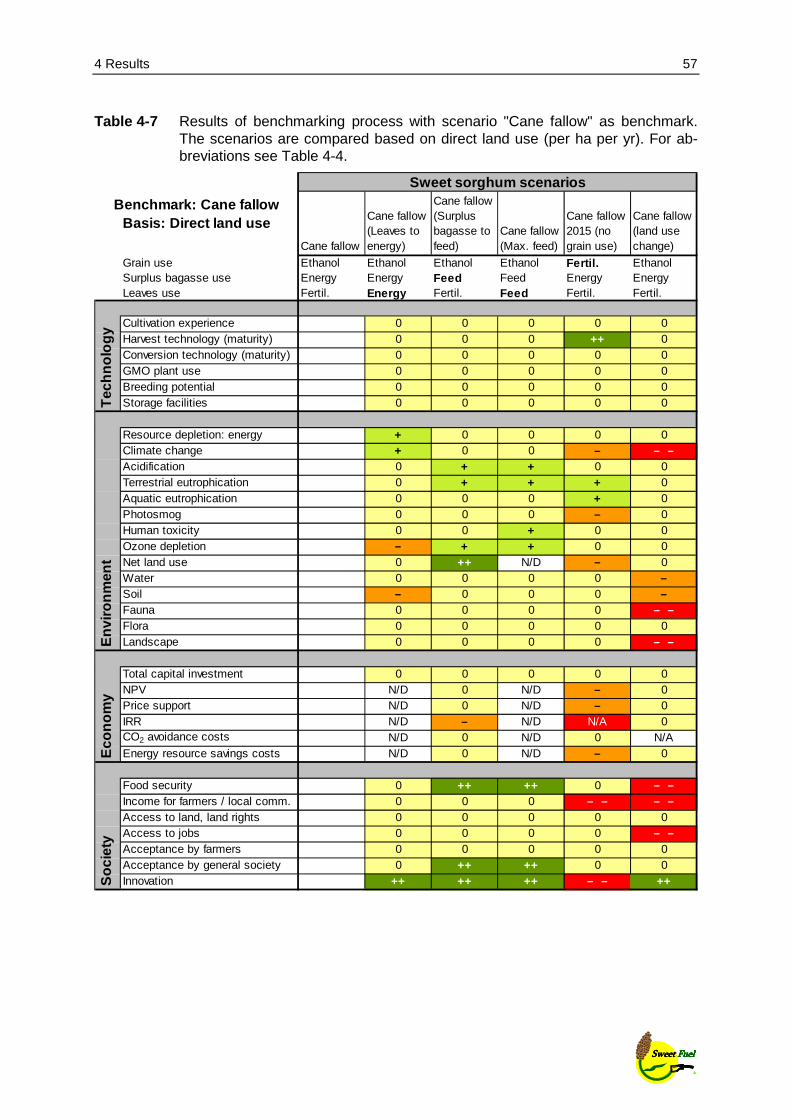
4 Results 57
SSSSweetweetweetweet FFFFueluelueluelSSSSweetweetweetweet FFFFueluelueluel
Table 4-7 Results of benchmarking process with scenario "Cane fallow" as benchmark. The scenarios are compared based on direct land use (per ha per yr). For ab-breviations see Table 4-4.
Cane fallow
Cane fallow (Leaves to energy)
Cane fallow (Surplus bagasse to feed)
Cane fallow (Max. feed)
Cane fallow 2015 (no grain use)
Cane fallow (land use change)
Grain use Ethanol Ethanol Ethanol Ethanol Fertil. EthanolSurplus bagasse use Energy Energy Feed Feed Energy EnergyLeaves use Fertil. Energy Fertil. Feed Fertil. Fertil. Cultivation experience 0 0 0 0 0Harvest technology (maturity) 0 0 0 ++ 0Conversion technology (maturity) 0 0 0 0 0GMO plant use 0 0 0 0 0Breeding potential 0 0 0 0 0Storage facilities 0 0 0 0 0
Resource depletion: energy + 0 0 0 0Climate change + 0 0 - - -
Acidification 0 + + 0 0Terrestrial eutrophication 0 + + + 0Aquatic eutrophication 0 0 0 + 0Photosmog 0 0 0 - 0Human toxicity 0 0 + 0 0Ozone depletion - + + 0 0Net land use 0 ++ N/D - 0Water 0 0 0 0 -
Soil - 0 0 0 -
Fauna 0 0 0 0 - -
Flora 0 0 0 0 0Landscape 0 0 0 0 - -
Total capital investment 0 0 0 0 0NPV N/D 0 N/D - 0Price support N/D 0 N/D - 0IRR N/D - N/D N/A 0CO2 avoidance costs N/D 0 N/D 0 N/AEnergy resource savings costs N/D 0 N/D - 0 Food security 0 ++ ++ 0 - -
Income for farmers / local comm. 0 0 0 - - - -
Access to land, land rights 0 0 0 0 0Access to jobs 0 0 0 0 - -
Acceptance by farmers 0 0 0 0 0Acceptance by general society 0 ++ ++ 0 0Innovation ++ ++ ++ - - ++
Sweet sorghum scenarios
Soc
iety
Benchmark: Cane fallowBasis: Direct land use
Tec
hnol
ogy
Env
ironm
ent
Eco
nom
y

58 SWEETFUEL: Report on integrated sustainability assessment
SSSSweetweetweetweet FFFFueluelueluelSSSSweetweetweetweet FFFFueluelueluel
Table 4-8 Results of benchmarking process with scenario "Grain to food" as benchmark. The scenarios are compared based on direct land use (per ha per yr). For ab-breviations see Table 4-4.
Grain to food
Grain to food (Leaves to feed)
Grain to food (Surplus bagasse to feed)
Grain to food (Max. feed)
Grain use Food Food Food FoodSurplus bagasse use Energy Energy Feed FeedLeaves use Fertil. Feed Fertil. Feed Cultivation experience 0 0 0Harvest technology (maturity) 0 0 0Conversion technology (maturity) 0 0 0GMO plant use 0 0 0Breeding potential 0 0 0Storage facilities 0 0 0 Resource depletion: energy 0 - 0Climate change 0 0 0Acidification 0 + ++Terrestrial eutrophication 0 + ++Aquatic eutrophication 0 0 0Photosmog 0 0 0Human toxicity 0 0 +Ozone depletion + ++ ++Net land use N/D ++ N/DWater 0 0 0Soil 0 0 0Fauna 0 0 0Flora 0 0 0Landscape 0 0 0 Total capital investment 0 0 0NPV N/D 0 N/DPrice support N/D 0 N/DIRR N/D - N/DCO2 avoidance costs N/D 0 N/DEnergy resource savings costs N/D 0 N/D Food security 0 ++ ++Income for farmers / local comm. 0 0 0Access to land, land rights 0 0 0Access to jobs 0 0 0Acceptance by farmers 0 0 0Acceptance by general society 0 0 0Innovation 0 0 0S
ocie
ty
Sweet sorghum scenarios
Benchmark: Grain to foodBasis: Direct land use
Tec
hnol
ogy
Env
ironm
ent
Eco
nom
y

4 Results 59
SSSSweetweetweetweet FFFFueluelueluelSSSSweetweetweetweet FFFFueluelueluel
Table 4-9 Results of benchmarking process with scenario "Cane fallow" as benchmark. The scenarios are compared based on direct land use (per ha per yr). For ab-breviations see Table 4-4.
Sweet sorghum scenarios
Cane fallow Grain to food
Syrup production
Grain use Ethanol Food FoodSurplus bagasse use Energy Energy FeedLeaves use Fertil. Fertil. Feed Cultivation experience 0 0Harvest technology (maturity) 0 N/AConversion technology (maturity) 0 0GMO plant use 0 0Breeding potential 0 0Storage facilities 0 0 Resource depletion: energy 0 - -
Climate change 0 - -
Acidification 0 +Terrestrial eutrophication 0 +Aquatic eutrophication 0 0Photosmog 0 0Human toxicity 0 0Ozone depletion 0 ++Net land use ++ N/DWater + 0Soil + 0Fauna 0 0Flora 0 0Landscape 0 0 Total capital investment 0 0NPV 0 - -
Price support 0 - -
IRR - N/ACO2 avoidance costs 0 N/DEnergy resource savings costs 0 N/D Food security ++ ++Income for farmers / local comm. 0 ++Access to land, land rights ++ ++Access to jobs 0 ++Acceptance by farmers ++ ++Acceptance by general society ++ ++Innovation ++ ++S
ocie
tyBenchmark: Cane fallow
Basis: Direct land useT
echn
olog
yE
nviro
nmen
tE
cono
my

60 SWEETFUEL: Report on integrated sustainability assessment
SSSSweetweetweetweet FFFFueluelueluelSSSSweetweetweetweet FFFFueluelueluel
Table 4-10 Results of benchmarking process with scenario "Biogas (CHP)" as benchmark. The scenarios are compared based on direct land use (per ha per yr). For ab-breviations see Table 4-4.
Biogas (CHP)
Biogas (Power)
Bio-methane (CHP)
Bio-methane (fuel)
Bio-methane (natural gas)
2nd gen. ethanol
Direct comb. (CHP)
Direct comb. (power)
Direct comb. (heat)
Gasifi-cation
Gasifi-cation (Pyro-lysis)
Cultivation experience 0 0 0 0 0 0 0 0 0 0
Harvest technology (maturity)
0 0 0 0 0 0 0 0 0 0
Conversion technology (maturity)
0 0 0 0 - - - - - - - - - - - -
GMO plant use 0 0 0 0 0 0 0 0 0 0Breeding potential 0 0 0 0 0 0 0 0 0 0
Storage facilities 0 0 0 0 0 0 0 0 0 0
Resource depletion: energy
0 0 - - - - + - 0 - - -
Climate change 0 + 0 - - + 0 + - -
Acidification 0 + - - - - - - + + - - + 0Terrestrial eutrophication 0 + + 0 + ++ ++ + + +
Aquatic eutrophication 0 0 0 0 0 + + + + +
Photosmog 0 + ++ + + ++ + ++ + +Human toxicity 0 0 - - - - - - + 0 - - - - - -
Ozone 0 0 + 0 - - - - - - - - 0 0Net land use 0 0 0 0 0 0 0 0 0 0Water 0 0 0 0 0 0 0 0 0 0Soil 0 0 0 0 + + + + + +Fauna 0 0 0 0 0 0 0 0 0 0
Flora 0 0 0 0 0 0 0 0 0 0Landscape 0 0 0 0 0 0 0 0 0 0 Total capital investment
N/D N/D N/D N/D - - N/D N/D N/D - - - -
NPV N/D 0 N/D N/D - - N/D N/D N/D - - - -
Price support N/D - N/D N/D - - N/D N/D N/D - - - -
IRR N/D - N/D N/D N/A N/D N/D N/D N/A N/A
CO2 avoidance
costs N/D 0 N/D N/D 0 N/D N/D N/D 0 -
Energy resource savings costs
N/D 0 N/D N/D - - N/D N/D N/D - - - -
Food security N/A N/A N/A N/A N/A N/A N/A N/A N/A N/A N/AIncome for farmers / local communities
- - 0 0 0 0 0 - - - - 0 0
Access to land, land rights
0 0 0 0 0 0 ++ ++ 0 0
Access to jobs 0 0 0 0 0 0 - - - - 0 0
Acceptance by farmers
0 0 0 0 - - - - - - - - - - - -
Acceptance by general society
- - ++ ++ ++ ++ 0 0 0 ++ ++
Innovation - - ++ ++ ++ ++ 0 - - - - ++ ++Soc
iety
Biomass sorghum scenariosBenchmark: Biogas (CHP)Basis: Direct
land use
Tec
hnol
ogy
Env
ironm
ent
Eco
nom
y

4 Results 61
SSSSweetweetweetweet FFFFueluelueluelSSSSweetweetweetweet FFFFueluelueluel
Table 4-11 Results of benchmarking process with scenario "Direct combustion (CHP)" as benchmark. The scenarios are compared based on direct land use (per ha per yr). For abbreviations see Table 4-4.
Biogas (CHP)
Biogas (Power)
Bio-methane (CHP)
Bio-methane (fuel)
Bio-methane (natural gas)
2nd gen. ethanol
Direct comb. (CHP)
Direct comb. (power)
Direct comb. (heat)
Gasifi-cation
Gasifi-cation (Pyro-lysis)
Cultivation experience 0 0 0 0 0 0 0 0 0 0
Harvest technology (maturity)
0 0 0 0 0 0 0 0 0 0
Conversion technology (maturity)
++ + + + + - 0 0 - -
GMO plant use 0 0 0 0 0 0 0 0 0 0Breeding potential 0 0 0 0 0 0 0 0 0 0
Storage facilities 0 0 0 0 0 0 0 0 0 0 Resource depletion: energy
- - - - - - - - - -
Climate change - - - - - - - - - -
Acidification - - - - - - - - - -
Terrestrial eutrophication
- - - - - - - - - - -
Aquatic eutrophication
- - - - - - 0 0 0 0
Photosmog - - - - + - - - - - -
Human toxicity - - - - - - - - - -
Ozone depletion ++ + + + + - 0 0 + +Net land use 0 0 0 0 0 0 0 0 0 0Water 0 0 0 0 0 0 0 0 0 0Soil - - - - - 0 0 0 0 0Fauna 0 0 0 0 0 0 0 0 0 0Flora 0 0 0 0 0 0 0 0 0 0Landscape 0 0 0 0 0 0 0 0 0 0 Total capital investment
N/D
NPV N/DPrice support N/DIRR N/D
CO2 avoidance
costsN/D
Energy resource savings costs N/D
Food security N/A N/A N/A N/A N/A N/A N/A N/A N/A N/A N/AIncome for farmers / local communities
0 - 0 0 0 0 - - 0 0
Access to land, land rights 0 0 0 0 0 0 + + 0 0
Access to jobs 0 0 0 0 0 0 - - 0 0
Acceptance by farmers ++ + + + + 0 0 0 0 0
Acceptance by general society 0 - + + + + 0 0 + +
Innovation 0 - + + + + - - + +Soc
iety
Benchmark: Direct combus-
tion (CHP)Basis: Direct
land use
Biomass sorghum scenarios
Tec
hnol
ogy
Env
ironm
ent
Eco
nom
y

62 SWEETFUEL: Report on integrated sustainability assessment
SSSSweetweetweetweet FFFFueluelueluelSSSSweetweetweetweet FFFFueluelueluel
5 Conclusions, recommendations and outlook
In this chapter, overall conclusions are drawn from all results on sustainability aspects of the SWEETFUEL project (subchapter 5.1). Recommendations for decision makers are given (subchapter 5.2). Finally, limitations and further need for research are discussed in an out-look in subchapter 5.3.
5.1 Conclusions
Two groups of scenarios were analysed in the SWEETFUEL project: scenarios on bioethanol production from sweet sorghum, which can be cultivated in many tropical, sub-tropical and semi-arid regions, and scenarios on biogas production from biomass sorghum, which is pri-marily suited for temperate climate. All scenarios share some implications on sustainability (subchapter 5.1.1) but differ in others. As sweet sorghum and biomass sorghum do not com-pete with each other, this assessment focuses on the decision-relevant comparison within these groups (subchapters 5.1.2 and 5.1.3).
5.1.1 General
• The whole life cycles of energy sorghum cultivation and use mostly lead to a combination of environmental advantages (non-renewable energy resources, climate change, pho-tosmog) and disadvantages (acidification, eutrophication, human toxicity through partic-ulate matter emissions, ozone depletion). Furthermore, local environmental impacts are mostly negative, too, when compared to idle land (see Table 4-4 and Table 4-5).
This is a typical pattern that is similarly observed for most energy crops. Effective bio-mass production, especially with annual or annually cultivated crops, can only be achieved with intensive agriculture including appropriate fertilisation, which is the major cause for the observed negative impacts. Any weighting of these advantages and disad-vantages necessarily involves subjective preferences. Thus, the precondition for any en-ergy sorghum use is that society accepts the environmental disadvantages in return for the advantages.
• Several scenarios that depict the use of mature technology turn out to be highly profita-ble (see Table 4-4 and Table 4-5) under the conditions set for the economic assessment (see subchapter 7.4 in the annex for an overview and /Basavaraj, Parthasarathy Rao et al. 2014/ for details).
• Social impacts vary but are mostly positive as long as conflicts about land rights and ac-cess to land can be solved (see Table 4-4 and Table 4-5).
• Despite these general patterns, quantitative results for environmental impacts and eco-nomic profitability can vary widely . Non-optimal scenarios can even deviate from the
5 Conclusions, recommendations and outlook 63
SSSSweetweetweetweet FFFFueluelueluelSSSSweetweetweetweet FFFFueluelueluel
general pattern and cause e.g. additional greenhouse gas emissions and high economic losses (see Table 7-2 in the annex and subchapter 4.1.1). The high importance of imple-mentation conditions emphasises the need for optimisation . The following examples for important optimisation potentials can be deduced from specific analyses of individual processes and life cycle steps primarily in LCA and economic assessment (see subchap-ter 4.1.1 for details):
- Yields can and should be increased by breeding highly productive sweet and biomass sorghum cultivars and by improving the agricultural management.
- The nitrogen and thus protein content should be reduced by breeding and manage-ment if biomass is used for energy or fuel production. In these cases, protein content is not a quality criterion but only causes high fertiliser demands and thus costs and environmental damages.
• Besides variability that depends on choices of the involved shareholders, all results for future scenarios are necessarily associated with uncertainty due to external factors , which can hardly be influenced or optimised. For example, obtainable product prices may deviate strongly from the prices set for the economic assessment scenarios (see appen-dix 9.5 in /Basavaraj, Parthasarathy Rao et al. 2014/) and replaced conventional energy sources may deviate strongly depending on developments in the energy sector (see sub-chapter 4.2.1.3 in /Reinhardt et al. 2014/). Robustness of results was verified by calculat-ing bandwidths of results under conditions that experts consider not typical but yet plau-sible (see Table 7-2 in the annex) and by sensitivity analyses e.g. on break-even prices (see subchapter 4.2) or on replaced conventional energy sources (see subchapter 4.1.1). These analyses show the range of conditions under which conclusions based on the pre-sented results are valid.
• The variability of results, which on many internal and external parameters, makes it nec-essary to analyse each specific concept of energy sorghum cultivation individually in an adapted assessment. The main focus of such an assessment on environmental, econom-ic and / or social aspects has to be adjusted depending on the concept.
• Land availability is a general limitation for cultivation of all energy crops and thus also for energy sorghum. Conflicts about land can be mitigated if land can be used that is not or not very well suited for established crops. This does not only refer to marginal land that would otherwise be entirely abandoned but also includes gradual advantages through specific plant properties. For energy sorghum in particular, these advantages are for ex-ample that most cultivars are resistant against infestation with the western corn rootworm (Diabrotica virgifera virgifera) and drought tolerant /Braconnier et al. 2013/, /Gloyna et al. 2011/, /Khawaja 2014/. Opportunities for cultivation in areas where e.g. maize cannot be cultivated every year to manage pests or where other crops produce low yields should thus be used. Further advantages for the energy sorghum variant sweet sorghum arise from its character as a multi-purpose plant as discussed below. In this regard, especially the option to directly replace grain sorghum by sweet sorghum (“grain to food” scenario) reduces the risk of land use conflicts significantly.
64 SWEETFUEL: Report on integrated sustainability assessment
SSSSweetweetweetweet FFFFueluelueluelSSSSweetweetweetweet FFFFueluelueluel
• In general, energy sorghum cultivation and partially also its use are innovative process-es. This involves little existing cultivation experience and medium to high potentials for further improvements of properties by breeding without the need to use genetically modi-fied crops (see Table 4-4, Table 4-5 and /Braconnier et al. 2013/). On the one hand, the innovative character creates opportunities, which is a central moti-vation for this project. On the other hand, innovation can always be an obstacle for im-plementation. Such obstacles require active management if energy sorghum should be implemented on a large scale.
5.1.2 Sweet sorghum
Three different approaches of sweet sorghum cultivation and use were assessed in several scenarios each: Cultivation on fallows between cycles of sugarcane with a focus on fuel pro-duction also from grains (“Cane fallow”), substitution of grain sorghum cultivation with co-production of food and fuel (“Grain to food”), and non-mechanised cultivation with a focus on keeping a big part of the fuel value chain in the villages through concentrating sugar juice to syrup (“Syrup production”). In all scenarios, the main product is ethanol.
• “Cane fallow” scenarios are generally advantageous regarding climate change mitiga-tion, energy resource savings and profitability under most assessed conditions (see Ta-ble 4-7 and Table 4-4). However, additional land is required because fallow periods be-tween sugarcane cultivation cycles are mostly already used for other purposes such as peanut cultivation. If this leads to additional use of idle land elsewhere, local environmen-tal impacts are negative but at least to some extent reversible. If instead land of higher ecological value (e.g. forests or grasslands) is converted into e.g. peanut cultivation area (scenario “land use change”), this has severe consequences on climate, soils, water, bio-diversity and landscape. Furthermore, social impacts are mixed because the “Cane fal-low” scenarios involves additional land use by industrial players, which may increase the risk of land right conflicts.
Thus, sweet sorghum cultivation between sugarcane cultivation cycles is an efficient way of biofuel production as long as there is sufficient idle land in the region to avoid land use changes with severe consequences.
An early implementation scenario (“Cane fallow 2015”), in which grains are not harvested but ploughed in due to a lack of harvesting technology, is less advantageous for the envi-ronment than the mature “Cane fallow” scenario but at least does not cause substantial further disadvantages. However, it is expected to be unprofitable under most conditions. Therefore, an early implementation of the scenario “Cane fallow” should be pursued on a smaller scale to gain cultivation experience even without using the grains while technolo-gy and concepts are being developed further.
• “Grain to food” scenarios contribute to climate change mitigation and energy resource savings while being profitable under most assessed conditions (see Table 4-4). Further-more, social impacts are mostly positive. As sweet sorghum produces almost as much grains as the replaced grain sorghum, only little extra land is needed to maintain grain production levels (net land use). That way, high benefits can be achieved per net land

5 Conclusions, recommendations and outlook 65
SSSSweetweetweetweet FFFFueluelueluelSSSSweetweetweetweet FFFFueluelueluel
occupancy (see Table 4-6). If surplus bagasse is used as feed and replaces feed produc-tion elsewhere (in this example wheat), then net area occupancy could even become negative. As the replacement of feed is indirect and subject to market dynamics, those numbers are very uncertain but the general conclusion is clear: Adopting integrated pro-duction using sweet sorghum, it is possible to produce the same amounts of food and feed, which are currently produced separately, on a smaller total area and to additional obtain fuel from the same land on top. A similar potential for net land use reductions has already been observed for few other biofuel production systems such as sugar beet eth-anol /Rettenmaier et al. 2008/. However, intensification of agriculture also has downsides, which are observed for most biofuels: Environmental impacts such as acidification and eutrophication increase e.g. through higher yields and thus increased fertiliser use. Over-all, replacement of grain sorghum is an option for sweet sorghum cultivation if (little) addi-tional land is available to maintain food production levels or can be made available e.g. through substitution of local feed cultivation by surplus bagasse (see Table 4-8).
• “Syrup production” differs from the other approaches as it does not generate any envi-ronmental advantages due to its low energy efficiency and lack of process integration (process steps occur in different places and thus waste heat cannot be used efficiently). Advantages can only be achieved if further renewable energy sources such as rice straw are used to produce energy for the ethanol plant. Furthermore, the assessed business model is not profitable (see Table 4-4). In contrast, “Syrup production” scenarios are preferable over the other approaches from a social point of view (see Table 4-9).
Although the grassroots approach of these scenarios seems appealing and it yields benefits to the local population, it is very hard to make this approach environmentally and economically sustainable. And after all, long term social advantages depend on environ-mental and economic sustainability. If there is unused biomass such as rice straw (con-tinuously) available as an energy source, this sweet sorghum scenario might still be fea-sible. However, alternative agriculture-based rural development concepts should be ex-amined before this approach is implemented.
• In the “Cane fallow” and “Grain to food” scenarios, the co-product surplus bagasse (left after the energy demand of ethanol production is satisfied by bagasse combustion) can either be used for further energy generation or as feed . Both options result in rather similar environmental impacts and revenues per directly used agricultural area consider-ing regional variability and uncertainty (see Table 4-7 and Table 4-8). Advantages for the one or the other option depend on competing options of power and feed production in any particular region and their respective prices and environmental impacts. However, there is a striking difference in net area occupancy as discussed above. Even if bioener-gy production should be a preference of society, the use of surplus bagasse as feed could still be the better option if the land becoming available through replacing separate feed production is used for bioenergy provision. Thus, surplus bagasse should be used as feed unless regional market conditions are strongly in favour of bioenergy production.
Similar advantages and disadvantages can be found for the use of grains for food or fuels . Yet, implementation of the respective scenarios “Grain to food” and “Cane fallow” is primarily dependent ethical and cultural criteria because of priority for sufficient food

66 SWEETFUEL: Report on integrated sustainability assessment
SSSSweetweetweetweet FFFFueluelueluelSSSSweetweetweetweet FFFFueluelueluel
production and market conditions. Nevertheless, also in this respect there are indirect linkages of energy / fuel and feed / food markets through multi-purpose crops. This con-nection and its region-specific effects on sustainability require additional research.
• The use of leaves for energy production is highly advantageous in terms of environmen-tal impacts as long as enough organic matter remains on the land to preserve soil quality. It might however be associated with technical and logistical challenges (see Table 4-7). The use of leaves as feed e.g. for goats may be an option in a rural setting but environ-mental benefits are expected to be rather marginal and may vary considerably depending on the replaced source of feed (see Table 4-7). The economic value of leaves is general-ly low no matter if they are used as fertiliser or feed. Therefore, leaves should be com-busted for energy production if logistically feasible and permitted by soil quality.
• CO2 avoidance costs and energy resource savings costs turned out to be less deci-sive indicators because many scenarios are profitable and thus costs are negative (see Table 4-4). In that case, this indicator reflects additional profits for the involved compa-nies instead of costs to be paid for by the general society. For companies, other indica-tors such as the internal rate of return are more important than CO2 avoidance costs, which are more relevant for political decisions. The important conclusion for politics is that greenhouse gas emission savings and energy resource savings can be achieved without public costs other than e.g. support for research and dissemination.
• The different scenarios reveal a contrast between a smallholder-oriented but inefficient approach (“Syrup production”) with high (short term) social advantages and an industrial-ised and efficient one (“Cane fallow”) with low social advantages as two extremes of a continuous spectrum. As the ethical assessment shows (see subchapter 4.3.1 for de-tails), it depends on context and structures in the society concerned if an efficient indus-trialised approach is likely to cause ethical conflicts . If this is prone to be the case as e.g. in India, then a compromise has to be found that is efficient enough to reach a sus-tainable outcome on all dimensions. This is important because long term advantages in the social domain depend on environmental and economic sustainability instead of wast-ing resources.
5.1.3 Biomass sorghum
Biomass sorghum cultivated in temperate climates is expected to be predominantly used as energy crop for biogas production. In contrast to sweet sorghum, biomass sorghum is a sin-gle-purpose plant, which is harvested as whole plant. Additionally, direct combustion and several scenarios on 2nd generation fuel production are analysed as alternative biomass use options (for all investigated options see Table 3-2).
• All assessed biogas and biomethane scenarios show very similar qualitative impact patterns (see Table 4-5): They are profitable under all assessed conditions, generally cause environmental benefits regarding climate change, energy resource savings and photosmog but cause additional environmental burdens in all other impact categories. Social impacts are mostly positive although land availability may be an issue. In terms of technology, cultivation experience is still lacking but otherwise all processes are estab-
5 Conclusions, recommendations and outlook 67
SSSSweetweetweetweet FFFFueluelueluelSSSSweetweetweetweet FFFFueluelueluel
lished. However, quantitative differences mainly in respect to environmental impacts can be large and under some boundary conditions, even additional greenhouse gas emis-sions can occur. Thus, biomass sorghum for biogas production is an innovative crop, which can be fed into established value chains. Its benefits and problems throughout the whole life cycle are qualitatively similar to those of existing biogas production from culti-vated crops such as maize. Yet, concrete implementation and agricultural practise can make a big difference especially with respect to environmental impacts.
• It depends on market conditions whether the energy consuming upgrading of biogas to biomethane pays off both economically and environmentally. Biomethane is fed into the natural gas grid and can thus be used flexibly and rather efficiently. However, if biogas is used in combined heat and power production (CHP) and there is a local demand for the produced heat (see Table 4-5 and Table 7-2 high case), then biogas use is as efficient as biomethane use and upgrading of biogas to biomethane would only cause additional en-ergy consumption, costs and emissions. Thus, upgrading for use in a CHP close to heat customers is advantageous in many rural settings without existing heat demand (see Ta-ble 4-10). Heat use options therefore have to be analysed carefully before installing new biogas plants. If there is heat demand, a direct use of biogas instead of upgrading to bi-omethane should be preferred at least for environmental and economic reasons although the public may be in favour of the contrary.
Another important market influence to consider is whether biomethane replaces power and heat from mixed sources as discussed above including environmentally harmful coal or if fossil natural gas is replaced directly (see Table 4-10). Additionally, a replacement of petroleum-based fuels could take place if biomethane-powered cars replace conventional cars. Results show that environmental impacts improve the more of harmful coal rather than relatively clean natural gas is replaced. Petroleum ranges between these two ex-tremes. As national and European energy markets are concerned, biomethane use op-tions and thus its environmental impacts are influenced by strategic political decisions. Thus, these environmental implications should be taken into account in political decision processes.
• Further specific optimisation options of biogas production have been identified in the environmental assessment (see subchapter 4.1). For example, it is crucial to cover the storage area for the digestate gas-tight because of emissions of the greenhouse gas me-thane. Up to now, this is mandatory in big biomethane plants in Europe but still optional for small biogas units. Furthermore, digestate should be incorporated into the soil straight after spreading it as fertiliser on fields because this avoids ammonia emissions, which are relevant for several environmental impacts. If these steps are not optimised, this can lead to additional greenhouse gas emissions compared to energy provision from fossil re-sources. Individual farmers and owners of biogas plants and their practise therefore de-termine if and to which extent the overall aim of climate change mitigation is reached.
• Alternative use options of biomass sorghum are direct combustion for energy genera-tion or 2nd generation fuel production (bioethanol or synthetic Fischer-Tropsch diesel). All these technologies are less mature than biogas / biomethane production. Direct combus-tion is possible with limited modifications to well established technology while there is on-

68 SWEETFUEL: Report on integrated sustainability assessment
SSSSweetweetweetweet FFFFueluelueluelSSSSweetweetweetweet FFFFueluelueluel
ly one industrial scale 2nd generation ethanol plant so far and Fischer-Tropsch diesel pro-cesses have only been demonstrated on smaller scales. For this reason, the implementa-tion of these alternatives contributes to innovation but is met by farmers with scepticism.
- Direct combustion in a CHP plant achieves the best environmental performance of all biomass sorghum use options (see Table 4-11). The main reason is that the con-version steps to biogas or biomethane, which necessarily cause losses, are omitted. Furthermore, soil erosion may be reduced because biomass sorghum is harvested later after it has partially dried on the field. Harvest in a comparatively dry state also reduces or spares technical drying. Still, it was observed in the SWOT assessment that its image in the general society is not as good as for other biomass use options. A screening economic analysis of this scenario yields the result that there should be conditions under which direct combustion is profitable. If biomass is combusted in a power plant or heat plant instead of a CHP, environmental benefits are lower but still in the range of those achievable with biogas production and use. Future biomass sor-ghum cultivation should therefore aim at direct combustion instead of biogas / bio-methane from an environmental point of view. Public awareness of this fact should be raised and implementation programs should be initiated.
- In the near future, 2nd generation fuels from biomass sorghum cannot compete with biogas / biomethane production and use or direct combustion in respect to achievable climate change mitigation, energy resource savings and profits (see Table 4-10). Regarding other environmental impacts such as acidification and eutrophica-tion, there are advantages compared to biogas production but not compared to direct combustion (see Table 4-11). This is due to the energy, material and capital intensive conversion processes. Economically, especially the required enzymes cause a large share of the variable costs for 2nd generation ethanol but these costs have the poten-tial to decline significantly in the future. Thus, competitiveness may be reached in the medium term. On the long run, this conversion may pay off from an environmental point of view as power production from fossil resources can potentially be largely re-placed by renewable power but there is no such option in sight for fuels. Instead, the increasing use of unconventional fossil petroleum will increase the environmental footprint of fossil fuels.
In summary, both sweet sorghum and biomass sorghum can be cultivated and used accord-ing to concepts that lead to many environmental, economic and social advantages if suffi-cient land is available. Necessary optimisations to reach these positive outcomes are high-lighted in this report. However, environmental disadvantages such as increased nutrient in-puts into ecosystems, which are typical for biofuels from cultivated biomass anyway, come also along with energy sorghum. In contrast to many other biofuels including most 2nd gener-ation ethanol from residues, ethanol production from the multi-purpose crop sweet sorghum can under some conditions result in a net release of area, e.g. if all co-products are used to substitute existing food or feed production. For all these reasons, energy sorghum is a prom-ising new alternative among biofuel and bioenergy crops. Yet, not all energy sorghum path-ways are sustainable per se and thus implementation programs – at least when publicly funded – have to be accompanied by specific sustainability analyses.

5 Conclusions, recommendations and outlook 69
SSSSweetweetweetweet FFFFueluelueluelSSSSweetweetweetweet FFFFueluelueluel
5.2 Recommendations
Based on the results of the environmental and economic assessments, the SWOT analysis and the ethical assessment, as well as the conclusions discussed above, a number of rec-ommendations for individual stakeholders, especially decision makers in science, industry and politics, can be derived. Those recommendations, which are specific to either biomass or sweet sorghum, are discussed first in subchapters 5.2.1 and 5.2.2. Recommendations for both energy sorghum variants then follow in subchapter 5.2.3.
5.2.1 Specific recommendations for sweet sorghum
The following specific recommendations refer to various areas of the entire life cycle:
• Because especially large sustainability benefits are associated with the use of the co-products, care should be taken that as much of the plant as possible is machine-harvestable. Technical advances in harvesters should therefore be supported, with a fo-cus on harvesting both co-products, grains and leaves.
• Where grain of sweet sorghum is not demanded for food purpose, distilleries crushing sugarcane for ethanol should utilise both stalk and grain of sweet sorghum by increas-ing the crushing window during the lean periods. Use of both stalk and grain for ethanol is more profitable than stalk alone. Concepts and programs for the use of both grain and stalk should be implemented.
• When planning a new ethanol plant, a concept for full utilisation of the leaves and the surplus bagasse should be compiled as any use of these co-products improves both profitability and environmental impacts. Even if ethanol plants should be profitable without using the co-products, investors should opt for their use as higher environmental benefits is this case come along with increased profitability. To increase incentives, ethanol plants with an integrated use of by-products should e.g. be given priority consideration in au-thorisation practice. Whether surplus bagasse should be used for energy generation or as feed should be decided based on regional markets and / or conditions. Priority should however be given to the use as feed if regional availability of land for feed production is an issue.
• The cultivation of sweet sorghum on land with natural vegetation often influences the carbon stock and biodiversity of the land negatively and should therefore be avoided. Ini-tiatives and programmes supporting the establishment of sweet sorghum as an energy crop should therefore promote integration in existing cultivation systems, or cul tiva-tion on low-carbon soils, or soils of relatively li ttle ecological value , and to this end raise incentives and query farmers and investors about convincing concepts. This also applies to the case of sweet sorghum cultivation in sugarcane cycles or, even more so, instead of grain sorghum, because indirect land use changes are actually occurring in practise, whose negative impacts must be minimised.

70 SWEETFUEL: Report on integrated sustainability assessment
SSSSweetweetweetweet FFFFueluelueluelSSSSweetweetweetweet FFFFueluelueluel
• Syrup processing : Converting juice to syrup at village level is neither economical nor environmentally beneficial unless significant improvements compared to the assessed scenarios are realised. If decentralised syrup production from sweet sorghum still should be followed further, particular attention should be paid to the concept for provision of the energy source for centralised processing of the syrup to ethanol. Only those concepts should be promoted or approved that can demonstrate a positive energy and greenhouse gas balance.
• In order to ensure that the leaf harvest is sustainable, i.e. the organic soil substance is not negatively impacted, an appropriate research project should be established with the aim of identifying how the maximum sustainable leaf harvest can be determined across a variety of sites. In addition, a process for implementing the results in the field must be de-veloped.
5.2.2 Specific recommendations for biomass sorghum
Specific recommendations for the cultivation and use of biomass sorghum apply predomi-nantly to the following two areas:
Biogas production
• Combined production and utilisation of power and heat should be preferred over power production only. Instead, biogas plants are often built in areas where there are no note-worthy heat consumers. This is neither sustainable from an environmental nor from an economical perspective. Thus, a heat utilisation concept should be taken into account at the planning stage. To increase incentives, biogas plants with a conclusive heat use con-cept should be given priority consideration in authorisation practice.
• In terms of the production of biogas from biomass sorghum, a legal obligation should be introduced to cover the digestate store gas-tight.
• Emissions from the application of digestate to the field should be minimised. To this end, the digestate should be worked into the soil in the shortest possible time (e.g. one hour) after application. Legal regulations and monitoring of this practise should be intro-duced where not yet in place. Furthermore, a research project should be established with the aim of identifying whether and under which conditions it is beneficial to add nitrifica-tion inhibitors to the digestate in order to reduce emissions following application of the di-gestate.
Alternative use options
• Direct combustion of biomass sorghum for combined heat and power production is the environmentally most beneficial use option and is profitable. As this scenario was not in the primary focus of this study, further research should be supported on implementation barriers, issues of nutrient recycling from ashes and long term perspectives in a changing energy system.
5 Conclusions, recommendations and outlook 71
SSSSweetweetweetweet FFFFueluelueluelSSSSweetweetweetweet FFFFueluelueluel
• Production of 2nd generation ethanol is promising to become economically viable in the medium term and more environmentally advantageous than competing direct combustion in the long term. Thus, maturation and optimisation of the technology should be further supported in individual industrial scale plants. Given the currently achievable environ-mental and social benefits as well as the associated avoidance costs, it does not seem justified for society to finance a large scale implementation of this technology e.g. via di-rect subsidies or mandatory blending quota – at least not if mainly annually cultivated bi-omass is used.
• As 2nd generation ethanol and synthetic FT fuels are rather medium to long term op-tions, biomass sorghum should not be developed with high priority as feedstock for such fuels but may find an additional market in this use option later.
5.2.3 General recommendations for energy sorghum
The general recommendations for both investigated energy sorghum variants biomass and sweet sorghum are relevant to a variety of areas of the entire life cycle and affect both envi-ronment and economics positively:
• Support for breeding programmes for general yield optimisation differentiated into geo-graphical, climatic and soil conditions, in order to reap the full benefits of the sorghum variants;
• Promotion of techniques for optimising cultivation methods (e.g. improved fertiliser and pesticide application) for yield stability or the optimised use of resources ;
• Reduction in applied mineral fertiliser :
- Continuation of appropriate breeding programmes for reducing the nutrient content in the harvested biomass that is intended for energy use.
- Establishing research projects for optimising suitable cultivation methods (e.g. opti-mising the time of harvesting) for reducing the nutrient content in the harvested bio-mass that is intended for energy use.
- Integration of sweet sorghum and biomass sorghum cultivation respectively in exist-ing, established crop rotation systems should be aimed for, because sorghum is ca-pable of utilising nutrients from deeper layers, which remained unused in the previous cultivation systems. Appropriate research projects should be established, in particular with the aim of identifying promising multi-crop rotations.
Furthermore, limited land availability causes competition between various land use options, which also affects energy sorghum cultivation. This competition about land needs to be politically managed to avoid a high risk of environmental, social and on the long run also economically unsustainable developments:
• In the mid- to long-term, biomass and land use allocation plans should be developed at national and pan-national level. Due to the fact that environmental implications including resource scarcity in particular do not possess an adequate price, market mechanisms cannot replace these plans.
72 SWEETFUEL: Report on integrated sustainability assessment
SSSSweetweetweetweet FFFFueluelueluelSSSSweetweetweetweet FFFFueluelueluel
• Based on these national plans, regional plans which include regulations for project plan-ning should be developed. In this context, the cultivation of crops adapted to local condi-tions should be supported. For instance, the environmental impacts of the cultivation of a crop with a high water demand depend on water availability at the specific location. Fur-thermore, regional planning is vital due to the fact that also public funds to date have cre-ated market actors with considerable local demand for biomass and significant market power. Further ethanol producing facilities could potentially exacerbate the process. This can create distortion of competition and thus create displacement effects that can be en-vironmentally and socially unsustainable. In some regions, especially land rights of smallholders need to be protected. With appropriate planning, unfavourable develop-ments can be, and must be, avoided.
• As long as no appropriate planning is in place, preventive measures should include bind-ing land use and cultivation-related sustainability criteria for uniform application across all purposes, i.e. for bio-based materials, chemicals, fuel and energy carriers as well as feed / food production.
• The political decision process in each concerned region should take into account how far unavoidable environmental disadvantages mainly caused by intensive agriculture are acceptable in return for the advantages. This understanding is needed as a basis for the development of above mentioned land use allocation plans.
Further aspects
• Knowledge transfer in terms of experience in cultivating energy sorghum should be supported.
• Quality control : All appropriate support programmes or implementation concepts and programmes should be accompanied scientifically in order to identify the impacts on sus-tainability and to facilitate optimisation in the course of the running project.
• An early involvement of stakeholders should be ensured in planning processes espe-cially for bigger industrial projects that will affect agriculture in the region. This helps avoiding conflicts and increases the public acceptance.
5.3 Outlook
This study comprehensively assesses the cultivation and use of sweet sorghum and biomass sorghum in various climatic zones compared to conventional provision of various alternative products. It is based on established methodologies such as life cycle assessment (LCA) or cost benefit analysis in combination with new methodologies such as life cycle environmental impact assessment (LC-EIA) and integrated sustainability assessment. The derived conclu-sions and recommendations show that this combination of methodologies is a practicable approach to assess the sustainability of potential future implementations of new technolo-gies.

5 Conclusions, recommendations and outlook 73
SSSSweetweetweetweet FFFFueluelueluelSSSSweetweetweetweet FFFFueluelueluel
However, there are several possibilities how the implementation of the assessed systems can indirectly affect sustainability of further systems, which could only be addressed concise-ly and qualitatively. Especially the following aspects require further research in the future beyond the specific impacts of energy sorghum analysed here:
In most scenarios, the basket of products produced from energy sorghum, requires more agricultural land for its provision than the provision of alternative conventional (reference) products, because conventional energy and fuels are provided from fossil resources. This net land occupation has several implications beyond the life cycles of energy sorghum and its reference products. Depending on land availability, this concerns detrimental effects of ex-tending agricultural land at the expense of natural ecosystems or alternative land use options that are could be implemented instead. These topics are very important for the sustainability of any non-food crop. However, further research is required to be able to quantify all of these effects:
• Global and regional land availability is dependent on many factors including de-mographics, affluence (with important effects on meat consumption) and global non-food land use in the sectors of bioenergy, biofuels, bio-based materials and nature conserva-tion. Prognoses and scenarios vary considerably from study to study (see e.g. /Kretschmer et al. 2013b/, /Bringezu et al. 2012/, /Leopoldina 2012/).
• Direct or indirect land use changes and thus potentially severe consequences may result from using more land for sorghum cultivation than available regionally and globally. These effects are hard to quantify and allocate to specific causes due to complex market interactions already in retrospective but even more so for the future. For further reading, please refer e.g. to /Fehrenbach et al. 2009/, /EC 2010a/, /NL Agency 2010/, /Edwards et al. 2010/.
• If land for non-food use is available, there may still be more advantageous use options of the limited resource agricultural land than energy sorghum cultivation. These land use options range from established first generation biofuels from oil seed crops via second generation fuels to innovative biorefinery concepts producing several products including e.g. novel bio-based polymers from short rotation coppice. Currently, there is a dynamic development with many new approaches in all involved sectors, which are envisioned to be ready for the market within the next ten years. Such alternatives have been compared for example in /Rettenmaier et al. 2014/.
Results of this further research will be needed by decision makers to manage conflicts about agricultural land among competing non-food use options in the medium to long term. For such conflict management, land use allocation plans and biomass allocation plans are prom-ising instruments. The integration of energy sorghum cultivation into such plans furthermore requires a full sustainability assessment for any concretely planned and publicly supported large scale energy sorghum cultivation project additional to the more general level research suggested above.
74 SWEETFUEL: Report on integrated sustainability assessment
SSSSweetweetweetweet FFFFueluelueluelSSSSweetweetweetweet FFFFueluelueluel
6 References
/APEC 2010/ Asia-Pacific Economic Cooperation: Biofuel Costs, Technologies and Econom-ics in APEC Economies. APEC Energy Working Group Report, Singapore, 2010
/Basavaraj et al. 2012a/ Basavaraj, G., Parthasarathy Rao, P., Ravinder Reddy, C., Ashok Kumar, A., Datta Mazumdar, S., Ramana Reddy, Y., Srinivasa Rao, P., Karuppan Chetty, S.M., Reddy, B.V.S.: SWEET SORGHUM: A smart crop to meet the demands for food, fodder, fuel and feed. Innovative Institutions, Public Policies and Private Strat-egies Triennial IAAE Conference, Iguacu Falls, Brazil 2012.
/Basavaraj et al. 2012b/ Basavaraj, G., Parthasarathy Rao, P., Ravinder Reddy, C., Ashok Kumar, A., Srinivasa Rao, P., Reddy, B.V.S.: A review of national biofuel policy in In-dia: A critique- Need for promotion of alternate feedstocks. In: Journal of Biofuels, Vol-ume 3, Issue 2, July-December 2012, pp. 65-78.
/Basavaraj et al. 2013a/ Basavaraj, G., Parthasarathy Rao, P., Basu, K., Ravinder Reddy, C., Ashok Kumar, A., Srinivasa Rao, P., Reddy, B.V.S.: Assessing viability of bio-ethanol production from sweet sorghum in India. In: Energy Policy 56, 2013, pp. 501-508.
/Basavaraj et al. 2013b/ Basavaraj, G., Parthasarathy Rao, P., Achoth, L., Ravinder Reddy, C.: Assessing competitiveness of sweet sorghum for ethanol production: A policy anal-ysis matrix approach. In: Agricultural Economics Research Review, Volume 26, Num-ber 1, January-June 2013, pp. 31-40.
/Basavaraj et al. 2013c/ Basavaraj, G., Parthasarathy Rao, P., Reddy, B.V.S., Ashok Kumar, A., Bantilan, M.C.S., Ravinder Reddy, C., Srinivasa Rao, P.: Policy options for promo-tion of alternate feedstocks for ethanol production in India: Sweet sorghum for ethanol production. Policy Brief No. 24, RP Markets, institutions and Policy (MIP), ICRISAT, Patancheru-502324, Andhra Pradesh, 2013.
/Basavaraj, Parthasarathy Rao et al. 2014/ Basavaraj, G., Parthasarathy Rao, P., Ravinder Reddy, C., Ashok Kumar, A., Srinivasa Rao, P., Reddy, B.V.S.: SWEETFUEL, Grant Agreement n° 227422, Deliverable 6.4: Report on economic assessment, Hyderabad, 2014.
/Borken et al. 1999/ Borken, J., Patyk, A., Reinhardt, G. A.: Basisdaten für ökologische Bi-lanzierungen (Basic data for ecological balances). Verlag Vieweg, Braunschweig / Wiesbaden, 1999.
/Braconnier et al. 2013/ Braconnier, S., Reinhardt, G. and 30 co-authors: SWEETFUEL, Grant Agreement n° 227422, Deliverable 6.2: Report on technological assessment, Montpellier, 2013.
/Bringezu et al. 2012/ Bringezu, S., O’Brien, M., Schütz, H.: Beyond biofuels: Assessing global land use for domestic consumption of biomass. A conceptual and empirical con-tribution to sustainable management of global resources. Land Use Policy 29, pp. 224–232, Amsterdam, 2012.
/Bursztyn 2014/ Bursztyn, M.: SWEETFUEL, Grant Agreement n° 227422: Ethical appraisal of the SWEETFUEL project, Brasilia, 2014.
/CML 2004/ Institute of Environmental Sciences (CML): CML's impact assessment methods and characterisation factors. Department of Industrial Ecology, Leiden, 2004.
6 References 75
SSSSweetweetweetweet FFFFueluelueluelSSSSweetweetweetweet FFFFueluelueluel
/EC 2010a/ European Commission: Report from the Commission on indirect land-use change related to biofuels and bioliquids. Brussels, 2010.
/EC 2010b/ Decision of the European commission of 10 June 2010 on guidelines for the calculation of land carbon stocks for the purpose of Annex V to Directive 2009/28/EC (notified under document C(2010) 375, 2010/335/EU).
/Edwards et al. 2010/ Edwards, R., Mulligan, D., Marelli, L.: Indirect land use change from increased biofuels demand. Comparison of models and results for marginal biofuels production from different feedstocks. JRC Scientific and Technical Reports 59771, 2010.
/Fankhauser 1995/ Fankhauser, S.: Valuing climate change: The economics of the green-house. London, 1995.
/Fehrenbach et al. 2009/ Fehrenbach, H., Giegrich, J., Reinhardt, G., Rettenmaier, N.: Sy-nopse aktueller Modelle und Methoden zu indirekten Landnutzungsänderungen ILUC. (Synopsis of current models and methods regarding indirect land use changes ILUC.) Heidelberg, 2009.
/Fritsche et al. 2004/ Fritsche, U. and 25 co-authors: Stoffstromanalyse zur nachhaltigen energetischen Nutzung von Biomasse (Material flow analysis of sustainable biomass use for energy). Öko-Institut (coordinator), Fraunhofer UMSICHT, Institut für Energie- und Umweltforschung, IFEU, Institut für ZukunftsEnergieSysteme, TU Braunschweig & TU München. Supported by the Federal Ministry for the Environment, Nature Conser-vation and Nuclear Safety in the framework of the ZIP programme, Berlin, 2004.
/Gärtner 2008/ Gärtner, S. O. (ed.): Final report on technical data, costs and life cycle inven-tories of biomass CHP plants. Prepared for the NEEDS project (“New Energy Ex-ternalities Developments for Sustainability”), supported by EC’s FP 6 programme. IFEU, Heidelberg, 2008.
/Gloyna et al. 2011/ Gloyna, K., Thieme, T., Zellner, M.: Sorghum, Miscanthus & Co.: Ener-gy crops as potential host plants of western corn rootworm larvae. In: Proceedings of the 24th IWGO Conference & 3rd International Conference of Diabrotica Genetics. Freiburg, 24. - 26 Oktober 2011. Available at http://pub.jki.bund.de/index.php/JKA/article/ viewFile/2989/3196
/IFEU 2014/ Continuously updated internal IFEU Database. Heidelberg, 2014.
/IPCC 1996/ Intergovernmental Panel on Climate Change: Economic and social dimensions of climate change. Cambridge, New York, Melbourne, 1996.
/IPCC 2006/ Intergovernmental Panel on Climate Change: 2006 IPCC guidelines for na-tional greenhouse gas inventories. Institute for Global Environmental Strategies (IGES), Hayama, 2006.
/IPCC 2007/ Intergovernmental Panel on Climate Change: Climate Change 2007: The phys-ical science basis. Contribution of working group I to the Fourth Assessment Report of the Intergovernmental Panel on Climate Change. Cambridge University Press, Cam-bridge, 2007, pp 129-134.
/JRC-IES 2010/ Joint Research Centre (of the European Commission) – Institute for Envi-ronment and Sustainability: International reference life cycle data system (ILCD) hand-book. JRC-IES, Ispra, 2010.
/Keller et al. 2014/ Keller, H., Reinhardt, G., Rettenmaier, N.: Integrated life cycle sustaina-bility assessment – a practical approach applied to biorefineries. In: Applied Energy (under review).

76 SWEETFUEL: Report on integrated sustainability assessment
SSSSweetweetweetweet FFFFueluelueluelSSSSweetweetweetweet FFFFueluelueluel
/Khawaja et al. 2014/ Khawaja, C. and 24 co-authors: SWEETFUEL, Grant Agreement n° 227422: Energy sorghum handbook. An alternative energy crop. ISBN: 978-3-936338-31-7. Munich, 2014.
/Klöpffer & Renner 1995/ Klöpffer, W., Renner, I: Methodik der Wirkungsbilanz im Rahmen von Produkt-Ökobilanzen unter Berücksichtigung nicht oder nur schwer quantifizierba-rer Umwelt-Kategorien. In: Umweltbundesamt (1995): Methodik der produktbezogenen Ökobilanzen – Wirkungsbilanz und Bewertung. UBA Texte 23/95, Federal Environment Agency, Berlin, 1995.
/Kretschmer et al. 2012/ Kretschmer, W., Bischoff, S., Hanebeck, G., Himmler, H., Müller-Falkenhahn, H., Reinhardt G., Scheurlen, K., Schröter, C., Weibel, U.: Environmental impact assessment of biomass production and use for biorefineries: methodological approach and case studies. Proceedings of the “20th European Biomass Conference and Exhibition” EU BC&E 2012, Milan, 18 - 22 June 2012.
/Kretschmer et al. 2013a/ Kretschmer, W. and 23 co-authors: Integrated sustainability as-sessment of BIOLYFE second generation bioethanol, Deliverable 12.3: Final report. Supported by the European Commission’s Seventh Framework Programme (FP7) un-der grant agreement no. 239204. Heidelberg, 2013.
/Kretschmer et al. 2013b/ Kretschmer, W., Schröter, C., Scheurlen, K., Himmler, H., Pihkola, H., Niemelä, K., Müller-Lindenlauf, M.: BIOCORE WP7: Results on SWOT analysis and biomass competition. Heidelberg, 2013.
/Larson 2005/ Larson, E.: A review of LCA studies on liquid biofuels for the transport sector. Scientific and Technical Advisory Panel of the Global Environment Facility (STAP) workshop on Liquid Biofuels, New Delhi, India, 29 August - 1 September 2005.
/Leeuw 2002/ Leeuw, F. D.: A set of emission indicators for long-range transboundary air pollution, Bilthoven, 2002.
/Leopoldina 2012/ Nationale Akademie der Wissenschaften Leopoldina: Bioenergy – chan-ces and limits. Halle (Saale), 2012.
/Müller-Lindenlauf et al. 2014/ Müller-Lindenlauf, M., Gärtner, S., Reinhardt, G.: Nährstoffbi-lanzen und Nährstoffemissionsfaktoren für Ökobilanzen landwirtschaftlicher Produkte. IFEU, Heidelberg, 2014.
/Nitsch et al. 2004/ Nitsch, J. and 12 co-authors: Ökologisch optimierter Ausbau der Nutzung erneuerbarer Energien in Deutschland (Ecologically optimised extension of renewable energy utilisation in Germany). German Aerospace Center (coordinator), IFEU, IUS Weisser & Ness GmbH, Wuppertal Institute. Commissioned by the Federal Minis-try for the Environment, Nature Conservation and Nuclear Safety, Berlin, 2004.
/NL Agency 2010/ NL Agency: Sustainable biomass – Review indirect effects. Macro moni-toring and land use planning. Utrecht, 2010.
/Nordhaus 1994/ Nordhaus, W.: Managing the global commons. The economics of climate change. Cambridge (Mass.), 1994.
/Pehnt et al. 2010/ Pehnt, M., Paar, A., Bauer, M.: CO2-Vermeidungskosten. Entwicklung eines Rechners zum Vergleich verschiedener Energieversorgungsanlagen. Final re-port. Heidelberg, 2010.
/Ravishankara et al. 2009/ Ravishankara, A. R., Daniel, J. S., Portmann, R. W.: Nitrous ox-ide (N2O): The dominant ozone-depleting substance emitted in the 21st century. Sci-ence 326 (5949), pp 123-125.
6 References 77
SSSSweetweetweetweet FFFFueluelueluelSSSSweetweetweetweet FFFFueluelueluel
/Reinhardt et al. 2012/ Reinhardt, G. and 14 co-authors: Sustainable and integrated produc-tion of liquid biofuels, green chemicals and bioenergy from glycerol in biorefineries: De-liverable 7.8 Integrated assessment: Final report of the EC funded GLYFINERY project GA no 213506, Heidelberg, 2012.
/Reinhardt 2013/ Reinhardt, G.: Environmental assessment of first and second generation ethanol: an overview. “20th International Symposium on Alcohol Fuels (ISAF)”, Stellen-bosch, South Africa, 25 - 27 March 2013.
/Reinhardt et al. 2014/ Reinhardt, G., Cornelius, C., Detzel, A., Keller, H., Köppen, S., Ret-tenmaier, N.: SWEETFUEL, Grant Agreement n° 227422, Deliverable 6.3: Report on environmental assessment, Heidelberg, 2014.
/Rettenmaier et al. 2008/ Rettenmaier, N., Reinhardt, G., Gärtner, S., Münch, J.: Bioenergie aus Getreide und Zuckerrübe: Energie- und Treibhausgasbilanzen (Bioenergy from ce-reals and sugar beet: Energy and greenhouse gas balances). Verband Landwirtschaft-liche Biokraftstoffe e. V. (LAB), Berlin, 2008.
/Rettenmaier et al. 2013/ Rettenmaier, N. and 14 co-authors: Environmental sustainability assessment of the BIOCORE biorefinery concept, Report prepared for the BIOCORE project www.biocore-europe.org, Heidelberg, 2013.
/Rettenmaier et al. 2014/ Rettenmaier, N., Harter, R., Himmler, H., Keller, H., Kretschmer, W., Müller-Lindenlauf, M., Reinhardt, G., Scheurlen, K., Schröter, C.: Integrated sus-tainability assessment of the BIOCORE biorefinery concept, Report prepared for the BIOCORE project www.biocore-europe.org, Heidelberg, 2014.
/Rutz et al. 2011/ Rutz, D., Janssen, R., Van Eijck, J., Faaij, A., Vis, M., Van Sleen, P., Ab-ban-Mensah, I., Bottriell, K., Gerber, P., Hilbert, J.A., Wright, A., Ouattara, O., Burrell T., Sawe E.N., Cárdenas A., Fallot A.: Sustainability of biofuels and bioproducts: Socio-economic impact assessment. In: Proceedings of the 19th European Biomass Confer-ence and Exhibition 2011, pp. 2355-2364, ISBN 978-88-89407-55-7, DOI 10.5071/19thEUBCE2011-OC3.2.
/Rutz & Janssen 2012a/ Rutz, D., Janssen, R.: SWEETFUEL, Grant Agreement n° 227422, Deliverable 6.5: Sweet sorghum as energy crop: A SWOT analysis, Munich, Germany, 2013.
/Rutz & Janssen 2012b/ Rutz D., Janssen R.: Socio-economic impacts of different scales of biofuel production in Africa. In: Janssen R., Rutz D. (eds.): Bioenergy for sustainable development in Africa. Springer Science + Business Media B.V., Dordrecht, Heidel-berg, London, New York, 2012, ISBN 978-94-007-2180-7, DOI 10.1007/978-94-007-2181-4_25.
/Rutz & Janssen 2012c/ Rutz D., Janssen R.: Opportunities and risks of bioenergy in Africa. In: Janssen R., Rutz D. (eds.): Bioenergy for sustainable development in Africa. Springer Science + Business Media B.V., Dordrecht, Heidelberg, London, New York, 2012, ISBN 978-94-007-2180-7, DOI 10.1007/978-94-007-2181-4_31.
/Rutz & Janssen 2014/ Rutz, D., Janssen, R.: Socio-economic impacts of bioenergy produc-tion, Springer International Publishing Switzerland 2014, ISBN 978-3-319-03829-2.

78 SWEETFUEL: Report on integrated sustainability assessment
SSSSweetweetweetweet FFFFueluelueluelSSSSweetweetweetweet FFFFueluelueluel
7 Annex
The annex contains various supplementary material including input data, further results and further descriptions of the methodology.
7.1 Scenario data
This subchapter contains an overview of important agricultural and conversion data for the environmental assessment (Table 7-1). The cultivation of biomass and sweet sorghum is assessed in the way that full expenditures of crop cultivation are ascribed to the harvested crop based on a sustainable cultivation practise. This includes that as many nutrients are replaced by fertilisation as are lost by harvesting and emissions to air and water and exceed the deposition of nutrients from the atmosphere (in case of nitrogen) /Müller-Lindenlauf et al. 2014/.
Table 7-1 Selected data used for SWEETFUEL scenario calculations and certain outputs for the typical dataset.
* N-fertiliser demand was calculated as follows: (nutrient content in biomass) × (biomass yield) / (1 - losses through ammonia emissions, denitrification & nitrate leaching) - (atmospheric depositionnet)
Units (per
ha × year)
Sweet sor-ghum
Cane fallow
Sweet sor-ghum
Grain to food
Sweet sorghum
Syrup
Biomass sorghum
Agricultural inputs Seeds kg 7 7 7 8 Pesticides kg 5 5 2.5 5 Fertiliser* N kg 350 260 350 356 P2O5 kg 120 90 120 125 K2O kg 380 285 380 450 Diesel fieldwork L 90 85 90 110 Yields Biomass t (dry matter) 20 15 20 25 Extraction efficiency % 95 95 85 -
Sugar t 3.1 2.0 2.8 -
Outputs Ethanol (from stalks) t 1.6 1.0 1.2 - Ethanol (from grains) t 1.2 - - - Surplus bagasse t 3.7 4.5 5.5 Biogas – power kWh - - - 23,300 – heat MJ - - - 17,100

7 Annex 79
SSSSweetweetweetweet FFFFueluelueluelSSSSweetweetweetweet FFFFueluelueluel
7.2 Additional results
Besides typical scenarios, bandwidth from high to low have been defined to cover variability in parameters such as agricultural yields, sugar content and conversion efficiencies. This leads to a bandwidth of results depicted in Table 7-2. For results under typical conditions refer to Table 4-4 and Table 4-5.
* (continued) Nutrient contents in biomass and yields for sweet and biomass sorghum are based on experimental data. In depositionnet, losses due to ammonia emissions, denitrification & nitrate leach-ing are already taken into account. Losses are based on model calculations and statistics and at-mospheric deposition is based on literature sources /Müller-Lindenlauf et al. 2014/. The following losses were used for nitrogen emissions: Ammonia 3.29 %, nitrate leaching 15 % for annual crops, denitrification losses 10 %. The losses relate to typical agricultural practise expected for 2020. This methodological approach results in higher fertiliser values compared to field trials, but delivers a real-istic description of a sustainable agricultural practise.

80 SWEETFUEL: Report on integrated sustainability assessment
SSSSweetweetweetweet FFFFueluelueluelSSSSweetweetweetweet FFFFueluelueluel
Table 7-2 Bandwidths of results for the main sweet and biomass sorghum scenarios in comparison to conventional systems. For abbreviations see Table 4-4. *: see subchapter 4.4.5.
Biomass Biomass
Can
e fa
llow
Gra
in t
o fo
od
Syr
up
prod
uctio
n
Bio
gas
(CH
P)
Can
e fa
llow
Gra
in t
o fo
od
Syr
up
prod
uctio
n
Bio
gas
(CH
P)
Area Indicator Unit
Cultivation experience ─ - - - - - - - -
Harvest techn. (maturity) ─ - - N/A + - - N/A +
Conversion techn. (maturity) ─ + + + + + + + +
GMO plant use ─ ++ ++ ++ ++ ++ ++ ++ ++Breeding potential ─ + + + ++ + + + ++Storage facilities ─ - - N/A 0 - - N/A 0
Resource depletion: energy
GJ / (ha × yr) -47 -44 3 -168 -222 -95 25 -568
Climate changet CO2 eq. /
(ha × yr)-1.4 -1.0 0.5 6.4 -10.8 -3.4 3.7 -27.8
Acidificationkg SO2 eq. /
(ha × yr)25 23 10 43 68 35 47 -7
Terrestrial eutrophication
kg PO4 eq. /
(ha × yr)3.7 3.5 1.3 10.9 11.4 5.5 6.6 7.8
Aquatic eutrophication
kg PO4 eq. /
(ha × yr)10 9 11 20 31 14 31 36
Photosmogkg ethene eq. / (ha × yr) -1.0 -0.7 -0.2 2.5 -8.3 -2.1 -2.0 -4.5
Human toxicitykg PM10 eq. /(ha × yr) 14 13 8 11 39 19 37 -31
Ozone depletiong R11 eq. /(ha × yr) 86 85 16 114 245 133 105 203
Direct land useha × yr /(ha × yr) 1 1 1 1 1 1 1 1
Net land usenet ha × yr /(ha × yr) 1.0 0.2 N/D 1.0 0.8 0.2 N/D 1.0
Water ─ - - - * - - - - - 0 * - -
Soil ─ - - - * - - - - - 0 * - -
Fauna ─ - - - - - 0 * - -
Flora ─ - - - - - - - - - - - -
Landscape ─ - - - - 0 0 0 0
Total capital investment
Million € / plant 58 58 58 2 58 58 58 2
NPV Million € / plant -91 -78 -305 2 536 423 -123 6Profit € / (ha × yr) -132 -112 -441 561 1474 1225 -623 2194
IRR % N/A N/A N/A 24% 148% 120% N/A 57%
CO2 avoidance costs € / t CO2 eq. 95 108 N/A N/A -137 -358 N/A -79
Energy resource savings costs € / GJ 3 3 N/A -3 -7 -13 N/A -4
Food security ─ 0 + ++ N/A 0 + ++ N/AIncome for farmers / local community ─ + + ++ + + + ++ +
Access to land, land rights ─ - 0 0 - - 0 0 -
Access to jobs ─ + + ++ + + + ++ +Acceptance by farmers ─ 0 + + + 0 + + +
Acceptance by general society ─ 0 + ++ 0 0 + ++ 0
Innovation ─ 0 ++ + + 0 ++ + +
High
Tec
hnol
ogy
Eco
nom
yS
ocie
ty
Low
Env
ironm
ent
Sweet sorghum Sweet sorghum

7 Annex 81
SSSSweetweetweetweet FFFFueluelueluelSSSSweetweetweetweet FFFFueluelueluel
7.3 Methodology environmental assessment
This subchapter contains a summary of the methodology used for the environmental as-sessment. For the complete methodology please refer to /Reinhardt et al. 2014/.
7.3.1 Life cycle assessment (LCA)
A general introduction of the methodology of a life cycle assessment (LCA) can be found in /Reinhardt et al. 2014/. In the following the settings for the life cycle impact assessment (LCIA) (subchapter 7.3.1.1) applied for the environmental assessment, system boundaries (subchapter 7.3.1.2), further methodological issues (subchapter 7.3.1.3) and the origin of the data are considered (subchapter 7.3.1.4).
7.3.1.1 Settings for Life cycle Impact Assessment ( LCIA)
The impact categories considered in the screening LCA performed by /Reinhardt et al. 2014/, the life cycle inventory (LCI) parameters and the respective characterisation factors are shown in Table 7-3. All impact categories are standard categories in life cycle assessments /JRC-IES 2010/. The procedures and general data for the calculations are documented in detail in /Borken et al. 1999/. In case of the category greenhouse effect the conversion of other trace gases (e.g. methane, nitrous oxide) into carbon dioxide equivalents (CO2 equiv.) was calculated by using GWP100 factors /IPCC 2007/.
Some impact categories, which are disregarded by /Reinhardt et al. 2014/, are excluded be-cause they are i) irrelevant for the SWEETFUEL systems (e.g. ionising radiation) or ii) still under methodological development (e.g. human and ecotoxicity, water depletion and land use; classified as level III or II/III in the ILCD Handbook). Moreover, LCI data quality for 2020 is limited particularly for human toxicity and ecotoxicity, which cover very many substances. The data available today is not suitable to derive results that are balanced enough for deci-sion support. Therefore, this category as a whole is excluded from the LCA and instead, one aspect of human toxicity, i.e. health risks due to particulate matter emissions, is covered as a midpoint indicator and important impacts on biodiversity are covered within the LC-EIA part (see subchapter 7.3.2).

82 SWEETFUEL: Report on integrated sustainability assessment
SSSSweetweetweetweet FFFFueluelueluelSSSSweetweetweetweet FFFFueluelueluel
Table 7-3 Indicators, important LCI parameters and characterisation factors for the respec-tive impact categories (/CML 2004/, /IPCC 2007/, /Klöpffer & Renner 1995/, /Leeuw 2002/, /Ravishankara et al. 2009/, /IFEU 2014/ on the basis of /IPCC 2007/).
Impact category Category indicator Life cycle inven tory (LCI) parameter
Formula Character. factor
Depletion of non-renewable energy resources
Cumulative primary en-ergy use from non-renewable sources
Crude oil Natural gas Hard coal Lignite Uranium ore
— —
Greenhouse effect CO2 equivalents (carbon dioxide equiva-lent)
Carbon dioxide fossil Nitrous oxide Methane biogenic* Methane fossil**
CO2 N2O CH4 CH4
1 298 25 27.75
Acidification SO2 equivalents (sulphur dioxide equiva-lent)
Sulphur dioxide Nitrogen oxides Ammonia Hydrochloric acid
SO2 NOX NH3 HCl
1 0.7 1.88 0.88
Terrestrial eutroph-ication
PO3−4 equivalents
(phosphate equivalent)
Nitrogen oxides Ammonia
NOX NH3
0.13 0.346
Aquatic eutrophica-tion
PO3−4 equivalents
(phosphate equivalent)
Nitrate Nitrogen Phosphorous
NO−3
N P
0.095 0.42 3.07
Photochemical ozone formation
C2H4 equivalents (ethylene equivalents)*
Non-methane hydro-carbons Methane
NMHC CH4
1 0.006
(Stratospheric) Ozone depletion
CFC-11 equivalents Nitrous oxide (Dinitrogen oxide)
N2O 0.017
Human toxicity PM10 equivalents Particulate matter (≤10 µm) Sulphur dioxide Nitrogen oxides Non-methane hydro-carbons Ammonia
- SO2 NOX NMHC NH3
1 0.54 0.88 0.012 0.64
*without CO2 effect; **with CO2 effect
Regarding ozone depletion, an ODP factor for nitrous oxide from a study by /Ravishankara et al. 2009/ is used although it is not yet commonly accepted because it is the only one avail-able.
Normalisation
Normalisation helps to better understand the relative magnitude of the results for the different environmental impact categories. It transforms a category indicator result by dividing it by a selected reference value, e.g. a certain emission caused by the system is divided by this emission per capita in a selected area.
In the SWEETFUEL LCA study, the environmental advantages and disadvantages for the European scenarios can be related to the environmental situation in the EU27. The reference

7 Annex 83
SSSSweetweetweetweet FFFFueluelueluelSSSSweetweetweetweet FFFFueluelueluel
information is the yearly average energy demand and the average emissions of various sub-stances per inhabitant in Europe, the so-called inhabitant equivalent (IE).
Due to the insecurity related to future emissions of various substances, the inhabitant equiva-lents will be calculated based on 2005 emissions. These values are subsequently used to normalise data which are calculated for 2015 and 2020 (time frame for SWEETFUEL sys-tems). To ensure comparability, results for the non-European scenarios are also normalised using the EU inhabitant equivalents for EU27.
Weighting
Weighting will not be applied. Weighting uses numerical factors based on value-choices to compare and sometimes also aggregate indicator results, which are not comparable on a physical basis.
7.3.1.2 System boundaries
The LCA for this project covers the entire value chain from feedstock production to the distri-bution and usage of the final products including land use change effects with associated changes in carbon stocks.
Systematic exclusion of activity types
Infrastructure is excluded from the system. This applies to production and processing equip-ment, vehicles such as tractors, buildings and streets connected with the crops’ production and use. In many LCAs assessing bioenergy systems it was shown that infrastructure ac-counts for less than 10 % of the overall results (see /Nitsch et al. 2004/, /Fritsche et al. 2004/ and /Gärtner 2008/). However, this only applies to the environmental impacts. In contrast, investment and capital costs for process equipment or buildings are an important part of the economic assessment.
7.3.1.3 Further methodological issues
Biogenic carbon
There are two possible sources for carbon dioxide (CO2) emissions: (recent) biogenic or fos-sil carbon stocks. For biofuels, the amount of CO2 released into the atmosphere from direct biofuel combustion equals the amount of CO2 that has been taken up by the plants recently (short carbon cycle). This release of biogenic CO2 is considered carbon neutral, i.e. it does not promote greenhouse effect. Therefore, only fossil carbon is taken into account for calcu-lating greenhouse gas balances in SWEETFUEL, which is the standard approach among LCA practitioners.
Direct land use change and changes in organic carbo n stocks
Changes in direct land use and related changes in organic carbon stocks of above- and be-low-ground biomass, soil organic carbon, litter and dead wood will be covered by LCA /IPCC 2006/. Changes in organic carbon stocks may result from extraction of woody biomass or straw for bio-refining, which formerly remained on the field / in the forest. The carbon stock changes and resulting release of greenhouse gases (mainly in the form of CO2) are integrat-
84 SWEETFUEL: Report on integrated sustainability assessment
SSSSweetweetweetweet FFFFueluelueluelSSSSweetweetweetweet FFFFueluelueluel
ed into the GHG balances by using the above mentioned methodologies if alternative land use options lead to different carbon stocks. The methodologies described by the IPCC guide-lines for national greenhouse gas inventories /IPCC 2006/ and the guidelines for the calcula-tion of land carbon stocks for the purpose of Annex V to EU RED /EC 2010b/ will be used.
Carbon sequestration, which could also result from a land use change, will not be taken into account. This is because the potential to sequester carbon in soil is very site-specific and highly dependent on former and current agronomic practices, climate and soil properties /Larson 2005/. Moreover, it is impossible to assure that the carbon is sequestered perma-nently. As there is no scientific consensus about this issue, carbon sequestration in agricul-tural soils will not be accounted for.
Indirect effects
New systems using biomass can indirectly affect environmental indicators by withdrawing resources from other (former) uses. One of the most common indirect effects is indirect land use change: Biomass formerly used for other purposes (e.g. as food or feed) has to be pro-duced elsewhere if it is now used for biorefineries. This can cause a clearing of (semi-)natural ecosystems (=indirect land use change) and hence changes in organic carbon stocks and damages to biodiversity.
Withdrawing biomass from other uses may affect not only land use patterns but also other goods and services. For example, if a SWEETFUEL bioethanol plant is less efficient com-pared to another energetic biomass use option (e.g. CHP plants) in terms of replacement of crude oil equivalents but more efficient from an economic point of view and hence withdraw biomass from direct energetic use pathways, the crude oil production may even increase.
7.3.1.4 Data origin and data quality
Since sweet sorghum is cultivated in many different regions, for the SWEETFUEL project a multitude of data and information with respect to agricultural production and reference sys-tems are needed. Those data were provided by the project partners.
Data on equivalent products of the outputs and their production chains were deduced by IFEU /IFEU 2014/.
7.3.2 Life cycle environmental impact assessment (L C-EIA)
A comprehensive assessment of environmental impacts also has to take into consideration local impacts on environmental factors like e.g. biodiversity, water and soil. A general intro-duction to LC-EIA methodology and the derivation of the life cycle environmental impact as-sessment approach is given in /Reinhardt et al. 2014/. In the following, the LC-EIA approach in the SWEETFUEL project is summarised.
For the purpose of this project, which encompasses neither an actual site-specific production of sweet sorghum nor the construction of a plant, it is not appropriate to perform a full-scale EIA according to regulatory frameworks, which is always project and site specific. Neverthe-less, elements of environmental impact assessment (EIA) are used to characterise the envi-ronmental impacts associated with the SWEETFUEL concepts at a generic level.
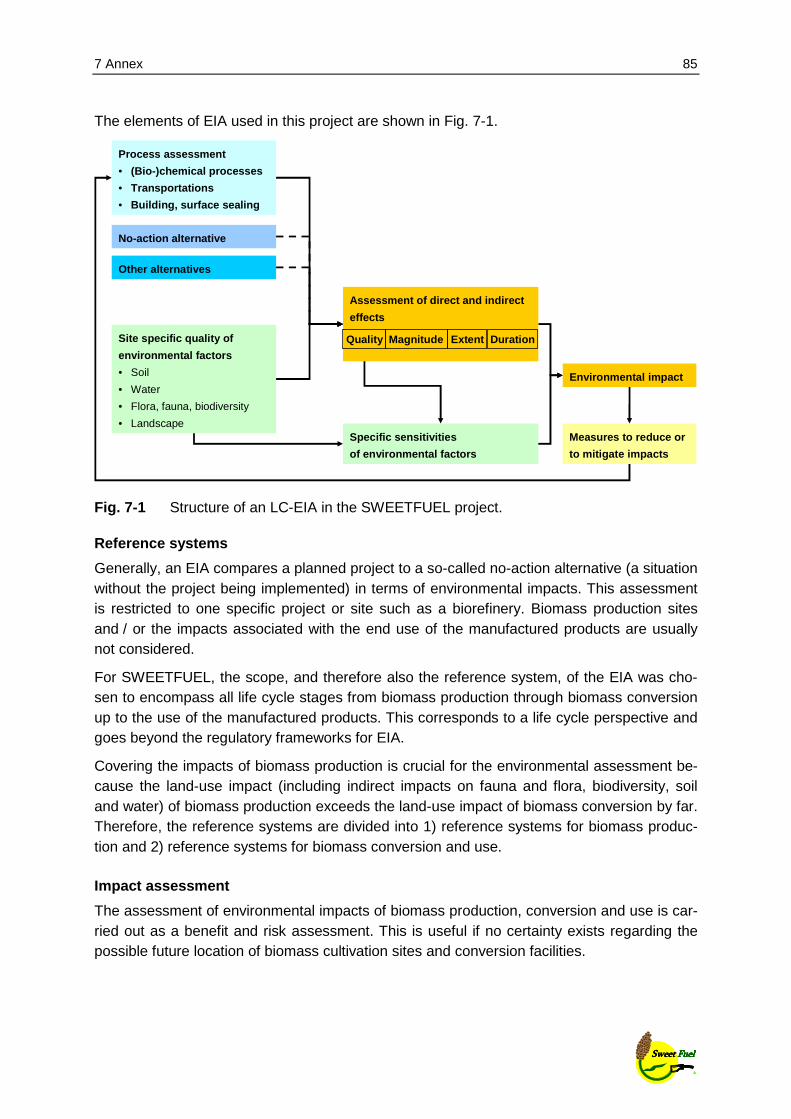
7 Annex 85
SSSSweetweetweetweet FFFFueluelueluelSSSSweetweetweetweet FFFFueluelueluel
The elements of EIA used in this project are shown in Fig. 7-1.
Fig. 7-1 Structure of an LC-EIA in the SWEETFUEL project.
Reference systems
Generally, an EIA compares a planned project to a so-called no-action alternative (a situation without the project being implemented) in terms of environmental impacts. This assessment is restricted to one specific project or site such as a biorefinery. Biomass production sites and / or the impacts associated with the end use of the manufactured products are usually not considered.
For SWEETFUEL, the scope, and therefore also the reference system, of the EIA was cho-sen to encompass all life cycle stages from biomass production through biomass conversion up to the use of the manufactured products. This corresponds to a life cycle perspective and goes beyond the regulatory frameworks for EIA.
Covering the impacts of biomass production is crucial for the environmental assessment be-cause the land-use impact (including indirect impacts on fauna and flora, biodiversity, soil and water) of biomass production exceeds the land-use impact of biomass conversion by far. Therefore, the reference systems are divided into 1) reference systems for biomass produc-tion and 2) reference systems for biomass conversion and use.
Impact assessment
The assessment of environmental impacts of biomass production, conversion and use is car-ried out as a benefit and risk assessment. This is useful if no certainty exists regarding the possible future location of biomass cultivation sites and conversion facilities.
Process assessment
• (Bio-)chemical processes
• Transportations
• Building, surface sealing
Site specific quality of
environmental factors
• Soil
• Water
• Flora, fauna, biodiversity
• Landscape
Environmental impact
Specific sensitivities
of environmental factors
Measures to reduce or
to mitigate impacts
No-action alternative
Assessment of direct and indirect
effects
Extent DurationQuality Magnitude
Other alternatives

86 SWEETFUEL: Report on integrated sustainability assessment
SSSSweetweetweetweet FFFFueluelueluelSSSSweetweetweetweet FFFFueluelueluel
Impact assessment for biomass production
In the case of biomass production the factors that have been identified to assess the possible benefits and risks of biomass production are illustrated in Fig. 7-2.
Fig. 7-2 Identification of factors for the LC-EIA of biomass production.
Based on these factors, a biomass-specific assessment of the environmental impact is con-ducted. After that, an evaluation of different biomass feedstock relative to the respective ref-erence systems is done by qualitative-descriptive classification in different classes. Moreo-ver, geographic differences are evaluated.
Impact assessment for biomass conversion and use
A separate benefit and risk assessment is performed for biomass conversion and use. This assessment covers the impacts caused by a conversion plant, by the use of bio-based ener-gy carriers and products as well as by transportation of biomass feedstock and intermedi-ates. The benefits and risks assessment for conversion, use and transportation investigates potential effects of conversion and use units on the local environment. The aspects human health, soil, flora, fauna and landscape are studied. Effects beyond the local environment (e.g. greenhouse effect) are derived from results of LCA.
The potential environmental benefits and risks of the different conversion technologies as well as the environmental issues potentially affected by these factors are shown in Table 7-4.
Environmental factors
Soil Water Flora Fauna Landscape
Plant characteristics
Need for pesticides
Root system
Nutrientefficiency … …
Life cycle
Erosion
Compaction
Chemistry
Quantity Species diversity
Habitat quality (food, shelter,
corridors)
Quality
Species diversity
Landscapecharacteristics
Landscapediversity
Rel
evan
t asp
ects
Environmental factors
Soil Water Flora Fauna Landscape
Plant characteristics
Need for pesticides
Root system
Nutrient efficiency … …
Life cycle
Erosion
Compaction
Chemistry
Quantity Species diversity
Habitat quality (food, shelter,
corridors)
Quality
Species diversity
Landscapecharacteristics
Landscapediversity

7 Annex 87
SSSSweetweetweetweet FFFFueluelueluelSSSSweetweetweetweet FFFFueluelueluel
Table 7-4 Technology-related factors, environmental issues and potential environmental impacts of biomass conversion and use.
Technology-related factor Environmental issue Poten tial environmental impact
Emission of noise and odours Human health Annoyance by an increase of environmental noise or gase-ous emissions
Waste water and waste water treatment
Water Depletion of water resources Nutrient input into water bod-ies causing eutrophication
Amount of traffic (noise and gaseous emissions)
Human health Annoyance by an increase of environmental noise or gase-ous emissions
Size and height of conversion plants
Soil Flora Fauna Landscape
Soil compaction or soil sealing Loss of vegetation Loss of habitat Landscape disturbance
Development of conflict matrices
Aggregated conflict matrices are created based on the biomass-specific benefits and risks, which summarize the impacts of biomass production, conversion and use on the selected environmental factors.
The following qualitative indicators are used in the conflict matrices to compare the environ-mental impacts of biomass production, conversion and use to the respective reference sys-tems (relative evaluation):
• “Positive”: compared to the reference systems, biomass production, conversion and use is more favourable
• “Neutral”: biomass production, conversion and use show approximately the same impacts as the reference system
• “Negative”: compared to the reference systems, biomass production, conversion and use is less favourable.

88 SWEETFUEL: Report on integrated sustainability assessment
SSSSweetweetweetweet FFFFueluelueluelSSSSweetweetweetweet FFFFueluelueluel
7.4 Methodology economic assessment
This subchapter contains a summary of the methodology used for the economic assessment. For the complete methodology please refer to /Basavaraj, Parthasarathy Rao et al. 2014/.
7.4.1 Conceptual framework for economic assessment
The conceptual framework of economic assessment is based on the life cycle discerning production, processing, use and maintenance costs. A steady state cost model (meaning all technologies remain constant in time) is employed and thus it cannot be used to model the dynamic effect in the real markets. The cost model assumed is linear homogeneous or ho-mogeneous to degree 1 implying that as inputs are doubled the output is also doubled. The present study concerns the comparison of production of the end products (as described in sweet and biomass sorghum scenarios) on one hectare of land.
7.4.2 Cost categories
Four levels of cost categories are distinguished in the current study for all the sweet and bi-omass sorghum scenarios to conduct economic assessment. These include;
• Production costs of sweet sorghum and biomass sorghum which include all production activities starting with land preparation till harvest.
• Transport cost which includes cost of transporting sweet sorghum and biomass sorghum to the centralized ethanol processing units.
• Processing costs which include cost of converting sweet and biomass sorghum to differ-ent use pathways
• Cost of acquisition, operations and maintenance
A detailed overview of the above mentioned cost categories along with units are described in Table 7-5. The costs include all the generic sweet and biomass sorghum scenarios and do not distinguish between different use pathways.
7.4.3 Cost and revenue estimation
Cost estimation implies an assessment of the value or price something has. A parametric type of cost estimation (cost per unit) is used. The costs per complete process (either pro-duction or processing) of the reference flows (sweet and biomass sorghum scenarios) have been calculated by multiplying the costs per reference unit with the absolute amount of inputs required for the process output.
In case of capital costs on machinery / equipment, interest cost on investment and working capital, depreciation and personnel costs (wages and salary), the information is gathered from available literature wherever relevant for cost estimation. These costs are then scaled to
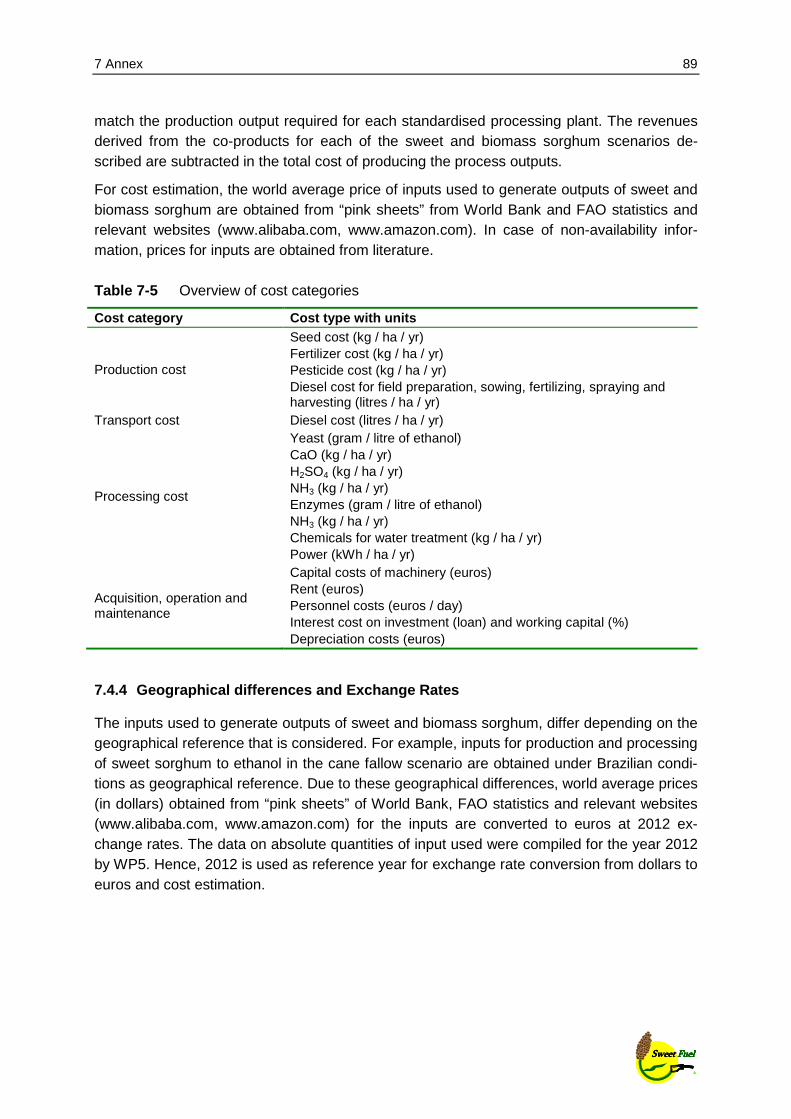
7 Annex 89
SSSSweetweetweetweet FFFFueluelueluelSSSSweetweetweetweet FFFFueluelueluel
match the production output required for each standardised processing plant. The revenues derived from the co-products for each of the sweet and biomass sorghum scenarios de-scribed are subtracted in the total cost of producing the process outputs.
For cost estimation, the world average price of inputs used to generate outputs of sweet and biomass sorghum are obtained from “pink sheets” from World Bank and FAO statistics and relevant websites (www.alibaba.com, www.amazon.com). In case of non-availability infor-mation, prices for inputs are obtained from literature.
Table 7-5 Overview of cost categories
Cost category Cost type with units
Production cost
Seed cost (kg / ha / yr) Fertilizer cost (kg / ha / yr) Pesticide cost (kg / ha / yr) Diesel cost for field preparation, sowing, fertilizing, spraying and harvesting (litres / ha / yr)
Transport cost Diesel cost (litres / ha / yr)
Processing cost
Yeast (gram / litre of ethanol) CaO (kg / ha / yr) H2SO4 (kg / ha / yr) NH3 (kg / ha / yr) Enzymes (gram / litre of ethanol) NH3 (kg / ha / yr) Chemicals for water treatment (kg / ha / yr) Power (kWh / ha / yr)
Acquisition, operation and maintenance
Capital costs of machinery (euros) Rent (euros) Personnel costs (euros / day) Interest cost on investment (loan) and working capital (%) Depreciation costs (euros)
7.4.4 Geographical differences and Exchange Rates
The inputs used to generate outputs of sweet and biomass sorghum, differ depending on the geographical reference that is considered. For example, inputs for production and processing of sweet sorghum to ethanol in the cane fallow scenario are obtained under Brazilian condi-tions as geographical reference. Due to these geographical differences, world average prices (in dollars) obtained from “pink sheets” of World Bank, FAO statistics and relevant websites (www.alibaba.com, www.amazon.com) for the inputs are converted to euros at 2012 ex-change rates. The data on absolute quantities of input used were compiled for the year 2012 by WP5. Hence, 2012 is used as reference year for exchange rate conversion from dollars to euros and cost estimation.

90 SWEETFUEL: Report on integrated sustainability assessment
SSSSweetweetweetweet FFFFueluelueluelSSSSweetweetweetweet FFFFueluelueluel
7.4.5 Cost aggregation
To aggregate costs over the different phases of the life cycle of sweet and biomass sorghum for different use pathways, the steps involved were:
• Identification of the subsystems that could result in different cost and revenues
• Assignment of costs or prices to the respective subsystems identified in step 1
• Calculation of costs per unit of subsystem by multiplying the cost per reference unit with the absolute quantities of the process outputs
• Aggregation of all the costs and prices of all the subsystems over the complete life cycle.
This stepwise calculation allows one to provide costs for certain cost categories (production, processing, co-products) and costs over a certain period of time.
7.4.6 Discounting
Discounting in the present study is applied for two reasons. To understand whether profit can be made from the technology choice of sweet and biomass sorghum for different use path-ways and the other to deal with cost of borrowings. Typically, the discount rate for private investments is between 5 % and 20 %, to be decided by the private decision maker. For long-term projects in the public sector, the discount rates can be as low as 2 %.
In the study, discounting wherever relevant is integrated into the calculations. The discount rates for different installations vary based on how they depreciate. For example, much of the major equipment installation has a useful life of 15 years and would be depreciated at 10 % per annum. Hence, instead of computing separately for each of the investment processes (example capital equipment, plant, building) estimates available from Asia Pacific Economic Cooperation (APEC) Energy Working Group reports 2010 which have similar product out-flows were used for analysis wherever relevant.
7.4.7 Uncertainty in cost data and sensitivity anal ysis
As already specified in the general settings, sweet sorghum is cultivated in various regions covering multiple climatic conditions and cultivation practices (e.g. the amount of fertiliser as well as harvesting expenditures) which can result in strong variations in yield. The influence of those yield differences are assessed via sensitivity analyses. Thus, low, typical and high case values were defined to cover the bandwidths of such parameters.
Furthermore, due to various process technologies used in multiple regions different conver-sion efficiencies may occur. Thus, also for this parameter, low, typical and high datasets were defined to cover a bandwidth of the parameter.
Additionally, inconsistencies in the costs used in the economic assessment can relate to the definition of the cost, collection methods, costing method and type, cost considerations, geo-graphical differences, exchange rates, among others. To overcome such uncertainties, data on absolute quantities used in the process were defined for low, typical and high cases. Ac-
7 Annex 91
SSSSweetweetweetweet FFFFueluelueluelSSSSweetweetweetweet FFFFueluelueluel
cordingly, the results are presented for low, typical and high cases for each of the use path-ways of sweet and biomass sorghum.
7.4.8 Capital and Operational cost and assumptions for economic assessment
The cost model used for economic assessment takes into account indicators of commercial viability i.e. Net variable cost, NPV (net present value) & IRR (internal rate of return). Most of the assumptions on financing (site development costs, procurement & construction costs, equity and debt capital and crushing capacity) for this study are directly taken from APEC report, 2010 and investment costs for use of biomass sorghum to biogas and biomethane (typical for European conditions) were provided by KWS (a plant breeding company in Ger-many named after Kleinwanzlebener Saatzucht), partner in the SWEETFUEL project (Table 7-6). Operational expenditure (OPEX) is arrived at taking all cost on per litre basis and scaling it up using plant capacity (Table 7-6). The financial analysis further assumes an amortisation period of 15 years. It is generally found that both processing and labour costs have greater impact on scale economies of the plant. Hence, sensitivity analysis is carried out by assuming 10 % and 15 % decline in processing and labour cost for typical and high scenarios, respectively. Further, the interest costs, rent, other payments on working capital are assumed to remain constant as the scale increases. A nominal interest rate of 10 % is assumed for financial analysis in all the scenarios.
7.4.9 Systematic exclusions in the study for econom ic assessment
Though a life cycle framework is used in the present study for economic assessment, it does not take into consideration certain of the costs in life cycle phase due to: in some cases non availability of data and in other complexities involved in their calculations and linearity as-sumption of cost model as in the present study.
The costs not considered in the assessment include:
• Research and development costs
• Transfer payments (subsidies)
• External costs (Taxes and tariffs)
• Externality costs
• End of life costs/disposal costs
• Profit margin

92 SWEETFUEL: Report on integrated sustainability assessment
SSSSweetweetweetweet FFFFueluelueluelSSSSweetweetweetweet FFFFueluelueluel
Table 7-6 Value of capital and operational expenditures for the economic assessment for different scenarios /APEC 2010/.
Scenario CAPEX (Capi-tal expendi-ture, million euros)
OPEX (Operation-al expenditure; million euros) Low scenario
Crushing Capacity (million tonne per annum)
Sweet sorghum: juice to ethanol 57.53 82.10 1 million tonne stalks Sweet sorghum: juice+ grain to ethanol
57.53 89.43 1 million tonne stalks+ 0.1 million tonne grains
Grain to food scenario 57.53 83.79 1 million tonne stalks Sweet sorghum: syrup to ethanol 57.53 88.17 1 million tonne stalks Biomass sorghum to biogas 2.0 0.75 11 500 tonne biomass Biomass sorghum 2nd gen. ethanol 112.22 1413.14 0.5 million tonne Biomass sorghum FT diesel 56.19 210.77 1 million tonne
7.4.10 Data origin and data quality
Since sweet sorghum is cultivated in many different regions, for the SWEETFUEL project a multitude of data and information with respect to agricultural production and reference sys-tems are needed. There was no generic data format concerning economic assessment. Data requirement are strongly dependent on the goal and scope of the study, and the cost differ-ences are the main concern rather than absolute figures. Concerning the cultivation of sweet sorghum across geographical reference systems, data on production of sweet and biomass sorghum for the study is obtained from WP 5 compiled across geographical settings and is used for the economic assessment.
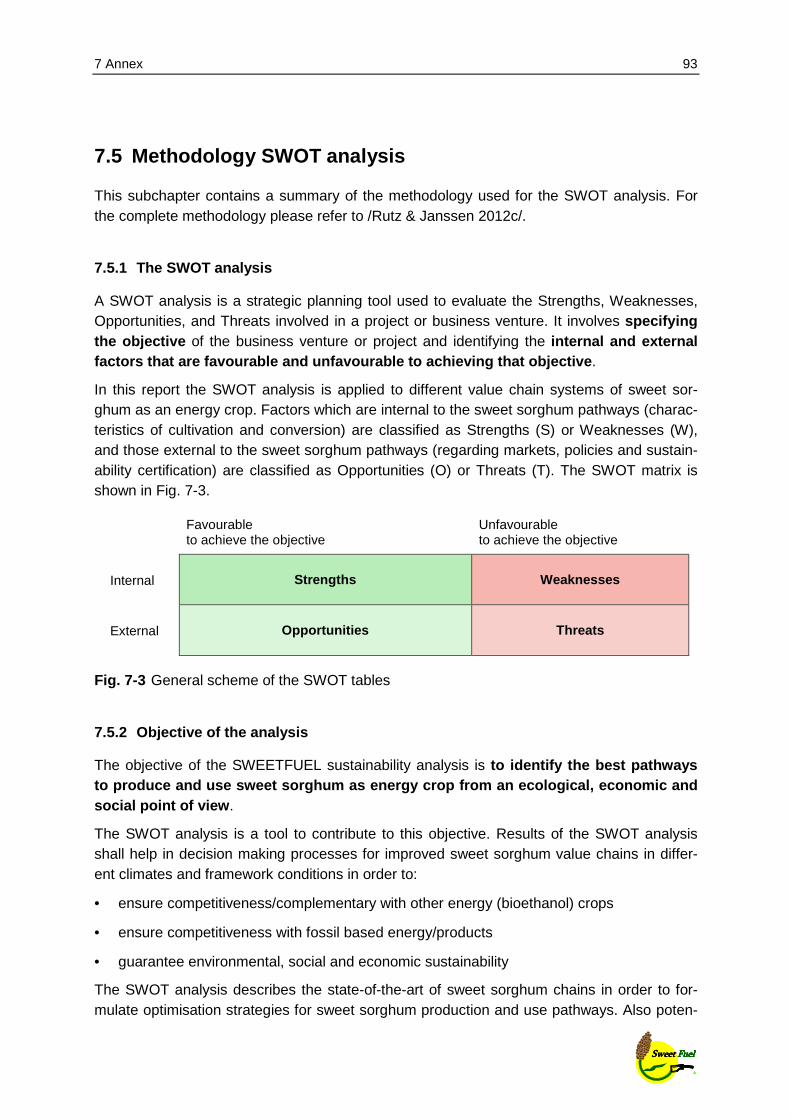
7 Annex 93
SSSSweetweetweetweet FFFFueluelueluelSSSSweetweetweetweet FFFFueluelueluel
7.5 Methodology SWOT analysis
This subchapter contains a summary of the methodology used for the SWOT analysis. For the complete methodology please refer to /Rutz & Janssen 2012c/.
7.5.1 The SWOT analysis
A SWOT analysis is a strategic planning tool used to evaluate the Strengths, Weaknesses, Opportunities, and Threats involved in a project or business venture. It involves specifying the objective of the business venture or project and identifying the internal and external factors that are favourable and unfavourable to achieving that objective.
In this report the SWOT analysis is applied to different value chain systems of sweet sor-ghum as an energy crop. Factors which are internal to the sweet sorghum pathways (charac-teristics of cultivation and conversion) are classified as Strengths (S) or Weaknesses (W), and those external to the sweet sorghum pathways (regarding markets, policies and sustain-ability certification) are classified as Opportunities (O) or Threats (T). The SWOT matrix is shown in Fig. 7-3.
Favourable to achieve the objective
Unfavourable to achieve the objective
Internal
Strengths Weaknesses
External
Opportunities Threats
Fig. 7-3 General scheme of the SWOT tables
7.5.2 Objective of the analysis
The objective of the SWEETFUEL sustainability analysis is to identify the best pathways to produce and use sweet sorghum as energy crop fro m an ecological, economic and social point of view .
The SWOT analysis is a tool to contribute to this objective. Results of the SWOT analysis shall help in decision making processes for improved sweet sorghum value chains in differ-ent climates and framework conditions in order to:
• ensure competitiveness/complementary with other energy (bioethanol) crops
• ensure competitiveness with fossil based energy/products
• guarantee environmental, social and economic sustainability
The SWOT analysis describes the state-of-the-art of sweet sorghum chains in order to for-mulate optimisation strategies for sweet sorghum production and use pathways. Also poten-

94 SWEETFUEL: Report on integrated sustainability assessment
SSSSweetweetweetweet FFFFueluelueluelSSSSweetweetweetweet FFFFueluelueluel
tial future developments are considered and integrated in the SWOT analysis. Thereby, the timeframe includes the years 2014 (the real situation at the end of the SWEETFUEL project) and 2020 (expected future based on conservative assumptions).
7.5.3 Stakeholder involvement
In order to complete the SWOT tables, an extended stakeholder review was included in the analysis. A “Workshop on SWEETFUEL SWOT Analysis” was organised on 17 April 2012 in Bologna, Italy. Furthermore, the draft SWOT analysis report and a dedicated questionnaire were sent to stakeholders for input. Many stakeholders provided very useful comments which were included in the final report. The stakeholders are listed in the Acknowledgements of this report.
7.5.4 Structure of the SWOT analysis
Sweet sorghum is a promising energy crop adaptable for different climatic conditions and providing a large variety of products and by-products, such as energy, food, fodder, and fi-bre. This is the result of the large genetic variability of the Sorghum genus leading to a wealth of different genotypic and phenotypic traits of sweet sorghum varieties. Therefore, strengths, weaknesses, opportunities and threats are also very diverse among sweet sor-ghum varieties and different value chains in productions systems.
However, several characteristics are common to sweet sorghum as an energy crop and thus, in a first step, the SWEETFUEL SWOT analysis describes general strengths, weaknesses, opportunities and threats of sweet sorghum.
In a second step, SWOT analyses are elaborated for different production systems in subtrop-ical/tropical and temperate climate zones. These production systems include centralized eth-anol, decentralized syrup and decentralized ethanol systems in subtropical/tropical climate as well as biogas, lignocellulose-ethanol, direct combustion and gasification systems in tem-perate climate. For several of these systems two SWOT tables are shown: one for the sweet sorghum cultivation and one for sweet sorghum conversion to end products. Thereby, end products may include energy carriers (e.g. biogas), energy (e.g. electricity), fertilizer (e.g. digestate), food (e.g. grains), fodder (e.g. leaves, bagasse) and other co-products. The use of energy carriers for different purposes is included in the SWOT table.
In summary, the following analyses are made and described in dedicated subchapters:
• General SWOT for sweet sorghum
• Subtropical and tropical climate
- Centralised production system (cultivation and conversion)
- Decentralised syrup production system (cultivation and conversion)
- Decentralised ethanol production system (cultivation and conversion)

7 Annex 95
SSSSweetweetweetweet FFFFueluelueluelSSSSweetweetweetweet FFFFueluelueluel
• Temperate climate
- Biogas production system (cultivation and conversion)
- Lignocellulose-ethanol production system (cultivation and conversion)
- Direct combustion system (cultivation and conversion)
- Gasification system (cultivation and conversion)
The SWOT tables are providing brief statements (in bullet form) on the strengths, weakness-es, opportunities and threats of the production systems. These tables shall allow a quick overview about advantages and disadvantages of each production system.
The SWOT statements address a large variety of environmental, social and economic sus-tainability aspects. Depending on the value chain, these statements may include the follow-ing sustainability aspects.
• Land use
- Land use and land use change
- Competitive land use
- Land use conflicts
• Social aspects
- Benefits for smallholders
- Income opportunities
- Employment opportunities
- Change in traditional use and knowledge
- Supply with modern energy as substitute for traditional bioenergy
- Energy security
- Gender aspects
- Working conditions
- Health
- Food security
- Food and feed prices
• Environment
- GHG emissions
- Human- and ecotoxicity
- Biodiversity
- Soil conservation and soil quality
- Water availability, use and efficiency
96 SWEETFUEL: Report on integrated sustainability assessment
SSSSweetweetweetweet FFFFueluelueluelSSSSweetweetweetweet FFFFueluelueluel
- Water quality
- Resource depletion
- Eutrophication (terrestrial and aquatic)
- Acidification
• Economics
- Productivity and processing efficiency
- Competitiveness and comparative advantage of the feedstock
- Net energy balance
- National revenues, gross value added
- Energy security (security of supply)
- Infrastructure and logistics
- Pricing of the end products
- State of commercialization / competitiveness with reference products
Finally, a core focus is placed on the competition between the biomass uses for food, feed, fibres, and biofuels and on different scales of sweet sorghum production and use. Further-more, policy aspects such as different policy framework conditions in target countries as well as issues of social acceptance and public perception are taken into account.

8 Glossary and abbreviations 97
SSSSweetweetweetweet FFFFueluelueluelSSSSweetweetweetweet FFFFueluelueluel
8 Glossary and abbreviations
1st generation biofuels Biofuels e.g. produced from sugar, starch, vegetable oil or animal fats using con-ventional technologies
2nd generation biofuels Biofuels e.g. produced from non-food biomass such as lignocellulose and waste biomass (e.g. wheat straw or corn stover) using innovative technologies
2G ethanol see 2nd generation biofuels
APEC Asia Pacific Economic Cooperation
ARC Agricultural Research Council, Potchefstroom, South Africa; http://www.arc.agric.za/
Bagasse Fibrous matter that remains after stalks are crushed to extract the juice
Biomass sorghum / BS Sorghum cultivars with high lignocellulosic biomass yield, potentially used as ener-gy crop
BtL Biomass-to-Liquid; synthetic biofuels produced via biomass gasification
C4 plant Plants using a 4-carbon molecule as a first product in the carbon fixation pathway (in contrary to a 3-carbon molecule of C3 plants), which leads amongst others to higher water use efficiencies.
CAPEX Capital expenditure
CFC Chlorofluorocarbons; Class of chemical compounds often used as refrigerants
CH4 Methane
CHP Combined heat and power; co-generation of electricity and heat
CIRAD Centre de Coopération Internationale en Recherche Agronomique pour le Dé-veloppement, Paris, France; http://www.cirad.fr
CO2 Carbon dioxide
Cultivar Plant or group of plants selected for some desirable characteristics. Cultivar is a general word that includes lines, varieties and hybrids.
DDGS Dried distillers grains with solubles, a protein-rich co-product of bioethanol produc-tion from cereals
EIA Environmental impact assessment; a standardised methodology for analysing pro-posed projects regarding their potential to affect the local environment
EMBRAPA Empresa Brasileira de Pesquisa Agropecuária, Brasília, Brazil; http://www.embrapa.br
Energy sorghum Sweet and biomass sorghum cultivars used in this project
Eq. / Equiv. Equivalent
FAO Food and Agriculture Organization
Fibre sorghum Biomass sorghum cultivars with a high content of fibre; potentially used as fibre or energy crop
FP7 European Commission’s Seventh Framework Programme
FT diesel Fischer-Tropsch diesel; the FT process converts carbon monoxide and hydrogen into liquid hydrocarbons, which can be further processed into synthetic diesel
GHG Greenhouse gases
GJ Gigajoule
GMO Genetically modified organism
Grain sorghum Sorghum cultivars with high grain yield established as food or feed crop

98 SWEETFUEL: Report on integrated sustainability assessment
SSSSweetweetweetweet FFFFueluelueluelSSSSweetweetweetweet FFFFueluelueluel
Ha Hectare
Hybrid Offspring resulting from the cross between two genetically dissimilar parental lines. Usually, seeds from hybrids don’t consistently provide the desired characteristics, so hybrid seed should be repurchased by growers for each planting season.
ICRISAT-IN International Crops Research Institute for the Semi-Arid Tropics, Patancheru, India; http://www.icrisat.org
Idle land Reference systems such as degraded soils or land that becomes free due to differ-ent reasons e.g. the intensification of existing land use (see also subchapter 2.1, “Alternative land use options”)
IFEU Institute for Energy and Environmental Research Heidelberg, Germany; http://www.ifeu.de
IE Inhabitant equivalent
ILUC Indirect land use change
IP Intellectual property
IRR Internal rate of return
ISCC International sustainability and carbon certification
kWh Kilowatt hour
KWS KWS Saat AG, Einbeck, Germany; http://www.kws.de
L. Linné
LCA Life cycle assessment
LC-EIA Life cycle environmental impact assessment (assessment of local environmental impacts taking into account the stages during the whole life cycle of a product from cradle to grave)
LCIA Life cycle impact assessment
Line Breeding material which tends to be genetically identical
LUC Land use change
N Nitrogen
N/A Not applicable
N/D No data / not determined
NH3 Ammonia
NIMBY Not in my back yard
N2O Nitrous oxide, commonly known as laughing gas
NO3- Nitrate
NOX Nitrogen oxide
NPV Net present value
ODP Ozone depletion potential
OPEX Operational expenditure
Pesticide Pesticides (insecticides, fungicides, herbicides, etc.) are substances meant for preventing, destroying or mitigating any pest
PM10 Particulate matter smaller than about 10 micrometres
PO43- Phosphate
R 11 Trichlorofluoromethane, also: chlorofluorocarbon
RED European Renewable Energy Directive; directive 2009/28/EC of the European Parliament and of the Council of 23 April 2009
RSB Roundtable on sustainable biofuels

8 Glossary and abbreviations 99
SSSSweetweetweetweet FFFFueluelueluelSSSSweetweetweetweet FFFFueluelueluel
SEA Strategic environmental assessment
SO2 Sulfur dioxide
SWEETFUEL Project ”Sweet Sorghum: an alternative energy crop”; supported by the European Commission in the 7th Framework Programme to exploit the advantages of sweet sorghum as potential energy crop for bio-ethanol production
Sweet sorghum / SS Sorghum cultivars with juicy stems and high juice sugar content in their stalks, potentially used as an energy and food crop
SWOT Strengths, Weaknesses, Opportunities, Threats
UANL Universidad Autónoma de Nuevo León, México; http://www.uanl.mx
UCSC Università Cattolica del Sacro Cuore, Piacenza, Italy; http://www.unicatt.it
UNIBO Università di Bologna, Italy; http://www.unibo.it
Variant Term used here to summarise sweet, grain, biomass, energy and fibre sorghum
Vinasse By-product of the fermentation of certain process residues to e.g. ethanol
WIP WIP Renewable Energies, Germany; http: //www.wip-munich.de
WP Work package
Yr Year