wotc impact assessment part 1 water...
TRANSCRIPT

EN EN
COMMISSION OF THE EUROPEAN COMMUNITIES
Brussels, SEC(2007) 993
COMMISSION STAFF WORKING DOCUMENT
Accompanying document to the
COMMUNICATION FROM THE COMMISSION TO THE COUNCIL AND THE EUROPEAN PARLIAMENT
Addressing the challenge of water scarcity and droughts in the European Union
Impact Assessment
{COM(2007) 414 final} {SEC(2007) 996} {SEC(2007) 997}

EN 2 EN
TABLE OF CONTENTS
1. Procedural issues and consultation of interested parties ..... ………………………….3
1.1. Organisation and timing............................................................................................... 3
1.2. Consultation and expertise ........................................................................................... 3
1.3. Terminology................................................................................................................. 6
1.4. Integration of the Impact Assessment Board's recommendations ............................... 6
2. What problem is the Communication expected to address? ........................................ 8
2.1. What are the issues that may require action? ............................................................... 8
2.2. What are the underlying drivers of the problems? ..................................................... 10
2.3. Who is affected, in what ways and to what extent? ................................................... 13
2.4. How would the problem evolve, all things being equal? ........................................... 14
2.5. Does the EU have the right to act?............................................................................. 22
3. Objectives................................................................................................................... 24
3.1. Policy objectives ........................................................................................................ 24
3.2. Consistency with the horizontal objectives of the European Union .......................... 25
4. What are the main policy options available to achieve the objectives?..................... 25
4.1. Option A: 'water supply only' .................................................................................... 26
4.2. Option B: 'economic instruments only' ...................................................................... 26
4.3. Option C: integrated approach ................................................................................... 27
5. Analysis of impacts .................................................................................................... 30
5.1. Option A: 'water supply only' .................................................................................... 30
5.2. Option B: 'economic instruments only' ...................................................................... 36
5.3. Option C: integrated approach ................................................................................... 39
6. Comparing the options ............................................................................................... 48
7. Monitoring and evaluation ......................................................................................... 49
EN 3 EN
1. PROCEDURAL ISSUES AND CONSULTATION OF INTERESTED PARTIES
1.1. Organisation and timing
At the Environment Council of 9 March 2006, a number of Member States called for European action on water scarcity and droughts. The Commission agreed to analyse the issues and presented a preliminary analysis at the Environment Council of 27 June 2006.
Following the discussion and the request by Member States for a further assessment of the issues, the Commission proposed to come back with an in-depth assessment identifying the extent and impacts of the problems linked to water scarcity and droughts, as well as the possible gaps in the implementation of the existing EU policies. The Commission also announced its intention to adopt a Communication on water scarcity and droughts by July 2007.
1.2. Consultation and expertise
1.2.1. Consultation
• A consultation of all stakeholders concerned by water scarcity and drought issues was launched in early 2007. In this context the Commission organised widespread dissemination of information through its website1 and existing Working Groups set up under the Common Implementation Strategy for the Water Framework Directive (WFD), in order to actively involve all of the stakeholders interested in the process. The preliminary analysis, the technical document on water scarcity and the interim report of the in-depth assessment on water scarcity and droughts2 have also been uploaded on the Commission website.
• Following this request for active participation, the Commission examined all the registration forms returned and set up a Stakeholders' Forum. Particular attention has been paid to ensuring comprehensive representation of all interested parties (farmers, irrigators, electricity producers, industry, navigation, public water supply companies, environmental NGOs, other NGOs defending legitimate water uses, organisations of river basin authorities, regional governments, and all Member States).
A first meeting took place on 29 January 2007. Its main purpose was to explain the process and report on the progress made so far with the in-depth assessment. For this occasion, all stakeholders were invited to provide written contributions in order to improve the interim report on the in-depth assessment, and to propose possible orientations and measures for the next Communication by 28 February 2007.
A second meeting was held on 26 March 2007. Its primary objective was to inform stakeholders about the state of play in preparing the Communication and the improvements made to the in-depth assessment. Its second objective was to share all the contributions
1 http://ec.europa.eu/environment/water/quantity/scarcity_en.htm 2 First Interim Report on Water Scarcity and Droughts
http://ec.europa.eu/environment/water/quantity/pdf/comm_droughts/2006_11_1st_int_report.pdf

EN 4 EN
received so far and organise the discussion on this basis, in order to identify possible measures that could be further considered within the Communication.
The main outcomes of this consultation may be summarized as follows:
(1) Water savings and water efficiency must be a priority ahead of any planning of new water supply.
(2) The WFD already contains provisions which make it possible to address water scarcity and droughts. The case for adopting an additional legislative instrument therefore needs to be assessed in relation to these elements.
(3) Water pricing and application of cost recovery are key issues that need to be fully implemented. Metering is another essential factor in this regard.
(4) Local experience already proves that there is a large potential for water savings and efficiency in both urban and rural areas.
(5) Integration of water-related issues into sectoral policies is a key condition for successfully addressing water scarcity and droughts and ensuring a sustainable allocation of water at the appropriate level.
(6) There are strong synergies between water and energy issues.
(7) Agriculture is a large consumer of water. Adjustments via decoupling and cross-compliance would be welcome in the short term.
(8) As allocation of structural funds can lead to water imbalances, consideration could be given to further environmental requirements.
(9) Drought management plans are useful tools that have to be further promoted, in particular because of the increasing impacts anticipated in a context of climate change.
(10) Early warning systems at national and EU levels need to be developed and fully used for drought prevention.
(11) Water performance technologies can be widely and efficiently disseminated, as the results coming from local experience clearly prove.
(12) Public awareness is a key condition for any change of behaviour. Specific campaigns need to be promoted.
(13) Alternative solutions such as re-using waste water need to be further considered, with possible guidelines at EU level.
Most stakeholders supported these points. The exchanges which took place at the second meeting revealed that these issues were not controversial, but actually generated a broad consensus among a majority of stakeholders.
A third meeting was held on 24 May to review possible options. A broad consensus emerged from the meeting as to the need for an integrated approach which combines a strong emphasis
EN 5 EN
on demand management, economic instruments – including more effective water pricing - and leaves the door open for new water supply under certain conditions.
• An Expert Network on water scarcity and droughts, which includes representatives of national authorities and stakeholders, has also played an important part in the process. This working group is part of the Common Implementation Strategy of the Water Framework Directive – an informal structure set up in 2000 and led by the Commission which oversees the implementation of the Directive, and including all Member States and candidate countries as well as key stakeholders - and has worked since 2003 on water scarcity and drought issues. Its participants have directly contributed to the drawing up of the interim report on the in-depth assessment on water scarcity and droughts, via the collection and transmission of appropriate national data. Its participants have recently updated and refined the first set of data provided in 2006. On several occasions they have expressed their views on the options to be promoted in order to address water scarcity and droughts.
1.2.2. Expertise
• Concerns about water scarcity and droughts have emerged across Europe relatively recently. They have been the starting point of work at EU level to assess the scope and the impacts of these issues in detail. Member States have provided national data and the Commission has also looked at the information available at EU level. However, the outcomes of these common efforts have often proved insufficient to establish a definitive and comprehensive overview of the current situation. These data gaps will need to be addressed in the short term as a prerequisite for optimizing the selection of the most appropriate measures.
• The Communication on water scarcity and droughts should therefore be seen as a first step, based on the information available in this early stage of the process. The steps to further develop policies and measures to address water scarcity and drought issues will in any case require further thorough impact assessments. This assessment of the Communication on water scarcity and droughts will therefore be proportionate, based on the preliminary information and experience acquired so far.The next steps will have to go deeper into the collection of data and the quantitative assessment of some selected measures from the wide range of options proposed by the Communication.
• In order to fill the gaps identified so far, the Commission has decided to launch a study to quantify the potential for water saving across Europe. Further investigation is needed into the actual scope for progress in water demand management. The study will therefore assess all possibilities for action to deliver water savings within the EU. Economic, social and environmental impacts will be estimated, taking into account possible overlaps between options. This study will also further assess the impacts of some options noted for their relevance a priori, but where the quantification of impacts has so far been insufficient (e.g. water pricing policies, water allocation, drought management plans, improvement of technologies). Initial outcomes will be available by July 2007.
• Another study will then be carried out in order to consider regional disparities in water saving potential. The inclusion of several scenarios at river basin level and testing the cost effectiveness of several measures, e.g. in terms of land use planning and water allocation, will provide useful information for further discussion and consideration by the end of 2007.
EN 6 EN
• These two studies will deliver results in 2007 and make it possible to support the follow up of the Communication and set out possible next steps.
1.3. Terminology
Water scarcity and droughts are two different issues.
• Water scarcity describes a situation of long-term water imbalance, where water demand exceeds the level of water resources available. While such cases usually emerge in areas of low water availability or rainfall, they can also occur in regions which have high levels of water consumption due to high population density or significant volumes of water being used for agricultural or industrial activities.
• Moreover, water imbalances can lead to problems of water quality and create larger areas affected by water scarcity because the water there is unfit for consumption (whether or not these regions are directly affected by water quantity issues). Water scarcity is a human-driven phenomenon.
• Droughts are the expression of a temporary decrease in average water availability. The primary cause of the emergence of drought is usually rainfall deficiency. High air temperatures and evapo-transpiration rates may act in combination with a lack of rainfall. They can exacerbate the acuteness and duration of droughts. Droughts are related to seasons and occur mostly in spring and summer, although there are winter droughts too. Droughts are also linked to the effectiveness of precipitation, e.g. rainfall intensity and number of rainfall events. Ultimately, these events are a combination of natural factors which are extremely difficult to predict in some cases. However, their intensity can be compounded by anthropogenic activities, in particular water scarcity situations. In the same way, a water scarcity situation can be exacerbated by the occurrence of a drought.
1.4. Integration of the Impact Assessment Board's recommendations
On 5 June 2007 the Impact Assessment Board adopted an opinion on the draft version of the Impact Assessment of the Communication.
All the recommendations for improvements have been fully integrated into the impact assessment as outlined below:
(1) Need for clarification of the planned measures under each option and of their impacts
• The description of the measures has been refined in section 4 in order to provide a better overview of the changes attached to each given option. Option A includes all possible measures that can further support and facilitate the large-scale development of new water supplies. Option B has been renamed "Water pricing policies only" in order to fully reflect its detailed content and avoid any confusion with other economic instruments which need to be addressed within the integrated approach of Option C. Indeed, the objective of Option B is to reinforce the water pricing principles for water quantity issues covered by the Water Framework Directive.
• The measures attached to Option B have been maintained in Option C. The assessment of Option B indeed concludes that water pricing policies are usually not sufficient in

EN 7 EN
themselves to fully address water scarcity and droughts, but can prove effective if combined with complementary options. This is why the measures attached to Option B are logically also considered within the integrated approach of Option C.
• The social implications of the different options have been further developed. A more detailed assessment taking into account regional characteristics is due to be completed by the end of 2007.
(2) Need for a better analysis of the drivers and underlying causes of the problems identified
• The reasons why Member States have so far taken relatively few appropriate actions in order to address water scarcity and droughts are further developed in section 2.2.
• The additional information specifies that the measures taken at national and regional measures have usually given preference to new water supply infrastructures to satisfy immediate water needs for economic development and public water supply security, rather than developing approaches geared to water saving and water efficiency.
• Further information on the past and current use of regional and agricultural EU funds is also provided. The fact that Member States have not been able to make use of all the opportunities offered by EU funds to improve water demand management because of competing priorities is also explained in more detail. The side-effects associated with allocating EU funds to certain new water supply projects are also emphasised, including the risk of unsustainable situations developing at river basin level.
More details have been given about the sources of the information used to present the population forecasts.
(3) Need to clarify the case for EU intervention
• Section 2.5 has been refined in order to better explain the case for EU intervention. As highlighted in the opinion, the fact that only some Member States have taken action is not a sufficient justification for EU action.
• In particular, the text now emphasises the cross-border dimension of the issue which calls for coordinated EU action. Indeed, 70% of the EU territory is part of transboundary river basins. Further details are also given about the inter-relationships between upstream and downstream regions - often located in different countries - and the associated risks in a context of scarcer water. Lastly, the additional information explains why a consistent approach at European level is a precondition for ensuring sustainable and fair water use.
(4) Procedure and presentation
Section 7 has been redrafted so as to avoid any misunderstanding about the monitoring and evaluation issues.

EN 8 EN
2. WHAT PROBLEM IS THE COMMUNICATION EXPECTED TO ADDRESS?
2.1. What are the issues that may require action?
The main issues at stake are the increasing impacts of water scarcity and droughts across Europe in a context of climate change. These impacts call into question the sustainable availability of water in Europe from now on.
Water scarcity
The information available at EU level, provided by the EEA and based on EUROSTAT data, gives an overview of the problem3. The Water Exploitation Index (WEI) is the mean annual total demand for freshwater divided by long-term average freshwater resources.
Water Exploitation Index (WEI) from 1992 to 2003
0,0% 10,0% 20,0% 30,0% 40,0% 50,0% 60,0%
LatviaEstonia
LithuaniaSloveniaHungarySlovakiaSwedenFinlandAustria
LuxembourgNetherlands
United KingdomPolandFrance
GermanyCzech Republic
GreeceBelgium
RomaniaBulgariaPortugal
ItalySpainMalta
Cyprus
Water Exploitation Index (%)
WEI - Energy WEI
This Index illustrates the extent to which total water demand puts pressure on the water resource. It points out the countries where water demand outstrips resources.
However, this Index is a national value and does not reflect the possible high regional pressures on water resources.
An analysis at river basin level is therefore required in order to gain a more accurate picture of the water scarcity situation. The information provided so far by Member States has made it possible to identify 33 river basins affected by water scarcity4. They have been considered as water scarce whenever their water exploitation index was above 10% or where identified as such on basis of an expert assessment. They currently represent a total area of 460 000 km² (about 10% of the total EU area) and host a total population of 82 million (about 16.5% of the total EU population).
3 EEA, 2005 the European environment, status and outlook 4 Second interim report on water scarcity and droughts, April 2007

EN 9 EN
River Basin Water Exploitation Index
0 10 20 30 40 50 60 70 80 90 100 110 120 130 140 150 160 170 180
SK_Hornad
SK_Hron
PT_Minho
GE_Ems
PT_Douro
GE_Donau
UK_Humber and Northumbria
PT_Guadiana
UK_Anglian
HU_Tisza
PT_Tagus
UK_North West
FR_Seine Normandie
SK_Poprad a Dunajec
PT_Vouga
GE_Weser
UK_South East
PT_Ave
SP_Guadiana
FR_Rhin Meuse
PT_Algarve Basins
PT_Western Basins
PT_Sado
Most of the affected river basins are located in southern Europe. These tend to be dry and irrigation-intensive. However, northern and eastern countries are also affected by water scarcity – they include the United Kingdom (the South East and the Thames river basin), Belgium, Netherlands, Denmark and Slovakia. Most of these river basins have high population densities around urban centres.
It is becoming increasingly clear that water scarcity is having significant impacts on the main sectors of the economy and on natural resources. These impacts are expected to increase in a context of climate change (see point 3.3).
Droughts
The observation of all drought events that occurred in the last 30 years throughout the EU provides us with some preliminary knowledge about their intensity and frequency5. The
5 idem
EN 10 EN
characteristics of these droughts have varied significantly from one region to another, in particular as regards their extent, duration, season and severity.
Cyprus, France, Italy, Portugal and Spain have registered the highest frequency of droughts from 1976 to the present, with between 8 and 21 events per country.
While the southern countries were the ones mainly affected by droughts in the eighties, the last five years have shown that all EU countries can be confronted by drought issues. Most Member States have reported drought events which have taken place since 1976. Peaks in both population and area affected by droughts have been noticeable in 1976, 1989 to 1991 and 2003 to 2005. Compilations of national data clearly show that the total area and total population affected by droughts doubled from 1976-1990 to 1991-2006 – representing 6% per annum of the total EU area and population in 1976-1990 and 13% in 1991-2006. From 2000 to 2006, an average of 15% of the EU total area and an average of 17% of the EU total population were affected by droughts.
The pattern of droughts over time and their extent across Europe, from northern to southern regions, reveals that all of the European territory may potentially be faced with such events.
Recent droughts have undoubtedly resulted in increasing and significant impacts on the economy and on natural resources. As an illustration, the overall impacts on the economy due to the 2003 drought have been estimated at a minimum of €8.7 billion (for more details see point 3.3), measured as the estimated losses directly resulting from the drought.
Climate change is a key driver, which is expected to affect the spatial and temporal distribution of air temperature and precipitation in Europe. The variability is expected to increase, leading to a higher probability of extreme events such as droughts or floods. According to the Intergovernmental Panel on Climate Change, climate change at the global scale will bring water scarcity to between 1.1 and 3.2 billion people, as temperatures rise by 2 to 3°C (see section 3.4). Europe will not escape, and there will be very significant impacts on water availability in many parts of Europe. In this context, and in the absence of a clear global mitigation strategy, this trend is likely to continue and even worsen.
Structurally, the challenge of water scarcity and drought is very closeto the energy challenge which the Commission decided to address by adopting a comprehensive package of measures on 10 January 2007. The approach taken on energy resembles the approach needed for water scarcity and droughts, as managing the limited stock of freshwater resources can be considered to be similar to managing fossil energy resources.
2.2. What are the underlying drivers of the problems?
• Even though freshwater resources are widely available in Europe, their spatial and temporal distribution leads to water scarce areas and periodic drought situations as mentioned below. Expressed in terms of exploitable resource per capita, Malta and Cyprus are the "water poor" countries of Europe, having the lowest available resources of the EU (less than 100 m³/cap/year), followed by Spain, France and Italy (less than 200 m³/cap/year).
However, additional issues need to be highlighted too, as they contribute significantly to increasing impacts.
EN 11 EN
• Water pricing policies generally do not reflect the level of sensitivity of water resources at local level. The 'user pays' principle is hardly implemented. These gaps lead to mismanagement of water resources, even though the Water Framework Directive provides the principles to set up effective economic instruments.
• Land use planning is also one of the main drivers of water use. Inadequate water allocation between economic sectors results in imbalances between water needs and existing water resources.
• As regards water abstraction, the analysis of the main water uses in the affected river basins reveals that agriculture is the major user (with 64%), followed by energy (20%), public water supply (12%) and industry (4%)6. Tourism is likely to put strong pressure on water abstraction. However, it remains one of the sectors where it is difficult to estimate the associated water uses because these are always included in public water supply data and seldom quoted separately.
• Even if no overall estimates of water used by tourism are available, one can say that seasonal demand from tourism exerts significant pressure, particularly in Southern Europe and in coastal areas where freshwater resources are limited. The use of water by tourists is nearly twice as high as for local consumers, notably due to the large volumes of water consumed for leisure activities. In addition, the fact that the pressure from tourism and irrigation often occurs in the period of minimum or low water resource renewal exacerbates the impact on the environment.
• When it comes to water consumption, agriculture is the major consumer. Out of every cubic metre used for irrigation, on average 0.8 m³ is either absorbed by crops or evaporates from fields, and only 0.2 m³ returns to where the water was abstracted.
• Across Europe there is huge potential for water saving. Europe continues to waste at least 20%7 of its water due to inefficiency, i.e. through losses in public water supply and irrigation networks, inadequate water appliances in households, inefficient water practices in industry, etc.
• In the Mediterranean, the water saving potential represents 45% (123 km³/year) of the 2025 demand (330 km³/year) and is significantly larger than the expected increase in demand over the same period (+50km³/year). By way of illustration, for Northern Mediterranean countries the largest potential (12 km³/year) is in the irrigation sector (60%), followed by the industrial (25%) and domestic (15%) sectors8. The measures that would lead to these water savings consist primarily in increasing the efficiency of water networks in irrigation (transport losses reduced to 10%, efficiency raised to 80%) and public water supply (loss reduced to 15%,
6 idem 7 See Annex 1 for more information on the EU sectoral water saving potential, Ecologic, June 2007 8 Plan Bleu, 2007
EN 12 EN
user leaks reduced to 10%) and improving the use of water for industrial purposes (recycling generalized at 50%).
• In general terms, there is a lack of consistency in, and sometimes even counter-productive effects on water resource protection, due to insufficient integration of water-related concerns into water-relevant sectoral policies.
• As regards drought events, they have often been resolved by a crisis management approach dictated by a lack of timely preparedness for extreme events. Economic and social demands, as well as environmental needs, are not systematically addressed. Ad hoc short-term measures are implemented to compensate for the lack of water resources for one or two types of uses, but do not take full account of other concerns (water quality, irrigation, energy production, etc.) or the impacts of climate change.
• Finally, while some data are already available at EU and national levels, existing assessment and monitoring programmes are neither integrated nor complete. Data need to be harmonized and comparable if a comprehensive overview of the issues is to be provided at European level.
• Some Member States have taken initial measures to address water scarcity and droughts at national or regional level. These measures are very diverse across Europe as they usually depend on the scale of the issues within each country and on the level of awareness of the short-term and long-term impacts. It has been difficult to set up large-scale programmes for water saving and water efficiency at national or even regional level. They have often emerged from isolated and uncoordinated initiatives launched by local municipalities or river basin authorities. Until now, most of the national authorities have made water quality issues their priority, rather than water quantity issues.
• Apart from localised efforts to improve water demand management, a majority of Member States tend to give precedence to developing new water supplies in order to secure public water supply and satisfy new economic needs for water in the short term. While some projects for new water supply have proved sustainable, others are more questionable in terms of overall estimated costs and benefits.
• Some past and current uses of regional and agricultural EU funds have tended to support new water supply infrastructures without properly ensuring their sustainability and checking that minimum water management practices were being fully observed. In the past, funding for new reservoirs or desalination units have been allocated to local areas where huge amounts of water continued to be wasted and no appropriate water pricing policy had been put in place. In addition, only a limited proportion of EU funds has so far been used to develop and support further water demand management measures. This situation is due to the fact that Member States have preferred to prioritise water quality issues (point source and diffuse pollutions) and developing new water supply to satisfy the immediate economic development needs.
EN 13 EN
2.3. Who is affected, in what ways and to what extent?
Water scarcity
Water scarcity situations encountered at river basin level have already had noticeable impacts on economy, society and environment, with consequent effects on costs.
• As regards economic impacts, the main sectors affected are:
• - Public water supply and side-effects on tourism,
• - Energy production: income losses,
• - Agriculture: income losses due to deeper pumping or greater uncertainty about yields.
• Social impacts can be created by the possible increase of water prices due to the implementation of compensating measures (e.g. desalination units).
• The environmental impacts concern groundwater (with possible aquifer depletion due to over-pumping and seawater intrusion), surface waters (with minimum water flows not always being ensured and increased concentrations of pollutants due to less dilution) and wetlands, as well as impacts on soils through erosion and desertification.
The costs of some of these impacts can be assessed by looking at the costs of the mitigation measures being taken, such as the construction of new water supply infrastructures – namely dams, reservoirs, desalination units, water transfers, etc. However, as these facilities can have a range of different objectives, it is difficult to assess exactly what proportion of the investments is directly due to water scarcity.
Investments in infrastructures have a cost, which is borne by various parties. Economic sectors, public authorities and local population have to bear additional costs in proportions that vary from one river basin to another. National estimates give an indication of the total amount of investments involved.
In addition, there are costs to society due to environmental and social impacts, although these may be more difficult to estimate.
Whatever the type of impacts, it is clear that many data are lacking at EU, national and river basin levels. It is therefore difficult to estimate the costs incurred by the entire EU to tackle water scarcity.
Droughts
Droughts may have immediate and significant economic, social and environmental impacts. These impacts can also last beyond the end of the drought event.
• As regards economic activities, the first and most noticeable impacts concern the public water supply. National, regional or local restrictions on all water use or specific water uses can be put in place and usually result in a loss of income in
EN 14 EN
some industrial or energy sectors and agriculture. Some activities are obliged to halt production during sensitive periods.
• As regards social impacts, emergency measures can be organised in order to provide population with alternative water supplies (e.g. water tanks). This results in additional costs, which are usually borne by public authorities, and has a potentially distressing impact on the more vulnerable groups of citizens (e.g. the elderly).
• Droughts often have particularly harmful impacts on the environment. The first warning signals are sharp decreases in river flows and falling levels of groundwater aquifers. They can result in additional effects, namely sea water intrusion, eutrophication and wetland desiccation. Severe water shortages, even if they are only limited in time, can lead to biodiversity degradation. Fish populations can be critically affected by droughts, suffering exceptional high rates of mortality.
• Droughts can also be exacerbated by heat waves and be one of the factors responsible for serious forest fires in summer. In recent years, large areas of forest have been destroyed by fires and this has led to increased soil erosion and deficiency in water retention. On the other hand, it should be pointed out that there are some forests, such as mismanaged eucalyptus forests, which do not appropriately ensure the preservation of biodiversity and sustainable water management.
The compilation and extrapolation of the quantitative data provided by Member States has made it possible to estimate the direct economic impact of drought events in the past thirty years at a minimum of € 100 billion9, and even this figure is an underestimate of the overall impact on the economy, as explained above. A look at the impact of drought events over this period shows that the situation is steadily worsening. The annual impact due to droughts is estimated to have doubled between 1976-1990 and 1991-2006. It reached an annual average of € 6.2 billion from 2001 to 200610. There is a strong expectation that this impact will carry on increasing, as more confirmation of the impact of climate change is obtained.
2.4. How would the problem evolve, all things being equal (no policy change)?
2.4.1. Demography and economic development
Population
9 First interim report on water scarcity and droughts, DG ENV, November 2006: MS provided the
economic costs (on public water supply, industry, energy, agriculture, transport) due to droughts in the last thirty years. Costs on public water supply made it possible to estimate an average cost per inhabitant living in an area affected by drought. Costs on agriculture made it possible to estimate an average cost per hectare of land located in an area affected by drought. The application of these unit costs to areas where no data where available, allowed to getting an overall estimation of the impacts of droughts in the last thirty years.
10 First interim report on water scarcity and droughts, DG ENV, November 2006

EN 15 EN
Trends in population can be derived from the United Nations "medium" scenario, which is described in a time series of population by world region with five-year steps between the present and 2075 (United Nations, 1992; Alcamo et al., 1998).
Under this scenario, Europe's population would increase from 745 million in 1995 to 882 million in 2075.
The following table summarizes the regional population figures estimated using this scenario.
Population distribution within countries is based on data from Gridded Population of the World (version 1) provided by the Center for International Earth Science Information Network (CIESIN).
Total population [millions] in Europe
World-region(*) 1995 2025 2050 2075
Western Europe 384 406 394 391
Eastern Europe 121 143 149 149
European CIS 180 193 186 185
(*) World-regions are here defined as follows: Western Europe: Belgium, Denmark, France, Finland, Germany, Greece, Iceland, Ireland, Italy, Malta, Luxembourg, Netherlands, Norway, Portugal, Spain, Sweden, Switzerland, United Kingdom Eastern Europe: Albania, Bosnia and Herzegovina, Bulgaria, Croatia, Czech Republic, Hungary, Poland, Romania, Slovakia, Slovenia, Yugoslavia European CIS: Belarus, Estonia, Latvia, Lithuania, Moldova, Ukraine, European part of Russian Federation
– Water withdrawals
The current scenario, developed by the EuroWasser project, stresses that by the 2020s small increases in total withdrawals will be seen in some parts of Western Europe (Ireland, France, United Kingdom). These increases result from assumed increases in population in these countries, which lead to increased demands in the domestic sector. Industrial withdrawals are predicted to decrease and withdrawals for irrigation are predicted to remain stable.
In Eastern Europe, the scenario predicts large increases in water withdrawals as a consequence of large increases in demand for water in both the domestic and industrial sectors. Abstractions for industrial purposes, in particular, are likely to rise sharply based on an assumption of large increases in electricity production.
In total, water withdrawals in Europe are projected to rise from the current level of 415 km³ to about 660 km³ per year by the 2070s.
The table below illustrates this development by sector.
Water withdrawals [km3/yr] in Europe by sector today (1995) and in the 2070s
Withdrawals today (1995) Withdrawals in the 2070s World-region
Domestic Industrial Irrigation Total Domestic Industrial Irrigation Total
Western Europe 41 118 76 235 48 69 74 191
EN 16 EN
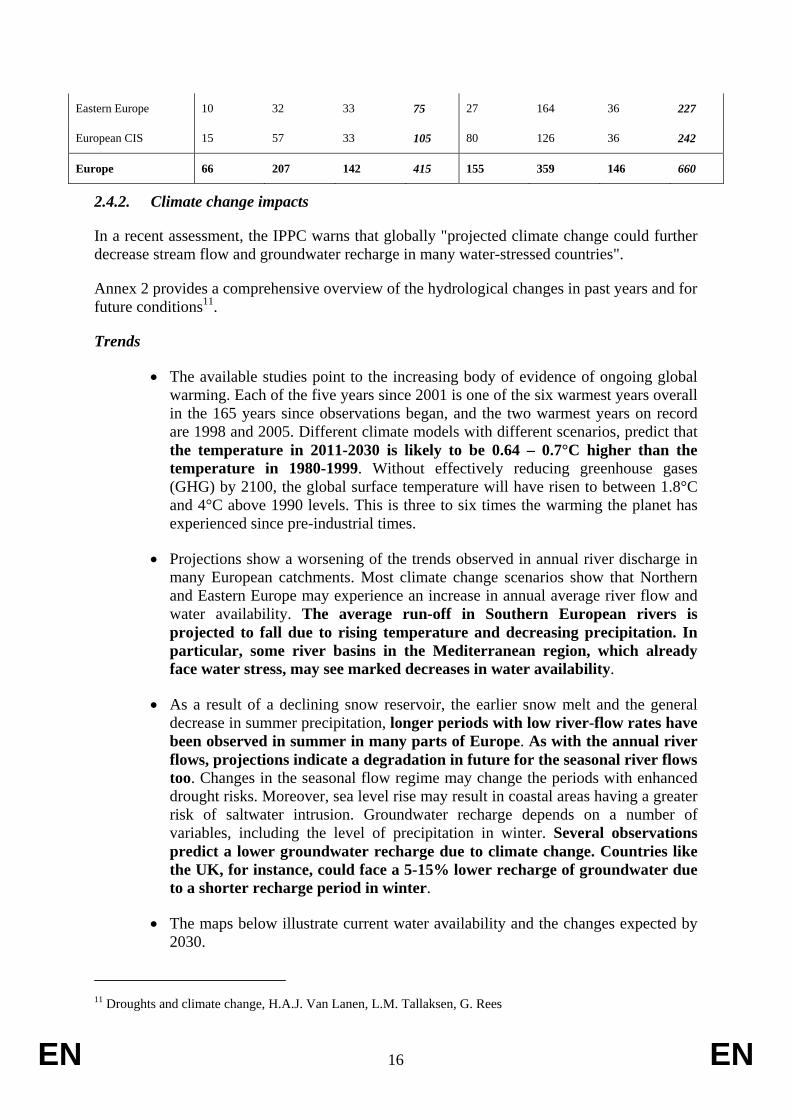
Eastern Europe 10 32 33 75 27 164 36 227
European CIS 15 57 33 105 80 126 36 242
Europe 66 207 142 415 155 359 146 660
2.4.2. Climate change impacts
In a recent assessment, the IPPC warns that globally "projected climate change could further decrease stream flow and groundwater recharge in many water-stressed countries".
Annex 2 provides a comprehensive overview of the hydrological changes in past years and for future conditions11.
Trends
• The available studies point to the increasing body of evidence of ongoing global warming. Each of the five years since 2001 is one of the six warmest years overall in the 165 years since observations began, and the two warmest years on record are 1998 and 2005. Different climate models with different scenarios, predict that the temperature in 2011-2030 is likely to be 0.64 – 0.7°C higher than the temperature in 1980-1999. Without effectively reducing greenhouse gases (GHG) by 2100, the global surface temperature will have risen to between 1.8°C and 4°C above 1990 levels. This is three to six times the warming the planet has experienced since pre-industrial times.
• Projections show a worsening of the trends observed in annual river discharge in many European catchments. Most climate change scenarios show that Northern and Eastern Europe may experience an increase in annual average river flow and water availability. The average run-off in Southern European rivers is projected to fall due to rising temperature and decreasing precipitation. In particular, some river basins in the Mediterranean region, which already face water stress, may see marked decreases in water availability.
• As a result of a declining snow reservoir, the earlier snow melt and the general decrease in summer precipitation, longer periods with low river-flow rates have been observed in summer in many parts of Europe. As with the annual river flows, projections indicate a degradation in future for the seasonal river flows too. Changes in the seasonal flow regime may change the periods with enhanced drought risks. Moreover, sea level rise may result in coastal areas having a greater risk of saltwater intrusion. Groundwater recharge depends on a number of variables, including the level of precipitation in winter. Several observations predict a lower groundwater recharge due to climate change. Countries like the UK, for instance, could face a 5-15% lower recharge of groundwater due to a shorter recharge period in winter.
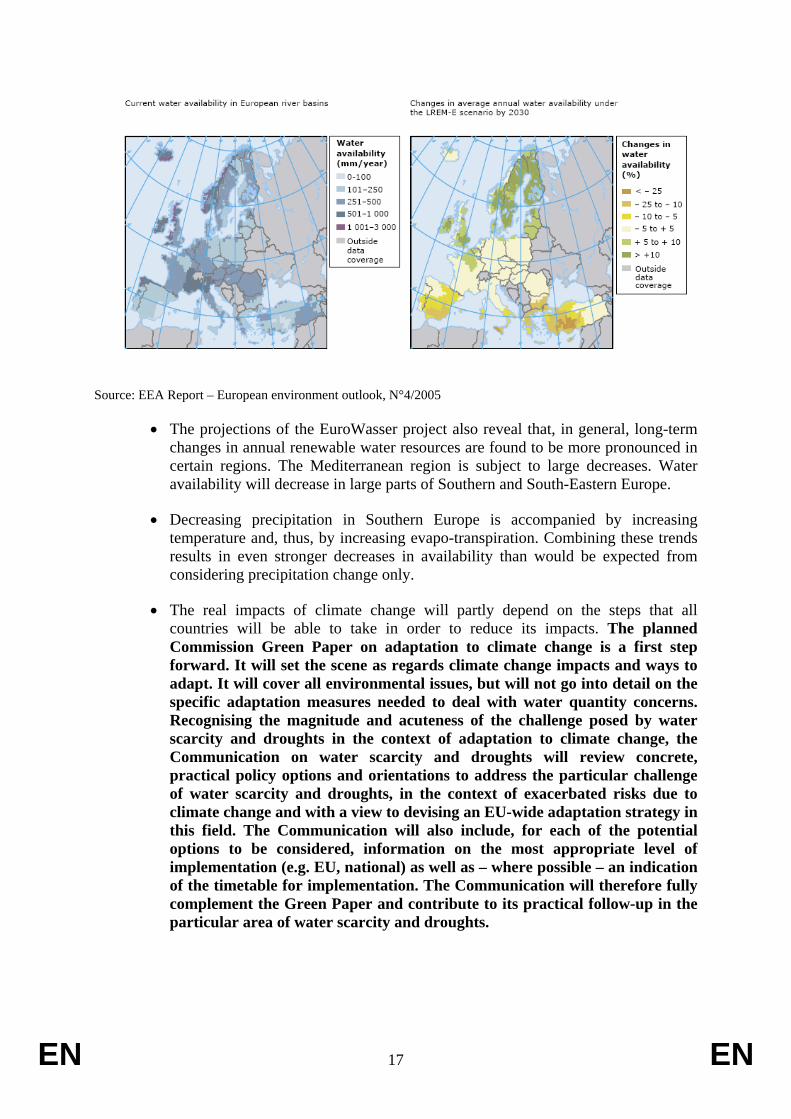
• The maps below illustrate current water availability and the changes expected by 2030.
11 Droughts and climate change, H.A.J. Van Lanen, L.M. Tallaksen, G. Rees
EN 17 EN
Source: EEA Report – European environment outlook, N°4/2005
• The projections of the EuroWasser project also reveal that, in general, long-term changes in annual renewable water resources are found to be more pronounced in certain regions. The Mediterranean region is subject to large decreases. Water availability will decrease in large parts of Southern and South-Eastern Europe.
• Decreasing precipitation in Southern Europe is accompanied by increasing temperature and, thus, by increasing evapo-transpiration. Combining these trends results in even stronger decreases in availability than would be expected from considering precipitation change only.
• The real impacts of climate change will partly depend on the steps that all countries will be able to take in order to reduce its impacts. The planned Commission Green Paper on adaptation to climate change is a first step forward. It will set the scene as regards climate change impacts and ways to adapt. It will cover all environmental issues, but will not go into detail on the specific adaptation measures needed to deal with water quantity concerns. Recognising the magnitude and acuteness of the challenge posed by water scarcity and droughts in the context of adaptation to climate change, the Communication on water scarcity and droughts will review concrete, practical policy options and orientations to address the particular challenge of water scarcity and droughts, in the context of exacerbated risks due to climate change and with a view to devising an EU-wide adaptation strategy in this field. The Communication will also include, for each of the potential options to be considered, information on the most appropriate level of implementation (e.g. EU, national) as well as – where possible – an indication of the timetable for implementation. The Communication will therefore fully complement the Green Paper and contribute to its practical follow-up in the particular area of water scarcity and droughts.

EN 18 EN
2.4.3. Combination of development and climate change impacts
The effects of changing water availability due to climate change and changing water withdrawals due to demographic and economic developments need to be considered together.
In total, the proportion of European river basin areas in the severe water stress category is likely to increase from 19% today to 34-36% by the 2070s. Most river basins currently identified as experiencing high levels of water stress remain in the highest stress category under the scenario projections. Additionally, many Eastern European river basins are moved up into the highest water stress category.
The assessment confirms that the impacts of economic and social development on water resources may be of the same order of magnitude as changes in water availability due to climate change.
The consolidation of the results for water stress and drought frequencies shows that the South-Eastern countries might be the area with the greatest increase in pressure on its water resources in the coming decades. Large areas fall within the "critical region" definition in terms of both water stress and drought frequencies, accounting in all for about a quarter of Europe's land area.
Critical regions exhibiting (i) a decrease in the return period of the current 100-year drought to 50 years or less and (ii) a 10% increase in today’s water stress which leads to a future w.t.a. ratio greater than 0.4. Calculated with WaterGAP 2.1 applying the HadCM3 climate model and Baseline-A water use scenario for the 2070s
Lastly, the outcomes of the above scenario reveal that a major part of Europe will suffer severe impacts from water scarcity in the coming decades as a result of either increased water

EN 19 EN
demand for economic development or decreased water supply due to climate change or even a combination of both.
2.4.4. Existing EU legislation and instruments
The Water Framework Directive The Water Framework Directive (WFD)12 provides the general framework for water management in Europe. Although the WFD is not primarily designed to tackle quantitative issues, it gives Member States sufficient flexibility to address quantitative issues.
• One interesting aspect in relation to addressing water scarcity and droughts is that, according to the WFD, Member States are required to have water pricing policies in place by 2010 with adequate incentives to use water efficiently.
• Moreover, Member States have to ensure that groundwater and surface water bodies achieve "good status" – i.e. good ecological and chemical health - by 2015. Sustainable water abstraction regimes have to be supported in situations of water stress or shortage. Additional constraints linked to the integration of specific quantitative measures can be taken into account when establishing the environmental objectives of the water bodies. The WFD also includes provisions relating to prolonged droughts and exemptions.
• In addition, when and where needed, Member States can draw up specific drought management (sub-)plans as a supplement to the River Basin Management Plans (RBMPs) – which are the main implementation milestone for achieving the Directive's objectives at the level of each river basin.
• RBMPs, which are due by December 2009, will bring further improvements for the whole water system in the form of a programme of measures which must be operational by 2012 and must deliver the environmental objectives by 2015.
• The Communication from the Commission entitled 'Towards sustainable water management in the European Union' identifies initial positive outcomes emerging from the first steps in implementing the WFD.
Reports from the Member States on their initial obligations under the WFD show some encouraging results. They have already made significant steps towards sustainable water management. Most of them have deployed considerable efforts to develop an initial analysis of the state of river basins, producing a large information base which did not previously exist at EU level.
• Together with the water-related directives which are still under negotiation, the WFD provides all the tools needed to achieve truly sustainable water management. However, implementing these tools in the most effective way remains a challenge. In particular, Member States still need to make
12 Directive 2000/60/EC of the European Parliament and of the Council of 23 October 2000 establishing a
framework for Community action in the field of water policy

EN 20 EN
progress in implementing the water pricing and cost recovery provisions of the WFD13.
• The timetable for implementing the WFD makes it impossible to draw definitive conclusions at this stage on whether further action is needed, as River Basin Management Plans and their associated programmes of measures will not be adopted until the end of 2009. Only then will it be possible to draw such conclusions. Pre-empting river basin management plans and associated programmes of measures would be counter-productive.
– The sectoral policies
Agriculture
• The 2003 reform of the Common Agricultural Policy introduced decoupled payments to farmers, suppressing the link between a given production and the amount of subsidies received. This measure was aimed at encouraging farmers to produce according to market demand and ahs been an important step to sustainable management of resources.
• The reform also introduced cross-compliance, which proved to be an efficient way of enforcing existing directives at farm level.
• Finally, the rural development programmes funded by the European Agricultural Fund for Rural Development14 (EAFRD) offer the possibility of supporting improved water demand management practices through appropriate measures to be adopted within axes 1 (support to improve competitiveness) and 2 (improve environment and countryside). Specific support has been foreseen for measures under the WFD.
However:
• Under the partial decoupling option which some Member States have retained, CAP subsidies still provide a measure of incentive for crops including water consuming crops with high risks of water resource over-exploitation.
• The existing framework for cross-compliance does not address water quantity issues.
• The budget allocated to rural development is not yet sufficient to properly address water quantity issues.
• Member States today tackle a wide range of issues by using EU funds. They establish national and/or regional priorities and allocate funds according to these
13 Communication from the Commission to the European Parliament and the Council – Towards
sustainable water management in the European Union – First stage in the implementation of the Water Framework Directive, COM (2007) 128 final - 22 March 2007
14 Council Regulation (EC) 1698/2005 of 20 September 2005 on support for rural development by the European Agricultural Fund for Rural Development (EAFRD)
EN 21 EN
priorities. Water quantity concerns are often just one of many issues. Member States usually place priority on fully addressing water quality issues (point source and diffuse pollution) before considering water quantity issues.
Regional policy
• Here, the overall framework also provides an opportunity to address water scarcity and drought issues. It is based mainly on the European Regional Development Fund15 (ERDF), the Cohesion Fund16 (CF) and the European Social Fund17 (SF). Lessons can be learned from the analysis of the ERDF programmes from 2000 to 2006.
However:
• As for rural development programmes, owing to the wide range of issues that the regional funds are called upon to tackle, the programmes linked to regional policy have seldom contained measures specifically designed to address the growing impacts of water scarcity and droughts. Some of the measures adopted at national level have had adverse effects by supporting the development of new water supply infrastructures without a clear compliance with environmental requirements relating to water demand management as a prerequisite for funding. Phenomena similar to those mentioned under rural development can be expected.
2.4.5. Conclusions All things being equal, the problem is likely to evolve as follows:
• Maintenance of widespread inappropriate land planning throughout some of the most water scarce or water stressed river basins; impacts being exacerbated by the part of the CAP payments still coupled for arable crops and by a lack of strict implementation and insufficient coverage of cross-compliance.
• Continuing waste of water and significant water inefficiency in households and many economic sectors.
• Incentives provided for the further development of new water supply without giving priority to water savings and water efficiency.
• Persistence of the existing gaps in the integration of water quantity issues in agricultural and regional policies, thereby leading to the development of new water supply with no guarantee of sustainable water use in water scarce or water stressed river basins.
• Continued inconsistencies in data on the scope and impacts of water scarcity and droughts.
15 Regulation (EC) 1080/2006 of the European Parliament and of the Council of 5 July 2006 on the
European Regional Development Fund 16 Council Regulation (EC) 1084/2006 of 11 July 2006 establishing a Cohesion Fund 17 Regulation N°1081/2006 of the European Parliament and of the Council of 5 July 2006 on the European
Social Fund

EN 22 EN
2.5. Does the EU have the right to act?
• The current situation regarding water scarcity and droughts is characterised by large variations across Europe. These can be explained by climatic conditions, available natural water resources, water use by economic sector, but also by efforts undertaken in several Member States to reduce the need for water. However, as set out above, the in-depth assessment carried out so far clearly highlights the growing concern on the part of all Member States about water scarcity and droughts, whatever their geographical position. Although it is usually southern countries that have been affected by these issues, northern countries are no longer spared.
• The effects of climate change in Europe are already significant and measurable. Drought frequencies react sensitively to changes in both climate and water use. Scenarios generally predict a change in drought frequencies for almost all regions of Europe18. The outcomes of scenarios for the next 70 years show that the direct anthropogenic influence on future droughts through water consumption will be of the same order of magnitude as the simulated impact of climate change. In particular, the supposed big increases in water use for eastern countries due to increased economic activity may cause or intensify severe drought events in these areas in the future.
Change in magnitude of 100-year droughts
Left map: Comparison of results calculated with WaterGAP 2.1 for today’s climate and water use (1961-90) and for the 2070s (HadCM3 climate model and Baseline-A water use scenario)
Right map: Comparison of results calculated with WaterGAP 2.1 for today’s climate and water use (1961-90) and for the 2070s (Baseline-A water use scenario at today’s climate)
The comparison of both maps indicates that the worsening in 100-year drought severity amongst western countries is primarily due to climate change. For eastern Europe, the change
18 EuroWasser: Europe's droughts today and in the future, 2007

EN 23 EN
in water use plays an important role for the future low flow regimes. The superimposed climate changes make the situation worse in southern regions.
The findings from this research confirm that water scarcity and droughts are becoming a European concern, with significant current and/or future impacts in all countries.
• The Green Paper from the Commission on 'Adapting to climate change in Europe – options for EU action'19 points out that there are clear benefits in approaching adaptation in an integrated, coordinated manner at EU level. Whilst a "one-size-fits-all" approach to adaptation is clearly not appropriate, climate change will nevertheless impact everywhere and those impacts will not follow administrative boundaries. Furthermore, certain sectors are largely integrated at EU level through the single market and common policies ant it makes sense to integrate adaptation goals directly into them. The Green Paper also stresses that adaptation is clearly a question of political coherence, forward planning and consistent and coordinated action. These latest points fully apply to the issues of water scarcity and droughts.
• Water scarcity and droughts are a transboundary issue requiring a coordinated EU approach. Water resources management, which includes the sustainable use of resources through a water demand management approach, is by nature trans-national. In particular, 70% of EU territory is part of transboundary river basins. This situation means that any action taken upstream of a river basin in a given country will have direct impacts downstream of the river basin in other countries. The absence of a coherent approach across Europe could lead to increasing conflicts between countries or regions in a context of scarcer water. Upstream regions could be tempted to carry on their economic development and increase abstractions from water resources regardless of the downstream context, leaving downstream regions with serious problems of water shortage. This scenario will be avoided only if a consistent approach can be promoted at European level in order to ensure sustainable and fair water use.
• Some Member States have already adopted measures to reduce the impacts of water scarcity and droughts by improving water demand management. Others have not taken yet such action. Increasingly this is creating a situation where river basins could be affected by water scarcity and droughts, with no consideration being given to prior prevention and adaptation measures.
• In the absence of any Community action, this trend towards mismanagement in Member States is highly likely to compound the inconsistency in the level of protection of the environment, which would run counter to one of the fundamental objectives of the Treaty.
• By reducing and managing the risks to economic activities, the environment and human health, the proposals for addressing the challenges of water scarcity and drought will help in pursuing the objectives of Community policy on the environment in accordance with Article 174 of the Treaty:
19 Green Paper from the Commission to the Council and the European Parliament – 29 June 2007,
COM(2007) 354 final
EN 24 EN
– Preserving, protecting and improving the quality of the environment,
– Protecting human health,
– Prudent and rational utilisation of natural resources,
– Promoting measures at international level to deal with regional or worldwide environmental problems.
• However, not all the answers can be given at EU level. The implementation of the existing EU policy framework and of new action that may be identified, and the definition of the national programmes, including those for the Regional and rural development policies, are the responsibility of the Member States.
• Moreover, the Impact Assessment demonstrates that a number of actions at EU and national levels are necessary and complementary for addressing the challenges of water scarcity and droughts in a comprehensive manner. A wide range of policy options therefore need to be considered.
• Many of the proposed actions need a mobilisation effort or a push from the EU level, either through regulatory action, by concluding voluntary agreements with different sectors or by exchanging good practices. Such complementary measures will empower the different levels of policy-makers and decision-makers to progress towards efficient water resources management.
3. OBJECTIVES
3.1. Policy objectives The proposal pursues the following general policy objectives:
• Address the increasing impacts of water scarcity and droughts in the European Union
• Ensure the long-term protection of available water resources
• Ensure sustainable water availability across Europe and promote sustainable water uses
The specific objectives are:
• Enhance preparedness for increasing droughts
• Mitigate all impacts of water scarcity and droughts on the environment, economy and society
• Create the conditions for sustainable economic and social development across Europe in a context of climate change and increasing water scarcity and droughts
The operational objectives include:
EN 25 EN
• Identify the most appropriate and cost-effective measures in order to efficiently address water scarcity and drought issues
• Consider possible priorities or a hierarchy to guide policy-making in the light of water availability at river basin level.
3.2. Consistency with the horizontal objectives of the European Union
3.2.1. Growth and Job strategy
The policy objectives are in line with the three pillars of the European Union's renewed Lisbon Strategy on Growth and Jobs, namely "making Europe a more attractive place to invest and work", "knowledge and innovation for growth" and "creating more and better jobs".
Efforts to better address water scarcity and droughts will first allow the appropriate development of economic activities by securing water resources. Then, it will encourage the development and application of new environmental technologies. The policy objectives therefore promote innovation and technological development, enabling the water sector to progress towards global leadership in the field of water efficient technologies. This outlook should, in the short term, pave the way for exports of technologies to emerging markets where water is scarce and which have set water efficiency targets.
By promoting further advances in technologies, the strategy will promote highly skilled jobs in Europe for research and development into new technologies.
3.2.2. Sustainable Development strategy
One objective of the RSDS is "to improve management and avoid overexploitation of natural resources, recognising the value of ecosystem services". Some of the related operational objectives are "to improve management and avoid overexploitation of renewable natural resources such as water" and "to avoid the generation of waste and enhance efficient use of natural resources by promoting re-use".
The objectives detailed in part 3.1 are in line with the RSDS in that they contribute to more sustainable water management practices and tackle the wastage of water.
Another objective of the Renewed Sustainable Development Strategy (RSDS) of the European Union is "to limit climate change and its costs and negative effects to society and the environment". The related operational objective is "to integrate adaptation to and mitigation of climate change in all relevant European policies".
It is obvious that progressing towards effective prevention and mitigation of water scarcity and droughts will directly contribute to meeting the urgent need of adapting to climate change.
4. WHAT ARE THE MAIN POLICY OPTIONS AVAILABLE TO ACHIEVE THE OBJECTIVES? Section 2.4 fully described the characteristics of a 'no policy change scenario'. The following paragraphs therefore focus on the three options previously identified.

EN 26 EN
4.1. Option A: 'Water supply only' option This option consists in addressing water scarcity and droughts by providing new water supply wherever and whenever needed. Any new water supply made available then aims to satisfy all needs for the public, economic activities and the environment.
The building up of any new water supply must comply with EU legislation, in particular with the Environmental Impact Assessment Directive, the Strategic Environment Assessment Directive and the Water Framework Directive (WFD).
Article 4(7) of the WFD allows the development of new water infrastructure, even if that infrastructure prevents the achievement of "good status". However, this provision comes with a number of strict conditions, including:
• Conditions for mitigation measures;
• Proof that there are no better alternative options in environmental terms;
• The condition that the project must either be of “overriding public interest”, or the provision of benefits to human health and safety (e.g. flood control) or sustainable development must outweigh the benefits of achieving the environmental objectives. Furthermore, Articles 4(8) and 4(9) are mandatory conditions for these derogations to apply.
The implications of the WFD for existing infrastructures depend on whether or not the water body is classified as heavily modified, fulfilling the criteria of Article 4(3) and meeting those of Articles 4(8) and 4(9). In other cases, dam sites may be subject to extensive mitigation measures in order to reach "good ecological potential", in particular as regards minimum flow regimes, aquatic fauna migration and sediment management. In addition, the fact that these water bodies also need to achieve "good chemical status" must be taken into account.
Under this legislation all costs and benefits related to new infrastructure have to be estimated. The project is considered feasible as soon as all estimated benefits exceed the costs to the economy, society and the environment.
The measures under consideration within this option consist in
– Enhancing the development of new water supply on the basis of existing EU legislation
– Supporting the widespread development of new water supplies, with priority being given to the allocation of EU and national funds.
4.2. Option B: 'Water pricing policies only' option This option consists in addressing the issues of water mismanagement by introducing appropriate water pricing policies.
The measures under consideration within this option cover:
– Effective water pricing The price of water is an important variable that influences the amount of water used. Pricing policies can help users make more efficient use of water through financial incentives to move into technologies and practices that ensure better use of available resources.
– Cost recovery
EN 27 EN
This principle consists in ensuring an appropriate contribution by the different water uses to the costs of the water services, based on an economic analysis and the implementation of the 'user pays' principle. It requires the identification of the water services, the providers and the users. The financial costs of the water services then need to be calculated. The environmental and resource costs also have to be estimated. Decisions can then be taken on how costs are to be allocated to water uses (through prices, charges or other institutional mechanisms of cost recovery) and what proportion of the total cost needs to be covered by each category of users.
These measures aim to reinforce the principles of Article 9 of the Water Framework Directive as regards water quantity issues.
4.3. Option C: Integrated approach This option introduces a new approach based on the outcomes of the two previous options.
This option keeps some of the measures involved in options A and B, but reinforces the framework with additional measures which aim to adequately prevent future drought events and mitigate all water scarcity and drought impacts. Measures to save water and increase water efficiency are duly considered in this context.
This option also involves introducing a water hierarchy to guide policy-making. It states that all possibilities to save water and increase water efficiency should be given priority consideration before any new water supply measures are introduced.
The measures under consideration include:
– Measures to prevent droughts
Preventive measures are essential if the impacts of future droughts are to be efficiently tackled. These have tended to include mapping, early warning systems, limitations and restrictions of water use in the case of severe drought.
They can be incorporated appropriately within drought management plans to be introduced as part of the WFD river basin management plans and thereby ensure consistency between prevention and mitigation measures. Member States have the opportunity to draw up such plans for adoption by the end of 2009. There is an interest in developing the exchange of information at European level on this issue in order to deliver European recommendations and best practices.
The setting-up in the short term of an operational European early warning system will also help Member States improve their level of preparedness for droughts. Past experience reveals that early warning can significantly improve the prevention of severe climatic events.
– Measures to support efficient water allocation and sustainable land use planning
The definition and evolution of water allocation and land use planning is generally influenced by the sectoral policies and their financial instruments in place at European and national levels.
Attention needs to be paid to existing European sectoral policies. Several shortcomings have been identified and need to be addressed as a priority.

EN 28 EN
The development of effective economic instruments is one of these priorities. The description and impacts of this measure are set out in option B. The main conclusion is that economic instruments need to be accompanied by supplementary measures if they are to be fully effective.
Further necessary developments would therefore consist in improving the existing legislation:
– The Commission guidelines for water infrastructures:
– These need to be refined in order to ensure the setting up of sustainable projects. In the context of the next reviews of regional and rural development policies, consideration must be given to whether further progress needs to be made as regards environmental preconditions related to effective water management before allocating support to new water supplies.
– The framework of the Common Agricultural Policy and rural development:
– Initial assessments show that some key principles introduced by the reform of the CAP of 2003 have contributed to improving water management. These key principles include full decoupling, cross-compliance and modulation.
– The budgets devoted to water quantity issues:
It is necessary to explore how sectoral policies could better and further contribute to effective water management, utilising to the fullest extent associated funds to foster the delivery of environmental services by water users in an efficient way. Existing budgets have not enabled these issues to be sufficiently covered, owing to competing priorities between environmental issues and the fact that preference is usually given to issues of water quality (diffuse and point source pollution).
Additional measures can be taken at national level to intensify the improvement of the existing policies at EU level. In particular, Member States can be encouraged to draw up appropriate voluntary and/or compulsory measures in river basins which are almost permanently water-scarce, in order to restore a sustainable balance. They can also put in place special incentives to support the generalization of sustainable water management practices.
- Measures to foster water performance technologies and practices
The widespread development of water performance technologies and practices is expected to deliver significant results in terms of water efficiency and water savings.
The associated measures may consist in further implementing or improving existing legislative measures:
– Eco-design Directive
Although this directive in its current form does cover some water-using equipment (dishwashers and washing machines), it does not address any water-using appliances, such as taps, shower heads and toilets.
EN 29 EN
It is necessary in this context to explore the possibility of setting environmental standards for water-using devices, which are energy-using products such as irrigation systems or non-energy using products such as taps, shower heads, toilets.
– Construction Products Directive
A further implementation of this directive could enable appropriate standards related to water efficiency to be introduced for construction products. Standards on energy efficiency are already planned. The objective, therefore, would be to adopt a similar approach for water.
Further action may consist in introducing new measures:
– Water performance criteria for buildings
Given the high potential for water saving in all public and private buildings, a new directive similar to the Directive on the Energy Performance of Buildings could help minimise water consumption. Water performance criteria could be applied to all water-using devices installed in buildings.
Additional measures directly related to technologies and practices at both European and national levels can also prove useful in mitigating the impacts of water scarcity and drought. These include exchange of best practices, enhanced research, widespread monitoring and decision-making tools, effective advisory services, showing leadership by example and the drawing-up of voluntary agreements with all economic sectors.
- Measures to foster the emergence of a water-saving culture in Europe
The public at large are generally unaware of all the impacts related to water scarcity and droughts until they become directly affected by water shortage and restrictions.
This situation calls for a series of measures to raise public awareness and encourage all economic actors and the public to make efforts to save water and to use it more efficiently.
These measures can consist in improving existing legislation and rules:
– EU labelling schemes
The labelling scheme put in place for energy has proved its effectiveness. There is interest in considering similar schemes for water efficiency.
- Quality and certification schemes
These are the most appropriate ways of acting by example and widening the effective management of water demand. It is therefore appropriate to support the inclusion of rules related to water demand management in existing and future certification schemes.
Further measures need to be considered at national level in order to support the broad dissemination of information on the impacts of water scarcity and droughts and on the good practices that need to be adopted in order to mitigate these impacts at all levels. Educational programmes and broad targeted information campaigns must be a priority.
- Measures for new water supply
EN 30 EN
Measures related to new water supply may consist in improving existing Commission guidelines:
– Refinement of Commission guidelines for water infrastructures to ensure that projects are consistent with water management rules. Further consideration could be given, in the context of the next reviews of regional and rural development policies, to environmental preconditions related to effective water management practices in order to determine whether further progress needs to be made.
Measures can also consist in introducing new action at EU level:
– Assessment by the Commission in the short term of all alternative options like desalination or waste water re-use
5. ANALYSIS OF IMPACTS Section 2.4 gives a full description of the consequences of a 'no policy change' scenario. It highlights the possible risks of increasing the impacts of water scarcity and droughts due to insufficient preparedness for severe droughts and possible exacerbation of the impacts of water scarcity as a result of unsustainable land planning and water allocation, while the wastage of large amounts of water continues across Europe.
5.1. Option A: The 'water supply only' option
5.1.1. Environmental impacts Any new water supply gives rise to costs for the environment20.
Dams and reservoirs
• Reservoirs play an important role in public water supply, irrigation and industrial uses. However, the construction of dams can have serious implications for the functioning of freshwater ecosystems in a river basin and ultimately have an impact on livelihoods.
• Dams disconnect rivers from their flood-plains and wetlands, and reduce river flows. In some cases, river flows have been reduced by a factor of four in 10 years due to new infrastructures.
• They affect the migratory patterns of fish and flood riparian habitats, such as waterfalls, rapids, riverbanks and wetlands, which are essential feeding and breeding areas for many aquatic and terrestrial species.
• Dams also disrupt the ecosystem services provided by rivers and wetlands, e.g. water purification. By slowing the movement of water, dams prevent the natural downstream movement of sediments to deltas, estuaries, flooded forests, wetlands and inland seas, thus affecting the composition and productivity of species.
20 Parts of this chapter are extracted from 'Water scarcity management in the context of the Water
Framework directive', June 2006 http://circa.europa.eu/Public/irc/env/wfd/library?l=/framework_directive/scarcity_droughts/technical_report_2006&vm=detailed&sb=Title

EN 31 EN
In the Mediterranean region, the high sediment load in run-off water leads to the silting-up of dammed water. In Spain's Mediterranean basins, some 50 dams examined in 1996 had lost 6% of their overall original capacity. The Jucar basin dam is already 84% silted up (Plan Bleu, 2005).
Water transfers
• In terms of environmental effects, transfers usually make the ecological status of water bodies worse. For example, transfers from the Tagus basin involve a significant reduction of stream flows in the Middle Tagus, so the river currently has problems diluting urban and industrial pollution.
• Furthermore, the dynamics of certain ecological processes such as erosion/sedimentation are crucial for maintaining downstream ecosystems, as observed in the Ebro delta, and also for preserving food chains in coastal waters (Ibáñez et al., 1999).
• Differences in water quality between basins can affect freshwater ecosystems and even cause shortages for potential water users, as the analysis of the Ebro transfer project analysis has shown.
• Translocation of aquatic species is another transfer risk: the Tagus-Segura transfer has transported four fish species (Carassius auratus, Gobio gobio, Chondrostoma polylepis and Rutilus arcasii) between basins and promoted hybridization with Chondrostoma arrigonis in the Júcar basin (Oró, 2003).
Alternative solutions Given the current uncertainty about the environmental impact of all alternative solutions such as desalination21 - including the amount of energy used – and, by extension, its compatibility with the Energy Policy for Europe22 - , it is necessary to carry out further risk assessment work before the Commission takes any definitive position.
5.1.2. Economic impacts
• The short-term impacts on the economy are, at first sight, expected to be positive. Any new water supply can support the development of activities in the area surrounding the new infrastructure. While agriculture and tourism are usually the first to benefit, new industrial activities and the development of urban areas can also be among the first beneficiaries. New water supply is therefore expected to bring additional benefits for sectors that are highly dependent on the availability of water resources.
• However, a number of shortcomings need to be mentioned.
Dams and reservoirs
• The World Commission on Dams found that the technical and economic performance of many dams supplying water, both for irrigation and as bulk water supply, have failed to reach
21 handling of brine after the desalination process, impacts on marine ecosystems and risks associated with
the use of desalinated water for drinking and agriculture 22 Communication COM (2007) 1 final 10.01.2007

EN 32 EN
the targets set. The survey showed that, apart from 29 dams with a water supply component (excluding irrigation), 70 % of dams did not reach their targets over time, and a quarter of dams fell short of their target by over 50 %. Likewise, the irrigation components of large dams studied by the WCD failed to meet their targets, including the areas irrigated. However, dams with heights of less than 30 m and reservoirs with an area of less than 10 km² tended to be closer to the predicted targets (World Commission on Dams, 2000).
• In the agricultural sector, most irrigators cannot afford the capital cost of collective infrastructures for storage and transfer. These collective infrastructures are therefore funded for the most part by public authorities.
The WFD lays down conditions to ensure that the beneficiaries recover the infrastructure costs. Therefore, it seems important that any new water supply project should be assessed from a macro-economic perspective, so that all merchant and non-merchant users can think in terms of costs and benefits and, in particular, take into account the outlook for water demand in the agricultural sector.
• In highly imbalanced zones, an alternative solution may be to create small substitution reservoirs which fill during the winter and have little impact on natural systems. In France, such reservoirs are now preferred to the building up of large multi-use structural resources. However, the cumulative impact of these reservoirs on a basin scale needs to be taken into account and can be equivalent to or even greater than the impact of a single large dam.
• Finally, when considering dams as a structural solution to water scarcity, the decision-making process must take a realistic view of the technical and economic performance of dams, as well as the economic cost resulting from the disruption caused and the services they provide.
Water transfers
• In the initial stages of planning of water transfers, expectations have often been overplayed, as shown by a recent review of various transfer projects, particularly in Spain (Tagus-Segura, Ebro and Júcar-Vinalopó). Some specific aspects require special attention:
- Water availability in the donor basin, including expectations of water consumption in the basin itself and variations in rainfall and evaporation due to climate change
- Environmental and social effects of the transfer on the donor basin
- Effects of the transfer on the receiving basin
- Detailed costs of the water transfer
- Meeting the derogation criteria laid down in Articles 4(7), 4(8) and 4(9) of the WFD.
• As regards water availability, the original studies for the Júcar-Vinalopó transfer project showed that there were enough available resources. Nonetheless, after reviewing stream flows and environmental needs in the Júcar basin, the plans for the Vinalopó transfer now include the option of pumping an additional 62 Hm³/y of groundwater from the Valencia aquifer.
EN 33 EN
• Another limitation on water transfer is that inter-basin water transfers often promote increased land use and stimulate growth in long-term water demand in receiving basins.
• Finally, the costs of the water transfer projects often do not fully reflect all the transfer and associated works, thus failing to comply with the obligation to recover costs as laid down in the WFD. For the Ebro transfer project, various economic reviews of the initial studies more than doubled the expected water price from 0.31€/m³ to 0.72€/m³.
Medium- and long-term impacts of the development of new water supply
Section 2 highlights the critical situation which Europe will have to face in the coming decades with regard to the level of water availability.
The implementation of option A - based on new water supply only - would involve studying likely trends and identifying the areas where water will still be available in sufficient quantity by 2070. The map in section 2.4.3 clearly illustrates the future large-scale distribution of water scarce areas. Few opportunities for new and significant water supply are foreseeable within Europe other than by increasing the pressure on already sensitive water resources and consuming remaining resources until total depletion.
• New opportunities will need to be identified beyond Europe, in neighbouring countries which will still have sufficient water availability, such as Russia.
• Transfers of water from countries far away from European water scarce regions will generate significant costs due to the long distances over which the water has to be transported.
• The decrease in European water availability will make most new dam or reservoir projects more difficult than in the past. All the 'easiest' sites for setting up new dams and reservoirs have already been used (Plan bleu, 2005).
• New projects now face more difficult conditions, particularly in terms of economic and environmental impacts. Their level of sustainability needs to be considered against a backdrop of decreasing water availability. Operating costs and supply costs will increase due to lower aquifers and ever-greater distances between the point of abstraction and the point of use. Technological progress will not make it possible to cover all additional costs.
• The economic sectors that need water will therefore have to bear additional costs as water prices increase.
One expected outcome is that some economic sectors might decide, in the light of the lower profits generated by their activity, to partly or totally delocalise in order to find cheaper water prices outside Europe.
Alternative solutions
There are several technically feasible possibilities of mobilising additional water resources, such as aquifer recharging, waste water re-use, desalination, etc. Desalination is probably one of the most highly developed technologies, with more than 15 000 desalination plants in the world (Graber, 2006).
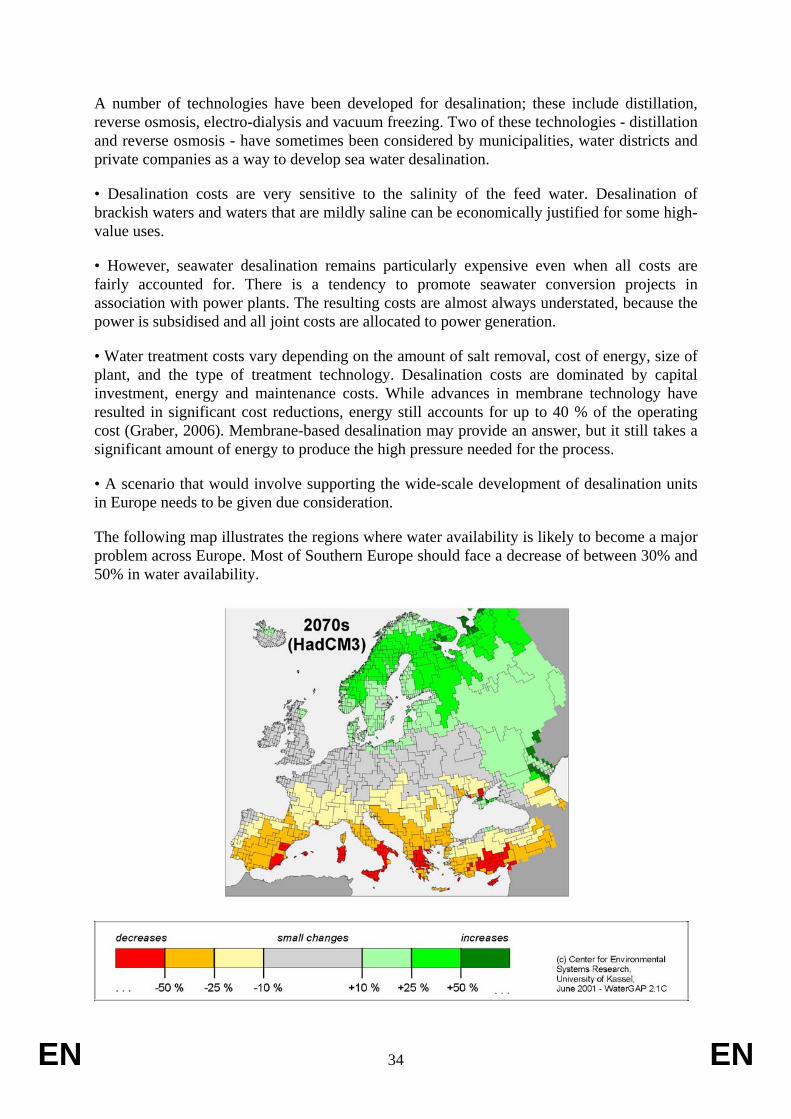
EN 34 EN
A number of technologies have been developed for desalination; these include distillation, reverse osmosis, electro-dialysis and vacuum freezing. Two of these technologies - distillation and reverse osmosis - have sometimes been considered by municipalities, water districts and private companies as a way to develop sea water desalination.
• Desalination costs are very sensitive to the salinity of the feed water. Desalination of brackish waters and waters that are mildly saline can be economically justified for some high-value uses.
• However, seawater desalination remains particularly expensive even when all costs are fairly accounted for. There is a tendency to promote seawater conversion projects in association with power plants. The resulting costs are almost always understated, because the power is subsidised and all joint costs are allocated to power generation.
• Water treatment costs vary depending on the amount of salt removal, cost of energy, size of plant, and the type of treatment technology. Desalination costs are dominated by capital investment, energy and maintenance costs. While advances in membrane technology have resulted in significant cost reductions, energy still accounts for up to 40 % of the operating cost (Graber, 2006). Membrane-based desalination may provide an answer, but it still takes a significant amount of energy to produce the high pressure needed for the process.
• A scenario that would involve supporting the wide-scale development of desalination units in Europe needs to be given due consideration.
The following map illustrates the regions where water availability is likely to become a major problem across Europe. Most of Southern Europe should face a decrease of between 30% and 50% in water availability.

EN 35 EN
Percentage change achieved in average annual water availability (natural discharge without subtraction of water for consumption) for European river basins as compared to today’s levels, based on two different GCMs (ECHAM4 and HadCM3) for the 2020s and the 2070s
• A scenario whereby this decrease is offset by additional water supply coming only from new desalination units would have a significant impact in terms of energy consumption.
• Considering that 3 to 4 kWh are needed to produce one cubic metre of water, the offsetting of a 50% decrease in water availability by desalination alone would lead to an additional energy consumption of 28 Mtep/year in Southern Europe. This would, for example, increase energy consumption in Greece by 13% and in Spain by 10%.
5.1.3. Social impacts
• The direct short-term impacts on society are expected to be positive under certain conditions only. This will be the case if one of the aims of the new infrastructure is to provide public water supply. The new water supply can then increase water security and provide society with benefits by reducing the risk of water shortage and raising public health levels.
• Society can also benefit from positive impacts related to the development of the economy. New economic activities can support the creation of new jobs and thus raise the standard of living.
• However, benefits may be limited if the development of new water supply involves transfers of costs from some economic sectors to households. With resource managers seeking to raise extra capital when investing in new supply sources, the price of water at the point of delivery may rise dramatically. The issue of affordability, whilst of obvious concern in developing countries, has latterly attracted increasing interest in Europe and the developed world (OECD, 2003).
• The beneficiaries of projects which raise the level of provision to an existing supply network are generally those who already have access to the network. The social costs and benefits of such schemes may be unevenly distributed amongst communities. For example, urban communities may benefit from a large inland desalination scheme, whilst rural communities may be left out.
• Benefits may also be limited in the case of water transfers whenever they give rise to social and political conflicts between donor and receiving basins. Such conflicts can be expected within Europe, where 70% of the rivers are transboundary.
Mid- and long-term impacts of the development of new water supply
• Impacts on society are likely to be comparable to the impacts identified on the economy. Option A would most probably lead to an unsustainable situation for a growing proportion of Europe's population.
• The expectation of reduced availability of water resources at local level will lower the level of water security that all new local water supplies were supposed to provide.
• This situation would require the identification of additional water supply options beyond Europe.
EN 36 EN
• Such a scenario would result in rising water prices for the whole population as water will become scarcer and therefore more expensive.
• This scenario would not necessarily lead to a better standard of living or better water security for the population.
The social impacts of option A will be further assessed in the study announced in section 1.2.2, together with the regional characteristics and implications.
5.2. Option B: 'Water pricing policies only'
5.2.1. Environmental impacts
• So far, there has been no systematic assessment on a European scale of the direct effect of pricing policies that reflect the full social costs of water supply. However, there are numerous case studies which lead to differing conclusions.
• Regarding agriculture, the implementation of water pricing leads to changes in land use towards higher-value uses. These changes happen very quickly as farmers are either forced to grow higher value crops to finance the development, or they find the opportunity cost of irrigated property too high to resist and sell to other farmers who change the land use.
Models developed by the University of Bologna (Italy) have made it possible to assess the impacts of water pricing policies on irrigated farming systems in Italy23. Several scenarios have been set up and combined with two water price levels. The findings show that water pricing is an effective instrument for water regulation in the growing of cereals, rice and citrus fruit. For example, in the case of cereals, a doubling of the price leads to a fall of up to 70% in water use. For citrus, some scenarios involve converting from citrus production into cereal production with an associated increase in profits24. The impact of increased water prices always seems to play a significant role.
Additional analyses of the effects of several water management alternatives in the irrigated agriculture of Europe's South Eastern basins have also been carried out25. An increase of €0.12/m³ in water prices would reduce demand for agricultural water by 509 hm³. An increase of €0.18/m³ in water prices would reduce water demand by 605 hm³.
In Hungary, between 1986 and 1997 water consumption fell from 154 lhd to 102 lhd (lhd= litres per head per day) following large price increases in real terms. (OECD 1999)
• However, current prices are often well below the range where water saving is a significant financial consideration for the farmer. So, if volumetric charges are to have a significant impact on demand, prices must be raised significantly and in general well above the estimates of the costs of the service. Some authors suggest that volumetric prices would need to be 10 to
23 The impact of water and agriculture policy scenarios on irrigated farming systems in Italy; an analysis
based on farm level multi-attribute linear programming models. F. Bartolini, G.M. Bazzani, V. Gallerani, M. Raggi, D. Viaggi, 26 April 2006
24 Such changes may be attenuated by the time taken for adaptation and due to the resistance to abandonment of traditional citrus production, even if profits are strongly negative and water consumption very high. Whenever the under-remuneration of the farm labour may become no longer acceptable, citrus may be replaced by a mix of rain-fed crops based on durum wheat and other crops.
25 Water quantity and quality issues in Mediterranean agriculture, J. Albiac, T. Martinez, J. Tapia, OECD, November 2005
EN 37 EN
20 times the prices necessary in order to recover the full supply cost before demand was affected, and this would lead to problems of political acceptability in most countries26.
The available data also show that domestic water consumption decreases when metering is introduced. However, it is possible to determine a certain threshold below which price increases do not affect consumption levels. The best responsiveness of household water demand is reported for ‘peak-pricing’ practices, meaning that there are temporal variations in the price, for example due to generally higher consumption in the summer.
• There is evidence of elasticity of demand for industrial water, but here the range of possible alternatives appears to play a major role. Certain sectors (e.g. chemicals, pulp and paper) seem to be especially sensitive to changes in the water price, because they are able to make use of water saving technologies.
Other environmental impacts
• Negative environmental impacts of water pricing policies are often due to incorrect design of the instruments and are therefore linked to parallel negative social impacts.
• An example in agriculture is the intensification of production around the installation of modern and expensive water saving technology, leading to potential negative impacts on biodiversity.
• Another impact could be the overexploitation of groundwater, if the latter is excluded from the pricing scheme.
• However, if the design of the pricing scheme addresses these environmental concerns, the environmental impacts can be essentially positive. It can lessen the over-exploitation of aquifers and the associated destruction of wetlands, and can help address problems of eutrophication and pollution by hazardous substances. Finally, there would be less need of infrastructures for new water supply or water transfers.
5.2.2. Economic impacts
• The implementation of a water pricing policy covering both environmental and scarcity costs can prompt an efficient allocation of resources, leading to an increase in social welfare. However, the outcome will depend on how the revenues are used.
• Here again, there is no a comprehensive assessment on a European scale, although case studies on the macro-economic impact of sustainable agriculture in Bulgaria, Romania and Hungary27, for example, show that large-scale conversion of arable land to sustainable agriculture through internalisation policies brings economic benefits.
• Additional positive economic impacts can be identified:
26 Water charging in irrigated agriculture, lessons from the literature, December 2002, B. Bosworth, G.
Cornish, C. Perry, F. Van Steenbergen 27 Impact of agricultural development scenarios on water resources in Bulgaria, Hungary and Romania,
Kieft, H (2000) in: Implementing the EU Water Framework Directive, Seminar proceedings, European Commission, WWF, Brussels 2000.
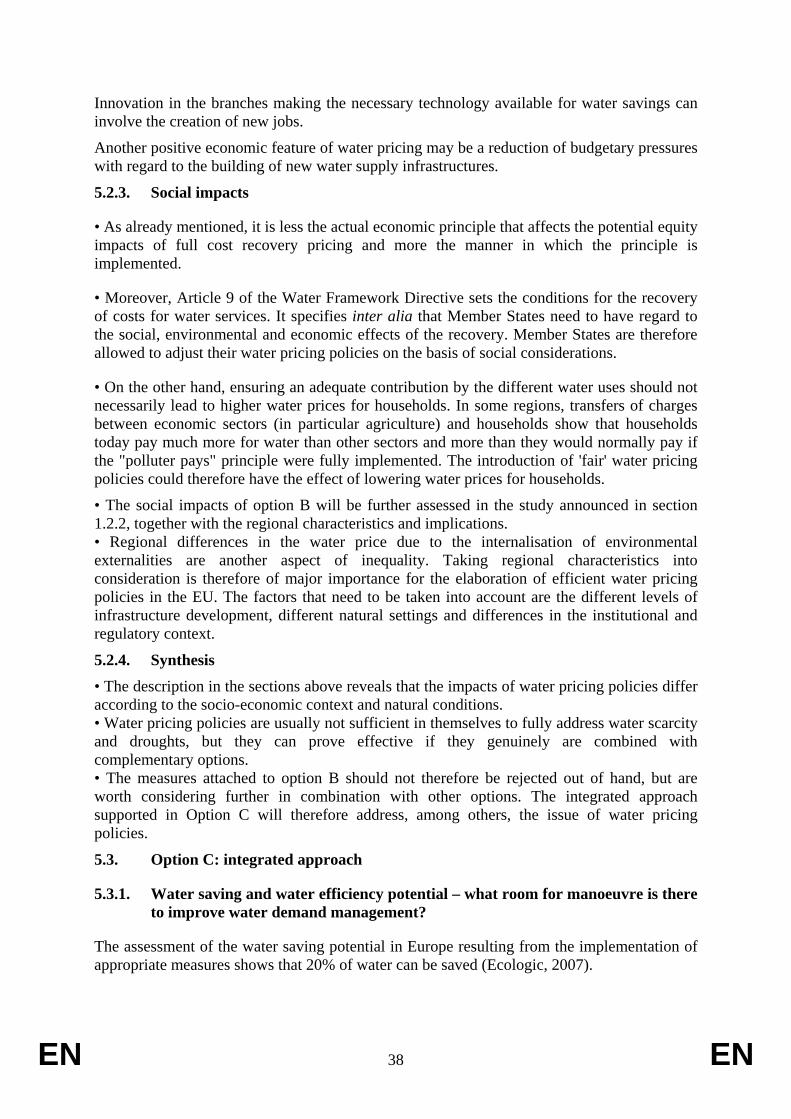
EN 38 EN
Innovation in the branches making the necessary technology available for water savings can involve the creation of new jobs.
Another positive economic feature of water pricing may be a reduction of budgetary pressures with regard to the building of new water supply infrastructures.
5.2.3. Social impacts
• As already mentioned, it is less the actual economic principle that affects the potential equity impacts of full cost recovery pricing and more the manner in which the principle is implemented.
• Moreover, Article 9 of the Water Framework Directive sets the conditions for the recovery of costs for water services. It specifies inter alia that Member States need to have regard to the social, environmental and economic effects of the recovery. Member States are therefore allowed to adjust their water pricing policies on the basis of social considerations.
• On the other hand, ensuring an adequate contribution by the different water uses should not necessarily lead to higher water prices for households. In some regions, transfers of charges between economic sectors (in particular agriculture) and households show that households today pay much more for water than other sectors and more than they would normally pay if the "polluter pays" principle were fully implemented. The introduction of 'fair' water pricing policies could therefore have the effect of lowering water prices for households.
• The social impacts of option B will be further assessed in the study announced in section 1.2.2, together with the regional characteristics and implications. • Regional differences in the water price due to the internalisation of environmental externalities are another aspect of inequality. Taking regional characteristics into consideration is therefore of major importance for the elaboration of efficient water pricing policies in the EU. The factors that need to be taken into account are the different levels of infrastructure development, different natural settings and differences in the institutional and regulatory context.
5.2.4. Synthesis
• The description in the sections above reveals that the impacts of water pricing policies differ according to the socio-economic context and natural conditions. • Water pricing policies are usually not sufficient in themselves to fully address water scarcity and droughts, but they can prove effective if they genuinely are combined with complementary options. • The measures attached to option B should not therefore be rejected out of hand, but are worth considering further in combination with other options. The integrated approach supported in Option C will therefore address, among others, the issue of water pricing policies.
5.3. Option C: integrated approach
5.3.1. Water saving and water efficiency potential – what room for manoeuvre is there to improve water demand management?
The assessment of the water saving potential in Europe resulting from the implementation of appropriate measures shows that 20% of water can be saved (Ecologic, 2007).

EN 39 EN
It is a simple matter to compare a strategy based on 'more value per drop' with the strategy adopted for the energy sector.
• In the Mediterranean area, losses or inefficiencies represent 44% of the water abstracted in the region. This estimate illustrates the possibility of improving the efficiency of water use. The volume saved could then constitute a potential new water resource for the future. Current analyses conclude that water savings would be as much as 86 km³/year and would actually correspond to more than the expected growth in total demand between 2000 and 2025 (estimated up to 51 km³/year).28
The following figure illustrates the comparison between the baseline scenario (supply) and the alternative scenario, based on water demand management, for Northern Mediterranean countries (Spain, France, Italy, Greece, Malta, Cyprus, Slovenia, Croatia, Bosnia -Herzegovina, Serbia and Montenegro, Albania).
28 Plan Bleu, 2007
EN 40 EN
Water demand per sector, baseline and alternative scenarios, entire Countries
Source: Plan Bleu, J. Margat - Northern Mediterranean Countries, from Spain to Greece: possible savings of 31km³/year in 2025
Water demand reduction is possible without affecting current economic activities and can lead to economic, social and environmental benefits.
Wasting water can therefore be considered as an additional cost (along with exploitation, supply and processing) and the potential financial savings are huge.
In the Mediterranean region, the "Plan Bleu" estimated that water savings of up to €255 billion could be made over 25 years (or €11 bn per year)29. The costs for exploiting this potential need to be subtracted but are still far outweighed by the resulting benefits. In addition, energy savings would be as much as 100 TWh for the production of drinking water alone over 25 years.
• More generally, the household share of public water supply across Europe averages 65%30. This represents 46 km³ per year (based on EEA statistics for 2000 and the forecast for 2005). Within households, water is mostly used for toilets (25%), baths, showers, dishwashers and washing machines.
The technological developments that have improved the efficiency of water appliances have been one of the most important drivers of the reduction of water use, as illustrated by the two following examples31.
- Until the 1980s, and in some countries even into the 1990s, building standards recommended a minimum of 9 litres of water for toilet flushes. Now, toilets with a flush of less than 6 litre dominate the market in many countries. However, many old houses are still equipped with old fixtures.
29 Based on a water price of 0.4 €/m3 30 Calculated from data from Denmark, Germany, Sweden, Spain and France (EEA) 31 EEA Households Water Use, ETC on water
EN 41 EN
- As regards dishwashers, water consumption is linked to energy consumption and cleaning performance. Figures are based on the assumption that many A-class (energy) appliances need 16 to 17 litres per cycle, but the existing stock still consumes at least 18 litres32.
Although a great deal of progress has been made, there is still room for improvement. From alternative solutions for domestic waste water treatment that avoid large volumes of water for flushing to new types of dishwashers using ultrasonic technologies, there is a wide range of technical solutions that can lead to significant water savings.
In addition, the significant potential for reducing consumption of domestic water supply could be mobilised through better management of water in: schools (20%), sports facilities, including swimming pools (20%), campsites (10% to 20%), hotels (20%), collective households (20%), green parks (from 25% to 60%); and the payback period would be less than 3 years (Loire-Bretagne agency, 2005).
Examples collected in many countries (UK, FR, SP, CY, MT, Australia, etc.) show that, on average, around 20% of water savings can be expected to come from the improvement of water performance of buildings of whatever type: households, public administrations, schools, sports facilities or tourist accommodation. In addition, as much as 35% to 40% of domestic water consumption can be saved by recycling "grey" water, as demonstrated in Cyprus33.
The challenge is of particular interest in water scarce areas where large urban or tourism areas are developed and where a 20% reduction in water consumption can alleviate tensions between users.
• Further examples can be identified in the agricultural sector. For instance, water use can be significantly reduced by switching irrigation technology from gravity to drip or sprinkler feed in most crops, including citrus, grapes, deciduous tree crops and truck crops34. Of these, citrus show the most striking changes. When irrigation technology switches from gravity to drip irrigation, efficiency (water use per acre) increases by about 50%.
• All these examples illustrate the existing scope for action to achieve better water demand management across Europe and thus provide an indication of what is at stake. However, such gains would need to be further evaluated locally and regionally through ‘cost-effectiveness’ studies taking into account various options, including the costs and benefits of environmental and social externalities.
It is still rare for systematic evaluations of cost-effectiveness, comparing several options (increasing supply or using water demand management), to be carried out and published. Such evaluations, which would include more detailed estimates of the potential water savings on the basis of precise analysis and internalisation, as far as possible, of the costs of the environmental impacts of the various options would increase awareness among decision-makers of the opportunities and feasibility of water demand management. The question is
32 MEEuP product cases Report, final, 28.01.2005, VHK for European Commission 33 Recycling of grey water in Cyprus, C.A. Kambanellas; Use and conservation of water in Cyprus,
Ministry of agriculture, natural resources and environment, water development department, November 2002
34 Schoengold, K. Sunding, D. and Moreno, G. 2004 "Panel estimation of Agricultural Water Demand based on an Episode of rate reform"

EN 42 EN
whether it is then less costly for the community to reduce losses than to exploit new resources, taking long-term effects into account.
Very often, water demand management appears much more economically advantageous than increasing water supply. The few studies available that make this kind of comparison show differences of 1-3, or even 1-10 between cost per cubic metre ‘saved’ and ‘supplied’.
5.3.2. Impacts of option C on the economy It is essential to mention from the outset that the implementation of some specific measures will require the definition of appropriate accompanying measures taking into account specific regional, sectoral and social factors. Such measures will require further assessment.
5.3.2.1. Measures for drought prevention
Early warning systems are needed for all kinds of changes in human activities and in ecological processes and for just about any change that is of interest to anybody35. Early warning systems are part of a country’s capacity to react to a perceived threat in order to prevent, adapt to or mitigate its impacts. Such systems have evolved considerably over the past two decades. They attracted much attention in the 70s and 80s during the extended droughts and famines in the West African Sahel region and in the Horn of Africa. They were set up primarily for humanitarian purposes. Their functions have gradually expanded to embrace societal risks, vulnerability reduction and sustainable development. It is a cost-effective way to deal with potential disasters and to better address natural hazards in a context of climate change. These systems provide timely information so that communities are not only informed, but can also prepare themselves before and during the anticipated event.
As with any action, early warning systems entail development costs. However, they should be embedded in existing organisational structures and technical capacities rather than systematically looking for totally new schemes. This approach will be an effective way to save money and to progress towards coherent synergies and coordination between schemes already in place.
The functioning of an early warning system will automatically involve management costs. But such costs should be considered in the light of all (particularly the economic) costs incurred by inadequate warning systems36. It is obvious that economic losses can be considerably reduced if a culture of prevention is introduced at all levels within a society.
5.3.2.2. Measures to support efficient water allocation and sustainable land planning
– Impacts of a better integration of water issues in sectoral policies
The agricultural and regional policies offer opportunities to address water scarcity and drought issues. However, there is scope for further adjustments to improve the efficiency of these policies in tackling water quantity issues.
35 Early warning systems : do’s and dont’s, Report of Workshop - October 2003, M. H. Glantz, National
Centre for Atmospheric Research 36 “Many tragic events in recent years have demonstrated the cost of inadequate warning systems.”,
Declaration of the Postdam Early Warning Conference, September 1998

EN 43 EN
The most recent reform of the Common Agricultural Policy introduced new principles such as decoupling under the single farm payment scheme or cross-compliance. Taking a step forward in the design of these principles would bring significant support to the development of sustainable water demand management within the farming community.
Decoupling has proved effective, in particular because it does not influence the production decisions taken by farmers. While some countries have opted for partial decoupling, several studies show that full decoupling would bring additional benefits for the protection of water resources through a decrease in irrigated crops. In France, for instance, full decoupling would lead to a 15% decrease in the maize crop, thereby accounting for 72% of the total reduction in irrigated area37.
Estimated decreases in the case of full decoupling would be the result of shifting the emphasis from supported crops to non-supported crops and changing over from irrigated crops to rain-fed crops.
Full decoupling would not necessarily mean farmers losing income or incurring additional costs. The analysis of crop performance must take into account not only gross margins but also direct margins, including the cost of materials, and in particular the cost of irrigation equipment38. It shows a low level of competitiveness for irrigated crops whenever the additional yield compared to a rain-fed crop does not exceed 4.5 to 5 t/ha.
Moving towards full decoupling will mean limited additional costs for the administration. Moreover, this measure should actually lead to overall savings as a result of the administrative simplification which full decoupling will bring.
The improvement of water demand management in the agricultural sector depends, amongst others, on systematic metering, full compliance with the permits issued for water abstraction and widespread good agricultural practices. It may be appropriate to see how links between water management issues and direct support payments could be established.
The second pillar of the CAP is also an essential tool to develop sustainable water management practices in the agricultural sector. The latest programming periods show that national rural development programmes have proved effective in addressing many environmental issues.
For instance, the rural development programmes have had environmentally beneficial effects on farming practices in about 25% of the land area of England. The evaluation of the Netherlands rural development programme indicated that, thanks to this programme, several watercourses had been restored, groundwater quality had been improved and water depletion had been reduced. In Ireland, 41% of all programme spending was dedicated to the Rural Environmental Protection Scheme (REPS). In the Spain's Extremadura region, Objective 1 - improvement of water management - was seen as one of the most important positive effects of implementing the rural development programme.
37 Les effets de la réforme de la PAC de 2003 sur la demande en eau par l'agriculture, G. Buisson, MEDD,
décembre 2005 38 Irrigation durable, Rapport du CGGREF, Ministère français de l'agriculture, 9 février 2005

EN 44 EN
The experiences gathered in the Member States reveal that a consistent implementation of rural development programmes, in particular of agro-environmental measures, leads to benefits that outweigh the costs. Consequently, one option for the future, beyond 2013, may be to consider the extent to which the budget of the second pillar could be further enlarged to increase the benefits attached to rural development programmes and ensure a better coverage of the areas concerned by water quantity issues. The same considerations can also apply to regional policy. An extension of these budgets and the identification of possible synergies between policies would not entail any opportunity costs for other European environmental policies.
– Impacts of incentives at national level
The energy sector is more advanced than others in terms of introducing incentives to reduce consumption of energy. The evaluation of these tools provides interesting information about the likely effectiveness of their implementation in the water sector.
The introduction of tax credits to encourage energy saving action in France has borne fruit. From 2005 to 2006, the sales of wood-burning boilers doubled. Sales of equipment relying on solar energy rose sharply, with the number of individual solar water heaters up by 710% between 2002 and 2006!
In reaction to the drought that occurred in 2006, the French government decided to introduce a new tax credit measure (40% for a maximum level of expenditure of € 5.000) to encourage the purchase of rainwater harvesting systems.
Major campaigns to promote water saving were also rolled out in the Loire-Bretagne basin. More than 60% of the subsidies shared between the Ministry of Environment, the region and the river basin district were to support the implementation of seven types of water saving actions in seven municipalities, representing 600.000 inhabitants. In addition to raising awareness among 15.000 citizens, the water savings achieved ranged from 8% to 97%, depending on the type of measures39.
The Water Act, adopted by France on 26 December 2006, confirms tax rebates for owners who opt for rainwater harvesting. More generally, the Act specifies that the Water Agencies' programmes of action must promote the reduction of leakages in networks as well as saving water.
In Germany, a number of measures have been implemented to encourage water saving and eco-design of buildings. For instance, the Land of Hamburg has awarded a grant of up to 50% for the purchase of 1.500 water saving and recycling appliances.
While tax incentives inevitably have an impact on behaviour, they also have an impact in terms of increasing the awareness of builders, project managers and the general public, including children.
The introduction of incentives can be decided on by public authorities or private enterprises. When these incentives are adopted by public authorities, the necessary funds could come from
39 Economiser l'eau dans la ville et l'habitat, guide méthodologique, Région Bretagne, Agence de l'Eau
Loire-Bretagne, March 1999

EN 45 EN
implementing the ‘user pays’ principle and the associated levying of taxes on water users. Redistribution of this kind also encourages taxpayers to make the changeover to water-efficient equipment.
Private enterprises may also have an interest in introducing special rebates for such equipment, as this is a way for them to attract the public's attention. The market for water efficient equipment remains promising given the gaps in all sectors that still need to be addressed across Europe.
5.3.2.3. Measures to foster water performance technologies and practices
As regards economic impacts, it is clear that encouraging the development of water-efficient technologies and products stimulates the market and increases the competitiveness of European industries, as is already the case in the energy sector. For instance, the dishwasher market is still dominated by EU manufacturers despite the fact that stringent options for energy and water were imposed 10 years ago which led to energy and water savings of over 30%.
Moreover, new technologies and products can be exported to regions beyond Europe, in particular in the neighbouring countries of the Mediterranean which also have severe problems of water scarcity and drought. In Germany, more than 300 firms specialised in water saving and water recycling technologies - including architects, town planners, engineers, industrialists, etc. - have set up a professional organisation for promoting and implementing these techniques, and have thereby created 60 000 jobs.
– Impacts of voluntary agreements
Depending on the region and the sector, specific partnerships could bring significant added value. A prime example is France, where a voluntary agreement was signed between the government and golf course professionals in 2006. Protecting water resources is the prime objective of this agreement, with the aim of reducing by 30% the volumes currently drawn from the public water supply for irrigating golf courses within 3 years. It also sets a specific target for a region where water is currently over-exploited, as well as promoting water re-use.
A golf course which had been implementing water saving measures since 2002 has experienced a positive payback, with savings of over 20%.
– Impacts of binding performance targets set up at national level
Binding performance targets for new buildings are being implemented in the UK, where water savings of between 10% and 20% are expected. The impact assessment shows clear benefits, with a cost-benefit ratio ranging between 6 and 25, depending on the target (120 to 135 litres/head/day). Costs will be mainly borne by developers and builders, and also manufacturers of plumbing fittings because of the costs of additional testing of products.
Leakages in public water supply networks of some older cities can exceed 50%. The feasible potential savings in irrigation in Northern Mediterranean countries is 15% of the total water demand and 45% of the total water saving potential40. Reducing pressure in water networks
40 Plan Bleu, 2005
EN 46 EN
also reduces energy, as demonstrated by the Emilia Romagna region in Italy, where reducing leakages by up to 16% in 2016 would allow energy savings of up to 1.9 Mtep/year in 2010 by reducing pumping and by monitoring pressure.
Limiting losses has a direct economic impact. For large urban areas, reducing losses can prove to be a cost-effective alternative to the mobilisation of a new resource. Therefore, water companies may be able to defer investments. On the other hand, water companies which have recently invested in new water infrastructures may face difficulties if the billed volumes decrease.
Checking and enforcing compliance with regulations in new buildings can give rise to additional costs (inspection by building authorities/approved inspectors and training institutions). However, the bulk of this inspection work can be done at the same time as other statutory inspections, so the increase in costs would only be small.
– Impacts of monitoring and decision making tools
In Aquitaine (France), systematic irrigation is frequent and leads to higher water consumption41. In response to a survey carried out among irrigators in this region, 27% declared they had irrigated "as usual". These users accounted for 44% of the overall volume of water for maize; higher water dosing also led to equivalent yields. 18% declared that they had irrigated with the help of a decision making tool; these accounted for 16% of the overall water volume for maize.
The evidence supporting the beneficial effects of innovative irrigation management and technologies is overwhelming42. Water savings in the range of 30 to 40% simply by better management of the application schedules with no reduction in yields have been reported by Causape et al. (2004) and Luquet et al. (2005). In addition, technology shifts both on-farm and within districts show that serious efforts to conserve water bring economic returns (Peterson and Ding, 2005; Cetin, Yazgan and Tipi, 2004). In most cases, simply checking key management factors, such as soil moisture, during the phenological stages is enough to reduce consumption.
5.3.2.4. Measures to foster the emergence of a water saving culture in Europe
For energy labelling, it is assumed that extra savings due to improved labelling are equivalent to 30% of the water savings already achieved. The potential for water savings has to be estimated.
There are no available quantified references to water savings that can be directly attributed to educational programmes on cost. However, a number of campaigns on saving water43 show that water volumes were actually reduced (by up to 30%).
Based on the evidence that water saving programmes are cheaper than action on water supply, and that water saving through education is cheaper than demand side management of utilities,
41 Sécheresse et agriculture, Réduire la vulnérabilité de l'agriculture à un risque accru de manque d'eau,
INRA, Octobre 2006 42 Using good economic principles to make irrigators become true partners of water and environmental
policies, A. Garrido, Universidad de Madrid, OECD Workshop, 14-18 November 2005 43 In particular in Loire-Bretagne river basin, France, 1995 onwards

EN 47 EN
educational programmes are considered to be cost-effective. In addition, educating the next generation will provide greater efficiency immediately and is likely to provide a positive stimulus to students taking up higher education pathways leading towards sustainable development, including water demand management.
5.3.3. Impacts of option C on society
Water saving policies have positive social impacts, in particular on sustainable job creation in the public sphere, such as local councils and, more generally, for building managers. Managing public buildings, green areas, etc with a view to saving water requires professional skills that can be financed directly by the economic savings gained by avoiding water consumption, waste water treatment and water heating. In France, new jobs were developed at the end of the 1990s for carrying out water saving actions: in the Loire-Bretagne district, at least 45 new posts were created in 32 public organisations over a period of 8 years.
Reducing the volume of water consumed will also have a direct effect on water bills. In France, water represents 1% of the total expenditure of a household. A 20% reduction in the bill can be significant.
There are numerous examples of lower household water bills resulting from the implementation of water saving measures. In the Gironde Region (South-West France), the impact of different water saving measures on household demand has been estimated at 60 m3 per year (down from 155 m3 to 95 m3 per year). This would cut the household water bill by €240 per year. The impact of different water saving measures for individual houses was also monitored for various measures actually implemented in the Gironde Region.
Installing water-saving devices for taps, showers and toilets in a holiday home close to the sea, occupied on average by 7 persons for 40 days per year, resulted in a 37% reduction in water demand (from 59 m³/year to 37 m³/year). This was reflected in a reduction of €140/year in the water bill (as compared to total equipment costs of €296 incl. tax, => giving a pay-back period of around two years)
However, where economic instruments are not implemented properly (water pricing, in particular), social equity could not be expected (see section 5.2.3).
The assessment of all social impacts will be part of the study announced in section 1.2.2 and due to be completed by the end of 2007.
5.3.4. Impacts of option C on the environment
All measures leading to water savings also have positive environmental impacts.
Carbon emissions can be reduced thanks to the energy saved through less pumping for extraction and transport, less treatment of the drinking water supply and, lastly, less transport and treatment of waste water.
In the case of the UK, it was calculated that £200 million had been saved through carbon reduction as a result of a water efficiency programme in new buildings (households, target of 130 l/person/day).
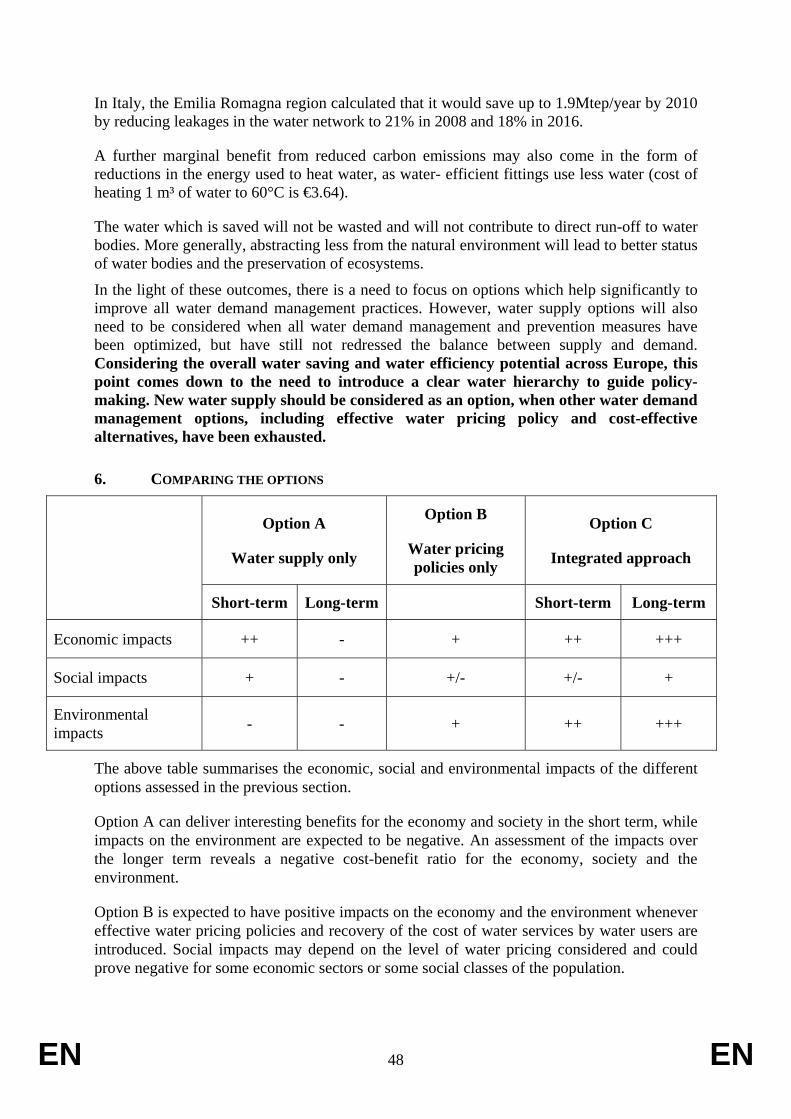
EN 48 EN
In Italy, the Emilia Romagna region calculated that it would save up to 1.9Mtep/year by 2010 by reducing leakages in the water network to 21% in 2008 and 18% in 2016.
A further marginal benefit from reduced carbon emissions may also come in the form of reductions in the energy used to heat water, as water- efficient fittings use less water (cost of heating 1 m³ of water to 60°C is €3.64).
The water which is saved will not be wasted and will not contribute to direct run-off to water bodies. More generally, abstracting less from the natural environment will lead to better status of water bodies and the preservation of ecosystems.
In the light of these outcomes, there is a need to focus on options which help significantly to improve all water demand management practices. However, water supply options will also need to be considered when all water demand management and prevention measures have been optimized, but have still not redressed the balance between supply and demand. Considering the overall water saving and water efficiency potential across Europe, this point comes down to the need to introduce a clear water hierarchy to guide policy-making. New water supply should be considered as an option, when other water demand management options, including effective water pricing policy and cost-effective alternatives, have been exhausted.
6. COMPARING THE OPTIONS
Option A
Water supply only
Option B
Water pricing policies only
Option C
Integrated approach
Short-term Long-term Short-term Long-term
Economic impacts ++ - + ++ +++
Social impacts + - +/- +/- +
Environmental impacts - - + ++ +++
The above table summarises the economic, social and environmental impacts of the different options assessed in the previous section.
Option A can deliver interesting benefits for the economy and society in the short term, while impacts on the environment are expected to be negative. An assessment of the impacts over the longer term reveals a negative cost-benefit ratio for the economy, society and the environment.
Option B is expected to have positive impacts on the economy and the environment whenever effective water pricing policies and recovery of the cost of water services by water users are introduced. Social impacts may depend on the level of water pricing considered and could prove negative for some economic sectors or some social classes of the population.

EN 49 EN
Option C will deliver results gradually. Impacts on the economy are expected to be positive from the outset and grow in the longer term. Social impacts will also be positive with time. This option is expected to deliver significant and increasing positive impacts on the environment. Compared to the other options, it generates the greatest benefits for the environment.
Based on this assessment, option C appears to be the most promising. It ensures the best cost-effectiveness ratio in the long term.
The steps to develop policies further and the measures to address water scarcity and drought issues will in any event require additional, thorough impact assessments. The next steps will involve looking deeper into the collection of data and the quantitative assessment of the selected measures extracted from the wide range of options proposed in the Communication.
As highlighted in section 5.3.2, it is also clear that the implementation of some specific measures will require the definition of appropriate accompanying measures taking into account regional, sectoral and social specificities. Such measures will also require further assessment.
7. MONITORING AND EVALUATION The challenge of water scarcity and droughts will need to be addressed both as an essential environmental issue and as a precondition for sustainable economic growth in Europe.
The impact assessment has identified an integrated approach consisting of an initial set of policy actions as the best option and intends to open up a wide-ranging debate on how to adapt to water scarcity and droughts - two phenomena that could potentially increase in a context of climate change. The actions could already start to bear fruit in the short term. The Commission will review progress towards the set objectives and will report on them to the Council and the European Parliament. The report will be presented in the framework of a Stakeholder Forum to be organised in 2008.
Action at EU level alone will not suffice. It will need to be followed by commitments at national level if we are to succeed.
The Commission will consider follow-up initiatives and action in the light of discussions on this Communication in the Council of Ministers and the European Parliament.
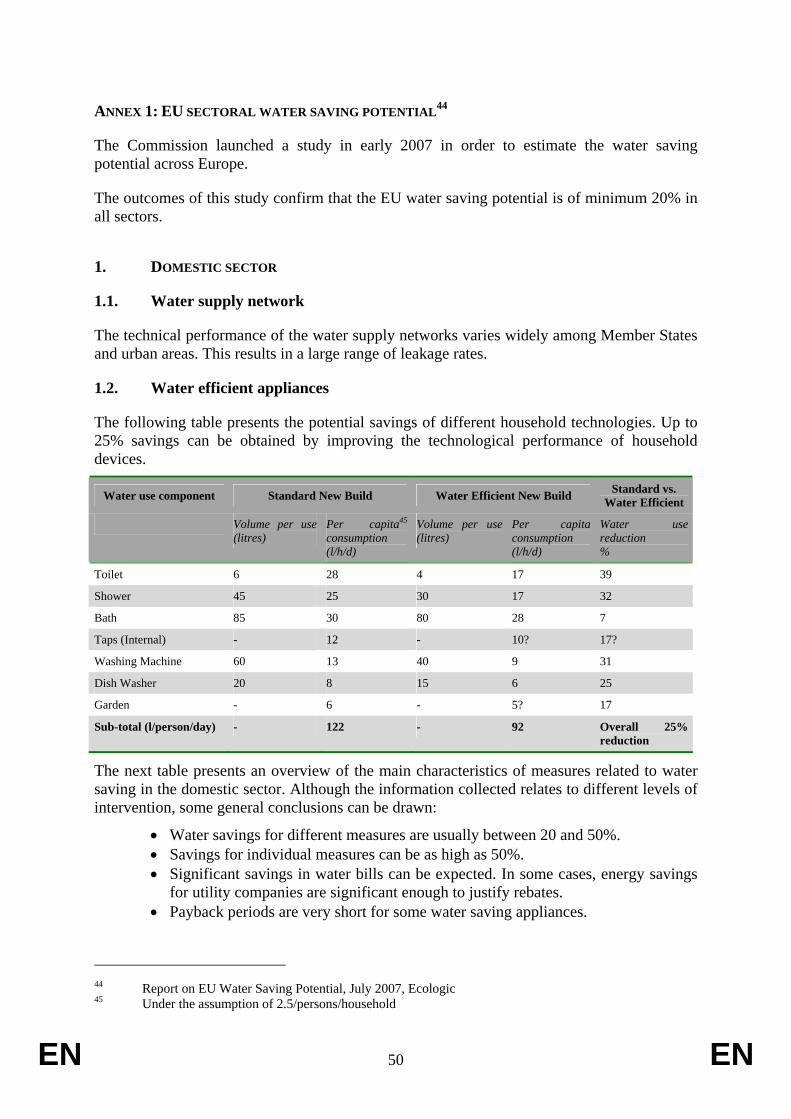
EN 50 EN
ANNEX 1: EU SECTORAL WATER SAVING POTENTIAL44
The Commission launched a study in early 2007 in order to estimate the water saving potential across Europe.
The outcomes of this study confirm that the EU water saving potential is of minimum 20% in all sectors.
1. DOMESTIC SECTOR
1.1. Water supply network
The technical performance of the water supply networks varies widely among Member States and urban areas. This results in a large range of leakage rates.
1.2. Water efficient appliances
The following table presents the potential savings of different household technologies. Up to 25% savings can be obtained by improving the technological performance of household devices.
Water use component Standard New Build Water Efficient New Build Standard vs. Water Efficient
Volume per use (litres)
Per capita45 consumption (l/h/d)
Volume per use (litres)
Per capita consumption (l/h/d)
Water use reduction %
Toilet 6 28 4 17 39
Shower 45 25 30 17 32
Bath 85 30 80 28 7
Taps (Internal) - 12 - 10? 17?
Washing Machine 60 13 40 9 31
Dish Washer 20 8 15 6 25
Garden - 6 - 5? 17
Sub-total (l/person/day) - 122 - 92 Overall 25% reduction
The next table presents an overview of the main characteristics of measures related to water saving in the domestic sector. Although the information collected relates to different levels of intervention, some general conclusions can be drawn:
• Water savings for different measures are usually between 20 and 50%. • Savings for individual measures can be as high as 50%. • Significant savings in water bills can be expected. In some cases, energy savings
for utility companies are significant enough to justify rebates. • Payback periods are very short for some water saving appliances.
44 Report on EU Water Saving Potential, July 2007, Ecologic 45 Under the assumption of 2.5/persons/household
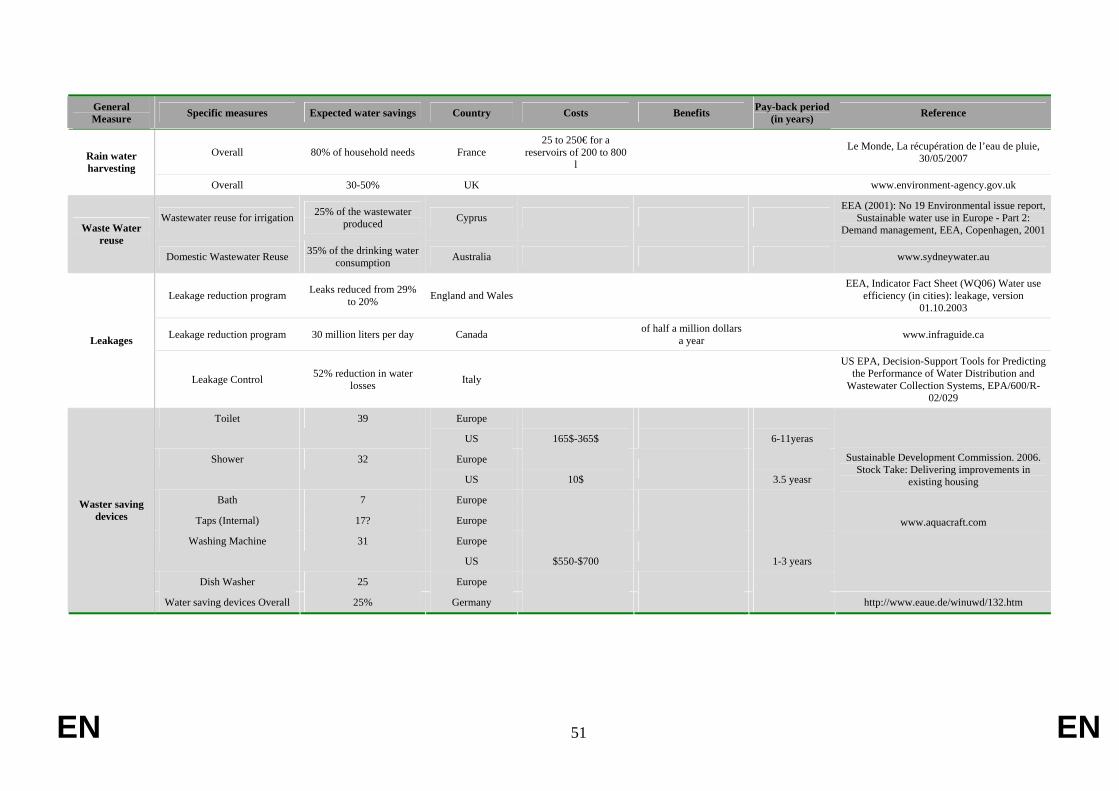
EN 51 EN
General Measure Specific measures Expected water savings Country Costs Benefits Pay-back period
(in years) Reference
Overall 80% of household needs France 25 to 250€ for a
reservoirs of 200 to 800 l
Le Monde, La récupération de l’eau de pluie, 30/05/2007 Rain water
harvesting Overall 30-50% UK www.environment-agency.gov.uk
Wastewater reuse for irrigation 25% of the wastewater produced Cyprus
EEA (2001): No 19 Environmental issue report, Sustainable water use in Europe - Part 2:
Demand management, EEA, Copenhagen, 2001 Waste Water reuse
Domestic Wastewater Reuse 35% of the drinking water consumption Australia www.sydneywater.au
Leakage reduction program Leaks reduced from 29% to 20% England and Wales
EEA, Indicator Fact Sheet (WQ06) Water use efficiency (in cities): leakage, version
01.10.2003
Leakage reduction program 30 million liters per day Canada of half a million dollars a year www.infraguide.ca Leakages
Leakage Control 52% reduction in water losses Italy
US EPA, Decision-Support Tools for Predicting the Performance of Water Distribution and
Wastewater Collection Systems, EPA/600/R-02/029
Toilet 39 Europe
US
165$-365$
6-11yeras
Shower 32 Europe
US
10$
3.5 yeasr
Bath 7 Europe
Taps (Internal) 17? Europe
Washing Machine 31 Europe
US
$550-$700
1-3 years
Dish Washer 25 Europe
Sustainable Development Commission. 2006. Stock Take: Delivering improvements in
existing housing
www.aquacraft.com
Waster saving devices
Water saving devices Overall 25% Germany http://www.eaue.de/winuwd/132.htm
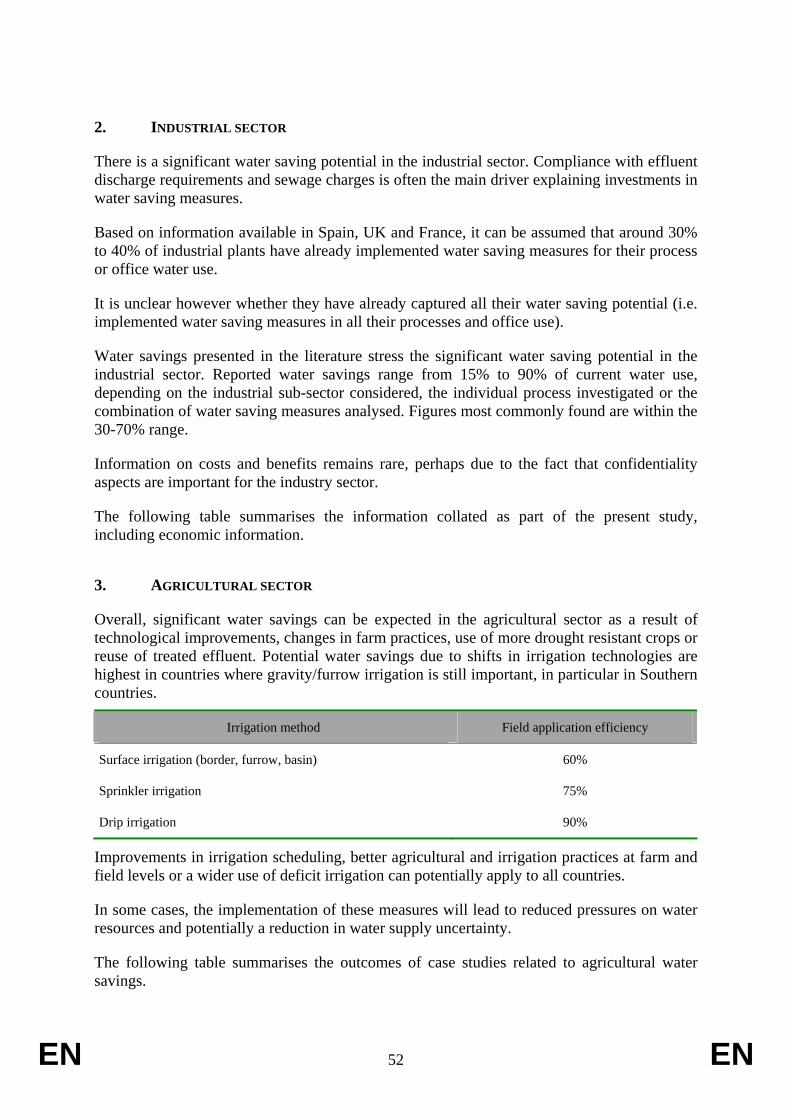
EN 52 EN
2. INDUSTRIAL SECTOR
There is a significant water saving potential in the industrial sector. Compliance with effluent discharge requirements and sewage charges is often the main driver explaining investments in water saving measures.
Based on information available in Spain, UK and France, it can be assumed that around 30% to 40% of industrial plants have already implemented water saving measures for their process or office water use.
It is unclear however whether they have already captured all their water saving potential (i.e. implemented water saving measures in all their processes and office use).
Water savings presented in the literature stress the significant water saving potential in the industrial sector. Reported water savings range from 15% to 90% of current water use, depending on the industrial sub-sector considered, the individual process investigated or the combination of water saving measures analysed. Figures most commonly found are within the 30-70% range.
Information on costs and benefits remains rare, perhaps due to the fact that confidentiality aspects are important for the industry sector.
The following table summarises the information collated as part of the present study, including economic information.
3. AGRICULTURAL SECTOR
Overall, significant water savings can be expected in the agricultural sector as a result of technological improvements, changes in farm practices, use of more drought resistant crops or reuse of treated effluent. Potential water savings due to shifts in irrigation technologies are highest in countries where gravity/furrow irrigation is still important, in particular in Southern countries.
Irrigation method Field application efficiency
Surface irrigation (border, furrow, basin) 60%
Sprinkler irrigation 75%
Drip irrigation 90%
Improvements in irrigation scheduling, better agricultural and irrigation practices at farm and field levels or a wider use of deficit irrigation can potentially apply to all countries.
In some cases, the implementation of these measures will lead to reduced pressures on water resources and potentially a reduction in water supply uncertainty.
The following table summarises the outcomes of case studies related to agricultural water savings.
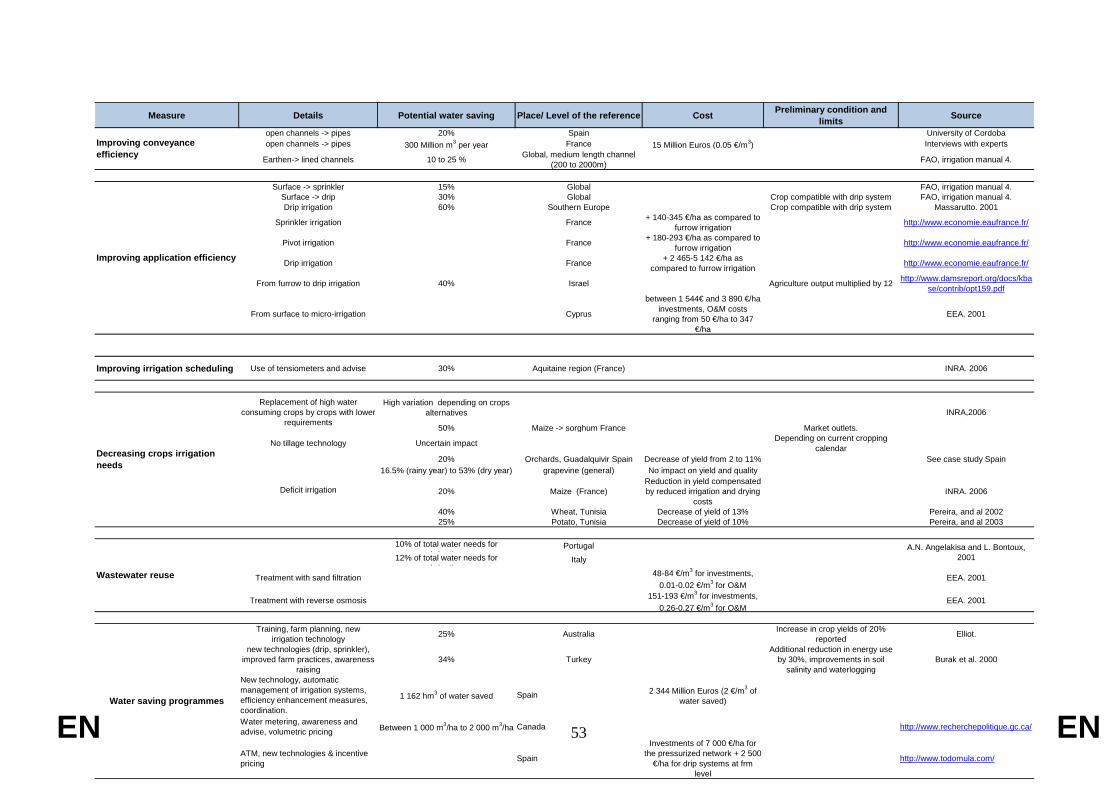
EN 53 EN
Measure Details Potential water saving Place/ Level of the reference Cost Preliminary condition and limits Source
open channels -> pipes 20% Spain University of Cordobaopen channels -> pipes 300 Million m3 per year France 15 Million Euros (0.05 €/m3) Interviews with experts
Earthen-> lined channels 10 to 25 % Global, medium length channel (200 to 2000m) FAO, irrigation manual 4.
Surface -> sprinkler 15% Global FAO, irrigation manual 4.Surface -> drip 30% Global Crop compatible with drip system FAO, irrigation manual 4.Drip irrigation 60% Southern Europe Crop compatible with drip system Massarutto. 2001
Sprinkler irrigation France + 140-345 €/ha as compared to furrow irrigation http://www.economie.eaufrance.fr/
Pivot irrigation France + 180-293 €/ha as compared to furrow irrigation http://www.economie.eaufrance.fr/
Drip irrigation France + 2 465-5 142 €/ha as compared to furrow irrigation http://www.economie.eaufrance.fr/
From furrow to drip irrigation 40% Israel Agriculture output multiplied by 12 http://www.damsreport.org/docs/kbase/contrib/opt159.pdf
From surface to micro-irrigation Cyprus
between 1 544€ and 3 890 €/ha investments, O&M costs
ranging from 50 €/ha to 347 €/ha
EEA. 2001
Improving irrigation scheduling Use of tensiometers and advise 30% Aquitaine region (France) INRA. 2006
High variation depending on crops alternatives
50% Maize -> sorghum France Market outlets.
No tillage technology Uncertain impact Depending on current cropping calendar
20% Orchards, Guadalquivir Spain Decrease of yield from 2 to 11% See case study Spain16.5% (rainy year) to 53% (dry year) grapevine (general) No impact on yield and quality
20% Maize (France)Reduction in yield compensated by reduced irrigation and drying
costsINRA. 2006
40% Wheat, Tunisia Decrease of yield of 13% Pereira, and al 200225% Potato, Tunisia Decrease of yield of 10% Pereira, and al 2003
10% of total water needs for i i ti
Portugal12% of total water needs for
i i tiItaly
Treatment with sand filtration 48-84 €/m3 for investments, 0.01-0.02 €/m3 for O&M
EEA. 2001
Treatment with reverse osmosis 151-193 €/m3 for investments, 0.26-0.27 €/m3 for O&M
EEA. 2001
Training, farm planning, new irrigation technology 25% Australia Increase in crop yields of 20%
reported Elliot.
new technologies (drip, sprinkler), improved farm practices, awareness
raising34% Turkey
Additional reduction in energy use by 30%, improvements in soil
salinity and waterloggingBurak et al. 2000
New technology, automatic management of irrigation systems, efficiency enhancement measures, coordination.
1 162 hm3 of water saved Spain 2 344 Million Euros (2 €/m3 of water saved)
Water metering, awareness and advise, volumetric pricing Between 1 000 m3/ha to 2 000 m3/ha Canada http://www.recherchepolitique.gc.ca/
ATM, new technologies & incentive pricing Spain
Investments of 7 000 €/ha for the pressurized network + 2 500
€/ha for drip systems at frm level
http://www.todomula.com/
A.N. Angelakisa and L. Bontoux, 2001
Water saving programmes
INRA,2006
Improving conveyance efficiency
Improving application efficiency
Wastewater reuse
Decreasing crops irrigation needs
Deficit irrigation
Replacement of high water consuming crops by crops with lower
requirements

EN 54 EN
4. TOURISM SECTOR
The following table summarises the main elements characterising the different water saving measures that have been identified for the tourism sector. Cost information for devices already described in the household sector is not repeated here. The following points can be pointed out:
• Total water savings for the different sub-sectors (camping sites, bed and breakfast, hotels) are between 30% and 50%.
• Savings for individual measures can be as high as 80% to 90%. Thus, identifying areas where such savings can take place is a priority.
• Savings in outdoor uses, which often represents a large share of the total uses of the hotel industry, can be around 50%-60%. This estimate is conservative, as savings as high as 75% are found in various literatures.
• Significant savings in water bills can be expected, in some cases combined with savings in energy bills when reduced water demand leads to reduced abstraction costs and reduced water heating costs.
• Payback periods are very short, always equal or lower to 3 years when reported. This would stress the significant advantages in installing water saving devices in the tourism sector.

EN 55 EN
Sub-sector Specific measures Expected water savings
in % (quantities in brackets)
Country Costs Benefits Pay-back period (in
years) Reference
Overall 10 to 20% France (Loire-Bretagne) - - - Office International de l’Eau (2005)
Camping site
Overall 45% Europe - - - Hamele and Eckhardt (2006)
Overall 52% Europe - - Hamele and Eckhardt (2006)
Metering 10 to 25% Europe - - - Lallana, 2001
Bed & Breakfast
Improved toilet flushing
-
(18 000 l of water saved per year for 50 flushes
per day)
UK - £ 300 saved per annum
(reduced energy and water bills)
- http://www.egeneration.co.uk/
Holiday houses
Information & awareness raising, installation of (free) water saving devices in houses, reuse of treated
effluent
15% for tourists (consumption reduced to
134 l/tourist/day)
Balearic Islands (Spain) - - - http://www.calvia.com
Overall 10 to 20% France (Loire-Bretagne) - - - Office International de l’Eau (2005)
Overall 14% to 37% France - - - Office International de l’Eau (2005)
Water saving devices in toilets and showers 7% United Kingdom - 400 € per year (reduction in
water bill) - ADEME (2007)
Overall
32%
(from 330 l/night to 224 l/night)
France - - - Own calculation based on Office International de l’Eau (2005) and ADEME (2007)
Overall 46% Europe - - - Hamele and Eckhardt (2006)
Hotels
Cistern ball cocks in toilet flushes 22% UK - - - http://www.egeneration.co.uk/

EN 56 EN
Sub-sector Specific measures Expected water savings
in % (quantities in brackets)
Country Costs Benefits Pay-back period (in
years) Reference
Improved toilet flushing
-
(45 625 l per year for 100 toilet flushes per day)
UK - - - http://www.egeneration.co.uk/
Water saving for appliances in rooms + plantation of local low water consuming
plants 33% Spain - - - Hamele and Eckhardt (2006)
Raising awareness of hotel consumers - UK Initial cost: £ 16 per room, Then £ 15 per
year
£ 840 per year (reduction in water bill) 0.1 http://www.egeneration.co.uk/
towels changed on guest’s request, replacement of new technology
washers, low flow water taps and toilet cisterns, wastewater reuse, training
31% Greece - - - www.ellinikietairia.gr/articles & www.grecotel.com
Comprehensive package of measures implemented
100% for maintaining pond water levels
(seawater) & golf course irrigation (treated
effluent)
Greece - - - http://www.portocarras.gr/home.htm
Cafés 70% Europe - - - Hamele and Eckhardt (2006)
Water saving measures in kitchen 30% Europe - - - Hamele and Eckhardt (2006)
Installation of waterless woks in Chinese restaurants
90%
(1 800 m3 per year per restaurant)
Australia - $ 4 500 per year (reduced water and energy bill) 1 http://www.sydneywater.com.au/ Restaurants &
cafés
Leak repairs, water saving toilet flushing & toilet cisterns
-
(725 000 m3 per year) UK
Investments at £ 800 000, Recurring
Costs at £ 50 000 per year
£ 1.1 Million per year 0.75 http://www.egeneration.co.uk/
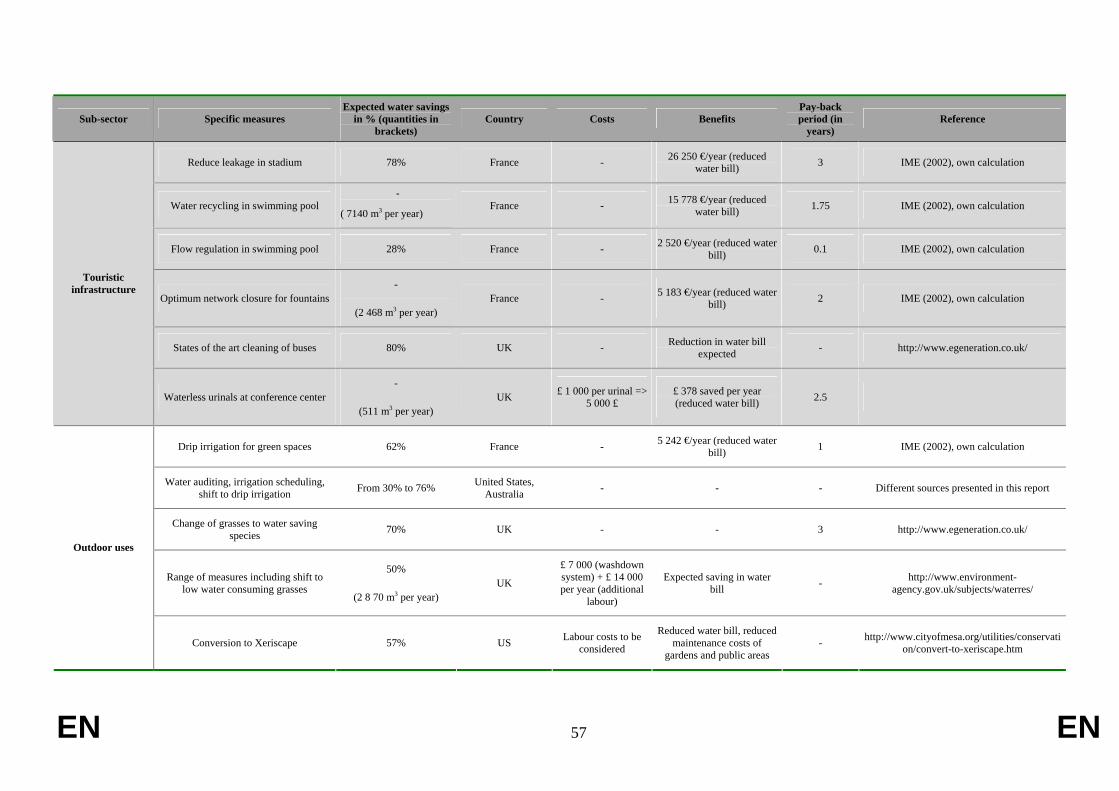
EN 57 EN
Sub-sector Specific measures Expected water savings
in % (quantities in brackets)
Country Costs Benefits Pay-back period (in
years) Reference
Reduce leakage in stadium 78% France - 26 250 €/year (reduced water bill) 3 IME (2002), own calculation
Water recycling in swimming pool -
( 7140 m3 per year) France - 15 778 €/year (reduced
water bill) 1.75 IME (2002), own calculation
Flow regulation in swimming pool 28% France - 2 520 €/year (reduced water bill) 0.1 IME (2002), own calculation
Optimum network closure for fountains -
(2 468 m3 per year) France - 5 183 €/year (reduced water
bill) 2 IME (2002), own calculation
States of the art cleaning of buses 80% UK - Reduction in water bill expected - http://www.egeneration.co.uk/
Touristic infrastructure
Waterless urinals at conference center -
(511 m3 per year) UK £ 1 000 per urinal =>
5 000 £ £ 378 saved per year (reduced water bill) 2.5
Drip irrigation for green spaces 62% France - 5 242 €/year (reduced water bill) 1 IME (2002), own calculation
Water auditing, irrigation scheduling, shift to drip irrigation From 30% to 76% United States,
Australia - - - Different sources presented in this report
Change of grasses to water saving species 70% UK - - 3 http://www.egeneration.co.uk/
Range of measures including shift to low water consuming grasses
50%
(2 8 70 m3 per year) UK
£ 7 000 (washdown system) + £ 14 000 per year (additional
labour)
Expected saving in water bill - http://www.environment-
agency.gov.uk/subjects/waterres/
Outdoor uses
Conversion to Xeriscape 57% US Labour costs to be considered
Reduced water bill, reduced maintenance costs of
gardens and public areas - http://www.cityofmesa.org/utilities/conservati
on/convert-to-xeriscape.htm

EN 58 EN
Sub-sector Specific measures Expected water savings in % (quantities in brackets) Country Costs Benefits
Pay-back period (in
years) Reference
Closed loop recycling 90% UK - - - Envirowise. 2005
Closed loop recycling with treatment 60% UK - - - Envirowise. 2005
Automatic shut-off 15% UK - - - Envirowise. 2005
Countercurrent rinsing 40% UK - - - Envirowise. 2005
Spray/jet upgrades 20% UK - - - Envirowise. 2005
Reuse of wash water 50% UK - - - Envirowise. 2005
Scrapers 30% UK - - - Envirowise. 2005
All sectors
Cleaning in place 60% UK - - - Envirowise. 2005
Transport Wastewater treatment and reuse 80% Hungary
US$80 000 investment +
US$1 600 after 10 years
Savings in water bill 1.3 years http://www.unep/org.jp/ietc/publications/
Overall savings 30% Catalonia - - - ICAEN. 1999
Leather industry Recycling wastewater (membrane
technology) 90% Sector-specific - - - COTANCE. 2002
Overall savings 28% Catalonia - - - ICAEN. 1999
Increased efficiency at water purification plant, optimise water
consumption
15% (- 35.5 Million m3/year) Sweden - - - http://www.sca.com/
Pulp & paper
Aero-cooling towers, monitoring 62% (- 32 m3 per ton of paper) France 5 Million €
investments
Reduction in water abstraction costs of 6 €/ton
of paper 2 years http://www.jeconomiseleau.org/
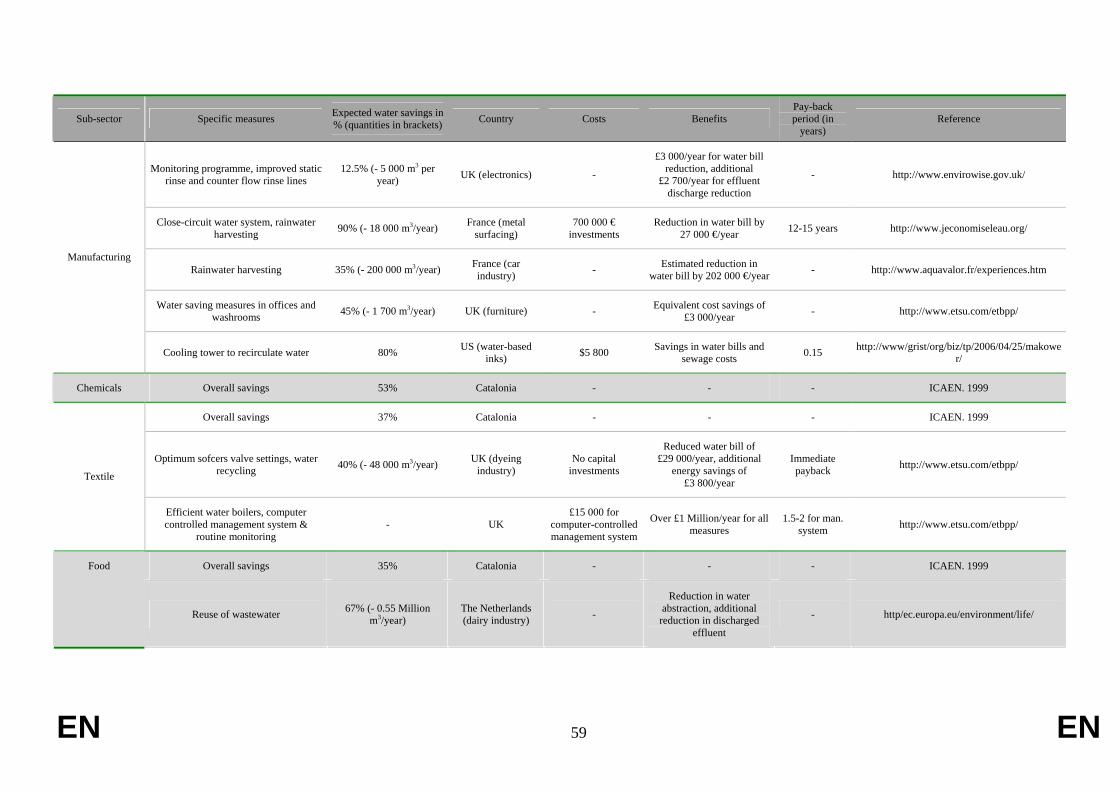
EN 59 EN
Sub-sector Specific measures Expected water savings in % (quantities in brackets) Country Costs Benefits
Pay-back period (in
years) Reference
Monitoring programme, improved static rinse and counter flow rinse lines
12.5% (- 5 000 m3 per year) UK (electronics) -
£3 000/year for water bill reduction, additional
£2 700/year for effluent discharge reduction
- http://www.envirowise.gov.uk/
Close-circuit water system, rainwater harvesting 90% (- 18 000 m3/year) France (metal
surfacing) 700 000 €
investments Reduction in water bill by
27 000 €/year 12-15 years http://www.jeconomiseleau.org/
Rainwater harvesting 35% (- 200 000 m3/year) France (car industry) - Estimated reduction in
water bill by 202 000 €/year - http://www.aquavalor.fr/experiences.htm
Water saving measures in offices and washrooms 45% (- 1 700 m3/year) UK (furniture) - Equivalent cost savings of
£3 000/year - http://www.etsu.com/etbpp/
Manufacturing
Cooling tower to recirculate water 80% US (water-based inks) $5 800 Savings in water bills and
sewage costs 0.15 http://www/grist/org/biz/tp/2006/04/25/makower/
Chemicals Overall savings 53% Catalonia - - - ICAEN. 1999
Overall savings 37% Catalonia - - - ICAEN. 1999
Optimum sofcers valve settings, water recycling 40% (- 48 000 m3/year) UK (dyeing
industry) No capital
investments
Reduced water bill of £29 000/year, additional
energy savings of £3 800/year
Immediate payback http://www.etsu.com/etbpp/
Textile
Efficient water boilers, computer controlled management system &
routine monitoring - UK
£15 000 for computer-controlled management system
Over £1 Million/year for all measures
1.5-2 for man. system http://www.etsu.com/etbpp/
Overall savings 35% Catalonia - - - ICAEN. 1999 Food
Reuse of wastewater 67% (- 0.55 Million m3/year)
The Netherlands (dairy industry) -
Reduction in water abstraction, additional reduction in discharged
effluent
- http/ec.europa.eu/environment/life/
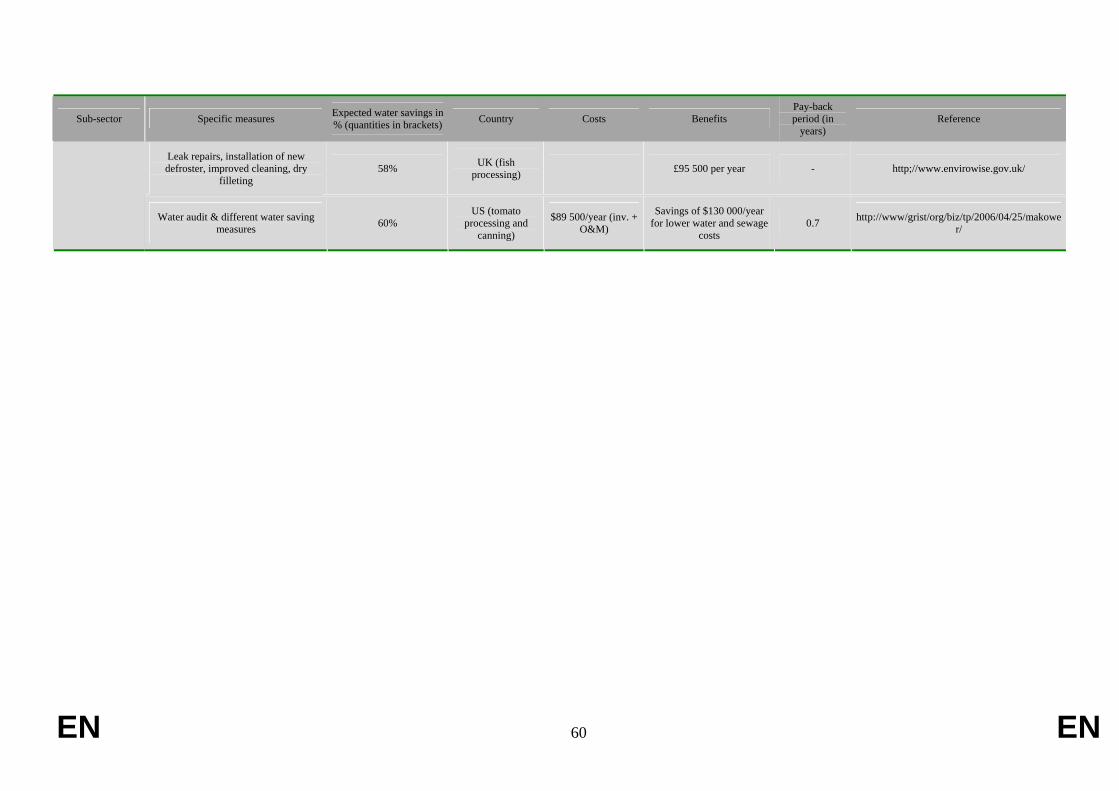
EN 60 EN
Sub-sector Specific measures Expected water savings in % (quantities in brackets) Country Costs Benefits
Pay-back period (in
years) Reference
Leak repairs, installation of new defroster, improved cleaning, dry
filleting 58% UK (fish
processing) £95 500 per year - http;//www.envirowise.gov.uk/
Water audit & different water saving measures 60%
US (tomato processing and
canning)
$89 500/year (inv. + O&M)
Savings of $130 000/year for lower water and sewage
costs 0.7 http://www/grist/org/biz/tp/2006/04/25/makowe
r/

EN 61 EN
5. ESTIMATION OF EU WATER SAVING POTENTIAL
The following table gives an overview of the EU water saving potential by sector.
Sector Today water use Today saving potential Water use in 2030
(baseline scenario)
Agriculture
(EU-27)
Around 65 898 Million m3 for 11.7 Million hectares equipped for irrigation
Estimated at 28 420 Million m3 or 43% of today’s total water abstraction – Most of the water savings (98%) take place in Southern
Europe
73 608 Million m3 per year (based on +11.3% increase for the period 2000-
2030)
Households Between 265l/p/d (Spain) and 85l/p/d (Lithuania) with an average of 150 l/p/d
Between 18 % and 47% assuming an average consumption of 122 l/p/d (UN
Sustainable Development Commission) and 80 l/p/d (UK Code for sustainable planning)
respectively
Domestic 73 222 Million m³ for EU 30 (563 Milllion inhabitants in 2000). Based ón Flörke, M.
Alcamo, J. (2004)
24 430 Million m3 or 33% based on 87 m³ /year (own calculations)
75 616 Million m3 20 for EU 30 (587 Million inhabitants) Based ón Flörke,
M. Alcamo, J. (2004)
Industry 39 737 million m³/year Based ón Flörke, M. Alcamo, J. (2004)
43% of total water use (14 360 Million m³) Based on the assumption that the sector has a average technical saving potential 50% but 25 % of the sector have already achieved the
maximum saving
56 943 million m3/year (95% increase) Based ón Flörke, M. Alcamo, J. (2004)
Electricity 94 973million m³/year Based ón Flörke, M. Alcamo, J. (2004)
Almost 100%according to the technical specifications provided in Electric Power
Research Institute (2002):
30 816million m3/year Based ón Flörke, M. Alcamo, J. (2004)
Tourism 490 million m³/year (own calculations) 38% or 188 million m³ litres/year
EN 62 EN
(EU 25)
EN 63 EN
The water saving potential has been estimated for each sector on the basis of the European Outlook on Water use further investigation carried out in the framework of the present study. This potential comes from technical improvements without major changes in human behaviour or production patterns. The saving potential coming from non-technical measures is not included in the calculation.
The outcomes presented in the table show that the current water saving potential (28 420 Mio m³) make it possible to compensate the increase in water use predicted between now and 2030 (73 608 – 65 898 Mio m³). It is therefore worth improving water demand management and progressing towards more water savings in all economic sectors.