worsened fundamentals lift downgrades well above upgrades › cdfa › cdfaweb.nsf › 0 ›...
TRANSCRIPT

WEEKLY MARKET OUTLOOK
OCTOBER 10, 2019
CAPITAL MARKETS RESEARCH
Moody’s Analytics markets and distributes all Moody’s Capital Markets Research, Inc. materials. Moody’s Capital Markets Research, Inc. is a subsidiary of Moody’s Corporation. Moody’s Analytics does not provide investment advisory services or products. For further detail, please see the last page.
Worsened Fundamentals Lift Downgrades Well Above Upgrades
Credit Markets Review and Outlook by John Lonski Worsened Fundamentals Lift Downgrades Well Above Upgrades
» FULL STORY PAGE 2
The Week Ahead We preview economic reports and forecasts from the US, UK/Europe, and Asia/Pacific regions.
» FULL STORY PAGE 6
The Long View Full updated stories and key credit market metrics: Third-quarter 2019’s US$-denominated corporate bond issuance included $29.1 billion of investment-grade and $14.8 billion of high-yield offerings from China-based issuers.
» FULL STORY PAGE 10
Ratings Round-Up U.S. Upgrades Match Downgrades but Dominate Affected Debt
» FULL STORY PAGE 14
Market Data Credit spreads, CDS movers, issuance.
» FULL STORY PAGE 17
Moody’s Capital Markets Research recent publications Links to commentaries on: Next recession, liquidity and defaults, cheap money, fallen angels, corporate credit, Fed moves, spreads, yields, inversions, unmasking danger, divining markets, upside risks, high leverage, revenues and profits, riskier outlook, confidence vs. skepticism.
» FULL STORY PAGE 22
Click here for Moody’s Credit Outlook, our sister publication containing Moody’s rating agency analysis of recent news events, summaries of recent rating changes, and summaries of recent research.
Credit Spreads
Investment Grade: We see year-end 2019’s average investment grade bond spread above its recent 128 basis points. High Yield: Compared with a recent 469 bp, the high-yield spread may approximate 480 bp by year-end 2019.
Defaults US HY default rate: Moody's Investors Service’s Default Report has the U.S.' trailing 12-month high-yield default rate rising from September 2019’s actual 3.2% to a baseline estimate of 3.7% for September 2020.
Issuance For 2018’s US$-denominated corporate bonds, IG bond issuance sank by 15.4% to $1.276 trillion, while high-yield bond issuance plummeted by 38.8% to $277 billion for high-yield bond issuance’s worst calendar year since 2011’s $274 billion. In 2019, US$-denominated corporate bond issuance is expected to rise by 4.2% for IG to $1.330 trillion, while high-yield supply grows by 35.3% to $376 billion. The very low base of 2018 now lends an upward bias to the yearly increases of 2019’s high-yield bond offerings.
Moody’s Analytics Research
Weekly Market Outlook Contributors: Moody's Analytics/New York: John Lonski Chief Economist 1.212.553.7144 [email protected] Moody's Analytics/Asia-Pacific: Katrina Ell Economist Steven Cochrane Economist Steven Shields Economist Moody's Analytics/Europe: Barbara Teixeira Araujo Economist Moody’s Analytics/U.S.: Ryan Sweet Economist Andrew Pak Data Services
Editor Reid Kanaley
Contact: [email protected]

CAPITAL MARKETS RESEARCH
2 OCTOBER 10, 2019 CAPITAL MARKETS RESEARCH / MARKET OUTLOOK / MOODYS.COM
Credit Markets Review and Outlook
Credit Markets Review and Outlook By John Lonski, Chief Economist, Moody’s Capital Markets Research, Inc.
Worsened Fundamentals Lift Downgrades Well Above Upgrades Financial markets have been buffeted by changing views regarding the trade dispute between China and the United States. Nevertheless, the direction taken by earnings-sensitive securities will ultimately be determined by the outlook for profits.
The recent showing by corporate earnings has been decidedly subpar. The FactSet consensus expects 2019’s third-quarter to show a third straight year-to-year decline of 4.1% by S&P 500 earnings per share. However, the consensus believes that 2019’s final quarter will end the losing streak and reveal a 2.6% annual increase by S&P 500 earnings. For 2020, the consensus view of equity analysts has S&P 500 earnings per share growing by an eye-opening 10.5%.
Early October 2019’s Blue Chip consensus has 2019’s core pretax profits inching higher by a worrisome 0.1% in 2019 following 2018’s subpar increase of 3.4%. For 2020, the Blue Chip prognosticators’ average forecast has core profits rising by a lackluster 2.0%.
If core profits do not significantly surpass these downbeat forecasts, the 10-year Treasury yield may average something no greater than 1.7% through the end of 2020. And if a recession materializes, the bottom will fall out for Treasury yields and the benchmark 10-year yield probably slips under 1%.
Credit rating revisions can be triggered by changes in the fundamentals influencing debt protection, special events, or some combination of special events and changed fundamentals. Special events are judged to be nonrecurring and include, but are not limited to, a change in the structure of outstanding debt, mergers, acquisitions, divestitures, equity buybacks, special dividends, infusions of common equity capital, and catastrophes.
For 2019’s third quarter, preliminary indications show a reduction in the credit ratings of 97 U.S. high-yield issuers, wherein 16 of the downgrades stemmed primarily from special events. The remaining 81 were largely the offshoot of worsened fundamentals.
Third-quarter 2019 also contained 56 upgrades of U.S. high-yield issuers. Special events were the primary drivers of 20 of the upgrades, while the remaining 36 stemmed mostly from improved fundamentals.
Thus, third-quarter 2019’s 1.73:1 downgrade per upgrade ratio for all U.S. high-yield credit rating revisions rose to 2.25:1 after excluding rating revisions that were primarily the consequence of special events. The latter is an atypically high downgrade per upgrade ratio for high-yield rating changes that are largely driven by fundamentals. The high-yield downgrade per upgrade ratio for rating changes that were primarily driven by fundamentals has soared from the 1.09:1 of calendar-year 2018 to the 2.38:1 of January-September 2019.
A Brighter Outlook Requires Faster Sales Growth
A pronounced slowing by business sales both with and excluding energy products helps to the explain the marked excess of high-yield downgrades over upgrades after omitting primarily event-driven rating changes. For example, the year-over-year increase of a proxy for business sales’ moving three-month average plunged from the 7.8% of July 2018 to the 1.0% of August 2019. After excluding sales of identifiable energy products, the comparably-measured increase of core business sales slowed from July 2018’s 5.6% to 1.7% for August 2019.

CAPITAL MARKETS RESEARCH
3 OCTOBER 10, 2019 CAPITAL MARKETS RESEARCH / MARKET OUTLOOK / MOODYS.COM
Credit Markets Review and Outlook
At least, the overall U.S. high-yield downgrade per upgrade ratio is not on a rising trend. After easing from first-quarter 2019’s 2.27:1 to the 1.90:1 of the second quarter, the overall high-yield downgrade per upgrade ratio dipped to the third quarter’s 1.73:1. Nevertheless, a further slowing of business sales would probably lift the relative incidence of high-yield downgrades.
A very weak performance by the business sales proxy both with and excluding energy products helped to drive the 2015-2016 surge in downgrades. The annual percent change of the moving three-month average of the business sales proxy went from growing by 4.8% in June 2014 to contracting by 2.8% as of December 2015. Core business sales’ annual increase slowed from September 2014’s 5.2% to January 2016’s 0.3%.
During the profits recession and industrial commodity price deflation of 2015-2016, the overall high-yield downgrade per upgrade ratio soared from the 0.99:1 of July 2009 through September 2015 to the 3.44:1 of 2015’s final quarter and 4.50:1 of 2016’s first quarter. However, the ratio quickly receded to the 1.66:1 of 2016’s second quarter.
Lower Energy Prices Skew Downgrade Ratio Higher
Nevertheless, the 4.00:1 high-yield downgrade per upgrade ratio of the six-months-ended March 2016 owed much to a collapse of energy prices. For example, the high-yield downgrade per upgrade ratio improved to 2.52:1 for the six-months-ended March 2016 after excluding high-yield rating revisions linked to the oil and gas industry’s slump.
Though the latest bout of oil and gas price deflation is less severe than what transpired in 2015-2016, third-quarter 2019’s high-yield downgrade per upgrade ratio falls from 1.73:1 to 1.54:1 after excluding oil and gas related rating changes. For January-September 2019, the high-yield downgrade per upgrade ratio declines from an overall 1.94:1 to 1.79:1 excluding oil and gas.
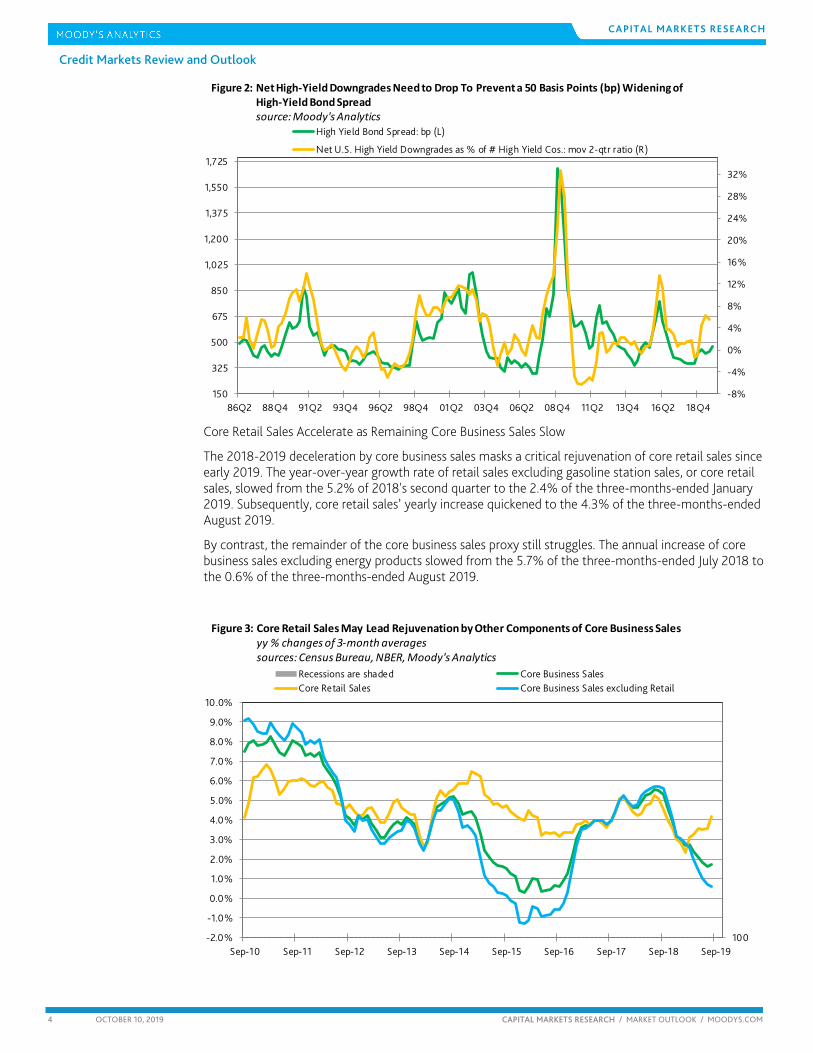
Fewer Downgrades Relative to Upgrades Needed to Prevent Spread Widening
As inferred from the broadest ratio of high-yield downgrades per upgrade, the recent high-yield bond spread of 469 basis points implicitly assumes a further slide by the relative incidence of downgrades. Otherwise, the high-yield bond spread is likely to exceed 500 bp.
100Dec-94 Mar-97 Jun-99 Sep-01 Dec-03 Mar-06 Jun-08 Sep-10 Dec-12 Mar-15 Jun-17 Sep-19
-18.0%
-15.0%
-12.0%
-9.0%
-6.0%
-3.0%
0.0%
3.0%
6.0%
9.0%
12.0%
Recessions are shadedEstimated Core Business Sales: moving 3-mo avgEstimated Core Business Sales: moving 12-mo avg
Figure 1: Further Slowdown by Core Business Sales Will Lift Recession Risk yy % changessources: Census Bureau, NBER, Moody's Analytics
CAPITAL MARKETS RESEARCH
4 OCTOBER 10, 2019 CAPITAL MARKETS RESEARCH / MARKET OUTLOOK / MOODYS.COM
Credit Markets Review and Outlook
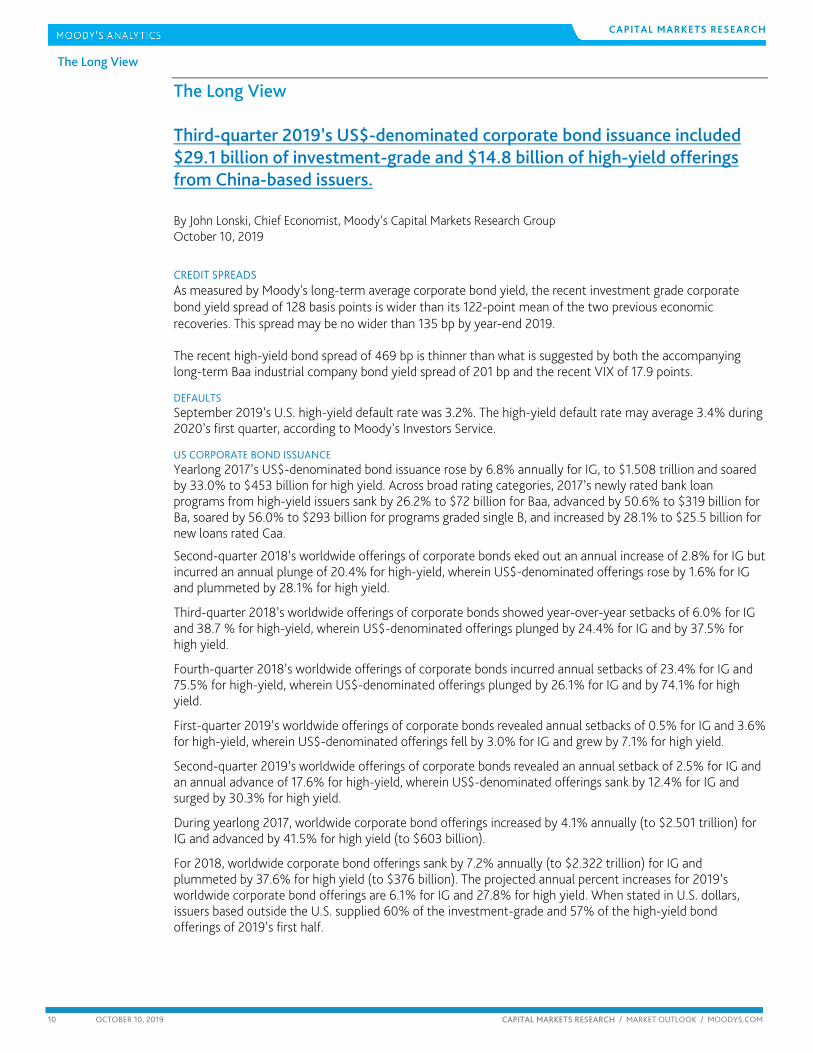
Core Retail Sales Accelerate as Remaining Core Business Sales Slow
The 2018-2019 deceleration by core business sales masks a critical rejuvenation of core retail sales since early 2019. The year-over-year growth rate of retail sales excluding gasoline station sales, or core retail sales, slowed from the 5.2% of 2018's second quarter to the 2.4% of the three-months-ended January 2019. Subsequently, core retail sales’ yearly increase quickened to the 4.3% of the three-months-ended August 2019.
By contrast, the remainder of the core business sales proxy still struggles. The annual increase of core business sales excluding energy products slowed from the 5.7% of the three-months-ended July 2018 to the 0.6% of the three-months-ended August 2019.
-8%
-4%
0%
4%
8%
12%
16%
20%
24%
28%
32%
86Q2 88Q4 91Q2 93Q4 96Q2 98Q4 01Q2 03Q4 06Q2 08Q4 11Q2 13Q4 16Q2 18Q4150
325
500
675
850
1,025
1,200
1,375
1,550
1,725
High Yield Bond Spread: bp (L)
Net U.S. High Yield Downgrades as % of # High Yield Cos.: mov 2-qtr ratio (R)
Figure 2: Net High-Yield Downgrades Need to Drop To Prevent a 50 Basis Points (bp) Widening ofHigh-Yield Bond Spreadsource: Moody's Analytics
100Sep-10 Sep-11 Sep-12 Sep-13 Sep-14 Sep-15 Sep-16 Sep-17 Sep-18 Sep-19
-2.0%
-1.0%
0.0%
1.0%
2.0%
3.0%
4.0%
5.0%
6.0%
7.0%
8.0%
9.0%
10.0%
Recessions are shaded Core Business SalesCore Retail Sales Core Business Sales excluding Retail
Figure 3: Core Retail Sales May Lead Rejuvenation by Other Components of Core Business Salesyy % changes of 3-month averagessources: Census Bureau, NBER, Moody's Analytics

CAPITAL MARKETS RESEARCH
5 OCTOBER 10, 2019 CAPITAL MARKETS RESEARCH / MARKET OUTLOOK / MOODYS.COM
Credit Markets Review and Outlook
Are Baa Yield Spreads Unduly Wide?
Much has been written about the rapid growth of Baa-grade corporate bonds outstanding. Nevertheless, the credit rating changes of Baa-rated industrial companies have shown fewer downgrades than upgrades since the end of 2017. For 2018, Baa credit rating changes of U.S. industrial companies included 20 downgrades and 22 upgrades. Through the first nine months of 2019, the Baa credit rating revisions of the Baa industrials showed 11 downgrades and 18 upgrades. However, 2019’s third quarter was home to an outsized “fallen angel” downgrade of Ford Motor.
Complacency is not warranted. The skeptical view of Baa ratings according to the bond implied ratings methodology might be proven correct if the latest slowdown by business sales continues.
On October 9, 122 North American industrial company issuers had a senior unsecured rating of Baa3, or the ratings notch just above high-yield. Moody’s Analytics was able to calculate bond-implied ratings for 109 of the 123 issuers graded Baa. Bond implied ratings frequently differ from actual ratings owing to market sentiment or demand/supply conditions. As derived from October 9’s pricing of corporate bonds, the market viewed 47 of the 109 eligible Baa3-grade issuers as having an implied rating of less than Baa3. Thus, a considerable 43.1% of 109 North American Baa3-rated issuers have a bond-implied-rating of less than Baa3, which equate to speculative-grade or high-yield ratings.
October 9’s distribution of bond-implied ratings for Baa3 industrial-company issuers compared unfavorably with that of year-end 2018. As of the end of 2018, bond-implied ratings were calculated for 113 of the then 121 Baa3-rated industrial company issuers. A smaller 33, or 29.2%, of the issuers generated a bond-implied rating of less than Baa3.
As of October 9, bond implied ratings were available for 157 of the 168 North American issuers graded Baa2. Of the 159 Baa2 implied ratings, 25, or 15.9%, were speculative grade. At the same time, bond-implied ratings were calculated for 101 of the 102 Baa1-grade issuers, wherein 6, or 5.9%, of the bond implied ratings conformed to a high-yield designation. Finally, October 9’s tally showed that of the 143 bond-implied ratings supplied by the 149 issuers rated above Baa1, only two were speculative-grade.
Year-end 2018’s tally showed a much lower incidence of implied speculative grade ratings. Of the 138 Baa2-grade issuers generating a bond-implied rating, only six, or 4.3%, were speculative-grade. Two, or 2.2%, of the 92 Baa1 issuers having a bond implied rating were speculative-grade, while just one high-yield rating was found among the 134 issuers rated above Baa1 who received bond implied ratings.
According to the bond-implied ratings approach, potential rising-star upgrades are very few compared to possible fallen-angel downgrades. For companies having speculative-grade ratings, only 12, or 2.7%, of October 9’s 440 implied ratings of high-yield issuers were investment-grade. That count was a similar 13 for both year-end 2018 and September 11, 2019.

The Week Ahead
CAPITAL MARKETS RESEARCH
6 OCTOBER 10, 2019 CAPITAL MARKETS RESEARCH / MARKET OUTLOOK / MOODYS.COM
The Week Ahead – U.S., Europe, Asia-Pacific
THE U.S. By Ryan Sweet of Moody’s Analytics
Disconnect Between Hard and Soft U.S. Data The September U.S. employment report highlights that even though businesses have turned more pessimistic, they are not laying off workers or aggressively cutting hours. Layoffs would be fodder for a recession. There is a disconnect between the hard and soft economic data, and this has happened before. Survey-based measures—soft data—are likely being hurt by the U.S.-China trade tensions along with chatter of a possible recession on the horizon.
The soft data this week rattled some, particularly the ISM manufacturing survey, as it dropped for the sixth consecutive month. Some of the drop is attributed to a reduction in manufacturing output but sentiment is also pulling the index lower.
The hard data and sentiment components of the ISM index aren't observable but can be estimated. To do so, we mapped the five components of the ISM manufacturing survey—new orders, production, supplier deliveries, inventories and employment—to hard data on manufacturing. We then modeled each component based on its hard data. The ISM’s methodology for constructing its composite index is applied to these new subindexes to create a hard-data ISM index. This ISM index is consistent with the actual data on employment, industrial production, new orders, inventories and supplier deliveries.
Our index based on hard data has tracked the official ISM manufacturing index well since 1995, with a correlation coefficient of 0.77. The value added in this approach is that it allows us to back out a sentiment component of the ISM index, or the difference between the actual and our hard-data ISM index. The results show that the bulk of the decline in the ISM manufacturing index over the past few months has been attributed to a decrease in sentiment to the lowest it's been since 2012.
Sentiment is unlikely to improve noticeably until the trade tensions are resolved and talk of a recession fades. Though sentiment is important at inflection points for the economy, for now businesses are not acting as they feel.

The Week Ahead
CAPITAL MARKETS RESEARCH
7 OCTOBER 10, 2019 CAPITAL MARKETS RESEARCH / MARKET OUTLOOK / MOODYS.COM
Next week There will be a number of key economic releases next week, including industrial production, retail sales and housing starts. We will also get new data on regional manufacturing conditions, jobless claims and business inventories.
We will publish our forecasts for next week’s data on Monday on Economy.com.
EUROPE By Barbara Teixeira Araujo of Moody’s Analytics
U.K. and EU Get One More Crack at a Brexit Plan
The European economic calendar is extremely full for the coming week. We will get a barrage of data for the U.K. economy—unemployment, wages, inflation and retail sales figures—as well as for the euro zone. In the currency area, the focus will be on industrial production numbers for August and September’s final CPI report. Euro zone industrial production numbers are being scrutinized by markets, because the trade war and the slowdown in global trade have dealt a heavy blow to the area’s exports and has caused its manufacturing sector to enter a full-blown recession. This is especially the case in Germany, given its outsized manufacturing industry and the country’s significant export dependency. In our view, overall euro zone industrial production held only steady in August, failing to reverse July’s 0.4% m/m fall. Data for individual countries have been extremely mixed, with production disappointing and falling by a 0.9% m/m in France but rising slightly in Germany and Italy. Yet monthly data are volatile and depend on the volatile energy sector—the output of which likely declined in August due to above-average temperatures. This suggests that manufacturing production performed a bit better, though it is expected to have continued a fast-paced decline in August.
The currency area’s final CPI report, meanwhile, is expected to confirm that headline inflation decelerated further in September, to only 0.9% y/y from 1%. This will corroborate our view that the European Central Bank was right to add stimulus to the economy during its last meeting. But the headline figure isn’t as bad as it looks; inflation in September was depressed by an expected drop in noncore inflation—mainly due to base effects related to oil prices—while underlying price pressures gathered pace on a rebound in services inflation. Also, the numbers were again distorted by a low harmonized services CPI in Germany (because of methodology changes), which contrasts with a much higher national rate. This dragging effect won’t last for long, though, as base effects are likely to kick in by year's end.
We continue to expect core inflation to heat up through the rest of 2019, not only because of the base effects in Germany but also in line with developments in the euro zone’s labour market. Yet, while the core rate should accelerate, it should do so only gradually and, most important, it should remain well below the ECB’s target of 2%. Our baseline is that it will remain at around 1.1%, as a further pickup in services inflation is unlikely to be accompanied by an increase in nonenergy goods inflation. This means that loose monetary policy should persist for the coming years. We aren't penciling in a further rate cut in 2019, but if inflation continues to disappoint, and growth prospects deteriorate further, we expect that the ECB won’t hesitate to up its rhetoric and use further firepower.
The inflation situation is different in the U.K. We expect that inflation pressures increased in September—we forecast a rise to 1.9% y/y from 1.7%—on the back of a rebound in recreational goods inflation. That’s because inflation in the volatile games and toys subsector plunged in August and was responsible for more than half of the headline’s decline over the month, warranting a correction in September. We are also penciling in a rebound in clothing inflation. Anecdotal evidence showed that the clothing and footwear subsector dragged in August only because summer sales were more aggressive and lasted longer this year than in 2018, which suggests that clothing prices rose more strongly between this August and September than they did last year, boosting inflation in the sector.

The Week Ahead
CAPITAL MARKETS RESEARCH
8 OCTOBER 10, 2019 CAPITAL MARKETS RESEARCH / MARKET OUTLOOK / MOODYS.COM
Combined, the developments in clothing and recreational goods are expected to offset yet another plunged in motor fuels inflation—due to base effects in Brent prices, a story similar to the euro zone’s.
Elsewhere in the U.K., the focus will remain on the Brexit politics. The EU Summit scheduled for next Thursday and Friday is the last official chance that the EU and the U.K. have to find an agreement. There has been no breakthrough in negotiations yet, and the EU is unlikely to accept Boris Johnson’s proposals of alternative arrangements for the Northern Ireland backstop. Our view remains that both parties will ultimately fail to reach common ground and that Brexit will need to be delayed yet again. Rumors are that, if no deal is found, the U.K. Prime Minister will call for a vote of no confidence in his government on October 19. We expect him to lose any such vote, which suggests that a caretaker government led by Jeremy Corbyn would likely send a letter to the EU asking for yet another extension of article 50 before triggering new elections to be held by the start of 2020.
ASIA-PACIFIC By Katrina Ell of Moody’s Analytics
A Tough Third Quarter for China’s Economy China’s GDP growth likely slowed to 5.9% y/y in the September quarter, from 6.2% previously. The third quarter has been tough for China’s economy. Retail trade has slowed substantially at the hand of changes to pollution regulation for autos. Industrial production neared a 20-year low in August and only modest improvement is forecast for September. Fixed asset investment has been trending lower, with manufacturing investment a particular drag, a symptom of the weakness in offshore demand exacerbated by the trade war. Stimulus this round has been deliberately measured, but the government is expected to deliver further monetary and fiscal stimulus heading into 2020 as it seeks to soften the economic downtrend.
Japan’s core CPI likely improved a notch to 0.6% y/y in September, from 0.5% in August. An important upward contributor will be fuel prices amid the spike in global prices. A jump is expected in consumer prices in the December quarter, following the introduction of the consumption tax hike on 1 October from 8% to 10%. But underlying price pressures are subdued; the important export and manufacturing sectors have slowed, while consumption has been sluggish, even with some evidence of front-loading prior to the tax increase.
India's inflation likely continued its gradual climb in September. Higher fuel and onion prices will be important upward contributors, potentially inhibiting the central bank’s ability to cut rates further. The Reserve Bank of India in October reduced the policy rate for a fifth straight meeting. The repo rate was reduced by 25 basis points to 5.15%, bringing cumulative easing to 135 basis points. The RBI maintained its accommodative stance, signalling that will remain the case as long as domestic demand needs the support. Onion prices jumped in September after flooding from heavy monsoons damaged crops. Onion prices were up to 80 rupees per kilogram, compared with around 20 to 25 rupees in July and August. The government has banned exports and released stockpiles in a bid to dampen prices, but this is causing angst with farmers. Onions are an important part of the CPI given they are a staple in
Key indicators Units Moody's Analytics Last
Mon @ 10:00 a.m. Euro zone: Industrial Production for August % change 0.0 -0.4
Tues @ 7:45 a.m. France: Consumer Price Index for September % change yr ago 1.1 1.3
Tues @ 9:30 a.m. U.K.: Unemployment for August % 3.8 3.8
Wed @ 9:30 a.m. U.K.: Consumer Price Index for September % change yr ago 1.9 1.7
Wed @ 10:00 a.m. Euro Zone: External Trade for August bil euro 17.4 24.8
Wed @ 10:00 a.m. Euro Zone: Consumer Price Index for September % change yr ago 0.9 1.0
Wed @ 10:00 a.m. Italy: Consumer Price Index for September % change yr ago 0.3 0.5
Wed @ 2:00 p.m. Russia: Industrial Production for September % change yr ago 2.6 2.9
Thur @ 9:30 a.m. U.K.: Retail Sales for September % change yr ago 2.9 2.7
Thur @ 2:00 p.m. Russia: Unemployment for September % 4.3 4.3
Thur @ 2:00 p.m. Russia: Retail Sales for August % change yr ago 1.0 0.8

The Week Ahead
CAPITAL MARKETS RESEARCH
9 OCTOBER 10, 2019 CAPITAL MARKETS RESEARCH / MARKET OUTLOOK / MOODYS.COM
cooking. High onion prices were blamed for the Bharatiya Janata Party losing the New Delhi vote in 1998. In 2013, it was onion prices that caused inflation to skyrocket. The RBI monetary policy committee next meets in early December.
Key indicators Units Confidence Risk Moody's Analytics Last
Mon @ 11:00 p.m. India Consumer price index for September % change yr ago 3 3.3 3.2
Tues @ 12:30 p.m. China Consumer price index for September % change yr ago 3 2.9 2.8
Tues @ 12:30 p.m. China Producer price index for September % change yr ago 3 -0.9 -0.8
Tues @ 3:00 p.m. Indonesia Foreign trade for September US$ bil 2 0.3 0.1
Tues @ Unknown India Foreign trade for September US$ bil 2 -13.9 -13.5
Wed @ 8:45 a.m. New Zealand Consumer price index for Q3 % change 3 0.5 0.6
Wed @ 10:00 a.m. South Korea Unemployment rate for September % 3 3.2 3.1
Wed @ Unknown South Korea Monetary policy for October % 3 1.5 1.5
Thurs @ 11:30 a.m. Australia Unemployment rate for September % 4 5.3 5.3
Thurs @ Unknown Singapore nonoil domestic exports for September % change yr ago 3 -8.1 -8.9
Fri @ 10:30 a.m. Japan Consumer price index for September % change yr ago 3 0.6 0.5
Fri @ 1:00 p.m. China GDP for Q3 % change yr ago 3 5.9 6.2
Fri @ 1:00 p.m. China Industrial production for September % change yr ago 3 4.6 4.4
Fri @ 1:00 p.m. China Fixed asset investment for September % change yr ago YTD 3 5.6 5.5
Fri @ 1:00 p.m. China Retail trade for September % change yr ago 3 7.4 7.5
10 OCTOBER 10, 2019 CAPITAL MARKETS RESEARCH / MARKET OUTLOOK / MOODYS.COM
CAPITAL MARKETS RESEARCH The Long View
d The Long View Third-quarter 2019’s US$-denominated corporate bond issuance included $29.1 billion of investment-grade and $14.8 billion of high-yield offerings from China-based issuers. By John Lonski, Chief Economist, Moody’s Capital Markets Research Group October 10, 2019
CREDIT SPREADS As measured by Moody's long-term average corporate bond yield, the recent investment grade corporate bond yield spread of 128 basis points is wider than its 122-point mean of the two previous economic recoveries. This spread may be no wider than 135 bp by year-end 2019.
The recent high-yield bond spread of 469 bp is thinner than what is suggested by both the accompanying long-term Baa industrial company bond yield spread of 201 bp and the recent VIX of 17.9 points.
DEFAULTS September 2019’s U.S. high-yield default rate was 3.2%. The high-yield default rate may average 3.4% during 2020’s first quarter, according to Moody’s Investors Service.
US CORPORATE BOND ISSUANCE Yearlong 2017’s US$-denominated bond issuance rose by 6.8% annually for IG, to $1.508 trillion and soared by 33.0% to $453 billion for high yield. Across broad rating categories, 2017’s newly rated bank loan programs from high-yield issuers sank by 26.2% to $72 billion for Baa, advanced by 50.6% to $319 billion for Ba, soared by 56.0% to $293 billion for programs graded single B, and increased by 28.1% to $25.5 billion for new loans rated Caa.
Second-quarter 2018’s worldwide offerings of corporate bonds eked out an annual increase of 2.8% for IG but incurred an annual plunge of 20.4% for high-yield, wherein US$-denominated offerings rose by 1.6% for IG and plummeted by 28.1% for high yield.
Third-quarter 2018’s worldwide offerings of corporate bonds showed year-over-year setbacks of 6.0% for IG and 38.7 % for high-yield, wherein US$-denominated offerings plunged by 24.4% for IG and by 37.5% for high yield.
Fourth-quarter 2018’s worldwide offerings of corporate bonds incurred annual setbacks of 23.4% for IG and 75.5% for high-yield, wherein US$-denominated offerings plunged by 26.1% for IG and by 74.1% for high yield.
First-quarter 2019’s worldwide offerings of corporate bonds revealed annual setbacks of 0.5% for IG and 3.6% for high-yield, wherein US$-denominated offerings fell by 3.0% for IG and grew by 7.1% for high yield.
Second-quarter 2019’s worldwide offerings of corporate bonds revealed an annual setback of 2.5% for IG and an annual advance of 17.6% for high-yield, wherein US$-denominated offerings sank by 12.4% for IG and surged by 30.3% for high yield.
During yearlong 2017, worldwide corporate bond offerings increased by 4.1% annually (to $2.501 trillion) for IG and advanced by 41.5% for high yield (to $603 billion).
For 2018, worldwide corporate bond offerings sank by 7.2% annually (to $2.322 trillion) for IG and plummeted by 37.6% for high yield (to $376 billion). The projected annual percent increases for 2019’s worldwide corporate bond offerings are 6.1% for IG and 27.8% for high yield. When stated in U.S. dollars, issuers based outside the U.S. supplied 60% of the investment-grade and 57% of the high-yield bond offerings of 2019’s first half.

11 OCTOBER 10, 2019 CAPITAL MARKETS RESEARCH / MARKET OUTLOOK / MOODYS.COM
CAPITAL MARKETS RESEARCH The Long View
d
US ECONOMIC OUTLOOK As inferred from the CME Group’s Fed Watch Tool, the futures market recently assigned an implied probability of 80% to a cutting of the federal funds rate at the October 30, 2019 meeting of the Federal Open Market Committee. In view of the underutilization of the world’s productive resources, low inflation should help to rein in Treasury bond yields. As long as the global economy operates below trend, the 10-year Treasury yield may not remain above 2.00% for long. A fundamentally excessive climb by Treasury bond yields and a pronounced slowing by expenditures in dynamic emerging market countries are among the biggest threats to the adequacy of economic growth and credit spreads.
EUROPE By Barbara Teixeira Araujo of Moody’s Analytics October 10, 2019
UNITED KINGDOM Although the contraction in U.K. GDP in August looks grim at first glance, what really matters in the GDP release is that the underlying growth momentum of the British economy was revised significantly upwards for the previous months. This meant that despite the monthly pullback, the rolling three-month rate, which is closely watched by markets because it is less volatile than monthly growth, still accelerated to 0.3%, back above the 0.2% average since the start of the year. Barring a plunge of 1.6% m/m or more in activity in September, which is highly unlikely, the U.K. economy should have avoided entering technical recession in the third quarter. This is in line with our forecasts; our baseline is that GDP grew by 0.3% to 0.4% q/q in the three months to September, after a 0.2% contraction previously. Our forecast is based on expectations that a new round of stockpiling will boost manufacturing production in September and October. Survey data corroborate our view, showing that internal and external manufacturing orders surged over the month. We don’t expect this new wave to be as strong as the one before the initial March deadline, though, since companies have much less spare capacity to increase inventories now because they didn’t fully unwind all of the previously accumulated stocks. But we do expect that manufacturing production expanded across most subsectors in September, especially as the broad-based declines in August created a low base for a mean-reversion. For the services sector, August’s figures were also a letdown. Services output remained flat over the month, but a slowdown was always expected following strong growth in June and July. Results across subsectors were mixed but mostly to the upside, with output rising across seven of 13 services subsectors and remaining flat in two of them. This chimes in with our view that the economy still has some underlying strength. Services output accounts for around 80% of all that is produced in the U.K. and is a far better indicator of the economy’s direction since it is less volatile and less affected by the ups and downs in the manufacturing industry. We maintain that services will continue to do the heavy lifting for the U.K. economy through the rest of 2019, especially as U.K. consumers remain strong on the back of rising wages and a still-solid labour market. Elsewhere, the bright spot of August’s report was the further rise in construction output. This result was welcome but a bit puzzling, since investment in construction is one of the hardest-hit segments of Brexit-related uncertainty. We think that September will bring a correction and that results for the sector will remain lackluster for as long as there is no clarity regarding the future of the U.K. economy. Overall, August’s results corroborate our view that the BoE will stand pat and avoid cutting interest rates this year if a no-deal Brexit is avoided. Wage growth is solid and inflation pressures are expected to pick up soon given the renewed decline in the pound, and this should keep CPI inflation slightly above the bank’s 2% target.
BREXIT Rumours were that talks with the EU had hit a brick wall on Tuesday after Prime Minister Boris Johnson’s phone call with German Chancellor Angela Merkel, but EU officials assured that negotiations were ongoing and that further
12 OCTOBER 10, 2019 CAPITAL MARKETS RESEARCH / MARKET OUTLOOK / MOODYS.COM
CAPITAL MARKETS RESEARCH The Long View
d meetings were scheduled. Our view is that striking a final deal remains unlikely, as the EU is expected to refuse the U.K. government’s proposal that Northern Ireland exit the customs union. The EU will likely insist that for there to be no border between Ireland and Northern Ireland, the region needs to remain aligned to the EU’s regulations and remain inside the same customs territory. Johnson is proposing that cutting-edge technology will eliminate the need for an actual physical border, but given that the technology hasn’t been developed yet, the EU remains skeptical. The Benn Act requires Johnson to send a letter to the EU asking for another Brexit delay if there is no deal by October 19. Rumours are that Johnson will try to circumvent the law, especially as he continues to insist that the U.K. will leave by October 31. One scenario is that he calls for a no-confidence vote in his own government by October 19, after the EU Summit on October 17-18. He would make a victory conditional on Parliament approving his actions, effectively cancelling the Benn Act, which would open the way for a no-deal Brexit on October 31. But given that a majority in Parliament is still against no deal, the chances of him winning such a vote are practically nil. If he loses, a caretaker government would need to be formed, and the leader of this government would ask the EU for an extension to allow for new elections. Although time would be running short, we have no doubt the EU would do whatever it takes to grant the extension and prevent a no-deal Brexit from happening.
ASIA PACIFIC By Steven Cochrane and Steven Shields of Moody’s Analytics October 10, 2019
VIETNAM A small but dominant player in Southeast Asia, Vietnam’s economy continues to race ahead. The nation’s record expansion has exhibited few signs of slowing, with real GDP growth exceeding 6% for the past decade, a feat only a small number of emerging markets have achieved. What’s more, in 2018 Vietnam outstripped Chinese GDP growth for the first time in nearly three decades. The country’s service sector continues to perform particularly well thanks to sustained domestic demand and increased private consumption.
Small pockets of weakness are beginning to emerge. Agricultural outputs have dampened following the African swine fever outbreak across Asia. Nearly 5 million hogs have been culled to date. Additionally, weaker external demand has moderated growth within Vietnam’s export-oriented manufacturing sector. The near-term outlook reflects optimism that this recent weakness will diminish, as renewed export growth and steady inflows of foreign direct investment underpin continued expansion. But risks are firmly tilted to the downside.
The country’s robust economic expansion has been powered by its transformation into a global manufacturing hub. Vietnam has been a rising star economically following broad-based reforms introduced under the country’s Doi Moi policy in 1986. Under Doi Moi, Vietnam began its transition from a centrally planned economy to the socialist-oriented market economy of today. The policy promotes privately owned and foreign-owned enterprises and enhanced national competitiveness by removing price controls, focusing on infrastructure improvements, and disbanding government monopolies. The shift to a market-based economy has been slow but has borne fruit in the form of strong inflows of foreign investment, trade pacts, and the debut of the Ho Chi Minh City Stock Exchange at the turn of the century.
High inflation and the global financial crisis led a sharp drop in foreign capital entering the country in 2009, but Vietnam’s government and central bank have managed inflation well through the past decade despite a rapidly expanding economy. More recently, pricing pressures have eased following a brief period of above-target inflation in 2018. Year-to-date CPI increased just 2.6% in July, its lowest growth rate in three years. Record-high consumer confidence, rising incomes, and reduced price pressures will lift private domestic consumption. The exchange rate has also been stable relative to other currencies that have weakened against the U.S. dollar in 2019.
Foreign direct investment reached a record high in 2018 for the sixth consecutive year, according to the United Nations Conference on Trade and Development, but recent trends portend a slowdown in 2019. According to the Ministry of Planning and Investment, Vietnam attracted $22.6 billion in foreign direct investment through July, down 7.1% compared with last year. The manufacturing and processing industry is the largest single recipient of investment, making factories responsible for more than two-thirds of pledges. Hanoi has received the largest share of foreign investment, with Ho Chi Minh City and Binh Duong serving as the second and third largest recipients of foreign investment.
13 OCTOBER 10, 2019 CAPITAL MARKETS RESEARCH / MARKET OUTLOOK / MOODYS.COM
CAPITAL MARKETS RESEARCH The Long View
d On September 13, the State Bank of Vietnam surprised with a 25-basis point interest rate cut, lowering its discount rates to 6% and 4%. With inflation anchored below the target ceiling of 4%, Moody’s Analytics anticipates that the State Bank of Vietnam will return to its neutral stance in the near term. The SBV is largely content with how economic conditions are playing out this year, but the insurance cut will provide additional support for economic growth while also increasing liquidity within the banking system.
Paring back credit growth The SBV continues to pare back credit growth, having mandated banks to incorporate Basel II standards by 2020. These risk management protocols coupled with tighter lending standards will ensure that financial institutions are adequately capitalized, which the central bank hopes will alleviate concerns over the nation’s banking system after the proliferation of bad debt forced the central bank to intervene in 2012.
As an emerging market, Vietnam relies heavily on the exports of natural resources, textiles and, to an increasing degree, the manufacturing of electronics and broadcasting equipment.
The fallout of the trade war between the U.S. and China has proven advantageous for Vietnam as Chinese manufacturers shift production into the country to evade U.S. tariffs. Therefore, Vietnam is one of the few countries in the region to experience a pickup in exports in 2019. As Vietnam has become a relatively more attractive destination for manufacturers in the region, its overall export volume has increased. Exports were up 11.2% on the year in April, though growth has slowed compared with last year.
Not only are Chinese producers moving operations to Vietnam, but U.S. consumers are also purchasing more Vietnamese-produced goods, evidenced by a 27% increase in U.S. imports from Vietnam during the first six months of 2019. These trends are also providing stability for the country’s equity markets. The Ho Chi Minh Stock Index rose approximately 10% year to date through August, far outperforming the MSCI emerging markets ETF, which lost value over the same period.
Despite these positive developments, the rapidly expanding economy is not without its growing pains. Supply chains are not nearly as fleshed out as in China due to inadequate infrastructure. Development will be key as officials plan to invest in new expressways, ports, airports and railways. Hanoi and Ho Chi Minh City are also building mass transit systems, with Hanoi’s expected to be fully operational by 2020. According to Vietnamese officials, foreign direct investment will be needed to fund many of these infrastructure enhancements. The government lacks the fiscal capacity to tackle these projects on its own. Even with funding secured, infrastructure upgrades will take time.
Risk of undoing Benefiting from the U.S.-China trade war does not come without repercussions. The trade balance between the U.S. and Vietnam is heavily tilted in Vietnam’s favor, making the nation increasingly vulnerable to accusations of a one-sided relationship. U.S. President Donald Trump has already taken notice of this dynamic, stating, “Vietnam is the single-worst abuser of everybody,” when questioned if he planned to impose tariffs on Vietnam. Weeks later, the U.S. Department of Commerce enacted duties of more than 400% on Vietnam steel imports. The economic impact of these tariffs will be limited, since metal accounts for less than 1% of total exports, but further punitive measures by the U.S. risk undoing the many benefits that have taken hold since the onset of the U.S.-China trade tensions. Additionally, Vietnam was one of nine countries placed on a currency manipulation watch list by the Trump administration in May, citing the rising trade and current account surplus with the U.S.
Properly navigating the country’s relationship with the U.S. will be crucial for Vietnam to be viewed as one of the rare winners associated with the U.S.-China trade war. Vietnam’s relationship with the U.S. has been friendly since the two nations formalized diplomatic relations in 1995, while its close proximity, government stability, and increasingly business-friendly environment have attracted increased Chinese capital. Aware of this dependence on both Chinese and American consumers, Vietnam’s government leaders have been effective in diversifying the nation’s trade relationships. On June 30, for example, the country signed a deal with the EU that will eliminate nearly all duties on goods.

14 OCTOBER 10, 2019 CAPITAL MARKETS RESEARCH / MARKET OUTLOOK / MOODYS.COM
CAPITAL MARKETS RESEARCH Ratings Round-Up
Ratings Round-Up
U.S. Upgrades Match Downgrades but Dominate Affected Debt By Steven Shields Eight U.S. credit rating changes were administered in the period ending October 7. Upgrades matched the number of downgrades in the period, but positive ratings changes accounted for 85% of total debt affected. Cheniere Corpus Christi Holdings LLC received an upgrade to Ba1 from Ba2 following the company’s completion of certain milestones over the last six months to improve its credit profile and supports the Corpus Christi Liquefaction facility’s transition to an operating, cash flow producing asset. The change affected approximately $4.3 billion in outstanding debt. The outlook remains positive going forward as operational activities ramp-up in the near term. Church & Dwight Co. Inc. experienced the most significant rating change during the period with an upgrade to A3 from Ba1 on the company’s senior unsecured debt. The company’s improved credit profile reflects its increasing scale, and improved product diversity over the past several years. Murray Energy Corporation received the most notable negative credit change in the period after received a downgraded from Caa3 to C. Moody’s Investors Service expects the coal producer to purse a debt restructuring following its missed interest payment on September 30, 2019. Meanwhile, European rating activity strengthened last week with upgrades outnumbering downgrades four-to-two. Three upgrades were given to companies based in the Czech Republic following the country’s upgraded outlook administered on October 4.
FIGURE 1
Rating Changes - US Corporate & Financial Institutions: Favorable as % of Total Actions
0.0
0.2
0.4
0.6
0.8
1.0
0.0
0.2
0.4
0.6
0.8
1.0
Aug00 Oct03 Dec06 Feb10 Apr13 Jun16 Aug19
By Count of Actions By Amount of Debt Affected
* Trailing 3-month average
Source: Moody's

15 OCTOBER 10, 2019 CAPITAL MARKETS RESEARCH / MARKET OUTLOOK / MOODYS.COM
CAPITAL MARKETS RESEARCH Ratings Round-Up
FIGURE 2
Rating Key
BCF Bank Credit Facility Rating MM Money-MarketCFR Corporate Family Rating MTN MTN Program RatingCP Commercial Paper Rating Notes NotesFSR Bank Financial Strength Rating PDR Probability of Default RatingIFS Insurance Financial Strength Rating PS Preferred Stock RatingIR Issuer Rating SGLR Speculative-Grade Liquidity Rating
JrSub Junior Subordinated Rating SLTD Short- and Long-Term Deposit RatingLGD Loss Given Default Rating SrSec Senior Secured Rating LTCF Long-Term Corporate Family Rating SrUnsec Senior Unsecured Rating LTD Long-Term Deposit Rating SrSub Senior SubordinatedLTIR Long-Term Issuer Rating STD Short-Term Deposit Rating
FIGURE 3
Rating Changes: Corporate & Financial Institutions – US
Date Company Sector RatingAmount
($ Million)Up/
Down
Old LTD
Rating
New LTD
Rating
IG/SG
10/3/19CHENIERE CORPUS CHRISTI HOLDINGS, LLC
Industrial SrSec 4,250 U Ba2 Ba1 SG
10/4/19MURRAY ENERGY CORPORATION
IndustrialSrSec/BCF
/LTCFR/PDR1,747 D Caa3 C SG
10/4/19EPE HOLDINGS LLC-EP ENERGY LLC
Industrial PDR D Ca D SG
10/4/19ASHLAND GLOBAL HOLDINGS INC.-ASHLAND LLC
IndustrialSrUnsec/LTCFR
/JrSub/PDR3,065 U Ba3 Ba1 SG
10/7/19CHURCH & DWIGHT COMPANY, INC.
Industrial SrUnsec 1,825 U Baa1 A3 IG
10/7/19BRIGGS & STRATTON CORPORATION
Industrial SrUnsec 390 D B2 Caa1 SG
10/7/19 PARSLEY ENERGY LLC IndustrialSrUnsec
/LTCFR/PDR2,200 U B1 Ba3 SG
10/7/19AT HOME GROUP INC.-AT HOME HOLDING III INC.
IndustrialSrSec/BCF
/LTCFR/PDRD B2 B3 SG

16 OCTOBER 10, 2019 CAPITAL MARKETS RESEARCH / MARKET OUTLOOK / MOODYS.COM
CAPITAL MARKETS RESEARCH Ratings Round-Up
FIGURE 4
Rating Changes: Corporate & Financial Institutions – Europe
Date Company Sector RatingUp/
Down
Old LTD
Rating
New LTD
Rating
IG/SG
Country
10/7/19CESKA EXPORTNI BANKA, A.S.
FinancialSrUnsec/SrSec
/BCF/LTIR/MTNU A1 Aa3 IG
CZECH REPUBLIC
10/7/19 OCI N.V. Industrial SrSec U B1 Ba3 SG NETHERLANDS
10/7/19CHEPLAPHARM ARZNEIMITTEL GMBH
IndustrialSrSec/BCF
/LTCFR/PDRD B1 B2 SG GERMANY
10/7/19MOTION MIDCO LIMITED-MERLIN ENTERTAINMENTS PLC
Industrial SrUnsec D Ba2 Ba3 SGUNITED
KINGDOM
10/8/19 CEPS, A.S. Utility LTIR U A1 Aa3 IGCZECH
REPUBLIC
10/8/19 LETISTE PRAHA, A.S. Industrial LTIR U A1 Aa3 IGCZECH
REPUBLIC

17 OCTOBER 10, 2019 CAPITAL MARKETS RESEARCH / MARKET OUTLOOK / MOODYS.COM
CAPITAL MARKETS RESEARCH
Market Data
Market Data Spreads
0
200
400
600
800
0
200
400
600
800
2003 2004 2005 2006 2007 2008 2009 2010 2011 2012 2013 2014 2015 2016 2017 2018 2019
Spread (bp) Spread (bp) Aa2 A2 Baa2
Source: Moody's
Figure 1: 5-Year Median Spreads-Global Data (High Grade)
0
400
800
1,200
1,600
2,000
0
400
800
1,200
1,600
2,000
2003 2004 2005 2006 2007 2008 2009 2010 2011 2012 2013 2014 2015 2016 2017 2018 2019
Spread (bp) Spread (bp) Ba2 B2 Caa-C
Source: Moody's
Figure 2: 5-Year Median Spreads-Global Data (High Yield)

18 OCTOBER 10, 2019 CAPITAL MARKETS RESEARCH / MARKET OUTLOOK / MOODYS.COM
CAPITAL MARKETS RESEARCH
Market Data
CDS Movers
CDS Implied Rating Rises
Issuer Oct. 9 Oct. 2 Senior RatingsIron Mountain Incorporated A3 Baa2 Ba3Diamond Offshore Drilling, Inc. Caa3 C B3YRC Worldwide Inc. Caa2 Ca Caa1Citigroup Inc. Baa1 Baa2 A3McDonald's Corporation Aa1 Aa2 Baa1Bristol-Myers Squibb Company Aa2 Aa3 A2Procter & Gamble Company (The) Aaa Aa1 Aa3HCA Inc. Ba1 Ba2 Ba2American Express Company Aa3 A1 A3Union Pacific Corporation Aa1 Aa2 Baa1
CDS Implied Rating DeclinesIssuer Oct. 9 Oct. 2 Senior RatingsPolyOne Corporation Baa2 A2 Ba3Burlington Resources, Inc. A3 A1 A3PepsiCo, Inc. A2 A1 A1Occidental Petroleum Corporation Ba1 Baa3 Baa3Enterprise Products Operating, LLC Baa2 Baa1 Baa1Bank of New York Mellon Corporation (The) A2 A1 A1Intel Corporation A2 A1 A1U.S. Bancorp Aa3 Aa2 A1Eli Lilly and Company Aa3 Aa2 A2Plains All American Pipeline L.P. Ba3 Ba2 Ba1
CDS Spread IncreasesIssuer Senior Ratings Oct. 9 Oct. 2 Spread DiffChesapeake Energy Corporation B2 1,523 1,377 146Neiman Marcus Group LTD LLC Ca 5,478 5,363 115Nabors Industries Inc. B1 1,257 1,190 67United States Steel Corporation B3 799 752 48Hertz Corporation (The) B3 417 379 38Navistar International Corp. B3 390 355 35AK Steel Corporation B3 1,144 1,117 27Occidental Petroleum Corporation Baa3 118 92 26PolyOne Corporation Ba3 66 48 18DPL Inc. Ba1 354 336 18
CDS Spread DecreasesIssuer Senior Ratings Oct. 9 Oct. 2 Spread DiffFrontier Communications Corporation Caa3 7,614 10,489 -2,875Dean Foods Company Caa3 2,928 3,221 -293Rite Aid Corporation Caa2 1,902 2,150 -248Diamond Offshore Drilling, Inc. B3 875 1,009 -133Penney (J.C.) Corporation, Inc. Caa3 2,968 3,089 -120Dole Food Company, Inc. Caa1 198 247 -49K. Hovnanian Enterprises, Inc. Caa3 1,834 1,869 -34AutoNation, Inc. Baa3 424 455 -30Realogy Group LLC B3 900 928 -28Staples, Inc. B3 505 529 -24
Source: Moody's, CMA
CDS Spreads
CDS Implied Ratings
CDS Implied Ratings
CDS Spreads
Figure 3. CDS Movers - US (October 2, 2019 – October 9, 2019)

19 OCTOBER 10, 2019 CAPITAL MARKETS RESEARCH / MARKET OUTLOOK / MOODYS.COM
CAPITAL MARKETS RESEARCH
Market Data
CDS Implied Rating Rises
Issuer Oct. 9 Oct. 2 Senior RatingsPiraeus Bank S.A. Caa2 Ca Caa2Banque Federative du Credit Mutuel Aa3 A1 Aa3Alpha Bank AE Caa1 Caa2 Caa1Casino Guichard-Perrachon SA Caa1 Caa2 B1Italy, Government of Ba1 Ba1 Baa3United Kingdom, Government of Aa2 Aa2 Aa2Germany, Government of Aaa Aaa AaaNatixis Baa1 Baa1 A1Belgium, Government of Aaa Aaa Aa3Rabobank Aa1 Aa1 Aa3
CDS Implied Rating DeclinesIssuer Oct. 9 Oct. 2 Senior RatingsFrance, Government of Aa1 Aaa Aa2Spain, Government of A1 Aa3 Baa1Portugal, Government of A1 Aa3 Baa3Finland, Government of Baa1 A3 Aa1Nationwide Building Society Baa1 A3 Aa3Electricite de France Baa1 A3 A3UniCredit Bank AG Baa1 A3 A2Vodafone Group Plc Baa2 Baa1 Baa2Bayerische Motoren Werke Aktiengesellschaft Baa1 A3 A1UniCredit Bank Austria AG A3 A2 Baa1
CDS Spread IncreasesIssuer Senior Ratings Oct. 9 Oct. 2 Spread DiffPizzaExpress Financing 1 plc Caa2 9,435 6,164 3,271Boparan Finance plc Caa1 2,720 2,028 692CMA CGM S.A. Caa1 1,759 1,503 256Novafives S.A.S. Caa2 858 731 126Matalan Finance plc Caa1 954 844 110Vedanta Resources Limited B2 567 521 46Atlantia S.p.A. Baa3 242 200 42Altice Finco S.A. Caa1 344 319 25Ardagh Packaging Finance plc B3 224 200 24Iceland Bondco plc Caa2 609 585 24
CDS Spread DecreasesIssuer Senior Ratings Oct. 9 Oct. 2 Spread DiffEurobank Ergasias S.A. Caa1 702 715 -13Sunrise Communications Holdings S.A. B1 79 91 -11National Bank of Greece S.A. Caa1 550 559 -9Banca Monte dei Paschi di Siena S.p.A. Caa1 375 382 -7NXP B.V. Baa3 140 145 -4Banque Federative du Credit Mutuel Aa3 37 39 -2Unione di Banche Italiane S.p.A. Baa3 122 124 -2Centrica plc Baa1 116 118 -2Koninklijke KPN N.V. Baa3 78 80 -2Alliander N.V. Aa2 47 49 -2
Source: Moody's, CMA
CDS Spreads
CDS Implied Ratings
CDS Implied Ratings
CDS Spreads
Figure 4. CDS Movers - Europe (October 2, 2019 – October 9, 2019)

20 OCTOBER 10, 2019 CAPITAL MARKETS RESEARCH / MARKET OUTLOOK / MOODYS.COM
CAPITAL MARKETS RESEARCH
Market Data
Issuance
FIGURE 5
Market Cumulative Issuance - Corporate & Financial Institutions: USD Denominated
0
600
1,200
1,800
2,400
0
600
1,200
1,800
2,400
Jan Feb Mar Apr May Jun Jul Aug Sep Oct Nov Dec
Issuance ($B) Issuance ($B)2016 2017 2018 2019
Source: Moody's / Dealogic
FIGURE 6
Market Cumulative Issuance - Corporate & Financial Institutions: EURO Denominated
0
200
400
600
800
1,000
0
200
400
600
800
1,000
Jan Feb Mar Apr May Jun Jul Aug Sep Oct Nov Dec
Issuance ($B) Issuance ($B)2016 2017 2018 2019
Source: Moody's / Dealogic

21 OCTOBER 10, 2019 CAPITAL MARKETS RESEARCH / MARKET OUTLOOK / MOODYS.COM
CAPITAL MARKETS RESEARCH
Market Data
FIGURE 7
Issuance: Corporate & Financial Institutions
Investment-Grade High-Yield Total*Amount Amount Amount
$B $B $BWeekly 10.908 5.725 17.803
Year-to-Date 1,102.114 328.012 1,514.015
Investment-Grade High-Yield Total*Amount Amount Amount
$B $B $BWeekly 12.205 1.817 14.414
Year-to-Date 673.315 74.920 769.976* Difference represents issuance with pending ratings.Source: Moody's/ Dealogic
USD Denominated
Euro Denominated

22 OCTOBER 10, 2019 CAPITAL MARKETS RESEARCH / MARKET OUTLOOK / MOODYS.COM
CAPITAL MARKETS RESEARCH
Moody’s Capital Markets Research recent publications
Next Recession May Lower 10-year Treasury Yield to Range of 0.5% to 1% (Capital Markets Research)
Abundant Liquidity Suppresses Defaults (Capital Markets Research)
Cheap Money in Action (Capital Markets Research)
Bond Implied Ratings Hint of More Fallen-Angel Downgrades (Capital Markets Research)
Leading Credit-Risk Indicator Signals A Rising Default Rate (Capital Markets Research)
Upon Further review, Aggregate Financial Metrics Worsen (Capital Markets Research)
Faster Loan Growth Would Bode Poorly for Corporate Credit Quality (Capital Markets Research)
Likelihood of a 1.88% Fed Funds Rate by End of July Soars (Capital Markets Research)
Market Implied Ratings Differ on the Likely Direction of Baa3 Ratings (Capital Markets Research)
Below-Trend Spreads Bank on Profits Growth, Lower Rates and Healthy Equities (Capital Markets Research)
Global Collapse by Bond Yields Stems from Worldwide Slowdown (Capital Markets Research)
Borrowing Restraint Likely Despite Lower Interest Rates (Capital Markets Research)
The Fed Cured 1998's Yield Curve Inversion (Capital Markets Research)
Extended Yield Curve Inversion Would Presage Wide Spreads and Many Defaults (Capital Markets Research)
Business Debt's Mild Rise Differs Drastically from 2002-2007's Mortgage Surge (Capital Markets Research)
Earnings Slump Would Unmask Dangers of High Leverage (Capital Markets Research)
Credit May Again Outshine Equities at Divining Markets' Near-Term Path (Capital Markets Research)
Not Even the Great Depression Could Push the Baa Default Rate Above 2% (Capital Markets Research)
Benign Default Outlook Implies Profits Will Outrun Corporate Debt (Capital Markets Research)
Upside Risks to the U.S. Economy (Capital Markets Research)
Outstandings and Rating Changes Supply Radically Different Default Outlooks (Capital Markets Research)
High Leverage Offset by Ample Coverage of Net Interest Expense (Capital Markets Research)
Subdued Outlook for Revenues and Profits Portend Lower Interest Rates (Capital Markets Research)
Fed Will Cut Rates If 10-Year Yield Breaks Under 2.4% (Capital Markets Research)
Riskier Outlook May Slow Corporate Debt Growth in 2019 (Capital Markets Research)
Replay of Late 1998's Drop by Interest Rates May Materialize (Capital Markets Research)
High-Yield Might Yet Be Challenged by a Worsened Business Outlook (Capital Markets Research)
Default Outlook Again Defies Unmatched Ratio of Corporate Debt to GDP (Capital Markets Research)
Equity Analysts' Confidence Contrasts with Economists' Skepticism
Fed's Pause May Refresh a Tiring Economic Recovery (Capital Markets Research)
Rising Default Rate May be Difficult to Cap (Capital Markets Research)
Baa-Grade Credits Dominate U.S. Investment-Grade Rating Revisions (Capital Markets Research)
Upper-Tier Ba Rating Comprises Nearly Half of Outstanding High-Yield Bonds (Capital Markets Research)

23 OCTOBER 10, 2019 CAPITAL MARKETS RESEARCH / MARKET OUTLOOK / MOODYS.COM
CAPITAL MARKETS RESEARCH
To order reprints of this report (100 copies minimum), please call 212.553.1658.
Report Number: 1198640 Contact Us
Editor Reid Kanaley [email protected]
Americas: 1.212.553.4399
Europe: +44 (0) 20.7772.5588
Asia: 813.5408.4131
24 OCTOBER 10, 2019 CAPITAL MARKETS RESEARCH / MARKET OUTLOOK / MOODYS.COM
CAPITAL MARKETS RESEARCH
© 2019 Moody’s Corporation, Moody’s Investors Service, Inc., Moody’s Analytics, Inc. and/or their licensors and affiliates (collectively, “MOODY’S”). All rights reserved.
CREDIT RATINGS ISSUED BY MOODY'S INVESTORS SERVICE, INC. AND ITS RATINGS AFFILIATES (“MIS”) ARE MOODY’S CURRENT OPINIONS OF THE RELATIVE FUTURE CREDIT RISK OF ENTITIES, CREDIT COMMITMENTS, OR DEBT OR DEBT-LIKE SECURITIES, AND MOODY’S PUBLICATIONS MAY INCLUDE MOODY’S CURRENT OPINIONS OF THE RELATIVE FUTURE CREDIT RISK OF ENTITIES, CREDIT COMMITMENTS, OR DEBT OR DEBT-LIKE SECURITIES. MOODY’S DEFINES CREDIT RISK AS THE RISK THAT AN ENTITY MAY NOT MEET ITS CONTRACTUAL FINANCIAL OBLIGATIONS AS THEY COME DUE AND ANY ESTIMATED FINANCIAL LOSS IN THE EVENT OF DEFAULT OR IMPAIRMENT. SEE MOODY’S RATING SYMBOLS AND DEFINITIONS PUBLICATION FOR INFORMATION ON THE TYPES OF CONTRACTUAL FINANCIAL OBLIGATIONS ADDRESSED BY MOODY’S RATINGS. CREDIT RATINGS DO NOT ADDRESS ANY OTHER RISK, INCLUDING BUT NOT LIMITED TO: LIQUIDITY RISK, MARKET VALUE RISK, OR PRICE VOLATILITY. CREDIT RATINGS AND MOODY’S OPINIONS INCLUDED IN MOODY’S PUBLICATIONS ARE NOT STATEMENTS OF CURRENT OR HISTORICAL FACT. MOODY’S PUBLICATIONS MAY ALSO INCLUDE QUANTITATIVE MODEL-BASED ESTIMATES OF CREDIT RISK AND RELATED OPINIONS OR COMMENTARY PUBLISHED BY MOODY’S ANALYTICS, INC. CREDIT RATINGS AND MOODY’S PUBLICATIONS DO NOT CONSTITUTE OR PROVIDE INVESTMENT OR FINANCIAL ADVICE, AND CREDIT RATINGS AND MOODY’S PUBLICATIONS ARE NOT AND DO NOT PROVIDE RECOMMENDATIONS TO PURCHASE, SELL, OR HOLD PARTICULAR SECURITIES. NEITHER CREDIT RATINGS NOR MOODY’S PUBLICATIONS COMMENT ON THE SUITABILITY OF AN INVESTMENT FOR ANY PARTICULAR INVESTOR. MOODY’S ISSUES ITS CREDIT RATINGS AND PUBLISHES MOODY’S PUBLICATIONS WITH THE EXPECTATION AND UNDERSTANDING THAT EACH INVESTOR WILL, WITH DUE CARE, MAKE ITS OWN STUDY AND EVALUATION OF EACH SECURITY THAT IS UNDER CONSIDERATION FOR PURCHASE, HOLDING, OR SALE.
MOODY’S CREDIT RATINGS AND MOODY’S PUBLICATIONS ARE NOT INTENDED FOR USE BY RETAIL INVESTORS AND IT WOULD BE RECKLESS AND INAPPROPRIATE FOR RETAIL INVESTORS TO USE MOODY’S CREDIT RATINGS OR MOODY’S PUBLICATIONS WHEN MAKING AN INVESTMENT DECISION. IF IN DOUBT YOU SHOULD CONTACT YOUR FINANCIAL OR OTHER PROFESSIONAL ADVISER.
ALL INFORMATION CONTAINED HEREIN IS PROTECTED BY LAW, INCLUDING BUT NOT LIMITED TO, COPYRIGHT LAW, AND NONE OF SUCH INFORMATION MAY BE COPIED OR OTHERWISE REPRODUCED, REPACKAGED, FURTHER TRANSMITTED, TRANSFERRED, DISSEMINATED, REDISTRIBUTED OR RESOLD, OR STORED FOR SUBSEQUENT USE FOR ANY SUCH PURPOSE, IN WHOLE OR IN PART, IN ANY FORM OR MANNER OR BY ANY MEANS WHATSOEVER, BY ANY PERSON WITHOUT MOODY’S PRIOR WRITTEN CONSENT.
CREDIT RATINGS AND MOODY’S PUBLICATIONS ARE NOT INTENDED FOR USE BY ANY PERSON AS A BENCHMARK AS THAT TERM IS DEFINED FOR REGULATORY PURPOSES AND MUST NOT BE USED IN ANY WAY THAT COULD RESULT IN THEM BEING CONSIDERED A BENCHMARK.
All information contained herein is obtained by MOODY’S from sources believed by it to be accurate and reliable. Because of the possibility of human or mechanical error as well as other factors, however, all information contained herein is provided “AS IS” without warranty of any kind. MOODY'S adopts all necessary measures so that the information it uses in assigning a credit rating is of sufficient quality and from sources MOODY'S considers to be reliable including, when appropriate, independent third-party sources. However, MOODY’S is not an auditor and cannot in every instance independently verify or validate information received in the rating process or in preparing the Moody’s publications.
To the extent permitted by law, MOODY’S and its directors, officers, employees, agents, representatives, licensors and suppliers disclaim liability to any person or entity for any indirect, special, consequential, or incidental losses or damages whatsoever arising from or in connection with the information contained herein or the use of or inability to use any such information, even if MOODY’S or any of its directors, officers, employees, agents, representatives, licensors or suppliers is advised in advance of the possibility of such losses or damages, including but not limited to: (a) any loss of present or prospective profits or (b) any loss or damage arising where the relevant financial instrument is not the subject of a particular credit rating assigned by MOODY’S.
To the extent permitted by law, MOODY’S and its directors, officers, employees, agents, representatives, licensors and suppliers disclaim liability for any direct or compensatory losses or damages caused to any person or entity, including but not limited to by any negligence (but excluding fraud, willful misconduct or any other type of liability that, for the avoidance of doubt, by law cannot be excluded) on the part of, or any contingency within or beyond the control of, MOODY’S or any of its directors, officers, employees, agents, representatives, licensors or suppliers, arising from or in connection with the information contained herein or the use of or inability to use any such information.
NO WARRANTY, EXPRESS OR IMPLIED, AS TO THE ACCURACY, TIMELINESS, COMPLETENESS, MERCHANTABILITY OR FITNESS FOR ANY PARTICULAR PURPOSE OF ANY CREDIT RATING OR OTHER OPINION OR INFORMATION IS GIVEN OR MADE BY MOODY’S IN ANY FORM OR MANNER WHATSOEVER.
Moody’s Investors Service, Inc., a wholly-owned credit rating agency subsidiary of Moody’s Corporation (“MCO”), hereby discloses that most issuers of debt securities (including corporate and municipal bonds, debentures, notes and commercial paper) and preferred stock rated by Moody’s Investors Service, Inc. have, prior to assignment of any rating, agreed to pay to Moody’s Investors Service, Inc. for ratings opinions and services rendered by it fees ranging from $1,000 to approximately $2,700,000. MCO and MIS also maintain policies and procedures to address the independence of MIS’s ratings and rating processes. Information regarding certain affiliations that may exist between directors of MCO and rated entities, and between entities who hold ratings from MIS and have also publicly reported to the SEC an ownership interest in MCO of more than 5%, is posted annually at www.moodys.com under the heading “Investor Relations — Corporate Governance — Director and Shareholder Affiliation Policy.”
Additional terms for Australia only: Any publication into Australia of this document is pursuant to the Australian Financial Services License of MOODY’S affiliate, Moody’s Investors Service Pty Limited ABN 61 003 399 657AFSL 336969 and/or Moody’s Analytics Australia Pty Ltd ABN 94 105 136 972 AFSL 383569 (as applicable). This document is intended to be provided only to “wholesale clients” within the meaning of section 761G of the Corporations Act 2001. By continuing to access this document from within Australia, you represent to MOODY’S that you are, or are accessing the document as a representative of, a “wholesale client” and that neither you nor the entity you represent will directly or indirectly disseminate this document or its contents to “retail clients” within the meaning of section 761G of the Corporations Act 2001. MOODY’S credit rating is an opinion as to the creditworthiness of a debt obligation of the issuer, not on the equity securities of the issuer or any form of security that is available to retail investors.
Additional terms for Japan only: Moody's Japan K.K. (“MJKK”) is a wholly-owned credit rating agency subsidiary of Moody's Group Japan G.K., which is wholly-owned by Moody’s Overseas Holdings Inc., a wholly-owned subsidiary of MCO. Moody’s SF Japan K.K. (“MSFJ”) is a wholly-owned credit rating agency subsidiary of MJKK. MSFJ is not a Nationally Recognized Statistical Rating Organization (“NRSRO”). Therefore, credit ratings assigned by MSFJ are Non-NRSRO Credit Ratings. Non-NRSRO Credit Ratings are assigned by an entity that is not a NRSRO and, consequently, the rated obligation will not qualify for certain types of treatment under U.S. laws. MJKK and MSFJ are credit rating agencies registered with the Japan Financial Services Agency and their registration numbers are FSA Commissioner (Ratings) No. 2 and 3 respectively.
MJKK or MSFJ (as applicable) hereby disclose that most issuers of debt securities (including corporate and municipal bonds, debentures, notes and commercial paper) and preferred stock rated by MJKK or MSFJ (as applicable) have, prior to assignment of any rating, agreed to pay to MJKK or MSFJ (as applicable) for ratings opinions and services rendered by it fees ranging from JPY125,000 to approximately JPY250,000,000.
MJKK and MSFJ also maintain policies and procedures to address Japanese regulatory requirements.