worldwide open proficiency test for total reflection x ray ...pt-nsil.com › public ›...
TRANSCRIPT

IAEA Laboratories, Seibersdorf
April 2015
Worldwide Open Proficiency Test for
Total Reflection X Ray Fluorescence Laboratories
PTXRFIAEA11
Determination of Minor and
Trace Elements in water samples


CONTENTS
1. INTRODUCTION ...................................................................................................... 1 2. DESCRIPTION OF THE TEST SAMPLE................................................................... 1
3. DETAILS OF THE EXERCISE .................................................................................. 1 3.1. SUBMITTED RESULTS ..................................................................................... 1 3.2. ASSIGNED VALUE AND TARGET STANDARD DEVIATION ........................ 2 3.2. z-SCORES AND u-SCORES................................................................................ 3
3.3. CONSENSUS VALUES ...................................................................................... 5 4. RESULTS .................................................................................................................. 8
REFERENCES ................................................................................................................ 135 GLOSSARY.................................................................................................................... 137
LIST OF CONTRIBUTORS TO DRAFTING AND REVIEW.......................................... 139


FOREWORD The IAEA assists its Member States laboratories to continuously improve their analytical
performance by producing reference materials, by developing standardized analytical methods, and by conducting inter-laboratory comparisons and proficiency tests. To ensure a reliable worldwide, rapid and consistent response, the IAEA Nuclear Science and Instrumentation Laboratory in Seibersdorf, Austria, coordinates proficiency tests for Member
States laboratories. This summary report presents the results of the worldwide proficiency test PTXRFIAEA11 on the determination of minor and trace elements in three different water samples.
Methodologies, statistical analysis, and evaluation of results (for each element and for each laboratory) are also reported. The test was carried out within the IAEA project Nuclear Instrumentation, under the Accelerators and Nuclear Spectrometry Subprogram, Nuclear Science Program. The main objective of the project is to enhance capability of interested
Member States in effective utilization of nuclear spectrometries and analytical services in industry, human health, agriculture, and in monitoring and evaluation of the environment. This proficiency test was organized upon a petition from the ISO TC WG3 and its purpose
was to gather enough results to support the evaluation of a guideline and a standard methodology proposed for water analysis. The evaluation of the results will allow assessing a standard for water analysis to be submitted to ISO TC201.
The type of samples and the concentration levels of the analytes were designed to enable identification of potential analytical problems, to support IAEA Member States laboratories to improve the quality of their analytical results and to provide a regular forum for discussion and technology transfer in this topic.
The coordinators of the proficiency test and responsible for this publication were A. Migliori of the IAEA Nuclear Science and Instrumentation Laboratory, Seibersdorf (Austria), L. Depero and L. Borgese of the Chemistry for Technologies Laboratory, Department of
Mechanical and Industrial Engineering, University of Brescia (Italy).


1
1. INTRODUCTION
A proficiency test (PT), open to laboratories using the Total Reflection X-Ray Fluorescence (TXRF) analysis technique for environmental monitoring, was proposed to assess the analytical performance of TXRF worldwide. The purpose of the PT was to gather information to support the evaluation of guidelines and a standard methodology proposed for water
analysis. The participants were requested to determine the concentrations of chemical elements in three different water samples. The water samples were distributed to the participating laboratories, which were requested to
analyse the samples by TXRF technique following the instructions established by the coordinators of the PT. The evaluation of the results will allow assessing a standard for the water analysis to be submitted to ISO TC201. The exercise is a contribution to the project “Inter-laboratory
comparison of Total-Reflection X-Ray Fluorescence spectroscopy for environmental analysis” initiated in the frame of VAMAS (Versailles Project on Advanced Materials and Standards [1]) Technical Working Area 2, related to surface chemical analysis. The aim of the project is the development of guidelines and standard methodologies for the analysis of
biological and environmental samples by means of TXRF technique [2]. Based on the PT results presented in this report, each participating laboratory should assess its analytical performance and identify discrepancies. The samples, together with detailed instructions for the analysts, were distributed to the
participating laboratories in early August 2014. The deadline for submission of the results was October 31, 2014. The last results were received by January 2015. The submitted results were processed, grouped versus analytes/laboratories and compared with the analytes’ assigned values or consensus values. The values of z- and u-scores were calculated for three fit-for-
purpose levels. For the definitions of the z- and u-scores please see Section 3.3. The obtained results as well as the description of the data evaluation procedures have been presented in this report. For each laboratory a code was assigned, therefore full anonymity of the presented results is guaranteed. The link between the laboratory code and the laboratory name is known
only to the coordinators of the proficiency test and to the laboratory itself.
2. DESCRIPTION OF THE TEST SAMPLE
Two samples were prepared from a certified reference solution by the coordinators as to obtain two different concentration levels of the analytes (~ 10 mg/L for sample “1” and 0.1 mg/L for sample “2”). A third sample (“3”) was prepared from a commercial drinking water. The three samples were loaded in sterile plastic tubes, sealed and distributed to 37
laboratories, each tube containing around 5 mL of the aforementioned samples.
3. DETAILS OF THE EXERCISE
3.1. SUBMITTED RESULTS The participants were asked to provide information about the conditions and parameters used for their measurements, like sample carrier material, preparation of the sample carrier and ex-
citation source. For the analysis of all the three samples, the participants were asked to follow their own ana-lytical procedure for measurement, identification, spectrum analysis and quantification of the elements. Only one result per element should be submitted. Each result should be accompa-

2
nied by an estimate of its uncertainty expressed as one standard deviation. No restriction on the number of the reported elements was imposed.
The samples “1” and “2” were prepared after diluting an ICP multi-elemental standard solu-tion containing elements with a nominal concentration of 1000 mg/L to the level of 10 mg/L and 0.1 mg/L, respectively. The participants were explicitly asked to analyse the samples “1” and “2” without any further sample preparation procedure. The participants were asked to
consider Gallium as internal standard for quantification. Gallium was already present in sam-ples “1” and “2”, and its concentration was given: 10.0 mg/L in sample “1” and 0.1 mg/L in sample “2”. To harmonize the expression of standard deviation reported by the participants, it was instructed to prepare five independent measurement replicates for samples “1” and “2”,
each one corresponding to the dry residue of depositing 10 µL (in one drop) on the sample carrier. For the analysis of sample “3” the participants were asked to use Gallium (from a 1000 mg/l certified solution) as internal standard for quantification and, following the instructions estab-
lished by the coordinators for standard dilution, to prepare sample “3” with a Gallium final concentration equal to 1 mg/L. The participants were asked to prepare five independent meas-urement replicates also for this sample, as described before.
3.2. ASSIGNED VALUE AND TARGET STANDARD DEVIATION The reference values supplied by the provider of the initial standard solution used for the
preparation of samples “1” and “2”, were used as the assigned values of the analytes, XA. For each analyte a target value of the standard deviation has been assigned using a modified Horowitz function as proposed in reference [3]:
138.001.0
138.0102.102.0
102.122.078495.0
7
AA
AA
AA
A
XX
XX
XX
H (1)
In Eqn. (1) the assigned value of analyte, XA, is expressed as a mass fraction. The target value
of the standard deviation, A is related to HA by a factor k :
5.1,0.1,5.0, kkHAA (2)
Depending on the value of the factor k the target value of the standard deviation is recognized as fit-for-purpose at three levels of uncertainty: k = 0.5 - appropriate for high precision analysis; k = 1.0 - appropriate for well-established routine analysis; k = 1.5 - satisfactory for
common analytical tasks. The relative value of the target standard deviation, RSD, expressed in per cent, is defined as follows:
%100A
A
XRSD
(3)
The relative value of the target standard deviation as a function of the assigned mass fraction of the analyte, XA, is shown in Fig. 1 for the three different values of the k factor.

3
FIG. 1. Relative value of the target standard deviation, RSD, as a function of the assigned mass
fraction of the analyte, XA, calculated by using a modified Horowitz function, Eqn. (1).
3.3. z-SCORES AND u-SCORES
The reported concentrations of analytes were compared with the assigned values by using the z-score analysis. For every result a z-score was calculated:
A
AXxz
(4)
The term ‘x’ denotes the mass fraction of analyte reported by the participant. Defined by
different fit-for-purpose ranges of the target standard deviation, three different values of z-scores were calculated by combining Eqns. (2) and (4). Assuming that appropriate values for
XA and A have been used and that the underlying distribution of analytical errors is normal, apart from outliers, in a well-behaved analytical system z-scores would be expected to fall
outside the range -2 z 2 in about 4.6% of instances, and outside the range -3 ˂ z < 3 only in about 0.3%. Therefore, based on the z-scores the following decision limits were established:
2z - a satisfactory result
32 z - the result is considered questionable (5)
3z - the result is considered unsatisfactory

4
The advice to the laboratory is that, independent of the fit-for-purpose range selected by the
laboratory, any z-score for an element outside the range -2 z 2 should be examined by the analyst and all steps of the analytical procedure verified to identify the source(s) of the
analytical bias. For every participant the rescaled sum of z-scores, RSZ, as well as the sum of squared z-scores, SSZ, were calculated as defined by the following equations:
L
z
RSZ
L
i
i 1 (6)
L
i
izSSZ1
2 (7)
The symbol ‘L’ denotes the number of results provided by the laboratory/participant for all the analytes determined. The summing up in Eqns. (6) and (7) takes into account all z-scores
for all analytes with known assigned values reported by participant. The RSZ can be interpreted as a standardized normally distributed variable, with expected value equal to zero and unit variance. It is sensitive in detecting a small consistent bias in an analytical system, however, it is not sensitive in cases where there are even big errors but having opposite signs.
The SSZ takes no account of the signs because it depends on the squared z-scores. It has a chi-
squared (2) distribution with L degrees of freedom. The SSZ can be regarded as
complementary to RSZ, which means that if RSZ is well within the range -3 < RSZ < 3 and if
at the same time the value of SSZ is above the 2
critical value the overall performance of the
laboratory requires improvement.
The reported results were accompanied by the standard uncertainty estimate made by the participant. The values were used to calculate u-scores:
22
xA
AXxu
(8)
The symbol ‘x’ denotes the standard uncertainty of the submitted result x. If the assumptions
about XA and A and about the normality of the underlying distributions are correct, and the
laboratory estimate of x takes into account all the significant sources of uncertainty, the u-scores would have a truncated normal distribution with unit variance. In a well-behaved analytical system only 0.1% of u-scores would fall outside the range u < 3.29. Therefore, the following decision limits for the u-scores were established:
u 1.64 - reported result does not differ from the assigned value
1.64 < u 1.95 - reported result probably does not differ from the assigned value
1.95 < u 2.58 - it is not clear whether the reported and assigned values differ (9)
2.58 < u 3.29 - reported result is probably different from the assigned value 3.29 < u - reported result differs from the assigned value
The u-scores are especially useful for deciding whether the laboratory fit-for-purpose criteria are fulfilled. By comparing Eqn. (4) and Eqn. (8) one can notice that for corresponding values of u-score and z-score the following inequality is always fulfilled:

5
zu (10)
It implies that if the u-score is larger than 3.29 also the decision limit for the corresponding
z-score is triggered and the laboratory has to check the analytical procedure as well as review the uncertainty budget estimation. If u-score stays below the value of 1.64 and at the same
time the z-score decision limit is triggered ( 3z ) the laboratory should reevaluate its fit-for-
purpose status for that particular analyte.
3.4. CONSENSUS VALUES To examine the overall performance of the participating laboratories, the submitted results have been statistically processed and the consensus values were calculated (this data
processing was performed for all the three samples). The results were tested for the presence of outliers using a set of seven outlier rejection tests, shown below:
Description of symbols:
nxx ...1 - set of analytical results,
x - mean value, (11)
s - standard deviation,
1. Coefficient of kurtosis [4], number of results: 5 n 100, two-sided test, confidence level = 0.95:
2
1
2
1
4
2
)(
)(
n
i
i
n
i
i
xx
xxn
b (12)
If b2 > critical value then reject the result that is at the furthest distance from the
mean, decrease n, repeat the procedure until b2 critical value.
2. Coefficient of skewness [4], number of results, 5 n 60, one-sided test, confidence level = 0.95:
2/3
1
2
1
3
1
)(
)(
n
i
i
n
i
i
xx
xxn
b (13)
If 1b > critical value then: if 1b is positive then reject nx , otherwise reject 1x ,
decrease n, repeat the procedure until 1b critical value.
3. Veglia’s test [5,6], number of results: 4 n , two-sided test, confidence level = 0.95:

6
1
1
1
n
nk
s
xx
n
nh (14)
where:
kx , examined value, the result at the furthest distance from the mean
1nx , the mean value of the population of the results with the examined result
excluded
1ns , the standard deviation of the population of the results with the examined result
excluded
If h > critical value then reject kx otherwise temporarily exclude the
kx from the
population of results and proceed with testing the next outlier candidate, if the
following value of h > critical value then reject both results, decrease n respectively,
repeat the procedure until h critical value.
4. Dixon’s test [7], number of results: 3 n 25, two-sided test, confidence
level = 0.95:
If 1x is at the furthest distance from the mean value, then calculate:
2514),/()(
1311),/()(
108),/()(
73),/()(
1213
1113
1112
112
nxxxx
nxxxx
nxxxx
nxxxx
r
n
n
n
n
(15a)
If nx is at the furthest distance from the mean value then calculate:
2514),/()(
1311),/()(
108),/()(
73),/()(
32
22
21
11
nxxxx
nxxxx
nxxxx
nxxxx
r
nnn
nnn
nnn
nnn
(15b)
If r > critical value then reject the tested result, decrease n, repeat the procedure until
r critical value.
5. Outlier rejection test proposed in [4], number of results: 4 n 100, two-sided test,
confidence level = 0.95:
sxxsw n /)(/ 1 (16)
If w/s > critical value then: if 1xxxxn , reject both 1x and nx , otherwise reject
kx ( nkk xxorxx 1 ), the result that is at the furthest distance from the mean, for
the remaining population of results (n'= n – 1) calculate: '/' sxxT kk , where: 'x is
the mean value and 's is the standard deviation of the population of the results
excluding the rejected value kx , if kT > critical value then reject also the second

7
extreme result, decrease n respectively, repeat the procedure until w/s critical value.
6. Outlier rejection test proposed in [8], number of results: 3 n < , two-sided test, confidence level = 0.95:
sxxB k /4 (17)
where:
kx , examined value
If 4B > critical value then reject the tested result, repeat the procedure until 4B
critical value.
7. Outlier rejection test proposed in [9], number of results: 3 n 100, two-sided test,
confidence level = 0.95:
nkork
xx
xx
SSn
kii
i
n
kii
i
k
1,
)(
)'(
/
,1
2
,1
2
2 (18)
where:
kx , examined value, the result at the furthest distance from the mean
'x , the mean value of the population of the results with the examined result
kx excluded
If SSk /2 > critical value then reject kx , decrease n, repeat the procedure until SSk /2
critical value.
The results which passed the outlier rejection procedures were used to calculate the consensus
mean value of analyte, XC, and corresponding consensus value of its standard deviation, C:
m
x
X
m
i
i
C
1 (19)
and
1
1
2
mm
Xxm
i
Ci
C (20)
The term m denotes the number of reported values for a given analyte excluding the outliers rejected by at least one of the outlier rejections tests. The summing up in Eqn. (19) and (20) takes into account only the results which passed all the outlier rejection tests.

8
4. RESULTS The three water samples were distributed to 37 laboratories for chemical composition
analysis. Out of the 37 laboratories, 31 participated in the test submitting 473 individual results for 37 chemical elements for sample “1”, 324 individual results for 29 chemical elements for sample “2”, 254 individual results for 35 chemical elements for sample “3”. The list of the participating laboratories is presented at the end of this report. All submitted results
have been evaluated. The measuring set-up (carrier material and its preparation, excitation source) and the experimental parameters (voltage, current, measuring time) used by the participants and their
codes are listed in Table 1a, 1b and 1c, for samples “1”, “2” and “3” respectively. The total number of elements reported by each laboratory is also reported in these Tables. In Table 2a a summary of the assigned analyte values, the target values of standard deviation
(obtained by using modified Horowitz function), the consensus values and their standard deviations are shown for sample “1”. For sample “2” the consensus values were used for comparison with respect to the experimental values provided by the participants instead of the assigned analyte values. It was
evidenced that the concentration of the internal standard (Ga) was lower than the expected value of 0.1 mg/L, resulting to systematic errors in the measured concentrations by the most of the participants. Tables 2b and 2c show the consensus values and their standard deviations for sample “2” and
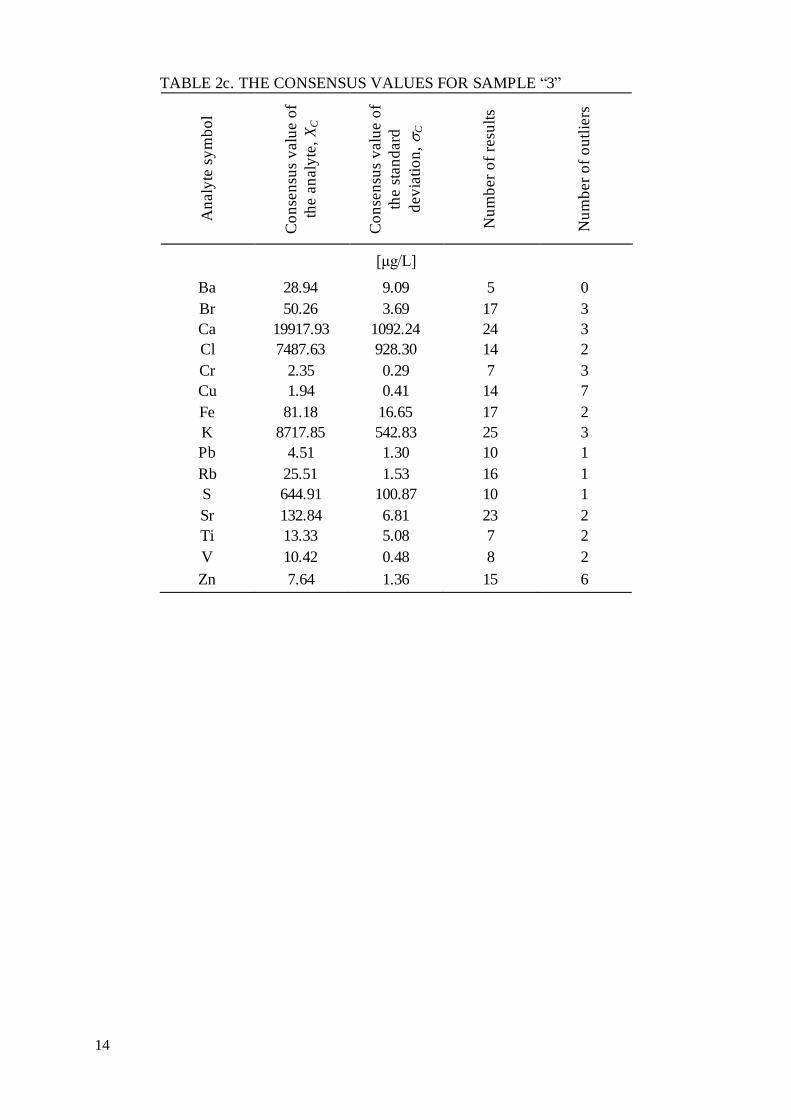
“3”, respectively. The consensus values (Eqn. 19) and corresponding standard deviations (Eqn. 20) were calculated based on the reported values for elements having more than five results after excluding outliers. The number of reported results and outliers for each sample is listed
below:
Sample Reported
values Outliers
1 473 42
2 324 35
3 254 44
The z- and u-scores were calculated for sample “1” for the analytes for which an assigned
value was available. The element Calcium was not considered for the evaluation of z- and u-scores due to unexpected high values. In case of sample “2” and “3” the z- and u-scores were calculated considering as a reference the consensus values.

9
TABLE 1a. MEASURING SET-UP AND EXPERIMENTAL PARAMETERS USED BY PARTICIPANTS OF THE PROFICIENCY TEST EXERCISE FOR SAMPLE “1”
Lab
ora
to-
ry C
ode
Car
rier
mat
eria
l
Pre
par
a-
tion
Exci
tati
on
Sourc
e
Volt
age
(kV
)
Curr
ent
(mA
)
Mea
sur-
ing T
ime
(s)
No.
of
Ele
m.
35 soda-lime glass siliconization X-ray tube - Mo anode 50 0.8 600 17
53 quartz not specified X-ray tube - Mo anode 50 0.6 300 14
54 quartz no preparation X-ray tube - Mo anode 50 1 1000 15
57 quartz no preparation X-ray tube - Mo anode 45 25 1000 14
62 quartz not specified X-ray tube - Mo anode 40 20 200 14
67 quartz/plexiglass not specified X-ray tube - Mo/W anode 50 0.6 120 9
69 quartz no preparation X-ray tube - Mo anode 40 40 300 16
72 quartz not specified X-ray tube - Mo anode 50 1 100 18
73 quartz no preparation X-ray tube - Mo anode 50 0.602 1000 17
75 quartz siliconization X-ray tube - Mo anode 50 0.6 1000 29
78 quartz siliconization X-ray tube - Mo anode 40 30 500 16
89 quartz siliconization X-ray tube - Mo anode 40 30 1000 13
93 quartz siliconization X-ray tube - Mo anode 50 0.6 3600 13
95 quartz siliconization X-ray tube - W anode 50 1 2000 17
103 quartz no preparation X-ray tube - Mo anode 40 30 1000 11
104 quartz siliconization X-ray tube - Mo anode 50 1.000 500 16
105 quartz siliconization X-ray tube - Mo anode 50 0.600 1200 32
106 quartz siliconization X-ray tube - Mo anode 50 1 1000 17
107 quartz siliconization X-ray tube - Mo anode 50 8 1000 14
108 quartz siliconization X-ray tube - Mo anode 50 0.75 600 19
109 silicon wafer no preparation X-ray tube - Mo anode 40 20 1000 16
110 quartz no preparation X-ray tube - Mo anode 40 30 600 14
111 quartz no preparation X-ray tube - Rh anode 20 0.06 600 16
112 quartz DLC coating X-ray tube - W anode 25 0.2 600 15
113 soda-lime glass siliconization X-ray tube - Mo anode 50 0.6 1000 13
114 soda-lime glass siliconization X-ray tube - Mo anode 50 0.6 500 12
115 quartz not specified X-ray tube - Mo anode 40 30 1000 8
116 quartz no preparation X-ray tube - Mo anode 50 0.6 500 16
117 quartz no preparation X-ray tube - Mo anode 50 0.696 250 18
118 quartz DLC coating X-ray tube - W anode 25 0.2 600 14

10
TABLE 1b. MEASURING SET-UP AND EXPERIMENTAL PARAMETERS USED BY PARTICIPANTS OF THE PROFICIENCY TEST EXERCISE FOR SAMPLE “2”
Lab
ora
to-
ry C
ode
Car
rier
mat
eria
l
Pre
par
a-
tion
Exci
tati
on
Sourc
e
Volt
age
(kV
)
Curr
ent
(mA
)
Mea
sur-
ing T
ime
(s)
No.
of
Ele
m.
35 soda-lime glass siliconization X-ray tube - Mo anode 50 0.8 1000 7
53 quartz not specified X-ray tube - Mo anode 50 0.6 300 13
54 quartz no preparation X-ray tube - Mo anode 50 1 2000 13
57 quartz no preparation X-ray tube - Mo anode 45 25 2000 11
62 quartz not specified X-ray tube - Mo anode 40 20 200 12
67 quartz/plexiglass not specified X-ray tube - Mo/W anode 50 0.6 120 1
69 quartz no preparation X-ray tube - Mo anode 40 40 1000 14
72 quartz not specified X-ray tube - Mo anode 50 1 500 16
73 quartz no preparation X-ray tube - Mo anode 50 0.602 1000 16
75 quartz siliconization X-ray tube - Mo anode 50 0.6 1000 22
89 quartz siliconization X-ray tube - Mo anode 40 30 1000 11
93 quartz siliconization X-ray tube - Mo anode 50 0.6 3600 13
95 quartz siliconization X-ray tube - W anode 50 1 2000 12
103 quartz no preparation X-ray tube - Mo anode 40 30 1000 8
104 quartz siliconization X-ray tube - Mo anode 50 1.000 500 14
105 quartz siliconization X-ray tube - Mo anode 50 0.600 1200 22
106 quartz siliconization X-ray tube - Mo anode 50 1 1000 14
107 quartz siliconization X-ray tube - Mo anode 50 47 1000 12
108 quartz siliconization X-ray tube - Mo anode 50 0.75 600 18
109 silicon wafer no preparation X-ray tube - Mo anode 40 20 1000 12
113 soda-lime glass siliconization X-ray tube - Mo anode 50 0.6 1000 9
114 soda-lime glass siliconization X-ray tube - Mo anode 50 0.6 500 6
116 quartz no preparation X-ray tube - Mo anode 50 0.6 500 14
117 quartz no preparation X-ray tube - Mo anode 50 0.696 250 15
118 quartz DLC coating X-ray tube - W anode 25 0.2 600 10
119 quartz siliconization Synchrotron light 10 290 600 9

11
TABLE 1c. MEASURING SET-UP AND EXPERIMENTAL PARAMETERS USED BY PARTICIPANTS OF THE PROFICIENCY TEST EXERCISE FOR SAMPLE “3”
Lab
ora
to-
ry C
ode
Car
rier
mat
eria
l
Pre
par
a-
tion
Exci
tati
on
Sourc
e
Volt
age
(kV
)
Curr
ent
(mA
)
Mea
sur-
ing T
ime
(s)
No.
of
Ele
m.
35 soda-lime glass siliconization X-ray tube - Mo anode 50 0.8 3000 7
53 quartz not specified X-ray tube - Mo anode 50 0.6 300 7
54 quartz no preparation X-ray tube - Mo anode 50 1 1000 8
57 quartz no preparation X-ray tube - Mo anode 45 25 2000 4
62 quartz not specified X-ray tube - Mo anode 40 20 200 12
67 quartz/plexiglass not specified X-ray tube - Mo/W anode 50 0.6 120 5
69 quartz no preparation X-ray tube - Mo anode 40 40 1000 13
72 quartz not specified X-ray tube - Mo anode 50 1 500 16
73 quartz no preparation X-ray tube - Mo anode 50 0.602 1000 9
75 quartz siliconization X-ray tube - Mo anode 50 0.6 1000 24
93 quartz siliconization X-ray tube - Mo anode 50 0.6 3600 4
95 quartz siliconization X-ray tube - W anode 50 1 2000 4
103 quartz no preparation X-ray tube - Mo anode 40 30 1000 6
104 quartz siliconization X-ray tube - Mo anode 50 1.000 500 8
105 quartz siliconization X-ray tube - Mo anode 50 0.600 1200 23
106 quartz siliconization X-ray tube - Mo anode 50 1 1000 6
107 quartz siliconization X-ray tube - Mo anode 50 42 1000 5
108 quartz siliconization X-ray tube - Mo anode 50 0.75 600 16
109 silicon wafer no preparation X-ray tube - Mo anode 40 20 1000 13
110 quartz no preparation X-ray tube - Mo anode 40 30 600 7
111 quartz no preparation X-ray tube - Rh anode 20 0.06 1800 5
112 quartz DLC coating X-ray tube - W anode 25 0.2 600 4
113 soda-lime glass siliconization X-ray tube - Mo anode 50 0.6 1000 5
114 soda-lime glass siliconization X-ray tube - Mo anode 50 0.6 500 9
115 quartz not specified X-ray tube - Mo anode 40 30 1000 2
116 quartz no preparation X-ray tube - Mo anode 50 0.6 500 14
117 quartz no preparation X-ray tube - Mo anode 50 0.696 250 14
118 quartz DLC coating X-ray tube - W anode 25 0.2 600 4

12
TABLE 2a. THE ASSIGNED VALUES OF ANALYTES, THE TARGET VALUES OF THE STANDARD DEVIATIONS AND THE CONSENSUS VALUES FOR SAMPLE “1”
An
aly
te s
ym
bo
l
Ass
ign
ed
valu
e o
f th
e
an
aly
te,
XA
Target value of standard
deviation, A
Co
nse
nsu
s v
alu
e o
f
the a
naly
te,
XC
Co
nse
nsu
s v
alu
e o
f th
e s
tan
dard
dev
iati
on
,
C
Nu
mb
er
of
resu
lts
Nu
mb
er
of
ou
tlie
rs
k = 0.5 k = 1.0 k = 1.5
[μg/L]
Ag 10010 566.07 1132.14 1698.2 13845.67 1591.88 9 0
Ba 9990 565.11 1130.21 1695.32 11109.82 747.29 23 1
Bi 9900 560.78 1121.56 1682.34 9736.85 306.63 29 4
Ca - - - - 24899.96 2370.73 24 0
Cd 9890 560.3 1120.6 1680.89 9349.04 752.54 14 3
Co 9880 559.82 1119.63 1679.45 10337.34 222.76 29 1
Cr 9890 560.3 1120.6 1680.89 9924.61 249.56 29 1
Cu 9880 559.82 1119.63 1679.45 10184.15 110.64 30 4
Fe 9890 560.3 1120.6 1680.89 10367.93 160.73 30 2
In 9880 559.82 1119.63 1679.45 10444.05 1296.43 9 0
K 9930 562.22 1124.45 1686.67 12089.53 670.36 25 2
Mn 9910 561.26 1122.52 1683.78 10529.52 268.18 29 2
Ni 9890 560.3 1120.6 1680.89 10492.31 171.99 30 2
Pb 9910 561.26 1122.52 1683.78 11059.38 360.20 29 3
S - - - - 27392.35 5145.53 6 0
Sr 9880 559.82 1119.63 1679.45 11425.71 210.42 29 4
Tl 9920 561.74 1123.48 1685.23 10276.69 209.13 27 5
Zn 9890 560.3 1120.6 1680.89 10393.93 117.58 30 4

13
TABLE 2b. THE CONSENSUS VALUES FOR SAMPLE “2”
An
aly
te s
ym
bo
l
Co
nse
nsu
s v
alu
e o
f th
e a
naly
te,
XC
Co
nse
nsu
s v
alu
e o
f th
e s
tan
dard
dev
iati
on
,
C
Nu
mb
er
of
resu
lts
Nu
mb
er
of
ou
tlie
rs
[μg/L]
Ba 335.78 60.66 16 1
Ca 3452.61 578.03 19 4
Cl 1955.23 498.57 11 2
Co 274.50 37.65 24 2
Cr 144.99 15.43 20 2
Cu 248.20 29.44 25 2
Fe 122.47 19.62 24 5
K 704.10 136.04 14 0
Mn 291.23 38.44 24 2
Ni 256.41 34.82 24 2
Pb 260.38 31.15 21 2
Sr 278.78 34.75 21 2
Tl 258.30 35.14 20 3
Zn 292.78 33.83 25 2
14
TABLE 2c. THE CONSENSUS VALUES FOR SAMPLE “3”
An
aly
te s
ym
bo
l
Co
nse
nsu
s v
alu
e o
f
the a
naly
te,
XC
Co
nse
nsu
s v
alu
e o
f
the s
tan
dard
dev
iati
on
,
C
Nu
mb
er
of
resu
lts
Nu
mb
er
of
ou
tlie
rs
[μg/L]
Ba 28.94 9.09 5 0
Br 50.26 3.69 17 3
Ca 19917.93 1092.24 24 3
Cl 7487.63 928.30 14 2
Cr 2.35 0.29 7 3
Cu 1.94 0.41 14 7
Fe 81.18 16.65 17 2
K 8717.85 542.83 25 3
Pb 4.51 1.30 10 1
Rb 25.51 1.53 16 1
S 644.91 100.87 10 1
Sr 132.84 6.81 23 2
Ti 13.33 5.08 7 2
V 10.42 0.48 8 2
Zn 7.64 1.36 15 6

15
Tables 3a, 3b and 3c list the values of the z- and u-scores for all submitted results for samples “1”, “2” and “3”, respectively. In brackets, next to the element symbol, the assigned values (for sample “1”) or the consensus values (for samples “2” and “3”) of element concentration
and the target standard deviation for k = 1 are shown. The z- and u-scores were calculated for the three different fit-for-purpose ranges, as defined by Eqn. (2). The results rejected by the outliers rejection procedures were marked with “*” in the “Analyte concentration” column.
Tables 4a, 4b and 4c show the combined z-scores, the RSZ and SSZ as defined in Eqns. (6) and (7), in the case of sample “1”, “2” and “3”, respectively, for all the participating laboratories and for the three different fit-for-purpose ranges. The analytes without assigned values for sample “1” or without consensus values for samples “2” and “3” were not
considered. Figs. 2-47 and 48-91 present the distributions of the proficiency test results. In Figs 2-47 (Figs. 2-19 for sample “1”, Figs. 20-33 for sample “2” and Figs. 34-47 for
sample “3”) the individual results are marked with filled circles. The dotted lines show the range of the accepted results (the results within these lines were used to calculate the consensus values). The outliers are marked with arrows. Also shown are the estimated parameters of the distribution (after outlier rejection): mode, median and the mean value. For
few elements, the result of density distributions could only be used as indicators of the trends observed in the reported data due to the limited number of results (only density distributions of analytes for which at least 5 results passed the outlier rejection tests are shown). All the populations of results, after outlier rejection, have passed a normality test (Kolmogorov-
Smirnov). Figs. 48-91 (Figs. 48-63 for sample “1”, Figs. 64-77 for sample “2” and Figs. 78-91 for sample “3”) show the bar chart distributions of the z-scores for the analytes with at least 6 submitted results. The results are sorted in ascending order versus laboratory code. The bar
charts show the distance between the reported and the assigned/consensus values of the analyte. The submitted results and their uncertainties are marked with filled squares accompanied by uncertainty bars. The horizontal lines show the admissible levels of z-score, |z| < 2, for three different ranges defined by factor k in Eqn. (2): k = 0.5 (solid black lines), k =
1.0 (solid green lines) and k = 1.5 (solid red lines). The decision levels of satisfactory results,
2z , for different fit-for-purpose targets have also been marked.
For every participating laboratory its overall performance concerning the analysis of samples “1”, “2” and “3” is presented in Figs. 92-121, Figs. 122-146 and Figs. 147-174, respectively.
The plots presented in these figures relate all the u-scores and z-scores calculated for a given laboratory. The hollow symbols denote the values calculated for specific fit-for-purpose levels as defined in Eqn. (2) with factor k , namely: k = 0.5 (black triangles), k = 1.0 (green circles), and k = 1.5 (red squares). The decision limits of unsatisfactory results were marked with black
lines (|z| > 3, u > 3.29). They divide the plot area in four quadrants. Due to inequality (10) all the points accompanied by a laboratory estimate of the uncertainty fall always below the line u = |z|. The smaller the laboratory estimate of the uncertainty the closer the related point to the u = |z| line. Points in the immediate proximity of the dashed diagonal line (u = |z|) have
underestimated uncertainty values. The well performing laboratories would have more points located in the lower-left quadrant of the plot. If there are many points located in the upper-right quadrant it suggests that these results do not fall in the defined fit-for-purpose targets and that the laboratory provided too “narrow” uncertainty estimate.

16
TABLE 3a. SUMMARY OF THE REPORTED RESULTS AND THE CALCULATED z- AND u-SCORES FOR SAMPLE “1”
Lab
ora
tory
co
de
An
aly
te c
on
cen
trati
on
Sta
nd
ard
dev
.
Rela
tiv
e s
td.
dev
., [
%]
z-scores u-scores
k = 0.5 k = 1.0 k = 1.5 k = 0.5 k = 1.0 k = 1.5
Ag (10010 ± 1132.14) [μg/L]
78 5636 493 8.75 -7.73 -3.86 -2.58 5.83 3.54 2.47
72 9318 992 10.65 -1.22 -0.61 -0.41 0.61 0.46 0.35
116 11500.2 1641.91 14.28 2.63 1.32 0.88 0.86 0.75 0.63
95 12883 360 2.79 5.08 2.54 1.69 4.28 2.42 1.66 108 13833.8 1025.8 7.42 6.76 3.38 2.25 3.26 2.50 1.93
109 14242.57 2333.74 16.39 7.48 3.74 2.49 1.76 1.63 1.47
75 17779.2 2044.6 11.5 13.72 6.86 4.57 3.66 3.32 2.92
105 18342.24 1960.05 10.69 14.72 7.36 4.91 4.08 3.68 3.21
106 21076 2219.75 10.53 19.55 9.77 6.52 4.83 4.44 3.96
Al (9890 ± 1120.60) [μg/L]
75 5174.2 850.9 16.45 -8.42 -4.21 -2.81 4.63 3.35 2.50
108 9049.4 3380.4 37.35 -1.50 -0.75 -0.50 0.25 0.24 0.22
105 11309.93 668.88 5.91 2.53 1.27 0.84 1.63 1.09 0.78
117 12000 2000 16.67 3.77 1.88 1.26 1.02 0.92 0.81
As [μg/L]
117 15 3 20 - - - - - -
75 27.2 1.9 6.99 - - - - - -
104 33.4 1 2.99 - - - - - -
105 60.273* 3.15 5.23 - - - - - -
Ba (9990 ± 1130.21) [μg/L]
118 4952 1072 21.65 -8.92 -4.46 -2.97 4.16 3.23 2.51
69 5300 100 1.89 -8.30 -4.15 -2.77 8.17 4.13 2.76
72 6098 644 10.56 -6.89 -3.44 -2.3 4.54 2.99 2.15
78 7022 403 5.74 -5.25 -2.63 -1.75 4.28 2.47 1.70
107 7705 570.7 7.41 -4.04 -2.02 -1.35 2.85 1.80 1.28
116 8276.6 517.11 6.25 -3.03 -1.52 -1.01 2.24 1.38 0.97 108 8958.8 292.9 3.27 -1.82 -0.91 -0.61 1.62 0.88 0.6
57 10033 289 2.88 0.08 0.04 0.03 0.07 0.04 0.03
114 10600 460 4.34 1.08 0.54 0.36 0.84 0.5 0.35
110 10795.4 1401 12.98 1.43 0.71 0.48 0.53 0.45 0.37
75 11646.2 1641.8 14.1 2.93 1.47 0.98 0.95 0.83 0.7 89 12250 1912 15.61 4.00 2.00 1.33 1.13 1.02 0.88
106 12294.8 1579.14 12.84 4.08 2.04 1.36 1.37 1.19 0.99
113 12625 1760 13.94 4.66 2.33 1.55 1.43 1.26 1.08
117 12700 300 2.36 4.8 2.4 1.6 4.24 2.32 1.57
54 12913 3032 23.48 5.17 2.59 1.72 0.95 0.90 0.84 104 13000 100 0.77 5.33 2.66 1.78 5.24 2.65 1.77
109 14147.34 4104.29 29.01 7.36 3.68 2.45 1.00 0.98 0.94
105 14718.55 1641.93 11.16 8.37 4.18 2.79 2.72 2.37 2.00

TABLE 3a (cont). SUMMARY OF THE REPORTED RESULTS AND THE
CALCULATED z- AND u-SCORES FOR SAMPLE “1”
17
Lab
ora
tory
co
de
An
aly
te c
on
cen
trati
on
Sta
nd
ard
dev
.
Rela
tiv
e s
td.
dev
., [
%]
z-scores u-scores
k = 0.5 k = 1.0 k = 1.5 k = 0.5 k = 1.0 k = 1.5
53 15042 712 4.73 8.94 4.47 2.98 5.56 3.78 2.75
112 15157.86 3488.47 23.01 9.14 4.57 3.05 1.46 1.41 1.33 73 18180.4 106.6 0.59 14.49 7.25 4.83 14.24 7.21 4.82
62 37136.75* 2596.17 6.99 48.04 24.02 16.01 10.22 9.59 8.76
Bi (9900 ± 1121.56) [μg/L]
67 3399* 93 2.74 -11.59 -5.8 -3.86 11.44 5.78 3.86
118 6068 1160 19.12 -6.83 -3.42 -2.28 2.97 2.37 1.88 95 7166 94 1.31 -4.88 -2.44 -1.63 4.81 2.43 1.62
108 7820.6 90.8 1.16 -3.71 -1.85 -1.24 3.66 1.85 1.23
69 8200 400 4.88 -3.03 -1.52 -1.01 2.47 1.43 0.98
54 8270 242 2.93 -2.91 -1.45 -0.97 2.67 1.42 0.96
109 8564.075 234.81 2.74 -2.38 -1.19 -0.79 2.20 1.17 0.79 89 8981 521 5.8 -1.64 -0.82 -0.55 1.20 0.74 0.52
103 9090.574 466.32 5.13 -1.44 -0.72 -0.48 1.11 0.67 0.46
93 9590 938.5 9.79 -0.55 -0.28 -0.18 0.28 0.21 0.16
73 9667.6 27.4 0.28 -0.41 -0.21 -0.14 0.41 0.21 0.14
104 9700 30 0.31 -0.36 -0.18 -0.12 0.36 0.18 0.12
72 9843 204 2.07 -0.10 -0.05 -0.03 0.10 0.05 0.03 57 9991 127 1.27 0.16 0.08 0.05 0.16 0.08 0.05
75 10028.8 109.9 1.1 0.23 0.11 0.08 0.23 0.11 0.08
117 10100 300 2.97 0.36 0.18 0.12 0.31 0.17 0.12
78 10124 561 5.54 0.40 0.20 0.13 0.28 0.18 0.13
116 10189.8 207.86 2.04 0.52 0.26 0.17 0.48 0.25 0.17 106 10324.2 449.39 4.35 0.76 0.38 0.25 0.59 0.35 0.24
105 10453.54 122.6 1.17 0.99 0.49 0.33 0.96 0.49 0.33
53 10542 436 4.14 1.14 0.57 0.38 0.9 0.53 0.37
110 10561.8 2145.28 20.31 1.18 0.59 0.39 0.3 0.27 0.24
107 11063 1142.8 10.33 2.07 1.04 0.69 0.91 0.73 0.57 113 11952 409 3.42 3.66 1.83 1.22 2.96 1.72 1.19
114 12200 581 4.76 4.10 2.05 1.37 2.85 1.82 1.29
112 12930.29 834.76 6.46 5.40 2.70 1.80 3.01 2.17 1.61
111 14712* 1530 10.4 8.58 4.29 2.86 2.95 2.54 2.12
35 16560* 2100 12.68 11.88 5.94 3.96 3.06 2.80 2.48
62 150115.5* 1877.17 1.25 250.04 125.02 83.35 71.57 64.12 55.63
Ca [μg/L]
118 9983 1144 11.46 - - - - - -
57 10245 278 2.71 - - - - - -
78 11488 751 6.54 - - - - - -
110 11734.2 1913.41 16.31 - - - - - - 95 13607 1075 7.9 - - - - - -
104 14900 90 0.6 - - - - - -
117 17000 1000 5.88 - - - - - -
75 17627.4 2462.1 13.97 - - - - - -
105 18183.65 986.63 5.43 - - - - - -

TABLE 3a (cont). SUMMARY OF THE REPORTED RESULTS AND THE
CALCULATED z- AND u-SCORES FOR SAMPLE “1”
18
Lab
ora
tory
co
de
An
aly
te c
on
cen
trati
on
Sta
nd
ard
dev
.
Rela
tiv
e s
td.
dev
., [
%]
z-scores u-scores
k = 0.5 k = 1.0 k = 1.5 k = 0.5 k = 1.0 k = 1.5
72 19330 3788 19.6 - - - - - -
106 19762.8 972.8 4.92 - - - - - - 69 20000 1000 5 - - - - - -
89 22256 702 3.15 - - - - - -
73 22798 107.6 0.47 - - - - - -
111 29189 2744 9.4 - - - - - -
93 29630 4674 15.77 - - - - - - 54 32182 5283 16.42 - - - - - -
116 34926.8 2661.14 7.62 - - - - - -
112 35426.65 5245.65 14.81 - - - - - -
114 35500 3530 9.94 - - - - - -
108 38184.8 1944.9 5.09 - - - - - - 107 38981 3855 9.89 - - - - - -
35 43300 9000 20.79 - - - - - -
62 51363.75 1591.86 3.1 - - - - - -
Cd (9890 ± 1120.60) [μg/L]
78 5690 741 13.02 -7.50 -3.75 -2.5 4.52 3.13 2.29
72 5936 934 15.73 -7.06 -3.53 -2.35 3.63 2.71 2.06 109 7845.558 1075.28 13.71 -3.65 -1.82 -1.22 1.69 1.32 1.02
108 7953.4 449.3 5.65 -3.46 -1.73 -1.15 2.70 1.60 1.11
116 8427.2 766.34 9.09 -2.61 -1.31 -0.87 1.54 1.08 0.79
75 9314 1159.6 12.45 -1.03 -0.51 -0.34 0.45 0.36 0.28
105 9737.731 518.03 5.32 -0.27 -0.14 -0.09 0.2 0.12 0.09 104 10800 250 2.31 1.62 0.81 0.54 1.48 0.79 0.54
95 11640 473 4.06 3.12 1.56 1.04 2.39 1.44 1.00
53 11856 1876 15.82 3.51 1.75 1.17 1.00 0.90 0.78
106 13639.6 2984.74 21.88 6.69 3.35 2.23 1.23 1.18 1.09
117 18000* 1000 5.56 14.47 7.24 4.82 7.08 5.40 4.15 54 22213* 3301 14.86 21.99 11.00 7.33 3.68 3.53 3.33
73 22852* 194.4 0.85 23.13 11.57 7.71 21.86 11.4 7.66
Cl [μg/L]
105 1755.217 348.31 19.84 - - - - - -
69 8900 400 4.49 - - - - - -
Co (9880 ± 1119.63) [μg/L]
107 7695 177.1 2.3 -3.90 -1.95 -1.30 3.72 1.93 1.29
103 8555.465 1044.09 12.2 -2.37 -1.18 -0.79 1.12 0.87 0.67
69 9000 500 5.56 -1.57 -0.79 -0.52 1.17 0.72 0.5
110 9083 515.33 5.67 -1.42 -0.71 -0.47 1.05 0.65 0.45
78 9247 247 2.67 -1.13 -0.57 -0.38 1.03 0.55 0.37
108 9422.2 189.6 2.01 -0.82 -0.41 -0.27 0.77 0.4 0.27 115 9448.533 556.97 5.89 -0.77 -0.39 -0.26 0.55 0.35 0.24
111 9576 478 4.99 -0.54 -0.27 -0.18 0.41 0.25 0.17
118 9712 820 8.44 -0.30 -0.15 -0.10 0.17 0.12 0.09

TABLE 3a (cont). SUMMARY OF THE REPORTED RESULTS AND THE
CALCULATED z- AND u-SCORES FOR SAMPLE “1”
19
Lab
ora
tory
co
de
An
aly
te c
on
cen
trati
on
Sta
nd
ard
dev
.
Rela
tiv
e s
td.
dev
., [
%]
z-scores u-scores
k = 0.5 k = 1.0 k = 1.5 k = 0.5 k = 1.0 k = 1.5
57 9959 7580 76.11 0.14 0.07 0.05 0.01 0.01 0.01
72 9993 321 3.21 0.20 0.10 0.07 0.18 0.10 0.07 93 10220 485.2 4.75 0.61 0.30 0.20 0.46 0.28 0.19
89 10255 265 2.58 0.67 0.33 0.22 0.61 0.33 0.22
117 10300 300 2.91 0.75 0.38 0.25 0.66 0.36 0.25
75 10314 519.8 5.04 0.78 0.39 0.26 0.57 0.35 0.25
106 10320.4 241.98 2.34 0.79 0.39 0.26 0.72 0.38 0.26 116 10430.2 208.64 2 0.98 0.49 0.33 0.92 0.48 0.33
104 10600 30 0.28 1.29 0.64 0.43 1.28 0.64 0.43
73 10635 36 0.34 1.35 0.67 0.45 1.35 0.67 0.45
54 10643 318 2.99 1.36 0.68 0.45 1.19 0.66 0.45
114 10900 283 2.6 1.82 0.91 0.61 1.63 0.88 0.6 109 11121.6 670.19 6.03 2.22 1.11 0.74 1.42 0.95 0.69
95 11428 315 2.76 2.77 1.38 0.92 2.41 1.33 0.91
53 11463 1029 8.98 2.83 1.41 0.94 1.35 1.04 0.80
35 11740 640 5.45 3.32 1.66 1.11 2.19 1.44 1.03
105 11899.81 490.02 4.12 3.61 1.8 1.2 2.71 1.65 1.15
113 12355 1472 11.91 4.42 2.21 1.47 1.57 1.34 1.11 112 13129.38 1582.08 12.05 5.80 2.90 1.93 1.94 1.68 1.41
62 72021.5* 2959.11 4.11 111.00 55.50 37.00 20.63 19.64 18.26
Cr (9890 ± 1120.60) [μg/L]
112 7056.762 664.32 9.41 -5.06 -2.53 -1.69 3.26 2.17 1.57
78 7089 101 1.42 -5.00 -2.5 -1.67 4.92 2.49 1.66 107 8080 376.2 4.66 -3.23 -1.62 -1.08 2.68 1.53 1.05
103 8122.398 210.01 2.59 -3.15 -1.58 -1.05 2.95 1.55 1.04
118 8275 445 5.38 -2.88 -1.44 -0.96 2.26 1.34 0.93
108 8580.6 170.1 1.98 -2.34 -1.17 -0.78 2.24 1.16 0.78
69 8800 1000 11.36 -1.95 -0.97 -0.65 0.95 0.73 0.56 54 9727 170 1.75 -0.29 -0.15 -0.10 0.28 0.14 0.10
72 9881 160 1.62 -0.02 -0.01 -0.01 0.02 0.01 0.01
89 9969 84 0.84 0.14 0.07 0.05 0.14 0.07 0.05
104 10020 40 0.4 0.23 0.12 0.08 0.23 0.12 0.08
75 10036.4 103.5 1.03 0.26 0.13 0.09 0.26 0.13 0.09
117 10100 100 0.99 0.37 0.19 0.12 0.37 0.19 0.12 93 10130 500 4.94 0.43 0.21 0.14 0.32 0.2 0.14
57 10157 842 8.29 0.48 0.24 0.16 0.26 0.19 0.14
53 10184 103 1.01 0.52 0.26 0.17 0.52 0.26 0.17
105 10283.41 36.74 0.36 0.7 0.35 0.23 0.7 0.35 0.23
110 10343 254.03 2.46 0.81 0.40 0.27 0.74 0.39 0.27 106 10343.4 185.13 1.79 0.81 0.40 0.27 0.77 0.4 0.27
73 10452.6 44.8 0.43 1.00 0.50 0.33 1.00 0.5 0.33
116 10476.6 227.33 2.17 1.05 0.52 0.35 0.97 0.51 0.35
114 10600 448 4.23 1.27 0.63 0.42 0.99 0.59 0.41
111 10988 553 5.03 1.96 0.98 0.65 1.39 0.88 0.62 109 11144.18 449.43 4.03 2.24 1.12 0.75 1.75 1.04 0.72

TABLE 3a (cont). SUMMARY OF THE REPORTED RESULTS AND THE
CALCULATED z- AND u-SCORES FOR SAMPLE “1”
20
Lab
ora
tory
co
de
An
aly
te c
on
cen
trati
on
Sta
nd
ard
dev
.
Rela
tiv
e s
td.
dev
., [
%]
z-scores u-scores
k = 0.5 k = 1.0 k = 1.5 k = 0.5 k = 1.0 k = 1.5
35 11370 610 5.36 2.64 1.32 0.88 1.79 1.16 0.83
113 11671 659 5.65 3.18 1.59 1.06 2.06 1.37 0.99 95 11696 179 1.53 3.22 1.61 1.07 3.07 1.59 1.07
115 12312.78 1283.83 10.43 4.32 2.16 1.44 1.73 1.42 1.15
62 64438.5* 533.25 0.83 97.36 48.68 32.45 70.52 43.96 30.93
Cu (9880 ± 1119.63) [μg/L]
67 2382* 95 3.99 -13.39 -6.70 -4.46 13.20 6.67 4.46 107 8024* 183.9 2.29 -3.32 -1.66 -1.11 3.15 1.64 1.10
78 9080 125 1.38 -1.43 -0.71 -0.48 1.39 0.71 0.48
111 9425 451 4.79 -0.81 -0.41 -0.27 0.63 0.38 0.26
110 9427 283.52 3.01 -0.81 -0.4 -0.27 0.72 0.39 0.27
93 9490 389.8 4.11 -0.70 -0.35 -0.23 0.57 0.33 0.23 108 9573 106.9 1.12 -0.55 -0.27 -0.18 0.54 0.27 0.18
69 9600 800 8.33 -0.50 -0.25 -0.17 0.29 0.20 0.15
112 9829.209 725.41 7.38 -0.09 -0.05 -0.03 0.06 0.04 0.03
75 9874.4 221.6 2.24 -0.01 -0.01 0.00 0.01 0.00 0.00
103 9961.403 574.32 5.77 0.15 0.07 0.05 0.10 0.06 0.05
57 9981 501 5.02 0.18 0.09 0.06 0.13 0.08 0.06 118 9982 737 7.38 0.18 0.09 0.06 0.11 0.08 0.06
72 10065 440 4.37 0.33 0.17 0.11 0.26 0.15 0.11
53 10073 671 6.66 0.34 0.17 0.11 0.22 0.15 0.11
115 10217.92 643.3 6.3 0.60 0.30 0.20 0.40 0.26 0.19
89 10250 279 2.72 0.66 0.33 0.22 0.59 0.32 0.22 116 10390.2 70.68 0.68 0.91 0.46 0.30 0.90 0.45 0.30
104 10400 30 0.29 0.93 0.46 0.31 0.93 0.46 0.31
105 10452.06 94.67 0.91 1.02 0.51 0.34 1.01 0.51 0.34
117 10500 100 0.95 1.11 0.55 0.37 1.09 0.55 0.37
106 10648.6 551.39 5.18 1.37 0.69 0.46 0.98 0.62 0.43 95 10672 72 0.67 1.41 0.71 0.47 1.40 0.71 0.47
114 10800 246 2.28 1.64 0.82 0.55 1.50 0.80 0.54
113 10870 449 4.13 1.77 0.88 0.59 1.38 0.82 0.57
109 10885.17 801.66 7.36 1.80 0.90 0.60 1.03 0.73 0.54
35 11120 800 7.19 2.22 1.11 0.74 1.27 0.90 0.67
54 11221 333 2.97 2.40 1.20 0.80 2.06 1.15 0.78 73 12243.8* 34.6 0.28 4.22 2.11 1.41 4.21 2.11 1.41
62 72358.5* 1159.76 1.6 111.61 55.80 37.20 48.52 38.76 30.61
Eu (9880 ± 395.89) [μg/L]
75 19.2 1.8 9.37 - - - - - -
Fe (9890 ± 1120.60) [μg/L]
67 6530* 170 2.6 -6.00 -3.00 -2.00 5.74 2.96 1.99
107 8447 164.6 1.95 -2.58 -1.29 -0.86 2.47 1.27 0.85
78 8770 492 5.61 -2.00 -1.00 -0.67 1.50 0.92 0.64
103 9468.527 405.53 4.28 -0.75 -0.38 -0.25 0.61 0.35 0.24

TABLE 3a (cont). SUMMARY OF THE REPORTED RESULTS AND THE
CALCULATED z- AND u-SCORES FOR SAMPLE “1”
21
Lab
ora
tory
co
de
An
aly
te c
on
cen
trati
on
Sta
nd
ard
dev
.
Rela
tiv
e s
td.
dev
., [
%]
z-scores u-scores
k = 0.5 k = 1.0 k = 1.5 k = 0.5 k = 1.0 k = 1.5
69 9500 1000 10.53 -0.70 -0.35 -0.23 0.34 0.26 0.20
110 9678.8 230.68 2.38 -0.38 -0.19 -0.13 0.35 0.18 0.12 112 9853.178 747.99 7.59 -0.07 -0.03 -0.02 0.04 0.03 0.02
117 9950 50 0.5 0.11 0.05 0.04 0.11 0.05 0.04
72 9968 338 3.39 0.14 0.07 0.05 0.12 0.07 0.05
108 10037.4 77.6 0.77 0.26 0.13 0.09 0.26 0.13 0.09
118 10169 470 4.62 0.50 0.25 0.17 0.38 0.23 0.16 53 10206 73 0.72 0.56 0.28 0.19 0.56 0.28 0.19
105 10208.62 39.63 0.39 0.57 0.28 0.19 0.57 0.28 0.19
89 10246 177 1.73 0.64 0.32 0.21 0.61 0.31 0.21
104 10300 30 0.29 0.73 0.37 0.24 0.73 0.37 0.24
75 10319.8 40.6 0.39 0.77 0.38 0.26 0.77 0.38 0.26 57 10348 917 8.86 0.82 0.41 0.27 0.43 0.32 0.24
54 10360 304 2.93 0.84 0.42 0.28 0.74 0.40 0.28
73 10453.2 37.6 0.36 1.01 0.50 0.34 1.00 0.50 0.33
106 10530.2 352.71 3.35 1.14 0.57 0.38 0.97 0.54 0.37
95 10636 264 2.48 1.33 0.67 0.44 1.2 0.65 0.44
116 10648.2 114.33 1.07 1.35 0.68 0.45 1.33 0.67 0.45 93 10860 242.6 2.23 1.73 0.87 0.58 1.59 0.85 0.57
114 11100 249 2.24 2.16 1.08 0.72 1.97 1.05 0.71
109 11140.34 272.73 2.45 2.23 1.12 0.74 2.01 1.08 0.73
115 11281.68 566.71 5.02 2.48 1.24 0.83 1.75 1.11 0.78
111 11302 510 4.51 2.52 1.26 0.84 1.86 1.15 0.80 113 12240 405 3.31 4.19 2.10 1.40 3.40 1.97 1.36
35 12280 230 1.87 4.27 2.13 1.42 3.95 2.09 1.41
62 42225.25* 117.44 0.28 57.71 28.86 19.24 56.48 28.70 19.19
In (9880 ± 1119.63) [μg/L]
72 5312 112 2.11 -8.16 -4.08 -2.72 8.00 4.06 2.71 108 5990 388.8 6.49 -6.95 -3.47 -2.32 5.71 3.28 2.26
105 8233.044 613.64 7.45 -2.94 -1.47 -0.98 1.98 1.29 0.92
109 8910.649 505.91 5.68 -1.73 -0.87 -0.58 1.28 0.79 0.55
75 10204 466.1 4.57 0.58 0.29 0.19 0.44 0.27 0.19
95 11168 279 2.5 2.30 1.15 0.77 2.06 1.12 0.76
106 12858.8 928.4 7.22 5.32 2.66 1.77 2.75 2.05 1.55 53 13820 763 5.52 7.04 3.52 2.35 4.16 2.91 2.14
117 17500 300 1.71 13.61 6.81 4.54 12.00 6.57 4.47
Ir [μg/L]
105 47.887 3.02 6.3 - - - - - -
75 48 1.9 3.96 - - - - - -
K (9930 ± 1124.45) [μg/L]
78 5552 455 8.2 -7.79 -3.89 -2.60 6.05 3.61 2.51
72 8116 908 11.19 -3.23 -1.61 -1.08 1.70 1.26 0.95
93 9170 1675 18.27 -1.35 -0.68 -0.45 0.43 0.38 0.32

TABLE 3a (cont). SUMMARY OF THE REPORTED RESULTS AND THE
CALCULATED z- AND u-SCORES FOR SAMPLE “1”
22
Lab
ora
tory
co
de
An
aly
te c
on
cen
trati
on
Sta
nd
ard
dev
.
Rela
tiv
e s
td.
dev
., [
%]
z-scores u-scores
k = 0.5 k = 1.0 k = 1.5 k = 0.5 k = 1.0 k = 1.5
117 9600 700 7.29 -0.59 -0.29 -0.20 0.37 0.25 0.18
108 9683.8 689.8 7.12 -0.44 -0.22 -0.15 0.28 0.19 0.14 57 9840 737 7.49 -0.16 -0.08 -0.05 0.10 0.07 0.05
118 9932 1161 11.69 0.00 0.00 0.00 0.00 0.00 0.00
116 10000.2 744.08 7.44 0.12 0.06 0.04 0.08 0.05 0.04
107 10423 998.6 9.58 0.88 0.44 0.29 0.43 0.33 0.25
104 11300 108 0.96 2.44 1.22 0.81 2.39 1.21 0.81 110 11571.2 1855.7 16.04 2.92 1.46 0.97 0.85 0.76 0.65
109 11624.02 1511.56 13 3.01 1.51 1.00 1.05 0.90 0.75
111 11660 808 6.93 3.08 1.54 1.03 1.76 1.25 0.93
75 11827.4 1637.5 13.84 3.37 1.69 1.12 1.10 0.96 0.81
53 11956 1819 15.21 3.60 1.80 1.20 1.06 0.95 0.82 106 13246.2 842.1 6.36 5.90 2.95 1.97 3.28 2.36 1.76
54 14088 2125 15.08 7.40 3.70 2.47 1.89 1.73 1.53
73 14516.4 102.8 0.71 8.16 4.08 2.72 8.02 4.06 2.71
105 15494.41 732.33 4.73 9.90 4.95 3.30 6.03 4.15 3.03
69 15900 300 1.89 10.62 5.31 3.54 9.37 5.13 3.48
113 16110 2718 16.87 10.99 5.50 3.66 2.23 2.10 1.93 112 17404.62 2218.99 12.75 13.29 6.65 4.43 3.27 3.00 2.68
95 19044 2318 12.17 16.21 8.11 5.40 3.82 3.54 3.18
35 26400* 940 3.56 29.29 14.65 9.76 15.04 11.24 8.53
62 91502* 1434.91 1.57 145.09 72.54 48.36 52.93 44.75 36.84
Mg (9910 ± 1122.52) [μg/L]
75 3794 2201.66 58.03 -10.90 -5.45 -3.63 2.69 2.47 2.21
108 5182 0 0 -8.42 -4.21 -2.81 8.42 4.21 2.81
105 10110.01 1695.13 16.77 0.36 0.18 0.12 0.11 0.10 0.08
Mn (9910 ± 1122.52) [μg/L]
67 1420* 150 10.56 -15.13 -7.56 -5.04 14.61 7.50 5.02 107 7552 311.9 4.13 -4.20 -2.10 -1.40 3.67 2.02 1.38
78 8188 384 4.69 -3.07 -1.53 -1.02 2.53 1.45 1.00
69 8800 1000 11.36 -1.98 -0.99 -0.66 0.97 0.74 0.57
118 9286 916 9.86 -1.11 -0.56 -0.37 0.58 0.43 0.33
108 9295.2 207.5 2.23 -1.10 -0.55 -0.37 1.03 0.54 0.36
110 9641.72 488.71 5.07 -0.48 -0.24 -0.16 0.36 0.22 0.15 57 9716 687 7.07 -0.35 -0.17 -0.12 0.22 0.15 0.11
103 9816.008 1335.51 13.61 -0.17 -0.08 -0.06 0.06 0.05 0.04
72 10077 545 5.41 0.30 0.15 0.10 0.21 0.13 0.09
115 10195.48 1621.84 15.91 0.51 0.25 0.17 0.17 0.14 0.12
89 10338 333 3.22 0.76 0.38 0.25 0.66 0.37 0.25 93 10340 736 7.12 0.77 0.38 0.26 0.46 0.32 0.23
117 10400 500 4.81 0.87 0.44 0.29 0.65 0.40 0.28
104 10400 40 0.38 0.87 0.44 0.29 0.87 0.44 0.29
54 10463 871 8.32 0.99 0.49 0.33 0.53 0.39 0.29
106 10465.8 252.12 2.41 0.99 0.50 0.33 0.90 0.48 0.33

TABLE 3a (cont). SUMMARY OF THE REPORTED RESULTS AND THE
CALCULATED z- AND u-SCORES FOR SAMPLE “1”
23
Lab
ora
tory
co
de
An
aly
te c
on
cen
trati
on
Sta
nd
ard
dev
.
Rela
tiv
e s
td.
dev
., [
%]
z-scores u-scores
k = 0.5 k = 1.0 k = 1.5 k = 0.5 k = 1.0 k = 1.5
116 10547.6 240.62 2.28 1.14 0.57 0.38 1.04 0.56 0.37
111 10673 699 6.55 1.36 0.68 0.45 0.85 0.58 0.42 73 10883 42.4 0.39 1.73 0.87 0.58 1.73 0.87 0.58
75 10900 1120.4 10.28 1.76 0.88 0.59 0.79 0.62 0.49
114 11100 475 4.28 2.12 1.06 0.71 1.62 0.98 0.68
109 11706.04 862.1 7.36 3.20 1.6 1.07 1.75 1.27 0.95
95 11890 583 4.9 3.53 1.76 1.18 2.45 1.57 1.11 105 12090.46 572.52 4.74 3.88 1.94 1.29 2.72 1.73 1.23
35 12790 350 2.74 5.13 2.57 1.71 4.35 2.45 1.67
112 13102.85 1680.23 12.82 5.69 2.84 1.90 1.80 1.58 1.34
113 13640 1949 14.29 6.65 3.32 2.22 1.84 1.66 1.45
62 64539.25* 1850.06 2.87 97.33 48.67 32.44 28.26 25.24 21.84
Mo [μg/L]
105 10585.29 905 8.55 - - - - - -
73 381705 3580 0.94 - - - - - -
Na [μg/L]
75 34521 5701.68 16.52 - - - - - -
Ni (9890 ± 1120.60) [μg/L]
67 2126* 98 4.61 -13.86 -6.93 -4.62 13.65 6.90 4.61
107 8330 152.6 1.83 -2.78 -1.39 -0.93 2.69 1.38 0.92
69 9300 300 3.23 -1.05 -0.53 -0.35 0.93 0.51 0.35
111 9332 406 4.35 -1.00 -0.50 -0.33 0.81 0.47 0.32
110 9507.8 404.2 4.25 -0.68 -0.34 -0.23 0.55 0.32 0.22 78 9750 461 4.73 -0.25 -0.12 -0.08 0.19 0.12 0.08
75 9857.6 295.9 3 -0.06 -0.03 -0.02 0.05 0.03 0.02
118 9871 809 8.2 -0.03 -0.02 -0.01 0.02 0.01 0.01
108 9879 189.8 1.92 -0.02 -0.01 -0.01 0.02 0.01 0.01
93 10030 344.7 3.44 0.25 0.12 0.08 0.21 0.12 0.08 72 10063 215 2.14 0.31 0.15 0.10 0.29 0.15 0.10
57 10082 588 5.83 0.34 0.17 0.11 0.24 0.15 0.11
106 10274.4 253.87 2.47 0.69 0.34 0.23 0.62 0.33 0.23
117 10300 200 1.94 0.73 0.37 0.24 0.69 0.36 0.24
103 10506.08 1098.2 10.45 1.10 0.55 0.37 0.50 0.39 0.31
73 10559 33 0.31 1.19 0.60 0.40 1.19 0.60 0.4 89 10590 279 2.63 1.25 0.62 0.42 1.12 0.61 0.41
104 10600 30 0.28 1.27 0.63 0.42 1.27 0.63 0.42
116 10604.4 214.4 2.02 1.28 0.64 0.43 1.19 0.63 0.42
114 10700 332 3.1 1.45 0.72 0.48 1.24 0.69 0.47
54 10768 298 2.77 1.57 0.78 0.52 1.38 0.76 0.51 95 10977 202 1.84 1.94 0.97 0.65 1.83 0.95 0.64
53 11216 933 8.32 2.37 1.18 0.79 1.22 0.91 0.69
35 11310 700 6.19 2.53 1.27 0.84 1.58 1.07 0.78
109 11503.08 677.73 5.89 2.88 1.44 0.96 1.83 1.23 0.89

TABLE 3a (cont). SUMMARY OF THE REPORTED RESULTS AND THE
CALCULATED z- AND u-SCORES FOR SAMPLE “1”
24
Lab
ora
tory
co
de
An
aly
te c
on
cen
trati
on
Sta
nd
ard
dev
.
Rela
tiv
e s
td.
dev
., [
%]
z-scores u-scores
k = 0.5 k = 1.0 k = 1.5 k = 0.5 k = 1.0 k = 1.5
105 11651.08 463.1 3.97 3.14 1.57 1.05 2.42 1.45 1.01
115 11791.2 1223.64 10.38 3.39 1.70 1.13 1.41 1.15 0.91 112 12164.97 1411.95 11.61 4.06 2.03 1.35 1.50 1.26 1.04
113 12267 1159 9.45 4.24 2.12 1.41 1.85 1.47 1.16
62 71547* 1630.52 2.28 110.04 55.02 36.68 35.76 31.16 26.33
Os [μg/L]
75 5.2 0.4 7.69 - - - - - - 105 128.833 5.41 4.2 - - - - - -
Pb (9910 ± 1122.52) [μg/L]
67 3980* 110 2.76 -10.57 -5.28 -3.52 10.37 5.26 3.51
118 5625* 466 8.28 -7.63 -3.82 -2.54 5.87 3.53 2.45
69 8400 400 4.76 -2.69 -1.35 -0.90 2.19 1.27 0.87 95 8693 843 9.7 -2.17 -1.08 -0.72 1.20 0.87 0.65
108 8798.2 136.4 1.55 -1.98 -0.99 -0.66 1.92 0.98 0.66
114 9210 234 2.54 -1.25 -0.62 -0.42 1.15 0.61 0.41
103 9383.756 758.15 8.08 -0.94 -0.47 -0.31 0.56 0.39 0.28
72 9510 242 2.54 -0.71 -0.36 -0.24 0.65 0.35 0.24
110 9540.2 621.74 6.52 -0.66 -0.33 -0.22 0.44 0.29 0.21 57 9828 114 1.16 -0.15 -0.07 -0.05 0.14 0.07 0.05
112 10535.02 1440.84 13.68 1.11 0.56 0.37 0.40 0.34 0.28
78 10558 500 4.74 1.15 0.58 0.38 0.86 0.53 0.37
107 10559 945.8 8.96 1.16 0.58 0.39 0.59 0.44 0.34
109 10698.67 1993.56 18.63 1.41 0.70 0.47 0.38 0.34 0.30 93 10860 651 5.99 1.69 0.85 0.56 1.11 0.73 0.53
75 10897.8 468 4.29 1.76 0.88 0.59 1.35 0.81 0.57
104 11000 30 0.27 1.94 0.97 0.65 1.94 0.97 0.65
116 11056.6 283.81 2.57 2.04 1.02 0.68 1.82 0.99 0.67
117 11200 200 1.79 2.30 1.15 0.77 2.17 1.13 0.76 106 11287.2 1395.12 12.36 2.45 1.23 0.82 0.92 0.77 0.63
54 11441 551 4.82 2.73 1.36 0.91 1.95 1.22 0.86
89 11832 1737 14.68 3.42 1.71 1.14 1.05 0.93 0.79
53 12284 355 2.89 4.23 2.11 1.41 3.57 2.02 1.38
113 12345 1355 10.98 4.34 2.17 1.45 1.66 1.38 1.13
105 12866.75 871.05 6.77 5.27 2.63 1.76 2.85 2.08 1.56 111 14168 1204 8.5 7.59 3.79 2.53 3.21 2.59 2.06
73 14891.8 37 0.25 8.88 4.44 2.96 8.86 4.44 2.96
35 15700 430 2.74 10.32 5.16 3.44 8.19 4.82 3.33
62 57819* 1440.35 2.49 85.36 42.68 28.45 30.99 26.24 21.62
Rb [μg/L]
35 400 20 5 - - - - - -
Ru [μg/L]
72 1570 680 43.31 - - - - - -

TABLE 3a (cont). SUMMARY OF THE REPORTED RESULTS AND THE
CALCULATED z- AND u-SCORES FOR SAMPLE “1”
25
Lab
ora
tory
co
de
An
aly
te c
on
cen
trati
on
Sta
nd
ard
dev
.
Rela
tiv
e s
td.
dev
., [
%]
z-scores u-scores
k = 0.5 k = 1.0 k = 1.5 k = 0.5 k = 1.0 k = 1.5
105 7106.299 882.36 12.42 - - - - - -
S [μg/L]
75 9696.6 1605.4 16.56 - - - - - -
105 18308.72 1072.54 5.86 - - - - - -
112 21954.77 7602.85 34.63 - - - - - -
67 35300 3200 9.07 - - - - - -
111 37194 2251 6.05 - - - - - - 69 41900 4000 9.55 - - - - - -
Sc [μg/L]
35 5100 960 18.82 - - - - - -
Si [μg/L]
73 3090706 7244.6 0.23 - - - - - -
Sn [μg/L]
75 339.6 38.9 11.45 - - - - - -
117 500 200 40 - - - - - -
105 4507.253* 180.73 4.01 - - - - - -
Sr (9880 ± 1119.63) [μg/L]
116 9564.6 187.21 1.96 -0.56 -0.28 -0.19 0.53 0.28 0.19 108 10037.2 161.9 1.61 0.28 0.14 0.09 0.27 0.14 0.09
72 10062 345 3.43 0.33 0.16 0.11 0.28 0.16 0.11
57 10270 256 2.49 0.70 0.35 0.23 0.63 0.34 0.23
107 10494 1009.2 9.62 1.10 0.55 0.37 0.53 0.41 0.31
104 10600 30 0.28 1.29 0.64 0.43 1.28 0.64 0.43 35 10610 360 3.39 1.30 0.65 0.43 1.10 0.62 0.43
118 10830 580 5.36 1.70 0.85 0.57 1.18 0.75 0.53
75 10902.6 1045.7 9.59 1.83 0.91 0.61 0.86 0.67 0.52
110 10915.8 803.61 7.36 1.85 0.93 0.62 1.06 0.75 0.56
103 10976.39 1086.56 9.9 1.96 0.98 0.65 0.90 0.70 0.55 93 11020 340.2 3.09 2.04 1.02 0.68 1.74 0.97 0.67
109 11145.15 2382.7 21.38 2.26 1.13 0.75 0.52 0.48 0.43
114 11400 435 3.82 2.72 1.36 0.91 2.14 1.27 0.88
54 11828 1401 11.84 3.48 1.74 1.16 1.29 1.09 0.89
106 11881.2 1641.51 13.82 3.57 1.79 1.19 1.15 1.01 0.85
89 12012 1766 14.7 3.81 1.90 1.27 1.15 1.02 0.87 53 12074 321 2.66 3.92 1.96 1.31 3.40 1.88 1.28
115 12217.04 490.85 4.02 4.17 2.09 1.39 3.14 1.91 1.34
78 12244 674 5.5 4.22 2.11 1.41 2.70 1.81 1.31
69 12300 700 5.69 4.32 2.16 1.44 2.70 1.83 1.33
105 12790.67 1050.02 8.21 5.20 2.60 1.73 2.45 1.90 1.47 95 12794 144 1.13 5.21 2.60 1.74 5.04 2.58 1.73
113 13027 1863 14.3 5.62 2.81 1.87 1.62 1.45 1.25

TABLE 3a (cont). SUMMARY OF THE REPORTED RESULTS AND THE
CALCULATED z- AND u-SCORES FOR SAMPLE “1”
26
Lab
ora
tory
co
de
An
aly
te c
on
cen
trati
on
Sta
nd
ard
dev
.
Rela
tiv
e s
td.
dev
., [
%]
z-scores u-scores
k = 0.5 k = 1.0 k = 1.5 k = 0.5 k = 1.0 k = 1.5
73 13647.2 29.2 0.21 6.73 3.36 2.24 6.72 3.36 2.24
111 18842* 1055 5.6 16.01 8.00 5.34 7.50 5.83 4.52 112 19379.68* 2883.15 14.88 16.97 8.48 5.66 3.23 3.07 2.85
67 28910* 270 0.93 33.99 17.00 11.33 30.62 16.52 11.19
62 64712* 1948.87 3.01 97.95 48.97 32.65 27.04 24.40 21.31
Ta [μg/L]
75 40.2 3 7.46 - - - - - - 105 344.673 12 3.48 - - - - - -
Th [μg/L]
105 18.619 6.23 33.48 - - - - - -
Ti [μg/L]
75 143* 35.4 24.76 - - - - - - 105 245.715* 29.81 12.13 - - - - - -
95 4303 735 17.08 - - - - - -
35 4600 590 12.83 - - - - - -
111 5152 299 5.8 - - - - - -
Tl (9920 ± 1123.48) [μg/L]
78 415* 35 8.43 -16.92 -8.46 -5.64 16.89 8.46 5.64 69 8500 300 3.53 -2.53 -1.26 -0.84 2.23 1.22 0.83
95 8736 406 4.65 -2.11 -1.05 -0.70 1.71 0.99 0.68
108 9045 228.5 2.53 -1.56 -0.78 -0.52 1.44 0.76 0.51
118 9071 214 2.36 -1.51 -0.76 -0.50 1.41 0.74 0.50
93 9108 367.8 4.04 -1.45 -0.72 -0.48 1.21 0.69 0.47 72 9469 258 2.72 -0.80 -0.40 -0.27 0.73 0.39 0.26
103 9927.026 998.47 10.06 0.01 0.01 0.00 0.01 0.00 0.00
57 10078 102 1.01 0.28 0.14 0.09 0.28 0.14 0.09
106 10103.8 389.69 3.86 0.33 0.16 0.11 0.27 0.15 0.11
73 10143.2 28.8 0.28 0.40 0.20 0.13 0.4 0.20 0.13 110 10480.8 625.39 5.97 1.00 0.50 0.33 0.67 0.44 0.31
111 10576 632 5.98 1.17 0.58 0.39 0.78 0.51 0.36
117 10600 500 4.72 1.21 0.61 0.40 0.90 0.55 0.39
109 10600.81 535.76 5.05 1.21 0.61 0.40 0.88 0.55 0.39
75 10614.4 997.9 9.4 1.24 0.62 0.41 0.61 0.46 0.35
89 10642 629 5.91 1.29 0.64 0.43 0.86 0.56 0.40 107 10807 574.9 5.32 1.58 0.79 0.53 1.10 0.70 0.50
116 10911.2 98.98 0.91 1.76 0.88 0.59 1.74 0.88 0.59
104 11200 30 0.27 2.28 1.14 0.76 2.28 1.14 0.76
54 11576 1081 9.34 2.95 1.47 0.98 1.36 1.06 0.83
53 11759 822 6.99 3.27 1.64 1.09 1.85 1.32 0.98 105 12138.84 443.6 3.65 3.95 1.97 1.32 3.10 1.84 1.27
113 15496* 1543 9.96 9.93 4.96 3.31 3.40 2.92 2.44
35 17970* 490 2.73 14.33 7.17 4.78 10.8 6.57 4.59

TABLE 3a (cont). SUMMARY OF THE REPORTED RESULTS AND THE
CALCULATED z- AND u-SCORES FOR SAMPLE “1”
27
Lab
ora
tory
co
de
An
aly
te c
on
cen
trati
on
Sta
nd
ard
dev
.
Rela
tiv
e s
td.
dev
., [
%]
z-scores u-scores
k = 0.5 k = 1.0 k = 1.5 k = 0.5 k = 1.0 k = 1.5
112 19059.73* 2611.46 13.7 16.27 8.14 5.42 3.42 3.21 2.94
62 64938.75* 2502.86 3.85 97.94 48.97 32.65 21.45 20.05 18.23
V [μg/L]
75 10 0.7 7 - - - - - -
105 61.39 17.13 27.9 - - - - - -
111 2171 94 4.33 - - - - - -
35 3030 300 9.9 - - - - - -
Y [μg/L]
105 4.33 1.9 43.86 - - - - - -
Zn (9890 ± 1120.60) [μg/L]
67 2674* 870 32.54 -12.88 -6.44 -4.29 6.97 5.09 3.81
107 8155* 108.1 1.33 -3.10 -1.55 -1.03 3.04 1.54 1.03 110 9164 401.06 4.38 -1.30 -0.65 -0.43 1.05 0.61 0.42
115 9621.28 492.12 5.11 -0.48 -0.24 -0.16 0.36 0.22 0.15
93 9680 306.4 3.17 -0.37 -0.19 -0.12 0.33 0.18 0.12
114 9780 295 3.02 -0.20 -0.10 -0.07 0.17 0.09 0.06
118 9831 566 5.76 -0.11 -0.05 -0.04 0.07 0.05 0.03
69 9900 200 2.02 0.02 0.01 0.01 0.02 0.01 0.01 75 9935.6 290.1 2.92 0.08 0.04 0.03 0.07 0.04 0.03
57 10009 497 4.97 0.21 0.11 0.07 0.16 0.10 0.07
108 10037.6 176.9 1.76 0.26 0.13 0.09 0.25 0.13 0.09
89 10139 245 2.42 0.44 0.22 0.15 0.41 0.22 0.15
72 10254 104 1.01 0.65 0.32 0.22 0.64 0.32 0.22 116 10267.6 204.48 1.99 0.67 0.34 0.22 0.63 0.33 0.22
78 10291 222 2.16 0.72 0.36 0.24 0.67 0.35 0.24
117 10300 200 1.94 0.73 0.37 0.24 0.69 0.36 0.24
106 10426.4 247.67 2.38 0.96 0.48 0.32 0.88 0.47 0.32
95 10564 135 1.28 1.20 0.60 0.40 1.17 0.60 0.40 104 10600 30 0.28 1.27 0.63 0.42 1.27 0.63 0.42
54 10709 282 2.63 1.46 0.73 0.49 1.31 0.71 0.48
35 10800 710 6.57 1.62 0.81 0.54 1.01 0.69 0.50
73 10860 30.2 0.28 1.73 0.87 0.58 1.73 0.87 0.58
103 10960.96 927.68 8.46 1.91 0.96 0.64 0.99 0.74 0.56
53 10998 995 9.05 1.98 0.99 0.66 0.97 0.74 0.57 109 11017.32 732.89 6.65 2.01 1.01 0.67 1.22 0.84 0.61
113 11023 855 7.76 2.02 1.01 0.67 1.11 0.80 0.60
105 11230.5 439.04 3.91 2.39 1.20 0.80 1.88 1.11 0.77
112 11843.03 704.1 5.95 3.49 1.74 1.16 2.17 1.48 1.07
111 14035* 570 4.06 7.40 3.70 2.47 5.19 3.30 2.34 62 60166.5* 1301.81 2.16 89.73 44.87 29.91 35.47 29.27 23.65

28
TABLE 3b. SUMMARY OF THE REPORTED RESULTS AND THE CALCULATED z- AND u-SCORES FOR SAMPLE “2”
Lab
ora
tory
co
de
An
aly
te c
on
cen
trati
on
Sta
nd
ard
dev
.
Rela
tiv
e s
td.
dev
., [
%]
z-scores u-scores
k = 0.5 k = 1.0 k = 1.5 k = 0.5 k = 1.0 k = 1.5
Ag [μg/L]
95 368 147 39.95 - - - - - -
108 1067.8 119.5 11.19 - - - - - -
105 4834.146 629.66 13.03 - - - - - -
Al [μg/L]
75 491 111.01 22.61 - - - - - -
108 3136 226.3 7.22 - - - - - -
105 6197.396 1288.59 20.79 - - - - - -
As [μg/L]
75 3.8 1.1 28.95 - - - - - - 117 4 1 25 - - - - - -
Ba (335.78 ± 63.30) [μg/L]
69 29 1 3.45 -9.69 -4.85 -3.23 9.69 4.85 3.23
62 69.2 25.76 37.23 -8.42 -4.21 -2.81 6.53 3.9 2.71
106 103 14.93 14.5 -7.35 -3.68 -2.45 6.65 3.58 2.42 116 144.8 9.07 6.26 -6.03 -3.02 -2.01 5.80 2.99 2.00
72 205 46 22.44 -4.13 -2.07 -1.38 2.34 1.67 1.24
118 212 34 16.04 -3.91 -1.96 -1.30 2.66 1.72 1.23
54 266 17 6.39 -2.20 -1.10 -0.73 1.94 1.06 0.72
75 340.2 58.2 17.11 0.14 0.07 0.05 0.07 0.05 0.04
107 346.4 67.5 19.49 0.34 0.17 0.11 0.14 0.11 0.09 89 358.2 122.5 34.2 0.71 0.35 0.24 0.18 0.16 0.14
73 366.2 39.2 10.7 0.96 0.48 0.32 0.60 0.41 0.30
117 510 160 31.37 5.50 2.75 1.83 1.07 1.01 0.94
108 568.2 97.3 17.12 7.34 3.67 2.45 2.27 2.00 1.71
53 627 117 18.66 9.20 4.60 3.07 2.4 2.19 1.93 109 891.562 102.32 11.48 17.56 8.78 5.85 5.19 4.62 3.98
105 1230.224* 182.55 14.84 28.26 14.13 9.42 4.83 4.63 4.35
Bi [μg/L]
89 8.4 3.9 46.43 - - - - - -
105 23.858 1.28 5.35 - - - - - - 108 118 0 0 - - - - - -
Ca (3452.61 ± 458.34) [μg/L]
62 548.8 77.29 14.08 -12.67 -6.34 -4.22 12.01 6.25 4.20
69 1100 200 18.18 -10.27 -5.13 -3.42 7.73 4.70 3.29
57 1165 47 4.03 -9.98 -4.99 -3.33 9.78 4.97 3.32
116 1666 129.85 7.79 -7.80 -3.90 -2.60 6.78 3.75 2.55 118 2225 37 1.66 -5.36 -2.68 -1.79 5.29 2.67 1.78

TABLE 3b (cont). SUMMARY OF THE REPORTED RESULTS AND THE
CALCULATED z- AND u-SCORES FOR SAMPLE “2”
29
Lab
ora
tory
co
de
An
aly
te c
on
cen
trati
on
Sta
nd
ard
dev
.
Rela
tiv
e s
td.
dev
., [
%]
z-scores u-scores
k = 0.5 k = 1.0 k = 1.5 k = 0.5 k = 1.0 k = 1.5
106 2257.8 107.81 4.78 -5.21 -2.61 -1.74 4.72 2.54 1.72
72 2378 345 14.51 -4.69 -2.34 -1.56 2.59 1.87 1.40 54 2730 414 15.16 -3.15 -1.58 -1.05 1.53 1.17 0.90
95 3216 1137 35.35 -1.03 -0.52 -0.34 0.20 0.19 0.18
35 3340 420 12.57 -0.49 -0.25 -0.16 0.24 0.18 0.14
75 4898.4 796.9 16.27 6.31 3.15 2.10 1.74 1.57 1.37
117 5400 800 14.81 8.50 4.25 2.83 2.34 2.11 1.85 107 6548.8 824.9 12.6 13.51 6.76 4.50 3.62 3.28 2.88
73 6867.6 269 3.92 14.90 7.45 4.97 9.66 6.43 4.63
89 7447.8 1505.6 20.22 17.43 8.72 5.81 2.62 2.54 2.41
108 14263* 1663.8 11.67 47.17 23.59 15.72 6.44 6.26 6.00
105 14906.97* 2428.87 16.29 49.98 24.99 16.66 4.70 4.63 4.54 93 15810* 3205 20.27 53.92 26.96 17.97 3.85 3.82 3.77
104 35200* 7400 21.02 138.53 69.27 46.18 4.29 4.28 4.27
Cd (304.22 ± 58.21) [μg/L]
75 168.2 29.6 17.6 -4.67 -2.34 -1.56 3.28 2.08 1.48
116 180.7 26.81 14.84 -4.24 -2.12 -1.41 3.12 1.93 1.35
95 338 136 40.24 1.16 0.58 0.39 0.24 0.23 0.21 117 530 150 28.3 7.76 3.88 2.59 1.48 1.40 1.30
104 4700* 1900 40.43 151.03 75.52 50.34 2.31 2.31 2.31
Cl (1955.23 ± 282.75) [μg/L]
106 179.6 37.81 21.05 -12.56 -6.28 -4.19 12.13 6.22 4.17
118 362 18 4.97 -11.27 -5.63 -3.76 11.18 5.62 3.75 69 620 80 12.9 -9.44 -4.72 -3.15 8.22 4.54 3.09
72 1066 131 12.29 -6.29 -3.14 -2.1 4.61 2.85 2.00
73 2216.2 177.2 8 1.85 0.92 0.62 1.15 0.78 0.57
105 2564.416 595.98 23.24 4.31 2.15 1.44 0.99 0.92 0.83
75 2641.6 501.5 18.98 4.85 2.43 1.62 1.32 1.19 1.05 109 3437.626 389.35 11.33 10.49 5.24 3.50 3.58 3.08 2.57
108 4509.6 571.4 12.67 18.07 9.03 6.02 4.34 4.01 3.59
53 7614* 726 9.54 40.03 20.01 13.34 7.65 7.26 6.73
104 17400* 4400 25.29 109.25 54.62 36.42 3.51 3.50 3.49
Co (274.5 ± 53.34) [μg/L]
69 42 13 30.95 -8.72 -4.36 -2.91 7.84 4.23 2.87 119 51.679 10.34 20 -8.35 -4.18 -2.78 7.79 4.10 2.76
106 81.4 8.44 10.37 -7.24 -3.62 -2.41 6.90 3.58 2.40
118 88 4 4.55 -6.99 -3.50 -2.33 6.92 3.49 2.33
103 92.2 65.09 70.59 -6.84 -3.42 -2.28 2.59 2.17 1.77
54 154 23 14.94 -4.52 -2.26 -1.51 3.42 2.07 1.45 116 159.1 12.98 8.16 -4.33 -2.16 -1.44 3.89 2.10 1.42
62 171.4 53.93 31.46 -3.87 -1.93 -1.29 1.71 1.36 1.07
113 189 84 44.44 -3.21 -1.60 -1.07 0.97 0.86 0.74
72 217 32 14.75 -2.16 -1.08 -0.72 1.38 0.92 0.67

TABLE 3b (cont). SUMMARY OF THE REPORTED RESULTS AND THE
CALCULATED z- AND u-SCORES FOR SAMPLE “2”
30
Lab
ora
tory
co
de
An
aly
te c
on
cen
trati
on
Sta
nd
ard
dev
.
Rela
tiv
e s
td.
dev
., [
%]
z-scores u-scores
k = 0.5 k = 1.0 k = 1.5 k = 0.5 k = 1.0 k = 1.5
73 236.8 12.6 5.32 -1.41 -0.71 -0.47 1.28 0.69 0.47
57 252.3 6.1 2.42 -0.83 -0.42 -0.28 0.81 0.41 0.28 107 253.2 30 11.85 -0.80 -0.40 -0.27 0.53 0.35 0.25
75 272.6 39.5 14.49 -0.07 -0.04 -0.02 0.04 0.03 0.02
117 340 60 17.65 2.46 1.23 0.82 1.00 0.82 0.65
95 389 118 30.33 4.29 2.15 1.43 0.95 0.88 0.80
89 390.2 89 22.81 4.34 2.17 1.45 1.25 1.12 0.97 109 477.783 30.9 6.47 7.62 3.81 2.54 4.98 3.30 2.37
114 487 114 23.41 7.97 3.98 2.66 1.82 1.69 1.53
53 497 75 15.09 8.34 4.17 2.78 2.80 2.42 2.03
108 505.4 76.6 15.16 8.66 4.33 2.89 2.85 2.47 2.08
93 692 158.3 22.88 15.65 7.83 5.22 2.60 2.50 2.35 105 982.335* 150.62 15.33 26.54 13.27 8.85 4.63 4.43 4.15
104 1500* 350 23.33 45.95 22.97 15.32 3.49 3.46 3.41
Cr (144.99 ± 31.02) [μg/L]
119 16.765 3.35 20 -8.27 -4.13 -2.76 8.08 4.11 2.75
106 39.6 5.41 13.67 -6.80 -3.40 -2.27 6.42 3.35 2.25
62 56.6 8.9 15.73 -5.70 -2.85 -1.90 4.94 2.74 1.87 108 60.6 6.1 10.07 -5.44 -2.72 -1.81 5.06 2.67 1.80
116 126.36 3.83 3.03 -1.20 -0.60 -0.40 1.17 0.60 0.40
107 133.2 16.1 12.09 -0.76 -0.38 -0.25 0.53 0.34 0.24
54 135 14 10.37 -0.64 -0.32 -0.21 0.48 0.29 0.21
118 140 4 2.86 -0.32 -0.16 -0.11 0.31 0.16 0.11 72 152 12 7.89 0.45 0.23 0.15 0.36 0.21 0.15
73 154.6 12.6 8.15 0.62 0.31 0.21 0.48 0.29 0.20
113 164 37 22.56 1.23 0.61 0.41 0.47 0.39 0.32
117 180 20 11.11 2.26 1.13 0.75 1.38 0.95 0.69
109 187.307 23.65 12.63 2.73 1.36 0.91 1.50 1.08 0.81 75 191.8 24.9 12.98 3.02 1.51 1.01 1.60 1.18 0.89
89 196.2 22.7 11.57 3.30 1.65 1.10 1.86 1.33 0.99
93 198 22.87 11.55 3.42 1.71 1.14 1.92 1.38 1.02
53 216 28 12.96 4.58 2.29 1.53 2.22 1.70 1.31
57 261.7 19.7 7.53 7.53 3.76 2.51 4.66 3.18 2.31
104 500* 160 32 22.89 11.45 7.63 2.21 2.18 2.13 105 568.416* 51.96 9.14 27.30 13.65 9.10 7.81 7.00 6.07
Cu (248.2 ± 48.97) [μg/L]
62 31.2 0.45 1.43 -8.86 -4.43 -2.95 8.86 4.43 2.95
69 42 15 35.71 -8.42 -4.21 -2.81 7.18 4.03 2.75
119 52.996 10.6 20 -7.97 -3.99 -2.66 7.32 3.90 2.63 35 90 40 44.44 -6.46 -3.23 -2.15 3.37 2.50 1.89
106 100.2 5.02 5.01 -6.04 -3.02 -2.01 5.92 3.01 2.01
113 144 34 23.61 -4.26 -2.13 -1.42 2.49 1.75 1.29
116 149.34 10.37 6.95 -4.04 -2.02 -1.35 3.72 1.98 1.33
54 168 26 15.48 -3.28 -1.64 -1.09 2.25 1.45 1.03

TABLE 3b (cont). SUMMARY OF THE REPORTED RESULTS AND THE
CALCULATED z- AND u-SCORES FOR SAMPLE “2”
31
Lab
ora
tory
co
de
An
aly
te c
on
cen
trati
on
Sta
nd
ard
dev
.
Rela
tiv
e s
td.
dev
., [
%]
z-scores u-scores
k = 0.5 k = 1.0 k = 1.5 k = 0.5 k = 1.0 k = 1.5
118 218 11 5.05 -1.23 -0.62 -0.41 1.13 0.60 0.41
72 222 26 11.71 -1.07 -0.54 -0.36 0.73 0.47 0.34 107 229.2 21.1 9.21 -0.78 -0.39 -0.26 0.59 0.36 0.25
103 234.293 62.58 26.71 -0.57 -0.28 -0.19 0.21 0.18 0.14
57 254.9 17.5 6.87 0.27 0.14 0.09 0.22 0.13 0.09
73 265.6 12.6 4.74 0.71 0.36 0.24 0.63 0.34 0.23
75 273.2 41.9 15.34 1.02 0.51 0.34 0.52 0.39 0.30 95 303 124 40.92 2.24 1.12 0.75 0.43 0.41 0.38
117 320 60 18.75 2.93 1.47 0.98 1.11 0.93 0.76
114 365 73 20 4.77 2.39 1.59 1.52 1.33 1.13
89 376.2 78 20.73 5.23 2.61 1.74 1.57 1.39 1.19
108 421.8 46.6 11.05 7.09 3.55 2.36 3.30 2.57 2.00 93 463.7 90.05 19.42 8.80 4.40 2.93 2.31 2.10 1.85
109 488.912 41.06 8.4 9.83 4.92 3.28 5.04 3.77 2.86
53 495 80 16.16 10.08 5.04 3.36 2.95 2.63 2.27
105 966.069* 128.66 13.32 29.32 14.66 9.77 5.48 5.21 4.85
104 1100* 300 27.27 34.79 17.39 11.6 2.83 2.80 2.76
Fe (122.47 ± 26.87) [μg/L]
119 16.093 3.22 20 -7.92 -3.96 -2.64 7.70 3.93 2.63
62 33.4 6.03 18.04 -6.63 -3.31 -2.21 6.05 3.23 2.19
116 34.686 2.91 8.39 -6.53 -3.27 -2.18 6.39 3.25 2.17
107 39.4 3.9 9.9 -6.18 -3.09 -2.06 5.94 3.06 2.05
72 58 19 32.76 -4.80 -2.40 -1.60 2.77 1.96 1.45 109 66.929 10.33 15.44 -4.13 -2.07 -1.38 3.28 1.93 1.33
108 69 27.1 39.28 -3.98 -1.99 -1.33 1.77 1.40 1.10
75 72.6 6.8 9.37 -3.71 -1.86 -1.24 3.31 1.80 1.22
106 88 33.04 37.54 -2.57 -1.28 -0.86 0.97 0.81 0.66
35 100 10 10 -1.67 -0.84 -0.56 1.34 0.78 0.54 69 100 200 200 -1.67 -0.84 -0.56 0.11 0.11 0.11
93 123.3 16.33 13.24 0.06 0.03 0.02 0.04 0.03 0.02
73 140.2 9.4 6.7 1.32 0.66 0.44 1.08 0.62 0.43
118 168 4 2.38 3.39 1.69 1.13 3.25 1.68 1.12
95 195 44 22.56 5.40 2.70 1.80 1.58 1.41 1.22
105 203.116 25.67 12.64 6.00 3.00 2.00 2.78 2.17 1.69 54 252 73 28.97 9.64 4.82 3.21 1.75 1.67 1.55
57 275.2 18 6.54 11.37 5.68 3.79 6.80 4.72 3.46
53 292 60 20.55 12.62 6.31 4.21 2.76 2.58 2.35
117 400* 100 25 20.66 10.33 6.89 2.75 2.68 2.57
89 416.2* 404.1 97.09 21.86 10.93 7.29 0.73 0.73 0.72 114 532* 160 30.08 30.48 15.24 10.16 2.55 2.52 2.48
104 1000* 300 30 65.31 32.66 21.77 2.92 2.91 2.90
103 2417.954* 466.6 19.3 170.84 85.42 56.95 4.92 4.91 4.90
K (704.1 ± 118.74) [μg/L]
119 94.844 18.97 20 -10.26 -5.13 -3.42 9.78 5.07 3.40

TABLE 3b (cont). SUMMARY OF THE REPORTED RESULTS AND THE
CALCULATED z- AND u-SCORES FOR SAMPLE “2”
32
Lab
ora
tory
co
de
An
aly
te c
on
cen
trati
on
Sta
nd
ard
dev
.
Rela
tiv
e s
td.
dev
., [
%]
z-scores u-scores
k = 0.5 k = 1.0 k = 1.5 k = 0.5 k = 1.0 k = 1.5
69 150 250 166.67 -9.33 -4.67 -3.11 2.16 2.00 1.81
72 229 47.2 20.61 -8.00 -4.00 -2.67 6.26 3.72 2.58 54 282 81 28.72 -7.11 -3.55 -2.37 4.20 2.94 2.16
116 311.72 21.98 7.05 -6.61 -3.30 -2.2 6.20 3.25 2.19
75 430.8 97.5 22.63 -4.60 -2.30 -1.53 2.39 1.78 1.35
73 687.8 62 9.01 -0.27 -0.14 -0.09 0.19 0.12 0.09
108 740.6 124.4 16.8 0.61 0.31 0.20 0.26 0.21 0.17 109 795.429 53.59 6.74 1.54 0.77 0.51 1.14 0.7 0.49
117 800 200 25 1.62 0.81 0.54 0.46 0.41 0.36
106 966.6 187.28 19.37 4.42 2.21 1.47 1.34 1.18 1.02
53 1154 323 27.99 7.58 3.79 2.53 1.37 1.31 1.22
93 1347.3 335.05 24.87 10.83 5.42 3.61 1.89 1.81 1.70 105 1867.345 825.02 44.18 19.59 9.80 6.53 1.41 1.40 1.38
Mg [μg/L]
75 6505 1391.1 21.39 - - - - - -
108 14727.4 2591.5 17.6 - - - - - -
72 17106 4900 28.64 - - - - - -
Mn (291.23 ± 56.09) [μg/L]
69 31 11 35.48 -9.28 -4.64 -3.09 8.64 4.55 3.07
119 55.003 11 20 -8.42 -4.21 -2.81 7.84 4.13 2.78
106 92.2 8.32 9.02 -7.10 -3.55 -2.37 6.80 3.51 2.35
35 120 10 8.33 -6.11 -3.05 -2.04 5.75 3.01 2.02
118 161 6 3.73 -4.64 -2.32 -1.55 4.54 2.31 1.54 116 161.62 14.17 8.77 -4.62 -2.31 -1.54 4.13 2.24 1.52
54 166 30 18.07 -4.47 -2.23 -1.49 3.05 1.97 1.40
113 176 73 41.48 -4.11 -2.05 -1.37 1.47 1.25 1.03
62 198.8 30.42 15.3 -3.30 -1.65 -1.10 2.23 1.45 1.03
72 222 37 16.67 -2.47 -1.23 -0.82 1.49 1.03 0.75 57 246.3 21.5 8.73 -1.60 -0.80 -0.53 1.27 0.75 0.52
73 266.4 16 6.01 -0.89 -0.44 -0.30 0.77 0.43 0.29
107 271.4 26.7 9.84 -0.71 -0.35 -0.24 0.51 0.32 0.22
75 278.8 42.3 15.17 -0.44 -0.22 -0.15 0.24 0.18 0.13
117 340 60 17.65 1.74 0.87 0.58 0.74 0.59 0.47
89 400 87.3 21.83 3.88 1.94 1.29 1.19 1.05 0.90 53 478 60 12.55 6.66 3.33 2.22 2.82 2.27 1.81
114 486 148 30.45 6.94 3.47 2.31 1.29 1.23 1.14
95 509 251 49.31 7.76 3.88 2.59 0.86 0.85 0.82
109 518.846 42.67 8.22 8.12 4.06 2.71 4.46 3.23 2.41
108 524.8 76.3 14.54 8.33 4.16 2.78 2.87 2.47 2.06 93 703.8 159.95 22.73 14.71 7.36 4.90 2.54 2.43 2.28
105 987.995* 160.88 16.28 24.84 12.42 8.28 4.27 4.09 3.84
104 1600* 400 25 46.67 23.33 15.56 3.26 3.24 3.20

TABLE 3b (cont). SUMMARY OF THE REPORTED RESULTS AND THE
CALCULATED z- AND u-SCORES FOR SAMPLE “2”
33
Lab
ora
tory
co
de
An
aly
te c
on
cen
trati
on
Sta
nd
ard
dev
.
Rela
tiv
e s
td.
dev
., [
%]
z-scores u-scores
k = 0.5 k = 1.0 k = 1.5 k = 0.5 k = 1.0 k = 1.5
Mo [μg/L]
105 1386.92 581.91 41.96 - - - - - - 73 7522 1543.4 20.52 - - - - - -
Na [μg/L]
75 5333.5 2310.1 43.31 - - - - - -
Ni (256.41 ± 50.34) [μg/L]
69 53 22 41.51 -8.08 -4.04 -2.69 6.08 3.70 2.59 119 53.411 10.68 20 -8.06 -4.03 -2.69 7.42 3.94 2.66
118 87 8 9.2 -6.73 -3.37 -2.24 6.41 3.32 2.23
35 100 10 10 -6.21 -3.11 -2.07 5.77 3.05 2.05
106 128.6 8.88 6.9 -5.08 -2.54 -1.69 4.79 2.50 1.68
103 144.311 58.11 40.27 -4.45 -2.23 -1.48 1.77 1.46 1.18 54 150 42 28 -4.23 -2.11 -1.41 2.17 1.62 1.23
113 156 19 12.18 -3.99 -1.99 -1.33 3.18 1.87 1.29
116 156.04 12.21 7.83 -3.99 -1.99 -1.33 3.59 1.94 1.31
62 177.6 31.6 17.8 -3.13 -1.57 -1.04 1.95 1.33 0.96
72 204 27 13.24 -2.08 -1.04 -0.69 1.42 0.92 0.65
73 229.2 11.4 4.97 -1.08 -0.54 -0.36 0.98 0.53 0.36 57 250.6 15.4 6.15 -0.23 -0.12 -0.08 0.20 0.11 0.08
107 264.2 30 11.36 0.31 0.15 0.10 0.20 0.13 0.10
75 266.4 39.4 14.79 0.40 0.20 0.13 0.21 0.16 0.12
95 332 70 21.08 3.00 1.50 1.00 1.02 0.88 0.73
117 340 50 14.71 3.32 1.66 1.11 1.49 1.18 0.92 89 409.6 98.7 24.1 6.09 3.04 2.03 1.50 1.38 1.23
53 494 68 13.77 9.44 4.72 3.15 3.28 2.81 2.34
114 501 145 28.94 9.72 4.86 3.24 1.66 1.59 1.50
108 535.8 80.4 15.01 11.10 5.55 3.70 3.32 2.95 2.53
93 608.2 142.65 23.45 13.98 6.99 4.66 2.43 2.33 2.18 105 987.525* 160.9 16.29 29.05 14.52 9.68 4.49 4.34 4.11
104 1600* 400 25 53.38 26.69 17.79 3.35 3.33 3.3
Os [μg/L]
105 8.189 1 12.26 - - - - - -
P [μg/L]
75 533.2 86.5 16.22 - - - - - -
Pb (260.38 ± 51.00) [μg/L]
69 46 12 26.09 -8.41 -4.20 -2.80 7.61 4.09 2.77
62 100.6 5.41 5.38 -6.27 -3.13 -2.09 6.13 3.12 2.08
106 114.2 9.47 8.29 -5.73 -2.87 -1.91 5.37 2.82 1.90
54 158 18 11.39 -4.01 -2.01 -1.34 3.28 1.89 1.30 116 165.82 6.98 4.21 -3.71 -1.85 -1.24 3.58 1.84 1.23

TABLE 3b (cont). SUMMARY OF THE REPORTED RESULTS AND THE
CALCULATED z- AND u-SCORES FOR SAMPLE “2”
34
Lab
ora
tory
co
de
An
aly
te c
on
cen
trati
on
Sta
nd
ard
dev
.
Rela
tiv
e s
td.
dev
., [
%]
z-scores u-scores
k = 0.5 k = 1.0 k = 1.5 k = 0.5 k = 1.0 k = 1.5
95 183 98 53.55 -3.03 -1.52 -1.01 0.76 0.70 0.62
113 200 55 27.5 -2.37 -1.18 -0.79 1.00 0.80 0.64 72 213 28 13.15 -1.86 -0.93 -0.62 1.25 0.81 0.58
107 220.4 28.7 13.02 -1.57 -0.78 -0.52 1.04 0.68 0.49
103 222.52 43.65 19.61 -1.48 -0.74 -0.49 0.75 0.56 0.43
57 247.3 11.8 4.77 -0.51 -0.26 -0.17 0.47 0.25 0.17
75 281.8 45.4 16.11 0.84 0.42 0.28 0.41 0.31 0.24 73 296 13.4 4.53 1.40 0.70 0.47 1.24 0.68 0.46
117 320 60 18.75 2.34 1.17 0.78 0.91 0.76 0.61
89 323.4 68.6 21.21 2.47 1.24 0.82 0.86 0.74 0.61
108 350.2 29.5 8.42 3.52 1.76 1.17 2.30 1.52 1.10
109 423.267 41.8 9.88 6.39 3.19 2.13 3.33 2.47 1.87 53 501 66 13.17 9.44 4.72 3.15 3.40 2.88 2.38
93 580.8 120.9 20.82 12.56 6.28 4.19 2.59 2.44 2.24
105 1027.694* 143.12 13.93 30.09 15.04 10.03 5.28 5.05 4.73
104 1300* 300 23.08 40.77 20.38 13.59 3.45 3.42 3.36
Ru [μg/L]
72 1304 142 10.89 - - - - - -
S [μg/L]
75 372.6 68.9 18.49 - - - - - -
69 390 160 41.03 - - - - - -
105 2796.748 526.3 18.82 - - - - - -
67 3230 780 24.15 - - - - - -
Si [μg/L]
73 5129034 164895.2 3.21 - - - - - -
Sn [μg/L]
105 326.734 107.91 33.03 - - - - - -
Sr (278.78 ± 54.05) [μg/L]
69 83 6 7.23 -7.24 -3.62 -2.41 7.07 3.60 2.41
35 100 30 30 -6.62 -3.31 -2.21 4.43 2.89 2.07
116 138 8.19 5.94 -5.21 -2.60 -1.74 4.99 2.58 1.73
106 157.2 14.24 9.06 -4.50 -2.25 -1.50 3.98 2.18 1.48
62 168.6 25.17 14.93 -4.08 -2.04 -1.36 2.98 1.85 1.30
72 182 26 14.29 -3.58 -1.79 -1.19 2.58 1.61 1.14 54 201 64 31.84 -2.88 -1.44 -0.96 1.12 0.93 0.75
113 206 71 34.47 -2.69 -1.35 -0.90 0.96 0.82 0.68
73 207.4 10.6 5.11 -2.64 -1.32 -0.88 2.46 1.30 0.87
103 232.227 69.36 29.87 -1.72 -0.86 -0.57 0.63 0.53 0.44
57 245.6 10.9 4.44 -1.23 -0.61 -0.41 1.14 0.60 0.41 75 255.4 41.6 16.29 -0.87 -0.43 -0.29 0.47 0.34 0.26
107 272.6 37.3 13.68 -0.23 -0.11 -0.08 0.13 0.09 0.07

TABLE 3b (cont). SUMMARY OF THE REPORTED RESULTS AND THE
CALCULATED z- AND u-SCORES FOR SAMPLE “2”
35
Lab
ora
tory
co
de
An
aly
te c
on
cen
trati
on
Sta
nd
ard
dev
.
Rela
tiv
e s
td.
dev
., [
%]
z-scores u-scores
k = 0.5 k = 1.0 k = 1.5 k = 0.5 k = 1.0 k = 1.5
117 370 50 13.51 3.38 1.69 1.13 1.60 1.24 0.96
95 395 142 35.95 4.30 2.15 1.43 0.80 0.76 0.71 109 440.729 33.92 7.7 5.99 3.00 2.00 3.73 2.54 1.84
53 516 55 10.66 8.78 4.39 2.93 3.87 3.08 2.42
108 548.6 72.3 13.18 9.98 4.99 3.33 3.50 2.99 2.48
93 577.5 132.19 22.89 11.05 5.53 3.68 2.21 2.09 1.93
105 1049.612* 151.95 14.48 28.52 14.26 9.51 4.99 4.78 4.48 104 1900* 400 21.05 59.99 30.00 20.00 4.04 4.02 3.97
Ti [μg/L]
119 19.604 3.92 20 - - - - - -
75 21.4 8.9 41.59 - - - - - -
105 43.909* 26.39 60.09 - - - - - - 93 133.8* 29.03 21.7 - - - - - -
104 1090* 330 30.28 - - - - - -
Tl (258.3 ± 50.66) [μg/L]
69 27 2 7.41 -9.13 -4.57 -3.04 9.10 4.56 3.04
106 97.2 10.23 10.53 -6.36 -3.18 -2.12 5.90 3.12 2.10
62 135.2 31.22 23.09 -4.86 -2.43 -1.62 3.06 2.07 1.50 113 166 34 20.48 -3.64 -1.82 -1.21 2.18 1.51 1.11
116 178.58 6.9 3.87 -3.15 -1.57 -1.05 3.04 1.56 1.04
54 188 28 14.89 -2.78 -1.39 -0.93 1.86 1.21 0.87
72 192 25 13.02 -2.62 -1.31 -0.87 1.86 1.17 0.83
107 198.6 41.3 20.8 -2.36 -1.18 -0.79 1.23 0.91 0.69 73 228.4 10.8 4.73 -1.18 -0.59 -0.39 1.09 0.58 0.39
57 248.9 5.6 2.25 -0.37 -0.19 -0.12 0.36 0.18 0.12
103 261.113 56.23 21.54 0.11 0.06 0.04 0.05 0.04 0.03
75 266.4 40.5 15.2 0.32 0.16 0.11 0.17 0.12 0.09
95 291 126 43.3 1.29 0.65 0.43 0.25 0.24 0.22 117 390 60 15.38 5.20 2.60 1.73 2.02 1.68 1.36
109 452.667 36.54 8.07 7.67 3.84 2.56 4.37 3.11 2.31
108 495 76.5 15.45 9.35 4.67 3.12 2.94 2.58 2.20
53 575 60 10.43 12.50 6.25 4.17 4.86 4.03 3.27
93 768.3* 149.2 19.42 20.14 10.07 6.71 3.37 3.24 3.05
105 1016.03* 165.55 16.29 29.92 14.96 9.97 4.52 4.38 4.16 104 2010* 450 22.39 69.16 34.58 23.05 3.89 3.87 3.84
Zn (292.78 ± 56.35) [μg/L]
69 42 5 11.9 -8.90 -4.45 -2.97 8.76 4.43 2.96
119 59.842 11.97 20 -8.27 -4.13 -2.76 7.61 4.04 2.73
35 120 10 8.33 -6.13 -3.07 -2.04 5.78 3.02 2.03 62 126.8 6.87 5.42 -5.89 -2.95 -1.96 5.72 2.92 1.96
106 157 8.52 5.42 -4.82 -2.41 -1.61 4.61 2.38 1.60
54 170 24 14.12 -4.36 -2.18 -1.45 3.32 2.00 1.40
116 170.42 11.36 6.66 -4.34 -2.17 -1.45 4.03 2.13 1.43

TABLE 3b (cont). SUMMARY OF THE REPORTED RESULTS AND THE
CALCULATED z- AND u-SCORES FOR SAMPLE “2”
36
Lab
ora
tory
co
de
An
aly
te c
on
cen
trati
on
Sta
nd
ard
dev
.
Rela
tiv
e s
td.
dev
., [
%]
z-scores u-scores
k = 0.5 k = 1.0 k = 1.5 k = 0.5 k = 1.0 k = 1.5
113 185 59 31.89 -3.83 -1.91 -1.28 1.65 1.32 1.05
72 223 28 12.56 -2.48 -1.24 -0.83 1.76 1.11 0.78 118 231 15 6.49 -2.19 -1.10 -0.73 1.94 1.06 0.72
107 245.4 23.1 9.41 -1.68 -0.84 -0.56 1.30 0.78 0.54
57 252.2 13.4 5.31 -1.44 -0.72 -0.48 1.30 0.70 0.47
75 299 46.7 15.62 0.22 0.11 0.07 0.11 0.08 0.06
73 318.2 14.4 4.53 0.90 0.45 0.30 0.8 0.44 0.30 117 320 60 18.75 0.97 0.48 0.32 0.41 0.33 0.26
95 353 147 41.64 2.14 1.07 0.71 0.40 0.38 0.36
103 378.661 82.18 21.7 3.05 1.52 1.02 0.99 0.86 0.73
89 389.2 80.9 20.79 3.42 1.71 1.14 1.13 0.98 0.82
108 501.8 49.3 9.82 7.42 3.71 2.47 3.68 2.79 2.14 53 508 30 5.91 7.64 3.82 2.55 5.23 3.37 2.40
109 511.714 35.87 7.01 7.77 3.89 2.59 4.80 3.28 2.38
93 570.7 100.5 17.61 9.86 4.93 3.29 2.66 2.41 2.12
114 601 117 19.47 10.94 5.47 3.65 2.56 2.37 2.14
105 1007.172* 142.7 14.17 25.36 12.68 8.45 4.91 4.66 4.31
104 1140* 300 26.32 30.07 15.04 10.02 2.81 2.78 2.72

37
TABLE 3c. SUMMARY OF THE REPORTED RESULTS AND THE CALCULATED z- AND u-SCORES FOR SAMPLE “3”
Lab
ora
tory
co
de
An
aly
te c
on
cen
trati
on
Sta
nd
ard
dev
.
Rela
tiv
e s
td.
dev
., [
%]
z-scores u-scores
k = 0.5 k = 1.0 k = 1.5 k = 0.5 k = 1.0 k = 1.5
Ag [μg/L]
105 433.099 38.4 8.87 - - - - - -
Al [μg/L]
75 414.25 158.9 38.36 - - - - - -
105 848.327 133.69 15.76 - - - - - - 108 2310.2 885.8 38.34 - - - - - -
As [μg/L]
105 1.382 0.22 15.92 - - - - - -
75 1.4 0.5 35.71 - - - - - -
117 3* 0.6 20 - - - - - -
Ba (28.94 ± 6.37) [μg/L]
116 7.48 1.69 22.59 -6.74 -3.37 -2.25 5.95 3.26 2.21
75 7.5 2.5 33.33 -6.73 -3.37 -2.24 5.30 3.13 2.17
109 37.734 5.7 15.1 2.76 1.38 0.92 1.35 1.03 0.79
117 40 6 15 3.47 1.74 1.16 1.63 1.26 0.98 62 52 14.14 27.2 7.24 3.62 2.41 1.59 1.49 1.35
Bi [μg/L]
62 104 40 38.46 - - - - - -
Br (50.26 ± 11.06) [μg/L]
103 25.3 1.99 7.87 -4.51 -2.26 -1.50 4.25 2.22 1.49
114 35.4 10.1 28.53 -2.69 -1.34 -0.90 1.29 0.99 0.77 107 40.6 4.5 11.08 -1.75 -0.87 -0.58 1.36 0.81 0.56
72 41 6 14.63 -1.67 -0.84 -0.56 1.13 0.74 0.53
106 43.333 1.75 4.04 -1.25 -0.63 -0.42 1.19 0.62 0.42
105 44.404 1.54 3.47 -1.06 -0.53 -0.35 1.02 0.52 0.35
117 48 4 8.33 -0.41 -0.20 -0.14 0.33 0.19 0.13 104 50 1.5 3 -0.05 -0.02 -0.02 0.05 0.02 0.02
108 50.8 11.6 22.83 0.10 0.05 0.03 0.04 0.03 0.03
109 55.807 0.3 0.53 1.00 0.50 0.33 1.00 0.50 0.33
69 62 10 16.13 2.12 1.06 0.71 1.03 0.79 0.61
116 63.798 4.19 6.56 2.45 1.22 0.82 1.95 1.15 0.79 110 64.25 27.17 42.29 2.53 1.27 0.84 0.50 0.48 0.44
95 79 18 22.78 5.20 2.60 1.73 1.53 1.36 1.17
54 115* 14 12.17 11.71 5.86 3.90 4.30 3.63 2.98
113 181* 47 25.97 23.65 11.82 7.88 2.76 2.71 2.62
67 319* 18 5.64 48.61 24.30 16.20 14.27 12.72 10.98

TABLE 3c (cont). SUMMARY OF THE REPORTED RESULTS AND THE
CALCULATED z- AND u-SCORES FOR SAMPLE “3”
38
Lab
ora
tory
co
de
An
aly
te c
on
cen
trati
on
Sta
nd
ard
dev
.
Rela
tiv
e s
td.
dev
., [
%]
z-scores u-scores
k = 0.5 k = 1.0 k = 1.5 k = 0.5 k = 1.0 k = 1.5
Ca (19917.93 ± 2031.13) [μg/L]
73 50.4* 1.2 2.38 -19.56 -9.78 -6.52 19.56 9.78 6.52 67 610* 1000 163.93 -19.01 -9.51 -6.34 13.55 8.53 6.02
118 9848 93 0.94 -9.92 -4.96 -3.31 9.87 4.95 3.30
62 11341.4 1248.08 11 -8.45 -4.22 -2.82 5.33 3.60 2.60
57 15709 965 6.14 -4.14 -2.07 -1.38 3.00 1.87 1.32
75 16800.6 168.2 1 -3.07 -1.53 -1.02 3.03 1.53 1.02 114 16900 2250 13.31 -2.97 -1.49 -0.99 1.22 1.00 0.80
112 16998.66 2319.54 13.65 -2.87 -1.44 -0.96 1.15 0.95 0.76
54 17776 2415 13.59 -2.11 -1.05 -0.7 0.82 0.68 0.55
115 18169.21 1154.55 6.35 -1.72 -0.86 -0.57 1.14 0.75 0.54
107 18514.2 664.2 3.59 -1.38 -0.69 -0.46 1.16 0.66 0.45 72 19147 895 4.67 -0.76 -0.38 -0.25 0.57 0.35 0.24
106 19845.33 883.25 4.45 -0.07 -0.04 -0.02 0.05 0.03 0.02
69 20000 2100 10.5 0.08 0.04 0.03 0.04 0.03 0.02
117 20000 2000 10 0.08 0.04 0.03 0.04 0.03 0.02
105 20711.92 359.42 1.74 0.78 0.39 0.26 0.74 0.38 0.26
110 21039 934.33 4.44 1.10 0.55 0.37 0.81 0.50 0.35 95 22408 1876 8.37 2.45 1.23 0.82 1.17 0.90 0.70
108 22814 2000.9 8.77 2.85 1.43 0.95 1.29 1.02 0.79
53 24663 2620 10.62 4.67 2.34 1.56 1.69 1.43 1.18
93 26119.9 2903.7 11.12 6.11 3.05 2.04 2.02 1.75 1.47
104 29200 170 0.58 9.14 4.57 3.05 9.01 4.55 3.04 116 30271.2 1914.77 6.33 10.19 5.10 3.40 4.78 3.71 2.88
111 137101* 11812 8.62 115.39 57.69 38.46 9.88 9.78 9.61
Cd [μg/L]
117 180 50 27.78 - - - - - -
Cl (7487.63 ± 884.68) [μg/L]
118 1694 102 6.02 -13.10 -6.55 -4.37 12.76 6.51 4.35
53 2104 360 17.11 -12.17 -6.09 -4.06 9.44 5.64 3.92
114 5280 454 8.6 -4.99 -2.50 -1.66 3.48 2.22 1.57
108 6062 1161.9 19.17 -3.22 -1.61 -1.07 1.15 0.98 0.81
69 7100 3200 45.07 -0.88 -0.44 -0.29 0.12 0.12 0.11
105 7820.3 354.43 4.53 0.75 0.38 0.25 0.59 0.35 0.24 75 8449.6 150.9 1.79 2.17 1.09 0.72 2.06 1.07 0.72
72 9223 806 8.74 3.92 1.96 1.31 1.89 1.45 1.12
104 9500 150 1.58 4.55 2.27 1.52 4.31 2.24 1.51
116 10011 389.35 3.89 5.70 2.85 1.90 4.28 2.61 1.82
106 10778.5 576.28 5.35 7.44 3.72 2.48 4.53 3.12 2.27 109 11829.14 480.21 4.06 9.81 4.91 3.27 6.65 4.31 3.08
113 26468* 5371 20.29 42.91 21.45 14.30 3.52 3.49 3.43
111 548524* 25385 4.63 1223.13 611.56 407.71 21.31 21.30 21.28

TABLE 3c (cont). SUMMARY OF THE REPORTED RESULTS AND THE
CALCULATED z- AND u-SCORES FOR SAMPLE “3”
39
Lab
ora
tory
co
de
An
aly
te c
on
cen
trati
on
Sta
nd
ard
dev
.
Rela
tiv
e s
td.
dev
., [
%]
z-scores u-scores
k = 0.5 k = 1.0 k = 1.5 k = 0.5 k = 1.0 k = 1.5
Co [μg/L]
35 100 10 10 - - - - - - 62 152.5 208.6 136.78 - - - - - -
Cr (2.35 ± 0.52) [μg/L]
75 1.6 0.6 37.5 -2.90 -1.45 -0.97 1.15 0.95 0.76
105 2.232 0.3 13.35 -0.46 -0.23 -0.15 0.30 0.20 0.14
116 2.56 0.23 8.98 0.81 0.41 0.27 0.61 0.37 0.26 108 3 0 0 2.51 1.26 0.84 2.51 1.26 0.84
109 5.057* 1.17 23.1 10.47 5.24 3.49 2.26 2.12 1.93
62 14.6* 5.03 34.45 47.39 23.69 15.80 2.43 2.42 2.41
69 29* 100 344.83 103.09 51.55 34.36 0.27 0.27 0.27
Cu (1.94 ± 0.43) [μg/L]
73 0.6 0.09 15 -6.28 -3.14 -2.09 5.79 3.07 2.07
75 1.2 0.5 41.67 -3.47 -1.73 -1.16 1.36 1.13 0.91
105 1.388 0.27 19.24 -2.59 -1.29 -0.86 1.61 1.10 0.80
108 1.4 1.34 95.71 -2.53 -1.27 -0.84 0.40 0.38 0.36
72 2.4 0.5 20.83 2.16 1.08 0.72 0.85 0.7 0.57
116 2.876 0.19 6.68 4.39 2.19 1.46 3.26 2.00 1.40 69 3.7 4.3 116.22 8.25 4.12 2.75 0.41 0.41 0.40
109 6.766* 0.86 12.71 22.61 11.31 7.54 5.45 5.03 4.50
103 16.2* 7.6 46.91 66.82 33.41 22.27 1.88 1.87 1.87
54 21.8* 4.3 19.72 93.06 46.53 31.02 4.61 4.6 4.57
114 44.3* 5.97 13.48 198.50 99.25 66.17 7.09 7.08 7.06 110 58.25* 14.22 24.41 263.87 131.94 87.96 3.96 3.96 3.96
35 110* 30 27.27 506.37 253.19 168.79 3.60 3.60 3.60
62 294.6* 253.85 86.17 1371.42 685.71 457.14 1.15 1.15 1.15
Fe (81.18 ± 17.86) [μg/L]
105 1.707 0.49 28.82 -8.90 -4.45 -2.97 8.89 4.45 2.97 73 4.2 0.15 3.57 -8.62 -4.31 -2.87 8.62 4.31 2.87
108 5.6 2.7 48.21 -8.46 -4.23 -2.82 8.10 4.18 2.81
75 10.6 4.4 41.51 -7.90 -3.95 -2.63 7.09 3.84 2.60
72 14 11 78.57 -7.52 -3.76 -2.51 4.74 3.20 2.32
69 56 71 126.79 -2.82 -1.41 -0.94 0.35 0.34 0.33
110 70.25 25.94 36.93 -1.22 -0.61 -0.41 0.40 0.35 0.29 117 71 35 49.3 -1.14 -0.57 -0.38 0.28 0.26 0.23
57 108.5 11.6 10.69 3.06 1.53 1.02 1.87 1.28 0.94
114 119 63.8 53.61 4.24 2.12 1.41 0.59 0.57 0.55
35 130 20 15.38 5.47 2.73 1.82 2.23 1.82 1.46
104 130 4 3.08 5.47 2.73 1.82 4.99 2.67 1.80 53 137 30 21.9 6.25 3.13 2.08 1.78 1.60 1.39
62 166.8 93.1 55.82 9.59 4.79 3.20 0.92 0.90 0.88
54 193 81.2 42.07 12.52 6.26 4.17 1.37 1.34 1.31

TABLE 3c (cont). SUMMARY OF THE REPORTED RESULTS AND THE
CALCULATED z- AND u-SCORES FOR SAMPLE “3”
40
Lab
ora
tory
co
de
An
aly
te c
on
cen
trati
on
Sta
nd
ard
dev
.
Rela
tiv
e s
td.
dev
., [
%]
z-scores u-scores
k = 0.5 k = 1.0 k = 1.5 k = 0.5 k = 1.0 k = 1.5
103 707.8* 48.5 6.85 70.17 35.09 23.39 12.71 12.12 11.31
67 7300* 160 2.19 808.40 404.2 269.47 45.05 44.84 44.50
In [μg/L]
75 23.6 4.7 19.92 - - - - - -
117 270 80 29.63 - - - - - -
K (8717.85 ± 1006.72) [μg/L]
73 9.4* 1 10.64 -17.30 -8.65 -5.77 17.30 8.65 5.77 62 3717.2 405.42 10.91 -9.93 -4.97 -3.31 7.74 4.61 3.20
118 4517 88 1.95 -8.35 -4.17 -2.78 8.22 4.16 2.78
114 4600 344 7.48 -8.18 -4.09 -2.73 6.75 3.87 2.66
57 6537 202 3.09 -4.33 -2.17 -1.44 4.02 2.12 1.43
69 7000 2200 31.43 -3.41 -1.71 -1.14 0.76 0.71 0.64 75 7481.8 118.1 1.58 -2.46 -1.23 -0.82 2.39 1.22 0.82
95 7662 1508 19.68 -2.10 -1.05 -0.70 0.66 0.58 0.49
72 7973 757 9.49 -1.48 -0.74 -0.49 0.82 0.59 0.44
108 8051.8 1465.9 18.21 -1.32 -0.66 -0.44 0.43 0.37 0.32
54 8132 1444 17.76 -1.16 -0.58 -0.39 0.38 0.33 0.28
107 8159.4 704.9 8.64 -1.11 -0.55 -0.37 0.64 0.45 0.34 115 8638.951 2524.29 29.22 -0.16 -0.08 -0.05 0.03 0.03 0.03
105 9059.263 446.43 4.93 0.68 0.34 0.23 0.51 0.31 0.22
112 9175.668 1818.02 19.81 0.91 0.45 0.30 0.24 0.22 0.19
110 9402.5 668.15 7.11 1.36 0.68 0.45 0.82 0.57 0.41
117 11000 2000 18.18 4.53 2.27 1.51 1.11 1.02 0.91 116 11079.4 375.31 3.39 4.69 2.35 1.56 3.76 2.20 1.52
104 11100 110 0.99 4.73 2.37 1.58 4.62 2.35 1.57
53 11573 3960 34.22 5.67 2.84 1.89 0.72 0.70 0.67
109 11820.74 379.76 3.21 6.16 3.08 2.05 4.92 2.88 1.99
93 12460 2212.05 17.75 7.43 3.72 2.48 1.65 1.54 1.40 106 12652 797.03 6.3 7.82 3.91 2.61 4.17 3.06 2.30
113 31609* 3354 10.61 45.48 22.74 15.16 6.75 6.54 6.22
111 57711* 2198 3.81 97.33 48.67 32.44 21.73 20.27 18.37
Mg (9276.64 ± 1061.28) [μg/L]
108 4845.4 1047 21.61 -8.35 -4.18 -2.78 3.78 2.97 2.33
75 6725.2 219.5 3.26 -4.81 -2.40 -1.60 4.44 2.35 1.59 105 10235.95 711.06 6.95 1.81 0.90 0.60 1.08 0.75 0.55
116 15300 1183.22 7.73 11.35 5.68 3.78 4.64 3.79 3.04
72 27628* 2116 7.66 34.58 17.29 11.53 8.41 7.75 6.93
Mn [μg/L]
75 1 0.1 10 - - - - - - 62 7 3 42.86 - - - - - -
69 11 72 654.55 - - - - - -
35 130* 10 7.69 - - - - - -

TABLE 3c (cont). SUMMARY OF THE REPORTED RESULTS AND THE
CALCULATED z- AND u-SCORES FOR SAMPLE “3”
41
Lab
ora
tory
co
de
An
aly
te c
on
cen
trati
on
Sta
nd
ard
dev
.
Rela
tiv
e s
td.
dev
., [
%]
z-scores u-scores
k = 0.5 k = 1.0 k = 1.5 k = 0.5 k = 1.0 k = 1.5
Mo [μg/L]
73 371 46.2 12.45 - - - - - -
Na [μg/L]
75 4640.4 1847.2 39.81 - - - - - -
Ni [μg/L]
75 1 0.8 80 - - - - - -
72 1 1 100 - - - - - - 73 1.2 0.09 7.5 - - - - - -
69 17* 4 23.53 - - - - - -
109 43.038* 10.32 23.99 - - - - - -
35 120* 20 16.67 - - - - - -
Os [μg/L]
105 0.844 0.24 28.2 - - - - - -
P [μg/L]
108 119.4 78.9 66.08 - - - - - -
75 290 47.3 16.31 - - - - - -
72 367 109 29.7 - - - - - -
Pb (4.51 ± 0.99) [μg/L]
108 0.6 0.55 91.67 -7.88 -3.94 -2.63 5.28 3.45 2.46
75 1 0.1 10 -7.08 -3.54 -2.36 6.94 3.52 2.35
72 1.1 0.8 72.73 -6.87 -3.44 -2.29 3.62 2.68 2.02
116 1.66 0.28 16.93 -5.74 -2.87 -1.91 5.00 2.76 1.88
117 3 1 33.33 -3.04 -1.52 -1.01 1.35 1.07 0.84 109 5.09 0.88 17.21 1.17 0.58 0.39 0.58 0.44 0.34
62 9 7.21 80.12 9.05 4.53 3.02 0.62 0.62 0.61
69 9.5 18 189.47 10.06 5.03 3.35 0.28 0.28 0.28
73 9.6 0.4 4.17 10.26 5.13 3.42 7.99 4.76 3.30
110 76.667* 34.27 44.7 145.45 72.72 48.48 2.11 2.10 2.10
Rb (25.51 ± 5.61) [μg/L]
107 15.4 2.3 14.94 -3.60 -1.80 -1.20 2.79 1.67 1.16
54 17.6 4.3 24.43 -2.82 -1.41 -0.94 1.54 1.12 0.84
72 20 2 10 -1.96 -0.98 -0.65 1.60 0.92 0.64
75 20.4 0.5 2.45 -1.82 -0.91 -0.61 1.79 0.91 0.61
108 21.6 4.4 20.37 -1.39 -0.70 -0.46 0.75 0.55 0.41 114 23 6.9 30 -0.89 -0.45 -0.30 0.34 0.28 0.23
106 23.5 0.55 2.33 -0.72 -0.36 -0.24 0.70 0.36 0.24
105 24.608 1.13 4.6 -0.32 -0.16 -0.11 0.30 0.16 0.11
109 27.995 0.92 3.3 0.89 0.44 0.30 0.84 0.44 0.29
103 29.9 2.7 9.03 1.56 0.78 0.52 1.13 0.70 0.50

TABLE 3c (cont). SUMMARY OF THE REPORTED RESULTS AND THE
CALCULATED z- AND u-SCORES FOR SAMPLE “3”
42
Lab
ora
tory
co
de
An
aly
te c
on
cen
trati
on
Sta
nd
ard
dev
.
Rela
tiv
e s
td.
dev
., [
%]
z-scores u-scores
k = 0.5 k = 1.0 k = 1.5 k = 0.5 k = 1.0 k = 1.5
104 30 1 3.33 1.60 0.80 0.53 1.51 0.79 0.53
117 30 3 10 1.60 0.80 0.53 1.09 0.71 0.50 116 30.592 1.47 4.8 1.81 0.91 0.60 1.60 0.88 0.59
53 32 6 18.75 2.31 1.16 0.77 0.98 0.79 0.63
93 36 7.35 20.42 3.74 1.87 1.25 1.33 1.13 0.94
113 163* 33 20.25 49.00 24.5 16.33 4.15 4.11 4.04
Re [μg/L]
105 1.622 0.18 11.04 - - - - - -
Rh [μg/L]
75 272.8 32.57 11.94 - - - - - -
105 834.226 47.76 5.72 - - - - - -
Ru [μg/L]
75 252.6 44.78 17.73 - - - - - -
105 787.406 53.2 6.76 - - - - - -
S (644.91 ± 110.20) [μg/L]
118 275 31 11.27 -6.71 -3.36 -2.24 5.85 3.23 2.20
72 307 124 40.39 -6.13 -3.07 -2.04 2.49 2.04 1.64
108 425 58.6 13.79 -3.99 -2.00 -1.33 2.73 1.76 1.25 116 553.6 83.23 15.03 -1.66 -0.83 -0.55 0.91 0.66 0.49
69 600 600 100 -0.82 -0.41 -0.27 0.07 0.07 0.07
105 662.574 54.79 8.27 0.32 0.16 0.11 0.23 0.14 0.10
75 798 63.3 7.93 2.78 1.39 0.93 1.82 1.20 0.86
112 1083.103 170.23 15.72 7.95 3.98 2.65 2.45 2.16 1.85 109 1099.927 97.21 8.84 8.26 4.13 2.75 4.07 3.10 2.37
67 15500* 1000 6.45 269.59 134.8 89.86 14.83 14.77 14.66
Si [μg/L]
73 163128.6 274.2 0.17 - - - - - -
Sn [μg/L]
105 249.636 73.8 29.56 - - - - - -
Sr (132.84 ± 28.79) [μg/L]
112 91.372 16.56 18.12 -2.88 -1.44 -0.96 1.89 1.25 0.90
114 97 9.25 9.54 -2.49 -1.24 -0.83 2.09 1.19 0.81
72 98 5 5.1 -2.42 -1.21 -0.81 2.29 1.19 0.80
75 99.8 1.1 1.1 -2.29 -1.15 -0.76 2.29 1.15 0.76 107 106.8 12.5 11.7 -1.81 -0.90 -0.60 1.37 0.83 0.58
54 110 17.4 15.82 -1.59 -0.79 -0.53 1.01 0.68 0.49
103 115.3 4.2 3.64 -1.22 -0.61 -0.41 1.17 0.60 0.40
108 117 11.1 9.49 -1.10 -0.55 -0.37 0.87 0.51 0.36
35 120 10 8.33 -0.89 -0.45 -0.30 0.73 0.42 0.29

TABLE 3c (cont). SUMMARY OF THE REPORTED RESULTS AND THE
CALCULATED z- AND u-SCORES FOR SAMPLE “3”
43
Lab
ora
tory
co
de
An
aly
te c
on
cen
trati
on
Sta
nd
ard
dev
.
Rela
tiv
e s
td.
dev
., [
%]
z-scores u-scores
k = 0.5 k = 1.0 k = 1.5 k = 0.5 k = 1.0 k = 1.5
62 120 15.22 12.68 -0.89 -0.45 -0.30 0.61 0.39 0.28
105 122.359 2.19 1.79 -0.73 -0.36 -0.24 0.72 0.36 0.24 117 130 10 7.69 -0.20 -0.10 -0.07 0.16 0.09 0.06
57 142.8 15.4 10.78 0.69 0.35 0.23 0.47 0.31 0.22
116 142.828 8.89 6.22 0.69 0.35 0.23 0.59 0.33 0.23
95 146 14 9.59 0.91 0.46 0.30 0.66 0.41 0.29
53 148 23 15.54 1.05 0.53 0.35 0.56 0.41 0.31 109 159.44 10.58 6.63 1.85 0.92 0.62 1.49 0.87 0.60
93 161 19.59 12.17 1.96 0.98 0.65 1.16 0.81 0.59
104 165.6 3 1.81 2.28 1.14 0.76 2.23 1.13 0.76
106 186.333 8.19 4.39 3.72 1.86 1.24 3.23 1.79 1.22
69 210 20 9.52 5.36 2.68 1.79 3.13 2.20 1.62 110 246.5* 14.36 5.83 7.89 3.95 2.63 5.59 3.53 2.50
113 683* 136 19.91 38.21 19.11 12.74 4.02 3.96 3.86
Ti (13.33 ± 2.93) [μg/L]
75 3 1.6 53.33 -7.04 -3.52 -2.35 4.76 3.09 2.21
105 3.653 1.03 28.2 -6.60 -3.30 -2.20 5.40 3.11 2.14
72 11 10 90.91 -1.59 -0.79 -0.53 0.23 0.22 0.21 117 19 5 26.32 3.87 1.93 1.29 1.09 0.98 0.85
104 30 5 16.67 11.37 5.68 3.79 3.20 2.88 2.50
111 1982* 192 9.69 1342.61 671.31 447.54 10.25 10.25 10.25
67 1990* 110 5.53 1348.07 674.03 449.36 17.97 17.96 17.96
V (10.42 ± 2.29) [μg/L]
75 9.4 0.9 9.57 -0.89 -0.44 -0.30 0.70 0.41 0.29
105 9.518 1.64 17.19 -0.79 -0.39 -0.26 0.45 0.32 0.24
108 9.6 2.51 26.15 -0.72 -0.36 -0.24 0.30 0.24 0.19
109 10.518 2.14 20.38 0.09 0.04 0.03 0.04 0.03 0.02
117 11 2 18.18 0.51 0.25 0.17 0.25 0.19 0.15 116 12.46 1.17 9.42 1.78 0.89 0.59 1.24 0.79 0.56
72 15* 2 13.33 4.00 2.00 1.33 1.99 1.51 1.15
111 907* 81 8.93 782.22 391.11 260.74 11.07 11.06 11.06
W [μg/L]
105 1.116 0.46 40.95 - - - - - -
Zn (7.64 ± 1.68) [μg/L]
69 2.4 3.3 137.5 -6.24 -3.12 -2.08 1.54 1.41 1.26
105 2.738 0.63 23.16 -5.83 -2.92 -1.94 4.66 2.73 1.89
116 4.842 0.52 10.76 -3.33 -1.66 -1.11 2.83 1.59 1.09
72 7 3 42.86 -0.76 -0.38 -0.25 0.21 0.19 0.16
109 8.395 2.37 28.18 0.90 0.45 0.30 0.30 0.26 0.22 75 8.8 2.5 28.41 1.38 0.69 0.46 0.44 0.39 0.33
117 9 2 22.22 1.62 0.81 0.54 0.63 0.52 0.42
108 10 3.1 31 2.81 1.40 0.94 0.73 0.67 0.59

TABLE 3c (cont). SUMMARY OF THE REPORTED RESULTS AND THE
CALCULATED z- AND u-SCORES FOR SAMPLE “3”
44
Lab
ora
tory
co
de
An
aly
te c
on
cen
trati
on
Sta
nd
ard
dev
.
Rela
tiv
e s
td.
dev
., [
%]
z-scores u-scores
k = 0.5 k = 1.0 k = 1.5 k = 0.5 k = 1.0 k = 1.5
103 15.6 7.6 48.72 9.47 4.74 3.16 1.04 1.02 0.99
53 30* 6 20 26.61 13.3 8.87 3.69 3.59 3.44 73 39.2* 0.2 0.51 37.55 18.78 12.52 36.53 18.65 12.48
62 44.6* 27.01 60.57 43.98 21.99 14.66 1.37 1.37 1.36
114 49.5* 11 22.22 49.81 24.90 16.60 3.79 3.76 3.71
54 110* 31.5 28.64 121.80 60.90 40.60 3.25 3.24 3.24
35 120* 10 8.33 133.70 66.85 44.57 11.20 11.08 10.90

45
TABLE 4a. THE COMBINED z-SCORES FOR THE PARTICIPATING LABORATORIES FOR SAMPLE “1”
Lab
Co
de
Nu
mb
er
of
an
aly
tes
Rescaled sum of scores (RSZ) Sum of squared scores
(SSZ)
Cri
tical
valu
e
k = 0.5 k = 1.0 k = 1.5 k = 0.5 k = 1.0 k = 1.5 2
35 12 25.65 12.83 8.55 1389 347 154 23.34
53 14 11.83 5.91 3.94 218 54.56 24.25 26.12
54 14 13.13 6.57 4.38 616 154 68.42 26.12
57 13 0.76 0.38 0.25 1.87 0.47 0.21 24.74 62 13 388 194 129.36 179571 44893 19952 24.74
67 8 -17.47 -8.74 -5.82 2204 551 245 17.53
69 13 -2.59 -1.29 -0.86 235 58.79 26.13 24.74
72 16 -6.48 -3.24 -2.16 178 44.44 19.75 28.85
73 14 19.67 9.84 6.56 965 241 107.25 26.12 75 18 2.1 1.05 0.7 412 102.93 45.75 31.53
78 15 -13.31 -6.66 -4.44 552 138.01 61.34 27.49
89 12 4.46 2.23 1.49 50.21 12.55 5.58 23.34
93 12 0.89 0.45 0.3 16.06 4.01 1.78 23.34
95 15 9.86 4.93 3.29 403 100.77 44.79 27.49 103 11 -1.11 -0.56 -0.37 27.83 6.96 3.09 21.92
104 14 5.65 2.82 1.88 54.77 13.69 6.09 26.12
105 18 14.94 7.47 4.98 517 129.21 57.43 31.53
106 16 13.85 6.92 4.62 533 133.25 59.22 28.85
107 13 -5.65 -2.82 -1.88 104.74 26.18 11.64 24.74
108 18 -6.39 -3.19 -2.13 211 52.64 23.39 31.53 109 16 7.88 3.94 2.63 190 47.59 21.15 28.85
110 13 0.96 0.48 0.32 22.65 5.66 2.52 24.74
111 12 13.66 6.83 4.55 467 116.75 51.89 23.34
112 13 21.08 10.54 7.03 964 241 107.09 24.74
113 13 18.21 9.11 6.07 422 105.38 46.84 24.74 114 11 5.1 2.55 1.7 45.83 11.46 5.09 21.92
115 8 5.03 2.52 1.68 55.26 13.81 6.14 17.53
116 15 2.13 1.07 0.71 38.92 9.73 4.32 27.49
117 15 11.52 5.76 3.84 443 110.74 49.22 27.49
118 13 -7.47 -3.74 -2.49 200 49.89 22.17 24.74

46
TABLE 4b. THE COMBINED z-SCORES FOR THE PARTICIPATING LABORATORIES FOR SAMPLE “2”
Lab
Co
de
Nu
mb
er
of
an
aly
tes
Rescaled sum of scores (RSZ) Sum of squared scores
(SSZ)
Cri
tical
valu
e
k = 0.5 k = 1.0 k = 1.5 k = 0.5 k = 1.0 k = 1.5 2
35 7 -12.73 -6.37 -4.24 202 50.51 22.45 16.01
53 13 40.74 20.37 13.58 2610 652 290 24.74
54 13 -9.43 -4.71 -3.14 279 69.69 30.97 24.74
57 11 0.89 0.45 0.3 293 73.21 32.54 21.92 62 12 -21.27 -10.63 -7.09 536 134.07 59.59 23.34
69 13 -30.12 -15.06 -10.04 963 241 106.95 24.74
72 14 -12.23 -6.12 -4.08 211 52.84 23.49 26.12
73 14 4.06 2.03 1.35 244 61.05 27.13 26.12
75 15 0.71 0.36 0.24 132.32 33.08 14.7 27.49 89 10 21.73 10.87 7.24 909 227 101.03 20.48
93 12 50.52 25.26 16.84 4554 1138 506 23.34
95 11 8.3 4.15 2.77 158 39.56 17.58 21.92
103 8 56.19 28.1 18.73 29268 7317 3252 17.53
104 13 241 120.34 80.23 78023 19506 8669 24.74 105 14 95.97 47.99 31.99 10763 2691 1196 26.12
106 14 -20.56 -10.28 -6.85 593 148.31 65.91 26.12
107 12 -0.26 -0.13 -0.09 234 58.54 26.02 23.34
108 14 34.54 17.27 11.51 3224 806 358 26.12
109 12 23.55 11.77 7.85 862 215 95.76 23.34
113 9 -8.95 -4.48 -2.98 103.46 25.87 11.5 19.02 114 6 28.91 14.46 9.64 1278 319 141.95 14.45
116 14 -17.59 -8.79 -5.86 345 86.24 38.33 26.12
117 14 18.34 9.17 6.11 671 168 74.5 26.12
118 10 -12.42 -6.21 -4.14 305 76.17 33.85 20.48
119 8 -23.88 -11.94 -7.96 574 143.52 63.79 17.53

47
TABLE 4c. THE COMBINED z-SCORES FOR THE PARTICIPATING LABORATORIES FOR SAMPLE “3”
Lab
Co
de
Nu
mb
er
of
an
aly
tes
Rescaled sum of scores (RSZ) Sum of squared scores
(SSZ)
Cri
tical
valu
e
k = 0.5 k = 1.0 k = 1.5 k = 0.5 k = 1.0 k = 1.5 2
35 4 322 161 107.44 274320 68580 30480 11.14
53 7 13 6.5 4.33 956 239 106.17 16.01
54 8 81.82 40.91 27.27 23806 5952 2645 17.53 57 4 -2.36 -1.18 -0.79 45.79 11.45 5.09 11.14
62 9 490 245 163 1885356 471339 209484 19.02
67 5 1098 549 366 2546192 636548 282910 12.83
69 11 34.62 17.31 11.54 10891 2723 1210 21.92
72 14 3.6 1.8 1.2 1392 348 155 26.12
73 6 -1.61 -0.81 -0.54 2311 578 257 14.45 75 15 -11.4 -5.7 -3.8 290 72.57 32.25 27.49
93 4 9.62 4.81 3.21 110.36 27.59 12.26 11.14
95 4 3.23 1.62 1.08 38.27 9.57 4.25 11.14
103 6 58.09 29.05 19.36 9503 2376 1056 14.45
104 8 13.82 6.91 4.61 294 73.38 32.61 17.53 105 14 -6.13 -3.06 -2.04 171 42.77 19.01 26.12
106 6 6.91 3.46 2.3 132.33 33.08 14.7 14.45
107 5 -4.32 -2.16 -1.44 22.45 5.61 2.49 12.83
108 14 -8.21 -4.1 -2.74 264 65.99 29.33 26.12
109 12 19.05 9.52 6.35 839 210 93.18 23.34 110 7 159 79.56 53.04 90856 22714 10095 16.01
111 5 1592 796 531 3933294 983323 437033 12.83
112 4 1.55 0.78 0.52 80.63 20.16 8.96 11.14
113 5 89.1 44.55 29.7 8330 2082 926 12.83
114 9 76.78 38.39 25.59 42016 10504 4668 19.02
115 2 -1.33 -0.66 -0.44 2.99 0.75 0.33 7.38 116 14 7.06 3.53 2.35 412 103.11 45.83 26.12
117 11 3.28 1.64 1.09 63.79 15.95 7.09 21.92
118 4 -19.04 -9.52 -6.35 385 96.15 42.73 11.14

48
FIG. 2. The density distribution function for the analyte Ag in case of sample “1”.
FIG. 3. The density distribution function for the analyte Ba in case of sample “1”.

49
FIG. 4. The density distribution function for the analyte Bi in case of sample “1”.
FIG. 5. The density distribution function for the analyte Ca in case of sample “1”.

50
FIG. 6. The density distribution function for the analyte Cd in case of sample “1”.
FIG. 7. The density distribution function for the analyte Co in case of sample “1”.

51
FIG. 8. The density distribution function for the analyte Cr in case of sample “1”.
FIG. 9. The density distribution function for the analyte Cu in case of sample “1”.

52
FIG. 10. The density distribution function for the analyte Fe in case of sample “1”.
FIG. 11. The density distribution function for the analyte In in case of sample “1”.

53
FIG. 12. The density distribution function for the analyte K in case of sample “1”.
FIG. 13. The density distribution function for the analyte Mn in case of sample “1”.

54
FIG. 14. The density distribution function for the analyte Ni in case of sample “1”.
FIG. 15. The density distribution function for the analyte Pb in case of sample “1”.

55
FIG. 16. The density distribution function for the analyte S in case of sample “1”.
FIG. 17. The density distribution function for the analyte Sr in case of sample “1”.

56
FIG. 18. The density distribution function for the analyte Tl in case of sample “1”.
FIG. 19. The density distribution function for the analyte Zn in case of sample “1”.

57
FIG. 20. The density distribution function for the analyte Ba in case of sample “2”.
FIG. 21. The density distribution function for the analyte Ca in case of sample “2”.

58
FIG. 22. The density distribution function for the analyte Cl in case of sample “2”.
FIG. 23. The density distribution function for the analyte Co in case of sample “2”.

59
FIG. 24. The density distribution function for the analyte Cr in case of sample “2”.
FIG. 25. The density distribution function for the analyte Cu in case of sample “2”.

60
FIG. 26. The density distribution function for the analyte Fe in case of sample “2”.
FIG. 27. The density distribution function for the analyte K in case of sample “2”.

61
FIG. 28. The density distribution function for the analyte Mn in case of sample “2”.
FIG. 29. The density distribution function for the analyte Ni in case of sample “2”.

62
FIG. 30. The density distribution function for the analyte Pb in case of sample “2”.
FIG. 31. The density distribution function for the analyte Sr in case of sample “2”.

63
FIG. 32. The density distribution function for the analyte Tl in case of sample “2”.
FIG. 33. The density distribution function for the analyte Zn in case of sample “2”.

64
FIG. 34. The density distribution function for the analyte Ba in case of sample “3”.
FIG. 35. The density distribution function for the analyte Br in case of sample “3”.

65
FIG. 36. The density distribution function for the analyte Ca in case of sample “3”.
FIG. 37. The density distribution function for the analyte Cl in case of sample “3”.

66
FIG. 38. The density distribution function for the analyte Cu in case of sample “3”.
FIG. 39. The density distribution function for the analyte Fe in case of sample “3”.

67
FIG. 40. The density distribution function for the analyte K in case of sample “3”.
FIG. 41. The density distribution function for the analyte Pb in case of sample “3”.

68
FIG. 42. The density distribution function for the analyte Rb in case of sample “3”.
FIG. 43. The density distribution function for the analyte S in case of sample “3”.

69
FIG. 44. The density distribution function for the analyte Sr in case of sample “3”.
FIG. 45. The density distribution function for the analyte Ti in case of sample “3”.

70
FIG. 46. The density distribution function for the analyte V in case of sample “3”.
FIG. 47. The density distribution function for the analyte Zn in case of sample “3”.

71
FIG. 48. Distributions of z-scores for analyte Ag in case of sample “1”.
FIG. 49. Distributions of z-scores for analyte Ba in case of sample “1”.
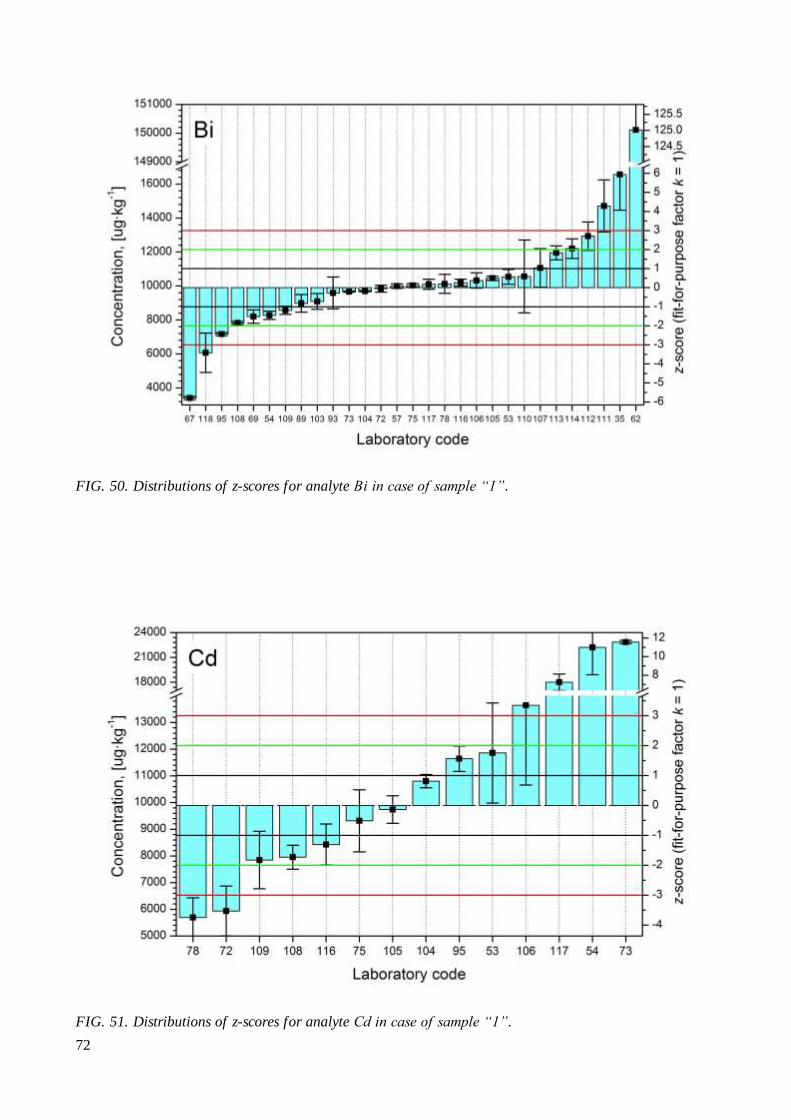
72
FIG. 50. Distributions of z-scores for analyte Bi in case of sample “1”.
FIG. 51. Distributions of z-scores for analyte Cd in case of sample “1”.

73
FIG. 52. Distributions of z-scores for analyte Co in case of sample “1”.
FIG. 53. Distributions of z-scores for analyte Cr in case of sample “1”.

74
FIG. 54. Distributions of z-scores for analyte Cu in case of sample “1”.
FIG. 55. Distributions of z-scores for analyte Fe in case of sample “1”.

75
FIG. 56. Distributions of z-scores for analyte In in case of sample “1”.
FIG. 57. Distributions of z-scores for analyte K in case of sample “1”.

76
FIG. 58. Distributions of z-scores for analyte Mn in case of sample “1”.
FIG. 59. Distributions of z-scores for analyte Ni in case of sample “1”.

77
FIG. 60. Distributions of z-scores for analyte Pb in case of sample “1”.
FIG. 61. Distributions of z-scores for analyte Sr in case of sample “1”.

78
FIG. 62. Distributions of z-scores for analyte Tl in case of sample “1”.
FIG. 63. Distributions of z-scores for analyte Zn in case of sample “1”.

79
FIG. 64. Distributions of z-scores for analyte Ba in case of sample “2”.
FIG. 65. Distributions of z-scores for analyte Ca in case of sample “2”.

80
FIG. 66. Distributions of z-scores for analyte Cl in case of sample “2”.
FIG. 67. Distributions of z-scores for analyte Co in case of sample “2”.

81
FIG. 68. Distributions of z-scores for analyte Cr in case of sample “2”.
FIG. 69. Distributions of z-scores for analyte Cu in case of sample “2”.

82
FIG. 70. Distributions of z-scores for analyte Fe in case of sample “2”.
FIG. 71. Distributions of z-scores for analyte K in case of sample “2”.

83
FIG. 72. Distributions of z-scores for analyte Mn in case of sample “2”.
FIG. 73. Distributions of z-scores for analyte Ni in case of sample “2”.

84
FIG. 74. Distributions of z-scores for analyte Pb in case of sample “2”.
FIG. 75. Distributions of z-scores for analyte Sr in case of sample “2”.

85
FIG. 76. Distributions of z-scores for analyte Tl in case of sample “2”.
FIG. 77. Distributions of z-scores for analyte Zn in case of sample “2”.

86
FIG. 78. Distributions of z-scores for analyte Br in case of sample “3”.
FIG. 79. Distributions of z-scores for analyte Ca in case of sample “3”.

87
FIG. 80. Distributions of z-scores for analyte Cl in case of sample “3”.
FIG. 81. Distributions of z-scores for analyte Cr in case of sample “3”.

88
FIG. 82. Distributions of z-scores for analyte Cu in case of sample “3”.
FIG. 83. Distributions of z-scores for analyte Fe in case of sample “3”.
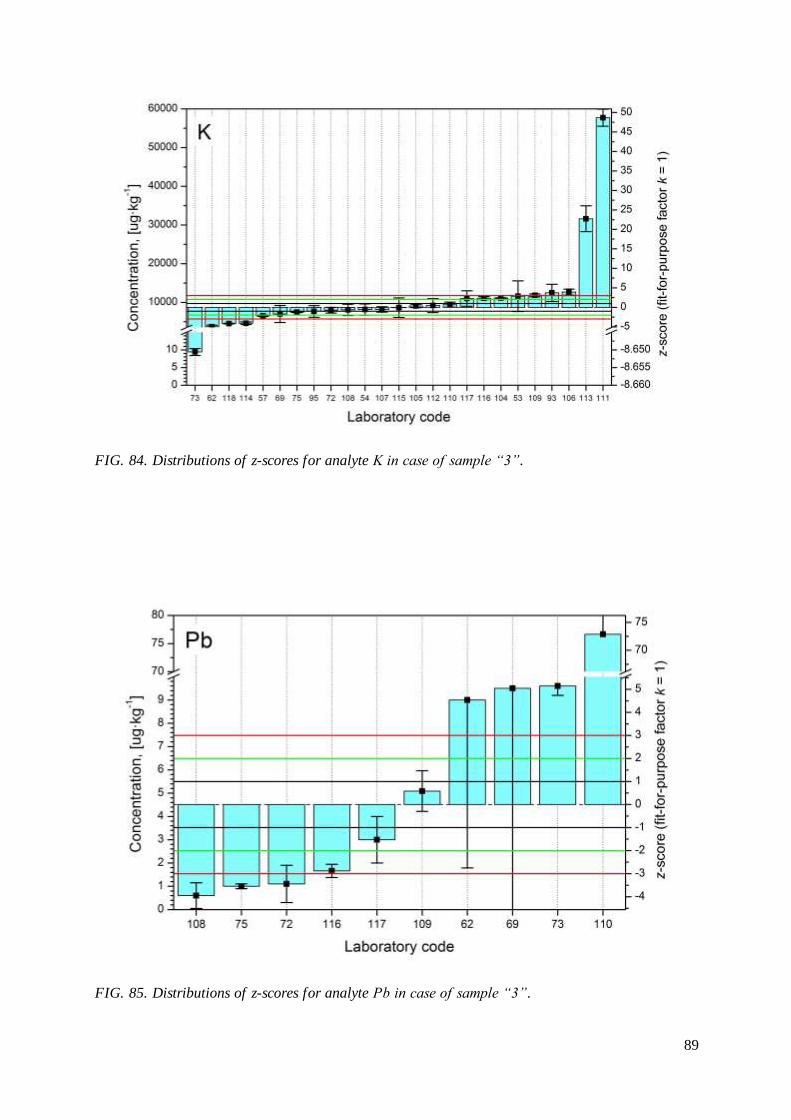
89
FIG. 84. Distributions of z-scores for analyte K in case of sample “3”.
FIG. 85. Distributions of z-scores for analyte Pb in case of sample “3”.

90
FIG. 86. Distributions of z-scores for analyte Rb in case of sample “3”.
FIG. 87. Distributions of z-scores for analyte S in case of sample “3”.

91
FIG. 88. Distributions of z-scores for analyte Sr in case of sample “3”.
FIG. 89. Distributions of z-scores for analyte Ti in case of sample “3”.

92
FIG. 90. Distributions of z-scores for analyte V in case of sample “3”.
FIG. 91. Distributions of z-scores for analyte Zn in case of sample “3”.

93
FIG. 92. Combined plots of z- and u-scores for the laboratory with code 35 in case of sample “1”.
FIG. 93. Combined plots of z- and u-scores for the laboratory with code 53 in case of sample “1”.

94
FIG. 94. Combined plots of z- and u-scores for the laboratory with code 54 in case of sample “1”.
FIG. 95. Combined plots of z- and u-scores for the laboratory with code 57 in case of sample “1”.

95
FIG. 96. Combined plots of z- and u-scores for the laboratory with code 62 in case of sample “1”.
FIG. 97. Combined plots of z- and u-scores for the laboratory with code 67 in case of sample “1”.

96
FIG. 98. Combined plots of z- and u-scores for the laboratory with code 69 in case of sample “1”.
FIG. 99. Combined plots of z- and u-scores for the laboratory with code 72 in case of sample “1”.

97
FIG. 100. Combined plots of z- and u-scores for the laboratory with code 73 in case of sample “1”.
FIG. 101. Combined plots of z- and u-scores for the laboratory with code 75 in case of sample “1”.

98
FIG. 102. Combined plots of z- and u-scores for the laboratory with code 78 in case of sample “1”.
FIG. 103. Combined plots of z- and u-scores for the laboratory with code 89 in case of sample “1”.
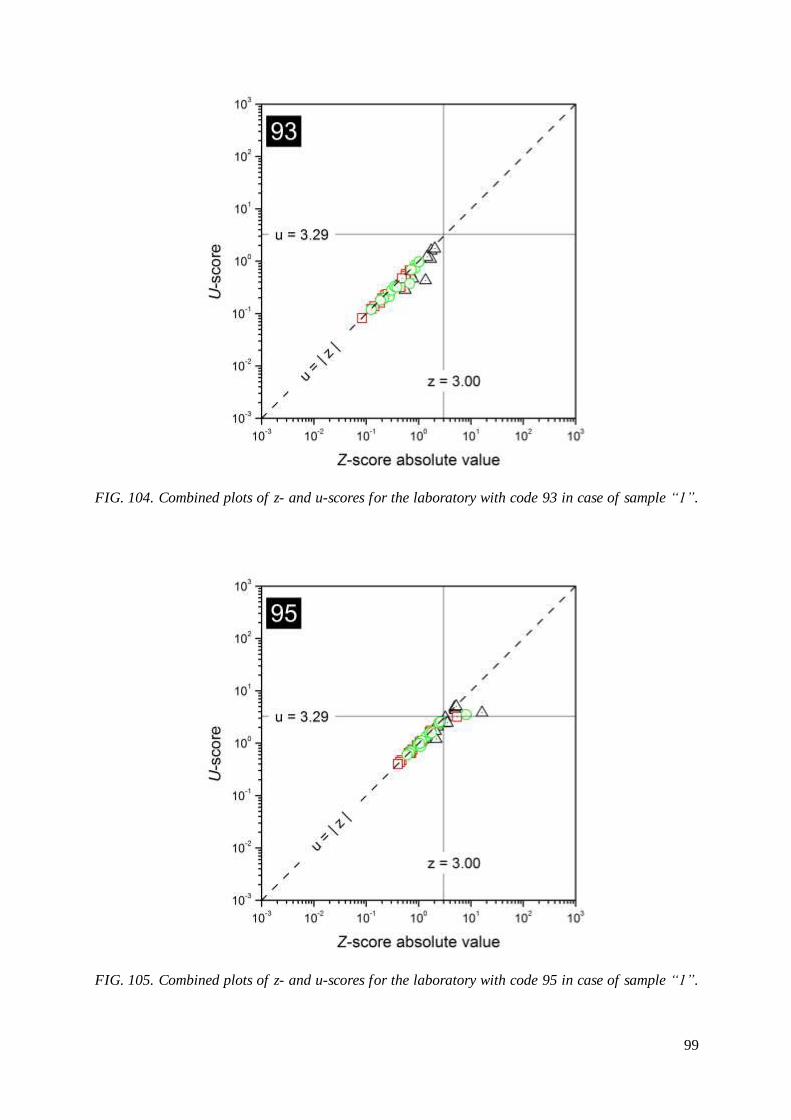
99
FIG. 104. Combined plots of z- and u-scores for the laboratory with code 93 in case of sample “1”.
FIG. 105. Combined plots of z- and u-scores for the laboratory with code 95 in case of sample “1”.

100
FIG. 106. Combined plots of z- and u-scores for the laboratory with code 103 in case of sample “1”.
FIG. 107. Combined plots of z- and u-scores for the laboratory with code 104 in case of sample “1”.

101
FIG. 108. Combined plots of z- and u-scores for the laboratory with code 105 in case of sample “1”.
FIG. 109. Combined plots of z- and u-scores for the laboratory with code 106 in case of sample “1”.

102
FIG. 110. Combined plots of z- and u-scores for the laboratory with code 107 in case of sample “1”.
FIG. 111. Combined plots of z- and u-scores for the laboratory with code 108 in case of sample “1”.

103
FIG. 112. Combined plots of z- and u-scores for the laboratory with code 109 in case of sample “1”.
FIG. 113. Combined plots of z- and u-scores for the laboratory with code 110 in case of sample “1”.

104
FIG. 114. Combined plots of z- and u-scores for the laboratory with code 111 in case of sample “1”.
FIG. 115. Combined plots of z- and u-scores for the laboratory with code 112 in case of sample “1”.
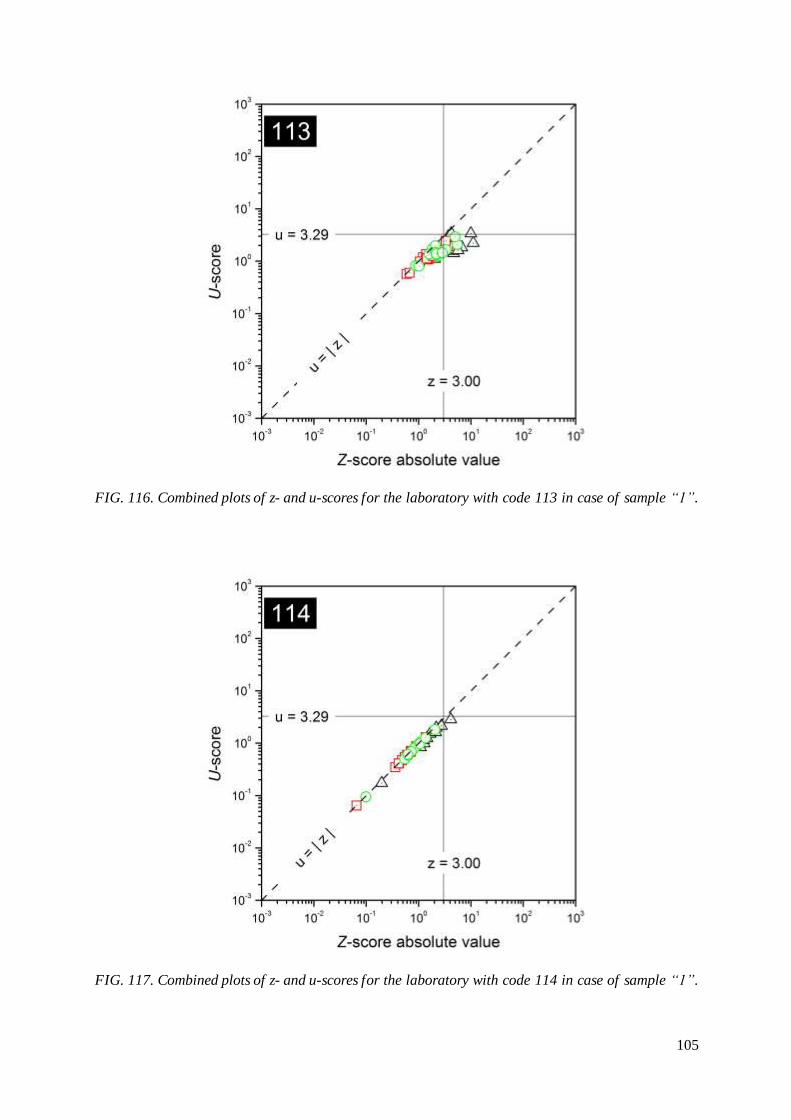
105
FIG. 116. Combined plots of z- and u-scores for the laboratory with code 113 in case of sample “1”.
FIG. 117. Combined plots of z- and u-scores for the laboratory with code 114 in case of sample “1”.

106
FIG. 118. Combined plots of z- and u-scores for the laboratory with code 115 in case of sample “1”.
FIG. 119. Combined plots of z- and u-scores for the laboratory with code 116 in case of sample “1”.

107
FIG. 120. Combined plots of z- and u-scores for the laboratory with code 117 in case of sample “1”.
FIG. 121. Combined plots of z- and u-scores for the laboratory with code 118 in case of sample “1”.

108
FIG. 122. Combined plots of z- and u-scores for the laboratory with code 35 in case of sample “2”.
FIG. 123. Combined plots of z- and u-scores for the laboratory with code 53 in case of sample “2”.

109
FIG. 124. Combined plots of z- and u-scores for the laboratory with code 54 in case of sample “2”.
FIG. 125. Combined plots of z- and u-scores for the laboratory with code 57 in case of sample “2”.

110
FIG. 126. Combined plots of z- and u-scores for the laboratory with code 62 in case of sample “2”.
FIG. 127. Combined plots of z- and u-scores for the laboratory with code 69 in case of sample “2”.

111
FIG. 128. Combined plots of z- and u-scores for the laboratory with code 72 in case of sample “2”.
FIG. 129. Combined plots of z- and u-scores for the laboratory with code 73 in case of sample “2”.

112
FIG. 130. Combined plots of z- and u-scores for the laboratory with code 75 in case of sample “2”.
FIG. 131. Combined plots of z- and u-scores for the laboratory with code 89 in case of sample “2”.

113
FIG. 132. Combined plots of z- and u-scores for the laboratory with code 93 in case of sample “2”.
FIG. 133. Combined plots of z- and u-scores for the laboratory with code 95 in case of sample “2”.

114
FIG. 134. Combined plots of z- and u-scores for the laboratory with code 103 in case of sample “2”.
FIG. 135. Combined plots of z- and u-scores for the laboratory with code 104 in case of sample “2”.

115
FIG. 136. Combined plots of z- and u-scores for the laboratory with code 105 in case of sample “2”.
FIG. 137. Combined plots of z- and u-scores for the laboratory with code 106 in case of sample “2”.

116
FIG. 138. Combined plots of z- and u-scores for the laboratory with code 107 in case of sample “2”.
FIG. 139. Combined plots of z- and u-scores for the laboratory with code 108 in case of sample “2”.
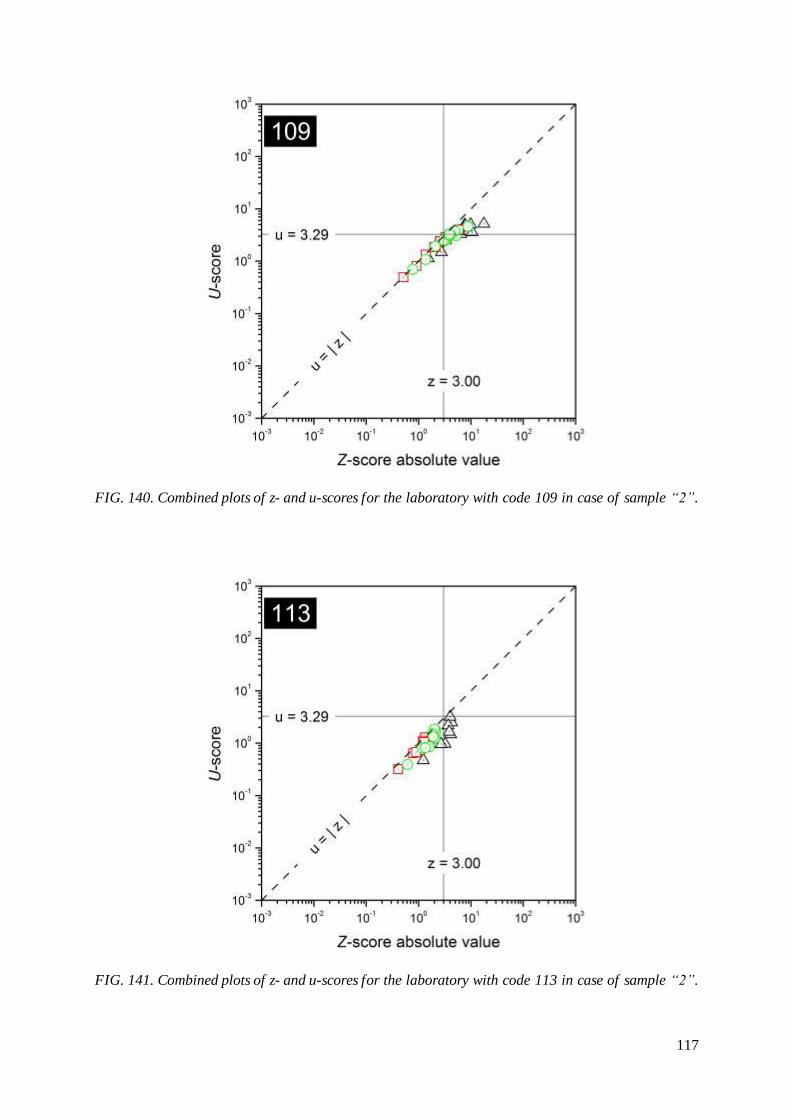
117
FIG. 140. Combined plots of z- and u-scores for the laboratory with code 109 in case of sample “2”.
FIG. 141. Combined plots of z- and u-scores for the laboratory with code 113 in case of sample “2”.

118
FIG. 142. Combined plots of z- and u-scores for the laboratory with code 114 in case of sample “2”.
FIG. 143. Combined plots of z- and u-scores for the laboratory with code 116 in case of sample “2”.

119
FIG. 144. Combined plots of z- and u-scores for the laboratory with code 117 in case of sample “2”.
FIG. 145. Combined plots of z- and u-scores for the laboratory with code 118 in case of sample “2”.

120
FIG. 146. Combined plots of z- and u-scores for the laboratory with code 119 in case of sample “2”.

121
FIG. 147. Combined plots of z- and u-scores for the laboratory with code 35 in case of sample “3”.
FIG. 148. Combined plots of z- and u-scores for the laboratory with code 53 in case of sample “3”.
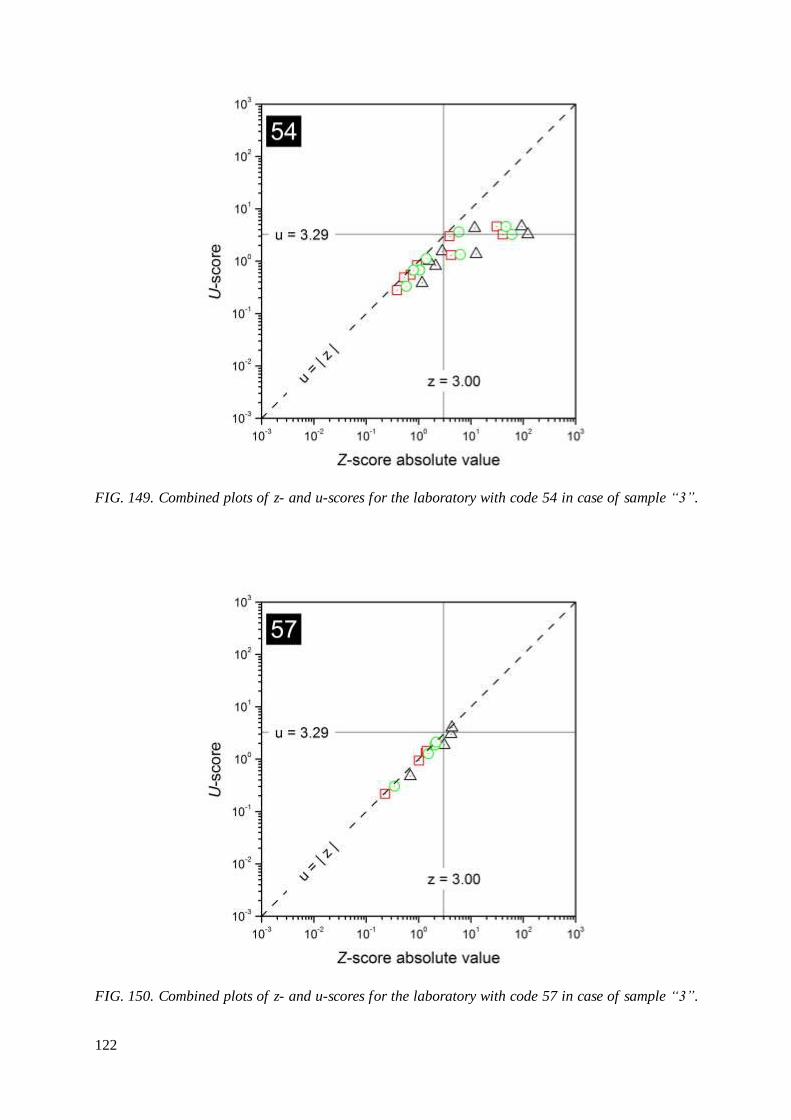
122
FIG. 149. Combined plots of z- and u-scores for the laboratory with code 54 in case of sample “3”.
FIG. 150. Combined plots of z- and u-scores for the laboratory with code 57 in case of sample “3”.

123
FIG. 151. Combined plots of z- and u-scores for the laboratory with code 62 in case of sample “3”
FIG. 152. Combined plots of z- and u-scores for the laboratory with code 67 in case of sample “3”.
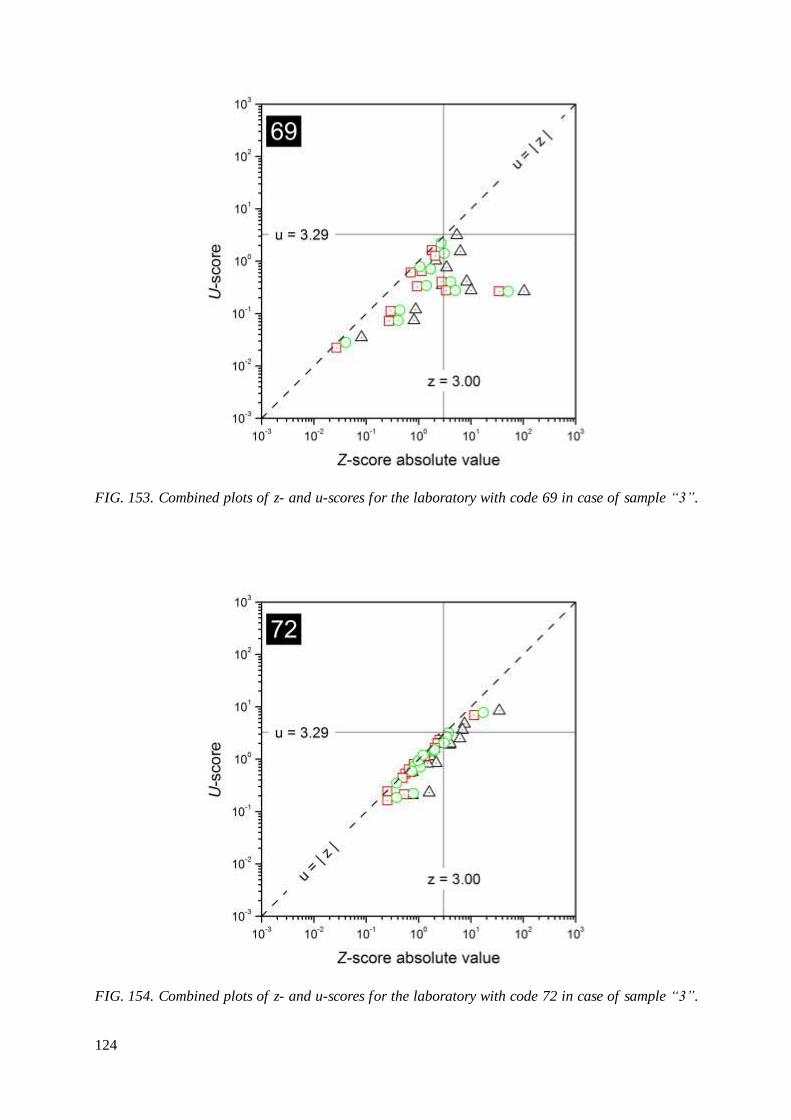
124
FIG. 153. Combined plots of z- and u-scores for the laboratory with code 69 in case of sample “3”.
FIG. 154. Combined plots of z- and u-scores for the laboratory with code 72 in case of sample “3”.

125
FIG. 155. Combined plots of z- and u-scores for the laboratory with code 73 in case of sample “3”.
FIG. 156. Combined plots of z- and u-scores for the laboratory with code 75 in case of sample “3”.

126
FIG. 157. Combined plots of z- and u-scores for the laboratory with code 93 in case of sample “3”.
FIG. 158. Combined plots of z- and u-scores for the laboratory with code 95 in case of sample “3”.

127
FIG. 159. Combined plots of z- and u-scores for the laboratory with code 103 in case of sample “3”.
FIG. 160. Combined plots of z- and u-scores for the laboratory with code 104 in case of sample “3”.

128
FIG. 161. Combined plots of z- and u-scores for the laboratory with code 105 in case of sample “3”.
FIG. 162. Combined plots of z- and u-scores for the laboratory with code 106 in case of sample “3”.

129
FIG. 163. Combined plots of z- and u-scores for the laboratory with code 107 in case of sample “3”.
FIG. 164. Combined plots of z- and u-scores for the laboratory with code 108 in case of sample “3”.

130
FIG. 165. Combined plots of z- and u-scores for the laboratory with code 109 in case of sample “3”.
FIG. 166. Combined plots of z- and u-scores for the laboratory with code 110 in case of sample “3”.

131
FIG. 167. Combined plots of z- and u-scores for the laboratory with code 111 in case of sample “3”.
FIG. 168. Combined plots of z- and u-scores for the laboratory with code 112 in case of sample “3”.

132
FIG. 169. Combined plots of z- and u-scores for the laboratory with code 113 in case of sample “3”.
FIG. 170. Combined plots of z- and u-scores for the laboratory with code 114 in case of sample “3”.

133
FIG. 171. Combined plots of z- and u-scores for the laboratory with code 115 in case of sample “3”.
FIG. 172. Combined plots of z- and u-scores for the laboratory with code 116 in case of sample “3”.

134
FIG. 173. Combined plots of z- and u-scores for the laboratory with code 117 in case of sample “3”.
FIG. 174. Combined plots of z- and u-scores for the laboratory with code 118 in case of sample “3”.
135
REFERENCES [1] http://www.vamas.org
[2] BORGESE, L., BILO, F., TSUJI, K., FERNÁNDEZ-RUIZ, R., MARGUI, E., STRELI, C., PEPPONI, G., STOSNACHG, H., YAMADA, T., VANDENABEELE, P., MAINA, D.M., GATARI, M., SHEPHERD, K.D., TOWETT, E.K., BENNUN, L., CUSTO, G.M., VASQUEZ, C., DEPERO, L., “First Total Reflection X-Ray Fluorescence round-
robin test of water samples: Preliminary results”, Spectrochimica Acta, Part B 101 (2014) 6–14
[3] THOMPSON, M., “Recent trends in inter-laboratory precision at ppb and sub-ppb concentrations in relation to fitness for purpose criteria in proficiency testing”, Analyst
125 (2000) 385-386. [4] GRUBBS, F.E., “Procedures for detecting outlying observations in samples”,
Technometrics 11 (1969) 1-21. [5] INTERNATIONAL ATOMIC ENERGY AGENCY, A Nonparametric Statistical
Method for the Determination of a Confidence Interval for the Mean of a Set of Results Obtained in a Laboratory Intercomparison, IAEA/RL/84, IAEA, Vienna (1981).
[6] INTERNATIONAL ATOMIC ENERGY AGENCY, Report on the Intercomparison Run IAEA-Soil-7: Trace Elements in Soil, IAEA/RL/112, IAEA, Vienna (1984).
[7] NATRELLA, M.G., Experimental Statistic, Handbook 91, National Bureau of Standards, United States Department of Commerce (1963).
[8] ZIELINSKI, R., Statistical Tables, PWN, Warsaw (1972). [9] GRUBBS, F.E., “Sample Criteria for Testing Outlying Observations”, The Annals of
Mathematical Statistics 21 (1950) 27-58.

136

137
GLOSSARY The definitions of terms used in the proficiency testing schemes are provided. Although this
terminology might be known to the participants or can be found elsewhere [8-10] the terms used in this report are clearly defined to avoid any ambiguity. Proficiency testing: evaluation of participant performance against pre-established criteria by
means of interlaboratory comparisons. True value: the actual concentration of the analyte in the matrix.
Assigned value: the value of the concentration of the analyte in the matrix used as the true value by the proficiency testing coordinator in the statistical treatment of results (or the best available estimate).
Target value for standard deviation: a numerical value for the standard deviation of a measurement result, which has been designated as a target for measurement quality. Consensus value: the mean value of the reported laboratory results after the removal of
outliers. Standard deviation of the consensus value: the standard deviation of the mean value of the reported laboratory results after the removal of outliers.
Certified Reference Material: A reference material, accompanied by a certificate, one or more of whose property values are certified by a procedure which establishes traceability to an accurate realization of the unit in which the property values are expressed, and for which
each certified value is accompanied by an uncertainty at a stated level of confidence.

138

139
LIST OF CONTRIBUTORS TO DRAFTING AND REVIEW
COORDINATORSS OF THE PROFICIENCY TEST
AUSTRIA
Migliori, A., Padilla-Alvarez, R., IAEA Laboratories
Karydas, A.G. Reaktor str. 1 A-2444 Seibersdorf
Austria
PARTICIPATING LABORATORIES
ARGENTINA
Custo G. Servicios Analíticos, Laboratorio de Fluorescencia de Rayos X,
Comisión Nacional de Energía Atómica, Avenida General Paz 1499,
1650 San Martín, Argentina
AUSTRIA
Streli C. Vienna Univ. of Technology, Atominstitut,
Stadionallee 2, 1020 Vienna,
Austria
BRAZIL
Appoloni C.R. Universidade Estadual de Londrina - UEL,
Departamento de Fisica – CCE, Campus Universitario PO Box 10.011,
86057-970 Londrina, Parana, Brazil
BOLIVIA
Chungara Castro J. Instituto Boliviano de Ciencia y Tecnologia
Nuclear, Avenida 6 de Agosto 2905 San Jorge,
4821 La Paz - Murillo, Bolivia
BULGARIA
Karadjov M. GRL “GeoLab”, Geological Institute of the
Bulgarian Academy of Science, Acad. G. Bonchev str. BL 24,
1113 Sofia, Bulgaria

140
CHILE
Bennun L. Conception University, Physics Department, Applied Physics Laboratory,
Office 319, 41 Conception,
Bio Bio – VIII Region, Chile
GERMANY
Stosnach H. Bruker Nano GmbH, An Studio 2D,
12043 Berlin, Germany
Nutsch A. Physikalisch Technische Bundesanstalt (PTB),
Abberstr. 2-12, 10587 Berlin,
Germany
INDIA
Aggarwal S.K. Bhabha Atomic Research Center,
Fuel Chemistry Division, 400 085 Mumbai,
Maharashtra, India
ITALY
Seralessandri L. GNR,
Via Torino 7, 28010 Agrate Conturbia, Novara,
Italy
Depero L. Chemistry for Technologies Laboratory, Department of Mechanical and
Industrial Engineering, University of Brescia,
Via Branze 38, 25123 Brescia,
Italy
Pepponi G. Fondazione Bruno Kessler,
Povo, via Sommarive 18, 38123 Trento,
Italy
JAPAN
Kunimura S. Department of Industrial Chemistry, Faculty of Engineering,
Tokyo University of Science, 12-1 Ichigaya-Funagawara, Shinjuku-ku,
141
162-0826 Tokyo, Japan
Kawai J. Kyoto University,
Department of Material Science and Engineering,
Sakyo-ku, 606-8501 Kyoto,
Japan
Nagai H. OURSTEX Corporation,
Research and Development Division, 13-20 Hommachi,
572-0832 Neyagawa City, Osaka, Japan
Okuda K. Rigaku Corporation,
14-8, Akaoji-cho, 569-1146 Takatsuki-shi, Osaka,
Japan
Tsuji K. Graduate School of Engineering, Osaka City University,
3-3-138 Sugimoto, Sumiyoshi-ku, 558-8585 Osaka,
Japan
KENYA
Maina D. Institute of Nuclear Science & Technology,
University of Nairobi, Harry Thuku Road, P.O. Box 30197,
00100 Nairobi, Kenya
MADAGASCAR
Andriambololona R. Institut National des Sciences
et Tecniques Nucléaires, Près Bloc Technique,
Enceinte de l'Université d'Antananarivo, 101 Antananarivo,
Madagascar
MEXICO
Salas Tellez J.A. CENAM (National Center of Metrology),
Km 4.5 Carretera a Los Cues, 76246 Queretaro,
Municipio El Marques, Mexico
Ibrahim Serroukh Universidad Autonoma de Queretaro
cerro de las campanas S/N Av.

142
Tecnológico y 5 Feb. Cerro de las Campanas, 76010 Queretaro,
Mexico
Zarazúa G. National Institute for Nuclear Research, Carretera México-Toluca S/N,
La Marquesa, 52750 Ocoyoacac,
Mexico
MOROCCO
Tahri M. CNESTEN,
BP 1382, R.P. 10001 Rabat,
Morocco
POLAND
Samek L. AGH_UST, University of Science and Technology,
Faculty of Physics and Applied Computer Science,
Al. Mickiewicza 30, 30-059 Krakov,
Poland
Kubala-Kukus A. Institute of Physics,
Jan Kochanowski University, Swietokrzyska 15,
25-406 Kielce, Poland
SLOVENIA
Kump P. Jozef Stefan Institute,
Jamova 39, 1000 Ljubljana,
Slovenia
SPAIN
Marguí E. Departamento de Quimica,
Universidad de Girona, Campus Montilivi s/n,
17071 Girona, Spain
Fernandez Ruiz R. Universidad Autonoma de Madrid,
Servicio Interdepartamental de Investigacion (SIdI),
Laboratorio de TXRF, Facultad de Ciencias,
Modulo C13 (IX) 1 Planta,

143
C/Fco. Tomas y Valiente 7, 28049 Madrid,
Spain
SRI LANKA
Seneviratne M.C.S. Atomic Energy Authority,
No:60/460, Baseline Road, Orugodawatte, Wellampitiya,
Colombo, Sri Lanka
VENEZUELA
Greaves E.D. Universidad Simón Bolívar, Laboratorio de Física Nuclear,
Valle de Sartenejas, Baruta, Edo. Miranda, 1080 Caracas,
Venezuela
Parra L.M.M. Universidad Centroccidental Lisandro Alvarado,
Dpto Quimica y Suelos, Modulo 1 – Nucleo Tarabana,
Redoma de Agua Viva, 3023 Cabudare,
Lara, Venezuela