worldwide jewelry market demand and · pdf fileworldwide jewelry market demand and...
TRANSCRIPT

Worldwide Jewelry Market Demand and Opportunities
Feb 12, 2010

Disclaimer
The research reports provided by A & M Mindpower Solutions are for the personal information of the authorised recipient and is not for public distribution and should not be reproduced or redistributed without prior permission. You are permitted to print or download extracts from this material for your personal use only. None of this material may be used for any commercial or public use.
The information provided in the research documents is from publicly available data and other sources, which are reliable. Efforts are made to try and ensure accuracy of data.
With respect to documents available, neither the company nor any of its employees makes any warranty, express or implied, including the warranties of merchantability and fitness for a particular purpose, or assumes any legal liability or responsibility for the accuracy, completeness, or usefulness of any information, apparatus, product, or process disclosed, or represents that its use would not infringe privately owned rights.
The report also includes analysis and views expressed by our research team. The research reports are purely for information purposes. The opinions expressed are our current opinions as of the date appearing in the material and may be subject to change from time to time without notice. Investors should not solely rely on the information contained in the research documents and must make investment decisions based on their own investment objectives, risk profile and financial position. The recipients of this material should take their own professional advice before acting on this information.
No part of this manual or any material appearing may be reproduced, stored in or transmitted on any other Web site without written permission of A&M Mindpower Solutions and any payments of a specified fee. Requests to republish any material may be sent to us.

Table of Contents 1. Global gems and jewellery Structure and Demand ................................................... 5 1.1 Industry Structure ................................................................................................ 5 1.2 Market Size/Demand ............................................................................................ 6 1.2.1 Global Jewellery Demand .................................................................................. 6 1.2.2 Demand for Diamond and Gold by Geography ........................................................... 7 1.2.3 Global Demand for Precious Metals ....................................................................... 9
2. Jewellery Market in the United States ............................................................... 10 2.1 Industry Structure .............................................................................................. 10 2.2 Classification of Jewellery .................................................................................... 11 2.3 U.S. Jewellery Market Size ................................................................................... 11 2.4 Diamond Jewellery Demand .................................................................................. 12 2.5 Performance in Year 2008 .................................................................................... 13 2.6 Industry Players in United States ............................................................................. 15
3. Canadian Gems and Jewellery Market .............................................................. 18 3.1 Market Size .................................................................................................... 18
4. European Union ....................................................................................... 20 4.1 EU Market Size ................................................................................................ 20 4.2 EU Costume, silver and palladium jewellery Demand ...................................................... 21 4.3 The Jewellery Demand in Romania........................................................................... 23 4.4 The Jewellery Market in Bulgaria ............................................................................ 25 4.5 The Jewellery Market in Germany ............................................................................ 26
5. Recent Industry Trends and Opportunities ......................................................... 28 5.1 UK Gems and Jewellery Demand............................................................................. 28 5.2 Symbolic Jewellery has Targeted Spiritual Group ........................................................... 28 5.3 Declining Sales of Luxury Jewellery Retailers with Rising Raw Material Prices .......................... 29 5.4 Opportunities in Saudi Arabia Jewellery Market ............................................................ 31 5.5 Bright Prospects in Indian Jewellery Market ................................................................. 32 5.6 Impact of Economic Recession over Diamond supply/demand ............................................. 33
6. Driving Forces in Gems and Jewellery Sector ...................................................... 34 6.1 Increasing Urban Population with Contribution of Working Women ...................................... 34 6.2 Men’s jewellery Demand ...................................................................................... 36 6.3 Jewellery a Symbol of Changing Lifestyle among working women ........................................ 36 6.4 US consumer spending and Personal Income ................................................................ 37
7. Gems and Jewellery Market Forecast ................................................................ 39

8. Industry Players Profiling ............................................................................. 41 8.1 Tiffany & Co. .................................................................................................. 41 8.1.1 Business Map ............................................................................................. 41 8.1.2 Company Financials ...................................................................................... 42 8.1.2 Business Strategies ....................................................................................... 43
8.2 Signet Group Ltd. .............................................................................................. 45 8.2.1 Business Map ............................................................................................. 45 Company Financials ............................................................................................ 46
8.3 Zale Corporation ............................................................................................... 47 8.3.1 Business Map ............................................................................................. 47 8.3.2 Company Financials ...................................................................................... 47
8.4 Gitanjali Gems ................................................................................................. 48 8.4.1 Business Map ............................................................................................. 48 8.4.2 Company Financials ...................................................................................... 48 8.4.3 Business Strategies ....................................................................................... 49

1. Global gems and jewellery Structure and Demand
1.1 Industry Structure
The structure of the industry is global in nature, the source of the raw material are Africa, Canada, Russia & Australia. Primarily India, China, Turkey & Italy are the countries which are involved in jewellery manufacturing & diamond processing and the retail market are in US, Europe, Far East, Middle East and Asia.
India is one of the leading countries in diamond cutting and polishing centre. It accounts for 57% of the global polished diamond market in terms of value, in terms of cartage 80% and 90% in terms of number of pieces processed.
Figure 1.1: Global Gems and Jewelry Industry Structure
Global gems and jewellery Structure
Sources of Raw Material
Jewelry Manufacturing and Diamond Processing
Retail Markets
Africa, Canada, Russia and Australia
India, China, Turkey & Italy
US, Europe, Far East, Middle East and Asia

1.2 Market Size/Demand
1.2.1 Global Jewellery Demand Since 2000, the global gems & jewellery industry has grown at an average CAGR of 5.2%. In 2005 the size at retail prices was estimated at US$146 billion, in the same year industry experts predicted the industry will grow at 4.6 % every year and would reach US$185 billion by 2010 and by 2015 it would reach US$230 billion but the recent fall in gems & jewellery demand has led the experts to lower their expectations.
Figure 1.2: Global Jewellery Sales (2000-2008)
020406080100120140160180200
2000 2001 2002 2003 2004 2005 2006 2007 2008
US$ Billions
Source: HSBC and industry estimates
Luxury goods sector is expected to grow faster than the gems & jewel sector. Industry experts believe that the luxury apparel is expected to grow at around 10% – 15% in the next seven years. The largest producer of gold is South Africa followed by US and Australia. According to Indian Brand Equity Foundation in the gems & jewellery sector 2006 report, these countries account for 45% of the world’s total gold production.
According to World Gold council (WGC), the global market for gold reached to 3,115 tonnes in 2008 by volume. In 2007 global jewellery sales were US$163.03 billion which rose to US$177.87 billion in 2008, an increase of 1.7%. Rising number of marriages, working women, shopping centres and interest in fashion are the factors which have led to the growth in this sector.
In the last 10 years compared to 4.7% for the total jewellery market, US diamond jewellery sales grew up by 6.1%. Until 2007 worldwide jewellery sales have risen substantially but
have slowed down after that. EU with 20% of the global sales in 2008 was the second largest jewellery market.
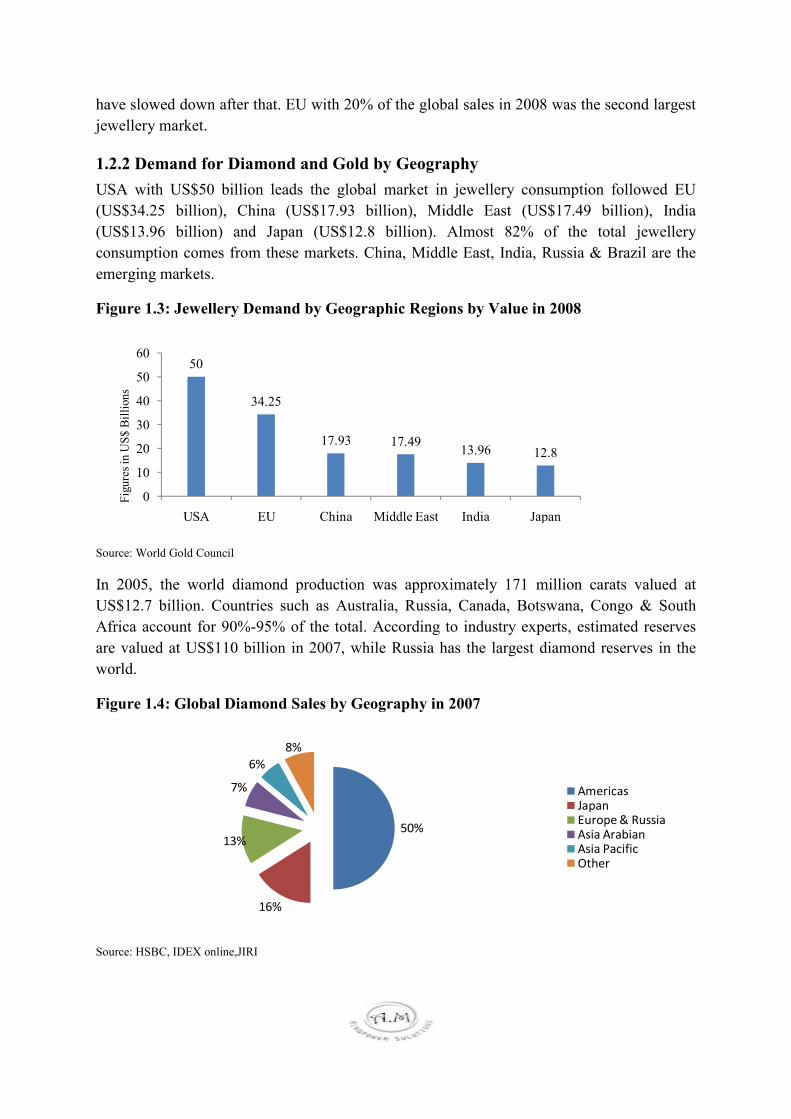
1.2.2 Demand for Diamond and Gold by Geography USA with US$50 billion leads the global market in jewellery consumption followed EU (US$34.25 billion), China (US$17.93 billion), Middle East (US$17.49 billion), India (US$13.96 billion) and Japan (US$12.8 billion). Almost 82% of the total jewellery consumption comes from these markets. China, Middle East, India, Russia & Brazil are the emerging markets.
Figure 1.3: Jewellery Demand by Geographic Regions by Value in 2008
50
34.25
17.93 17.4913.96 12.8
0
10
20
30
40
50
60
USA EU China Middle East India Japan
Figures in US$ Billions
Source: World Gold Council
In 2005, the world diamond production was approximately 171 million carats valued at US$12.7 billion. Countries such as Australia, Russia, Canada, Botswana, Congo & South Africa account for 90%-95% of the total. According to industry experts, estimated reserves are valued at US$110 billion in 2007, while Russia has the largest diamond reserves in the world.
Figure 1.4: Global Diamond Sales by Geography in 2007
50%
16%
13%
7%
6%8%
AmericasJapanEurope & RussiaAsia ArabianAsia PacificOther
Source: HSBC, IDEX online,JIRI
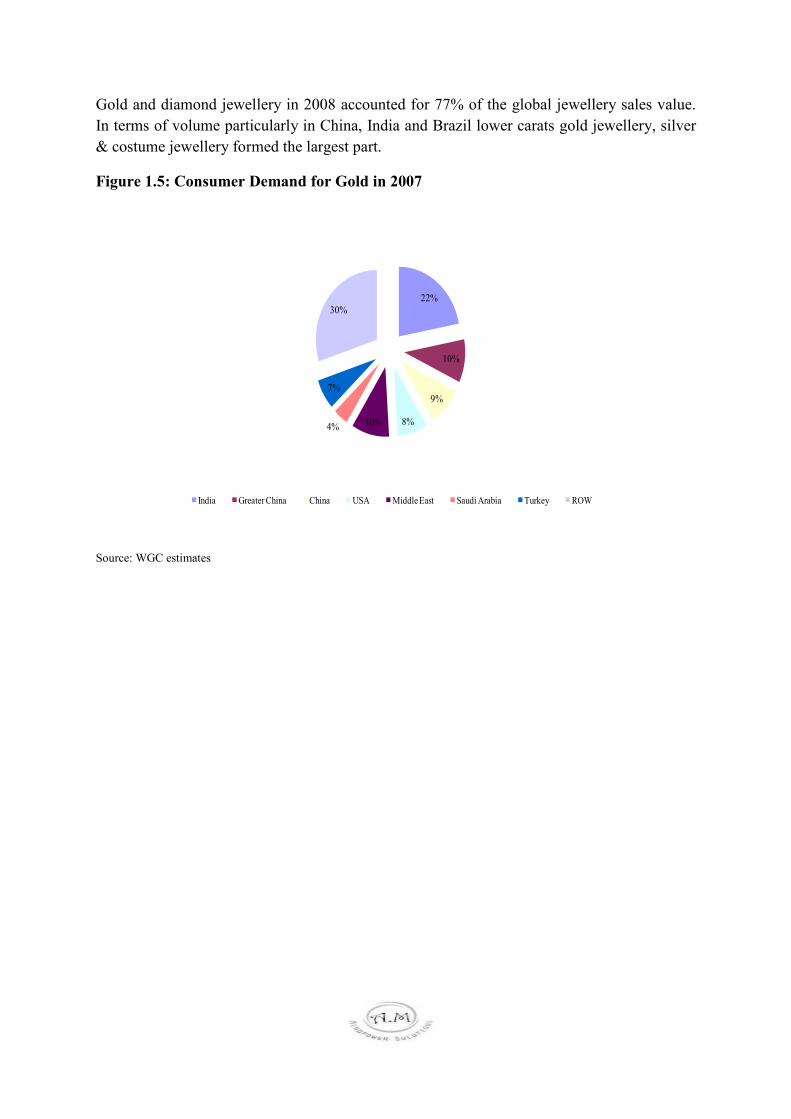
Gold and diamond jewellery in 2008 accounted for 77% of the global jewellery sales value. In terms of volume particularly in China, India and Brazil lower carats gold jewellery, silver & costume jewellery formed the largest part.
Figure 1.5: Consumer Demand for Gold in 2007
22%
10%
9%
8%10%4%
7%
30%
India Greater China China USA Middle East Saudi Arabia Turkey ROW
Source: WGC estimates

1.2.3 Global Demand for Precious Metals
The global demand for precious metals for manufacturing of jewellery has gone down by more than 700 tonnes from 2004 to 2008. Higher prices, lighter pieces with stones, lower carats, and shift towards silver & costume jewellery were the main reasons which led to the decrease in the demand of gold. India being the most sensitive country for the gold price developments in the world market also experienced the decrease in demand for gold.
Table 1.1: Global Demand for Precious Metals for the Production of Jewellery in tonnes (2004&2008)
Volume 2004
Volume 2008
difference ave annn. Major Demand from
Gold (World) 2,878 2,152 -7.10%
Middle East 528 435 -4.70%
India 526 294 -15.60%
USA 379 291 -6.40%
China 265 233 -3.20%
Turkey 129 116 -2.80%
EU 581 472 -5.10%
Italy 87 70 -5.30%
Germany 59 43 -7.60%
UK 55 42 -6.60%
Spain 39 32 -4.80%
France 21 18 -4.70%
Silver 4,961 4,479 -2.50% Thailand. China. Italy, USA, Russia and India
Platinum 59 45 -6.60% China, USA, Switzerland, Italy, UK and Germany
Palladium 12 21 15% China and Japan
Source: GMFS, World Gold Council, Silver Institute
The demand for silver fell in Italy and Thailand because of its increase in prices and the popularity of stainless steel & titanium jewellery. The demand for silver jewellery was more in India, China and Russia. Demand for platinum declined because of high prices and also because of rise in second hand platinum jewellery markets in China and Japan.

2. Jewellery Market in the United States
2.1 Industry Structure
In United States, generally jewellery is sold through speciality retailers (Tiffany, Sterling), general retailers (Target, Walmart), apparel & accessories retailers (Sears Roebuck, JC Penny), through online stores and departmental stores. General retailers and other categories have lost their market share to online sales which has gathered attention recently.
The jewellery & silverware market comprises of gold, silver, diamonds and other precious metals. Diamond is the most lucrative segment in the US market followed by gold jewellery with gold bracelets and earrings being the prominent product categories in demand. Online sales have also added to the profitability in this market. Increase in raw material cost has adversely hit the manufacturers as prices of silver plummeted and price of bullion and commodities have risen. Changing trends and brand significance has benefited retailers who have introduced branded jewellery and enhanced the popularity of silver and gold jewellery throughout the market.
Speciality retailers hold a very strong position in the jewellery market. The market share of speciality retailers has been around 48% since 1997. In 2007, 30,000 speciality stores generated revenue of US$30 billion. Speciality stores account for 48% of the market share in terms of value although they operate only 22% of the stores.
Zale, Sterling Jewellers, Tiffany are the major companies. The industry is highly fragmented with less than half of the revenue is generated by the top 50 jewellery chains. Consumer Income is one of the main factors on which the jewellery sales dependent upon. Since sales are not directly related to price small jewellers can effectively compete with large chains, rather it depends upon merchandising and effective marketing. Wal-Mart is the largest jewellery retailer in US. Apart from the specialised jewellery retailers it is sold by department stores and mass merchants.

2.2 Classification of Jewellery
Jewellery is classified as bridal merchandise, fashion jewellery, silver flatware, watches & other giftware. Bridal merchandise constitutes of 35% of the market which includes engagement, bridal & anniversary rings. Fashion jewellery includes bracelets, rings, earrings, pins, gold chains etc. Largest share of total jewellery sales comes from diamond jewellery & loose diamonds which accounts for approximately 46% followed by gold jewellery 11%, coloured gemstone jewellery (rubies, sapphires, emeralds) 9% & watches 4%.
Jewellery sales are highly seasonal in nature. Majority of the profits & around 40% of the revenue is earned in the fourth quarter. Around 25% of the jewellery sales are in the month of December. Merchandise Inventories constitute more than 50% of the annual sales. Inventory controls needs to be checked to prevent fraudulent practices. Countries which offer their own credit card generally for them accounts receivables are very high. Most of the jewellers indulge in credit sales. Credit is an important consideration since credit availability is necessary to sell expensive product. 50% of the jeweller’s sales are on credit cards, whereas cash sale constitute very large portion of credit sales. A practice which has resulted in negative results is when local jewellers extend credit on large purchases to well known customers. Big chains typically offer a private credit card by not taking any risk themselves rather through a third party. Small retailers avoid risk by taking only third party credit cards.
Government does not regulate retailers and jewellers except that they must adhere to standard fair trade & credit laws. Jewellers are provided guidelines by the FTC to accurately advertise and describe gemstones, especially when they have been treated for change color.
2.3 U.S. Jewellery Market Size
Total US jewellery sales is largest in the world and accounts for 28% of the world jewellery market; including watches and fashion jewellery the figure accounted for US$65 billion in 2008. In the last 25 years the sector had registered a CAGR of 5.9%. However, in 2007 it grew by 4.0%, primarily reflecting the slower growth of discretionary disposable income.
The US retail jewellery industry is highly fragmented. The US retail jewellery market includes formats such as department stores, discount outlets, television home shopping, internet retailers and general merchandise, apparel and accessory stores. Wal-Mart Stores, Inc is the largest jewellery retailer in the US, with an estimated 4.6% market share. Signet is the second largest and has steadily grown its market share to 4.2% in CY 2006, from 3.3% in CY 2001.
Specialty retailers accounted for 47.7% of the total jewellery market in 2006 compared to 48.3% in 2001. The specialty jewellery sector grew 6.7% in 2006.

Figure 2.1: Jewellery Outlets by Store Count and Value in 2008
22% 23%
18%
37%
48%
7%
25%
20%
0%
10%
20%
30%
40%
50%
60%
Specialty Apparel & Acc. Retailers General Mechandise Others
% Sahre out of 130,000 Stores % Share in US$64 bn
Source: US Dept of commerce
Online jewelry sales in the U.S. market in 2007 were roughly US$4.8 billion, or 7.4 percent of total jewelry sales, according to preliminary data from the U.S. Department of Commerce. In the prior year (2006), revised data suggests that online jewelry sales were US$4.0 billion, or 6.4 percent of all jewelry sold in the U.S. Prior to this major revision in data, the Commerce Department had reported that just US$2.5 billion, or 3.9 percent of jewelry sales were made online in 2006.
2.4 Diamond Jewellery Demand
Diamond jewellery accounts for 55% of total jewellery sales in the US market. Approximately 50% of worldwide diamond jewellery sales are made in the US, according to the International Diamond Exchange. During the last ten years, the industry growth in diamond jewellery sales has been 6.4% per annum.
Diamond jewellery accounted for 72% of Signet’s US division’s sales in FY 2007, compared to 67% in FY 2002. In the last 10 years diamond jewellery sales have increased by 6.1% compared to 4.7% for the total jewellery market. At US$32 billion, US accounts for almost half of the diamond jewellery market worldwide, 15 times the Indian jewellery market.

Figure 2.2: US Jewellery Market Sales Mix in 2007
50%
18%
12%
12%
8%
Diamonds Precious Metals Other Gems Pearls Watches Others
Source: IDEX online
According to IDEX online in 2009, the net imports of polished diamonds in US showed a decline by 40% in value and by quarter in volume in July 2009 compared to the same in previous year. A decline of nearly 75% in the value of rough diamond imports to US was observed in July 2009 year over year. South Africa & Canada continue to be the top suppliers of rough diamonds to US. In 2009, US have exported more diamond goods than it has imported depicting weak domestic demand for diamond jewellery.
2.5 Performance in Year 2008
According to BEA, total US jewellery retail sales, including watches and fashion jewellery, reached to US$65.8 billion in calendar 2008. The US jewellery market has grown at a compound annual growth rate of 5.9% over the last 25 years. In calendar 2008, the US jewellery market grew by a provisional 0.4%, significantly below the 25 year average, reflecting the challenging economic environment. There was a marked contrast between total jewellery market growth and the performance of the specialty jewellery sector, which fell by 4.7%. Over the first three quarters of the year the two sectors performed broadly in line. However, provisional figures show the specialty sector under-performed significantly during the fourth quarter. As a result, the specialty sector saw a provisional decline in market share to 44.6% in calendar 2008 from 47.7% in calendar 2007.
Jewellery, watch & clock demand in US (at manufacturer’s level) witnessed an increase from 2003 to 2008 reaching US$16.45 billion. During the same period the retail sales of jewellery, watches & clocks grew by 4.5% per year and reached US$65.8 billion.

In 2001 the demand fell sharply following a strong growth in late 1990’s because of the softening of the US economy but the conditions improved in 2002 and so did the demand of jewellery and related products which continued till 2006. Many factors such as economic recession of 2007, global financial crisis and the credit crunch, collapse of the housing market, rising food and energy cost impacted the jewellery, watch & clock demand which experienced a modest decline in 2007 and sharp decline in 2008. All these factors affected the sale of jewellery, watch & clock negatively since the consumers curbed their spending.
Figure 2.3: Jewelry Watch and Clock Demand in US at Manufacturers Level (1998-2008)
0
5
10
15
20
1998
1999
2000
2001
2002
2003
2004
2005
2006
2007
US$ Billions
Source: A&M mindpower and Industry estimates
Fine Jewellery: Includes jewellery made from precious or semi precious gemstones or from precious metals. The demand for fine jewellery fell from 0.3% per annum from 2003 and reached US$9.8 billion in 2008.
Costume Jewellery & Novelties: includes jewellery made from artificial pearls, gemstones, plastic, base metals and other non precious materials. It also includes accessories such as cigarette cases & compacts. Demand for costume jewellery & associated novelties reached US$1.7 billon a climb of 5.7% per year which was the fastest for any product segment during the period 2003 – 2008.
Industry experts believes that the long term outlook for jewellery sales is encouraging given the expected growth in disposable income and the increasing number of women in the work force.

2.6 Industry Players in United States
The jewellery retail industry is subject to intense competition among industry players to develop and build their brand recognition. Signet’s competitors include large jewellery retailers such as Wal-Mart and J.C. Penney, in addition to international, national and regional jewellery chains. The major competitors of Signet that we have considered in our report are Zale Corporation (Zale), Blue Nile Inc. (Blue Nile) Tiffany & Co. (Tiffany) and Compagnie Financiere Richemont S.A. (Richemont).
It should come as no surprise that Wal-Mart is the largest jeweller in the US market due to its sheer reach. Close on its heels are two specialty jewellers, Sterling and Zale. In fourth place is QVC, an online sales portal.
Table 2.1: Top US Jewellery Retailers
Retailer Name Type Wal Mart Discount Sterling Specialty Jeweller Zale Specialty Jeweller QVC Non Store Tiffany Specialty Jeweller JC Penny Mass Merchant Sears RoebuskFinlay Mass Merchant Helzberg Specialty Jeweller Fred Meyer Specialty Jeweller Jewellery Television Specialty Jeweller Costco Non Store Macy's East Wholesale Club Target Dept Store Neimen Marcus Discount Shop NBC Non Store HSN Non Store Friedman's Specialty Jeweller Ross-Simons Multi Channel Tourneau Specialty Jeweller Cartier Specialty Jeweller Whitehall Specialty Jeweller Source: National Jewellers and IDEX Online

Figure 2.4: US Jewellery Chains Sales Growth in terms of Value
12.20%
1.00%
6.20%
-5.70%-7.10%
12.60%
-10.00%
-5.00%
0.00%
5.00%
10.00%
15.00%
Tiffany Signet Zale
Growth Rate
Q208 Q108
Source: Company reports
Tiffany holds a 5.5% share of the US$28 billion U.S. specialty jewelery market, holding third-place behind Signet and Zale's. However, Walmart, which is the largest seller of jewelery in the U.S.
A difficult macroeconomic environment presents an attractive long-term share opportunity for Tiffany. Over the past two years, the jewellery industry has undergone a significant contraction with four of the eight main jewellery retailers filing for bankruptcy. According to the Jewelers Board of Trade, more than 1,400 jewellery companies discontinued operations during 2008 and 1H09. The jewellery capacity in 2009 has decreased by approximately 5-10%, a clear opportunity for Tiffany to gain market share. A significant amount of this capacity came from local jewellery stores. This is in part driven by the capital intensity of the businesses, and in many cases, meaningful inventory recovery values.
Table 2.2: Consolidations of Jewellery Retailers in US
2007 2008 Projected 2009
No. of stores Open Close Net Open Close Net Open Close Net
Finlay ( Balley Banks & Biddle)-Bankrupt
2,080 44 68 -24 31 105 -74 6 115 -109
Zales 2,080 44 68 -24 31 105 -74 6 115 -109
Signet US 1,401 108 17 91 77 75 2 15 60 -45
Whitehall-Bankrupt 0 1 18 17 0 373 -373
0 0 0
Friedman's - Bankrupt 0 0 0 0 0 377 -377
0 0 0
Tiffany & Co (U.S.) 76 7 1 6 6 0 6 3 0 3

Iridesse-Liquidates 16 0 0 0 0 16 -16 0 0 0
Claire's north America 2,029 2 0 2 9 118 -109
Ultra Stores-Bankrupt 162 0 0 0 0 0 0 12 -12
Fortunoff-Bankrupt 0 0 0 0 0 0 0 0 23 -23
Total 5,764 162 104 92 123 1064 -941
24 210 -186
Note: Data as of April 2009
Source: Costar market estimates
Signet’s US division has an 8.8% market share of the specialty sector in the US and its largest direct competitor is Zale Corporation, which has a specialty market share of 7.4%. Competition is also encountered from a limited number of large regional retail jewellery chains (only six other specialty jewellery retailers have more than US$300 million sales, according to National Jeweler), and independent retail jewellery stores (including smaller regional chains with sales of less than US$300 million) which accounted more than 70% of the specialty market.
Table 2.3: Specialty Jewellery Market Shares (1999, 2001, 2005, 2006)
1999 2001 2005 2006
Signet US 5.2 6.8 8.2 8.8
Zale Corp US 6.5 8.4 7.8 7.4
Chains Ranked 3-7 9.5 10.5 10.1 NA
Other Specialty Jewelers 78.8 74.3 73.9 NA
Source: US Census Bureau

3. Canadian Gems and Jewellery Market
3.1 Market Size
In a global prospect, the United States and Canada stands on top in terms of trading amounted more than US$1.6 billion per day and US$596 billion at the year end of 2008. Jewellery market is also strong in both the regions; Canada imports its jewellery from United States. In 2008, despite the heavy fluctuations of Canadian dollar there was an increase of 11% in 2008 as compared to 2007 in jewellery imports from the United States.
The jewellery industry in Canada has reached to US$1.7 billion in 2008 and domestic export increased from US$524 million in 2007 to US$1,087 million in 2008 from United States to Canada. This growth in 2008, however, was low in 2009 due to the slowdown of economic activity around the world and especially in North America. The jewellery industry, which is mostly compromised of SME’s (Small-and- Medium-Sized enterprises), suffered because of instability in consumer markets and the inability to keep small operations going because of a lack of demand. With a large spike in the price of gold and other precious metals over the summer, consumers cut down their spending and suppliers thus were left with large inventories.
Apart from United States there were other countries like China, India, Israel and Italy acted as major exporters of jewellery and silverware in the Canadian market, led to a strong growth. This shift may have occurred due to exchange rate fluctuations in the Canadian dollar, which in the latter half of 2008 declined against the U.S. dollar. Ultimately, this may have led Canadian importers to seek out new markets in which the Canadian dollar had more clout against the domestic currency.
The strong growth was coming from costume jewellery segment due to inexpensive alternative to fine jewellery. It also follows the changing trend and preferences according to demographic needs. Costume jewellery continues to change with the current season’s trends with materials such as base metals, leather, feathers, glass beads, gems and pearls.
The Canadian diamond market has emerged as a highly sought after global diamond supplier. Existing diamond mines in Russia and Australia are reaching their production limits, while northern regions of Canada are still in the early mining stages. In 2007, Canada was ranked 3rd in the world for diamond output and 3rd in the world for value.

Table 3.1: Jewellery Industry (NAICS 33991) Total Canadian Exports (2006-2008)
2006 2007 2008
United States (US)) 519,902 524,847 1,087,990
Germany 9,050.20 55,943.78 116,315
United Arab Emirates 1,973.92 14,426.57 40,872
Mexico 210.79 21,767 35,338
Japan 4,564.35 3,808.58 31,462
Note: Thousands of US$
Source: Statistics Canada, 18 Aug, 2009
The total jewellery import in Canada reached to US$1.78 billion of which US$601 million came from the United States, US$248 million from China; followed by India with US$212 million.
Table 3.2: Jewellery Industry (NAICS 33991) Canadian Imports
2006 2007 2008
United States 458,318 507,483 568,217
China 176,645 207,694 234,887
India 167,771 181,022 200,612
Israel 98,689 120,143 138,389
Italy (Including Vatican city state)
70,918 81,814 78,767
Total (All Countries) 1,345,027 1,524,389 1,681,138
Note: Figures in Thousands of US$
Source: Statistics Canada, 18 Aug, 2009

4. European Union
4.1 EU Market Size
Representing one fifth of the global market value EU is the second largest market for jewellery after USA. EU consumption in 2008 was US$34.26 billion with an average per capita expenditure of US$69.38 of which US$9.41 was costume jewellery. There are differences observed in the spending of individuals in different parts of EU countries. Italian (US$125.09) or Greek people (US$125.09) spent more on precious jewellery, while in Eastern countries they spent an average of US$15.29 on jewellery every year. In 2008, Eastern EU countries represented 4% of the EU jewellery market value.
Markets like Italy (21.7%), France (17.3%), UK (16.3%) and Germany (13.3%) constitute nearly 70% of the market value. In 2008, approximately 200 million pieces were sold and most of the pieces constituted of costume and silver jewellery specially earrings and neckwear. France, UK, Spain, Germany, Netherlands and Eastern EU countries are the largest markets by volume.
EU jewellery sales increased from US$29.21 to US$29.89 million between 2004 – 2006. Easily affordable (economical) jewellery was being imported from India and China thus Costume jewellery enjoyed substantial growth. Teens and pre-teens preferred (body jewellery, metal, titanium or silver jewellery with beads or crystals), whereas men and women preferred diamonds, pearls and accessible jewellery with coloured gemstones.
Since 2007, due to the global recession and enormous price rise of precious metals jewellery sales have declined considerably. The preference of consumers changed and they stared preferring silver and costume jewellery to precious jewellery like gold, platinum and diamond jewellery. Some preferred cutting down their expenditure on jewellery and started looking for personal pieces that can be used for longer duration. Initially individuals used to see intrinsic value of the jewellery but now individuals started giving importance to other factors such as good design & affordable price. The sale for precious jewellery in EU fell to US$29.64 billion in 2008, while for costume jewellery it rose to US$4.62 billion for the same year.
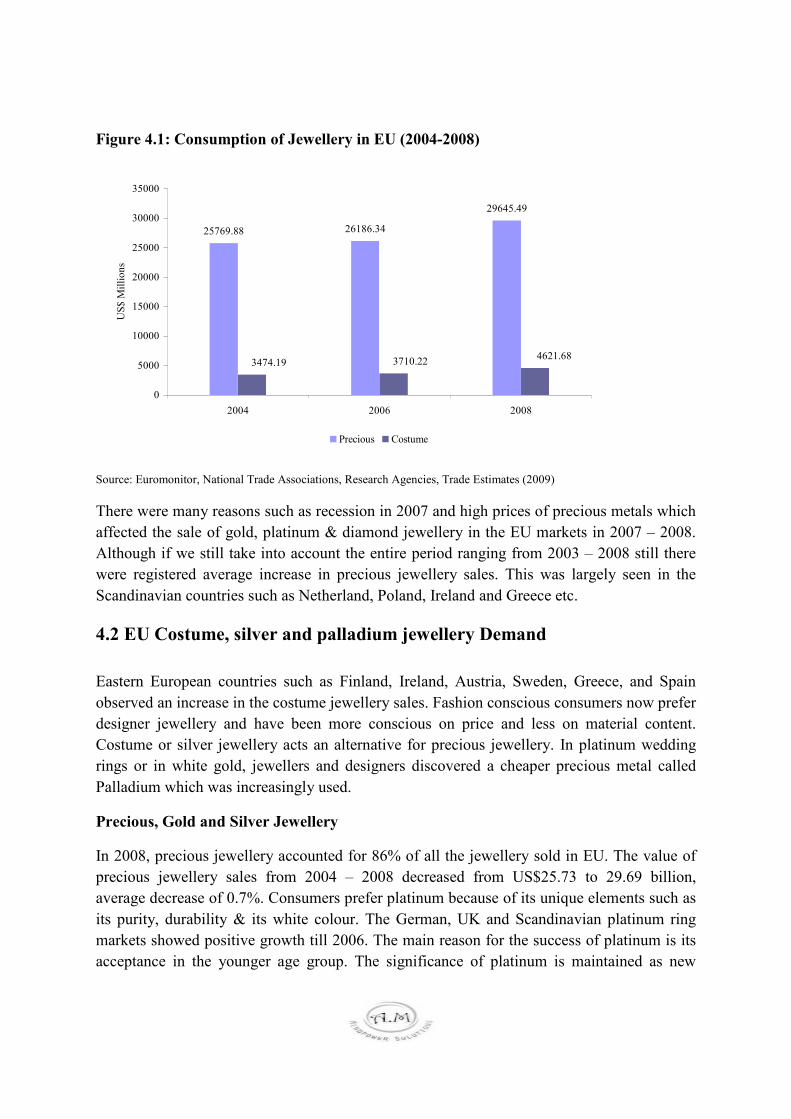
Figure 4.1: Consumption of Jewellery in EU (2004-2008)
25769.88 26186.34
29645.49
3474.19 3710.22 4621.68
0
5000
10000
15000
20000
25000
30000
35000
2004 2006 2008
US$ Millions
Precious Costume
Source: Euromonitor, National Trade Associations, Research Agencies, Trade Estimates (2009)
There were many reasons such as recession in 2007 and high prices of precious metals which affected the sale of gold, platinum & diamond jewellery in the EU markets in 2007 – 2008. Although if we still take into account the entire period ranging from 2003 – 2008 still there were registered average increase in precious jewellery sales. This was largely seen in the Scandinavian countries such as Netherland, Poland, Ireland and Greece etc.
4.2 EU Costume, silver and palladium jewellery Demand
Eastern European countries such as Finland, Ireland, Austria, Sweden, Greece, and Spain observed an increase in the costume jewellery sales. Fashion conscious consumers now prefer designer jewellery and have been more conscious on price and less on material content. Costume or silver jewellery acts an alternative for precious jewellery. In platinum wedding rings or in white gold, jewellers and designers discovered a cheaper precious metal called Palladium which was increasingly used.
Precious, Gold and Silver Jewellery
In 2008, precious jewellery accounted for 86% of all the jewellery sold in EU. The value of precious jewellery sales from 2004 – 2008 decreased from US$25.73 to 29.69 billion, average decrease of 0.7%. Consumers prefer platinum because of its unique elements such as its purity, durability & its white colour. The German, UK and Scandinavian platinum ring markets showed positive growth till 2006. The main reason for the success of platinum is its acceptance in the younger age group. The significance of platinum is maintained as new

designs creating special extraordinary pieces of jewellery are present in the market. However the sale of platinum jewellery has suffered because of the EU recession in 2007 – 2008 and also because of the high prices of platinum. Palladium, a cheaper metal with similar characteristics is increasingly used as an alternative.
63% of the total EU market in 2008 by value comprised of gold jewellery and gold jewellery with gems. In USA 14 carat is more popular while in EU 18, 14 and 9 carat. The demand for gold jewellery mostly comes from Italy, UK, Spain and Greece. In UK 9 carat gold is more common and also in some of the Eastern EU states, where most people now prefer 14 carat.
Gold is much more expensive than silver even though the prices of silver have increased. Silver has benefitted from the high price of gold due to recession. Silver comes second as compared to gold in case of number of pieces sold in Italy, UK, Germany, Spain, Netherlands, Scandinavian countries and in eastern EU countries. The consumption of silver jewellery increased in almost all EU countries in terms of volume also in terms of value EU silver jewellery retail sales were approximately US$6.32 billion in 2008.

4.3 The Jewellery Demand in Romania
In 2008, the Romanian jewellery market in terms of retail sales was valued at US$169.05 million. In 2008, the per capita spending among the Romanian people at US$7.94 was the lowest in EU with an average of US$69.38. It was also the lowest among the Eastern EU Member States. In 2008, precious jewellery sales accounted for more than 80% of the total jewellery sales. These sales were confined to a very small group of affluent people. Cheap costume jewellery sales accounts for the vast majority of the sales. Romania is one of the smaller jewellery markets in EU, despite its large geographical size and population. In terms of jewellery market size Romania comes below Czech Republic but it is above Cyprus and Luxembourg.
Figure 4.2: Romania Jewelry Consumption (2004-2008)
108.14 114.54 124.34
147.96169.05
020406080100120140160180
2004 2005 2006 2007 2008
US$ Millions
Source: Hong Kong Trade Centre, Romania Business Review
The most popular one among the gold jewellery is 14 carat. The import duty till 2007 was very high leading up to 50% of the selling price, excluding the wedding rings. When Romania aligned its import tariffs with EU, tariff reductions on wide range of consumer goods were offered especially for Gold Jewellery. Industry experts believe in 2007, around 75% of the precious jewellery market comprised of black market.
Figure 4.3: Romania Jewelry Consumption by Segments (2004-2008)
87.01 92.13 100.48119.19
135.24
21.131 22.41 23.864 28.77 33.81
0
50
100
150
2004 2005 2006 2007 2008
US$ Millions
Precious Costume

Source: Hong Kong Trade Centre, Romania Business Review
Among the Romanians, costume and silver jewellery (with semi precious stones such as opals, turquoise, topaz or imitations of amethyst & rubies) was very famous with the bohemian style of 1960 and 1970. Also in 2007, costume jewellery of leather, shells, wood, glass beads, crystals or rhinestones was very popular. Street markets are still a very important place where a lot of jewellery is purchased. The Romanian market is under an influence of change where choices of individuals are undergoing transformation. Affluent people and Young women have developed a liking for modern shopping which has made jewellery prices from international retail outlets more expensive.
In the coming years the jewellery market is expected to grow, but price inflation and higher import prices will slow down the demand. Many Romanians are aware of about the international trends but they cannot afford to follow them
As the Romanian economy would integrate with EU, it is expected that the jewellery consumption would increase in the coming years. Middle class in Romania is growing; also the disposable incomes are rising which would lead to individuals demanding jewellery of a good design. Diamond jewellery is more popular in the higher price segment. Many of the foreign brands such as Cartier, Louis Vuitton and Secret Garden have opened their retail outlets in Romania. In 2008, Romania had around 358 small to medium sized companies, which generated a turnover of US$27.93 million employing around 2,857 people. The demand for costume jewellery production has increased by 7.5% and for precious jewellery by 5.7% since 2004. Along with this the demand in the domestic market has also increased and more outsourced production for Italian manufacturers.
Figure 4.4: Jewelry Production in Romania (2004-2008)
14.91617.584
22.05
5.883.7683.729
0
5
10
15
20
25
2004 2006 2008
US$ Millions
Precious Costume
Source: Trade Estimates (2009)

4.4 The Jewellery Market in Bulgaria
In terms of retail sales the jewellery market in Bulgaria was valued at US$74.97 million in 2008. The country has the smallest jewellery market in EU being below Slovakia, but above Slovenia and Malta. Compared to an average of US$69.38 spent as per capita in 2008, Bulgarians spent US$9.7 per capita, which was the lowest in EU.
Figure 4.5: Bulgaria, Jewelry Consumption by Value (2004-2008)
45.99151.045
55.264
65.76
74.97
0
10
20
30
40
50
60
70
80
2004 2005 2006 2007 2008
US$ Millions
Source: Bia-Bg, Trade Estimates (2009)
The consumers spending on jewellery has received a boost after Bulgaria had joined the EU which bought an increase foreign investment and privatisation. Import duty which was as high as 50% of the selling price was charged on the precious jewellery. A large tariff reduction was offered on wide range of consumer goods specially jewellery when Bulgaria aligned with EU.
The Bulgarian industry is small and fragmented. By value the majority is of precious jewellery i.e. jewellery articles of precious metals (gold and silver) with or without stones. In 2007 by volume 21,770 pieces of costume jewellery i.e. imitation jewellery of other material was produced in 2007. The domestic demand for jewellery is not met by the Bulgarian manufacturers that increasingly become more diverse.

Figure 4.6: Bulgaria Jewelry Production by Value (2004-2008)
9.2011.30
16.17
024681012141618
2004 2006 2008
US$ Millions
Source: Bulgarian Industrial Association
The jewellery made in Bulgaria is dominated by the small manufacturers. Some of these small manufacturers are mixed retailers selling a variety of accessories or some specialise in precious or costume jewellery. With the advent of large international operators entering the market this has started to change.
From an exporter’s point of view exporting from a developing country, it would be beneficial to identify the importers or wholesalers which specialise in precious or in costume jewellery, many of which would be having their own retail outlets. In the jewellery sector one would not find many sale agents operating in Bulgaria.
4.5 The Jewellery Market in Germany
In terms of retail sales, in 2008 the jewellery market in Germany is worth US$4,561 million which is equivalent to 26 million pieces. Germany has the fourth largest EU market for jewellery. Germany comes between UK and Spain in terms of value; however figures for precious jewellery are more than twice as much as those of Spain.
Between 2004–2008, German jewellery sale decreased by an average annual rate of -0.9%, a figure below the EU average increase of -0.3%. The consumer regained confidence in 2007 & the precious jewellery sales increased, which experienced a fall in 2006. However in 2008, the market for jewellery suffered from economic recession, higher metal prices, increased VAT rate and a fall in the number of marriages.
The demand for jewellery weakened as many people regarded it as a non essential item in difficult economic times.

Figure 4.7: Jewelry Consumption by Segments in Value (2004-2008)
3706.63 3839.58 3644.913996.29 4163.04
277.19 297.56 301.44 380.86 398.37
0
1000
2000
3000
4000
5000
2004 2005 2006 2007 2008
US$ Millions
Precious Costume
Source: BVJ - BV Schmuck + Uhren, BBE Retail Experts, Euromonitor (2009)
From 2004 – 2008, there was a decline in the precious jewellery sales from 93% to 91% from the total jewellery, showing a higher interest in costume jewellery. Precious jewellery sales were driven by gold jewellery with diamonds, coloured stones & pearls.
Figure 4.8: German Jewellery Consumption by Product in %, 2008
66%12%
10% 12%
Gold, Platinum etc. Silver Costume Others
Source: BVJ - BV Schmuck + Uhren, BBE Retail Experts (2009)
According to BVJ (German Jewellery & Watches Association) because of economic recession the jewellery market is expected to decrease in value by -1% in 2009. An average annual growth rate of 1% for silver jewellery is expected until 2013.
In comparison to the other leading EU markets, the German market is less concentrated. From the exporter’s point, exporting from developing countries there are wide range of distribution channels, along with some strong and dominant retail groups. The specialised retail traders carry out the distribution of jewellery in Germany accounting for three quarters of the German market in 2008.

5. Recent Industry Trends and Opportunities
5.1 UK Gems and Jewellery Demand
The UK market includes specialty retail jewelers and non-specialty jewellery retailers, such as mail order catalogs, catalog showrooms, department stores, supermarkets and internet based retailers. The retail jewellery market is very fragmented and competitive, with a substantial number of independent specialty jewellery retailers. There are approximately 7,500 specialty retail jewellery stores in the UK, which is a similar figure to the previous year.
The UK jewellery market is vast and accounts for a big share of the global gems and jewellery market, grew at a compound rate of 5.3% per annum from 1997 to 2004. In 2005 it showed a variable trend and posed a decline of 2.2%; further grew by 14.0% and 4.2% in 2006, 2007. Per capita spend on jewellery in the UK remains at approximately half of the level of the US.
The growth of the UK jewellery market can also be estimated from the volume of hallmarking of jewellery items containing gold carried out by the Assay Offices in the UK. Hallmarking volumes grew at a compound rate of 2.2% from 1997 to 2004. In the last four years the volume has been variable and declined by 17.7% in 2005, by 14.2% in 2006, by 4.8% in 2007 and by 34.2% in 2008.
5.2 Symbolic Jewellery has Targeted Spiritual Group
These days use of jewellery is not only limited to marriages or fashion, it has reached to a different group of people believes in spiritualism. A large group of population is trying to find solution to their problems through astrology, as the economic uncertainty has added another fear into their minds. This deeper meaning could be eastern religions, astrology, tribalism or foreign cultures with each having its symbolic jewellery. This is reflected in the ongoing significance of body piercing and in the strong impact of different ethic African and Asian designs in recent jewellery fashion. Stones, symbols or charms that dangle on a chain or on a pendant are typically used in symbolic jewellery. Next to typical local patterns, crosses, stars, flowers, moon and other celestial motifs are frequent in jewellery designs.
The demand for symbolic jewellery is strongly coming from Asian countries and few European regions. In India, tourists are also participating in the growing demand of Symbolic jewellery market.

5.3 Declining Sales of Luxury Jewellery Retailers with Rising Raw Material Prices
In the second quarter of 2009, the Luxury jewellery retailers continued to struggle with negative performance of Luxury Jewely market demand. This business remains under pressure and rough diamond prices are beginning to rise. Raw material prices are continue to rise which has affected overall demand of jewellery, though the higher income group population trying to maintain a balance.
Figure 5.1: Luxury Jewelry Retailers Sales Trend (4Q08, 1Q09 and 2Q09)
-21%
-30%
-40%
-27%
-7%
-22%
-13%-15% -18%
-3% -14%
-20%
-22%
-16%
-45%-40%-35%-30%-25%-20%-15%-10%-5%0%
4Q08 1Q09 2Q09
y/y Growth in Sales
HW Retail LVMH-Watches & Jewelry Bulgari-Jewelry Richemont-Jewelry TIF
Note: Richemont reporting includes 2H09 and 1H10
Source: Company reports
Raw material price grew in recent months, which will place some pressure on 2011 gross margin. The jewellery, platinum and karat gold unadjusted PPI gained momentum in October, increasing 6.1% year-over-year, up from the September increase of 4.6% year-over-year, +2.3% year-over-years in August 2009 and -0.5% year-over-year in July 2009. The increase was primarily driven by a 4.6% year-over-year increase in gold prices in October. The jewellery PPI has decelerated from the high single-digit and low double-digit increases seen in 1H08. Despite the moderate growth, the October jewellery, platinum and karat gold unadjusted PPI of 173.9 is 11.1% above October 2007. Recent increases in precious metal prices drove up the PPI.

Figure 5.2: Jewellery PPI Trends (Jan08-Oct09)
11%
9%
12%
10%
8% 8%
10%
7%
5% 5%
3% 3%
1%2%
0%1%
2% 2%
-1%
2%
5%6%
-2%
0%
2%
4%
6%
8%
10%
12%
14%
Note: Jewelry, Platinum and Karat gold unadjusted PPI
Source: Bureau of Labor Statistics and KeyBanc Capital Markets Inc.
Gold is not only used in consumer products, it is also used to hedge against the dollar and inflation. Since January 2008, gold prices have continued to trend higher and are up approximately 39% from December 2007. Industry experts believe a modest gross margin expansion in late 2009 from the January 2009 pullback in gold prices.
Figure 5.3: Gold Prices
01002003004005006007008009001000
Jan-07
Feb-07
Mar-07
Apr-07
May-07
Jun-07
Jul-07
Aug-07
Sep-07
Oct-07
Nov-07
Dec-07
Jan-08
Feb-08
Mar-08
Apr-08
May-08
Jun-08
Jul-08
Aug-08
Sep-08
Oct-08
Nov-08
Dec-08
Jan-09
Feb-09
Mar-09
Apr-09
May-09
Jun-09
Jul-09
Gold $/Ounces
Source: Thomson & KeyBanc Capital Markets Inc.

5.4 Opportunities in Saudi Arabia Jewellery Market
Saudi Arabia is a strong market for Jewellery with added influence of culture. Historically, jewellery has played a very significant role in the local Saudi culture, as they take it as a benchmark of determining a person’s status and wealth. Today, jewellery maintains both its appeal in the form of gifts, and its reputation as an important commodity. Saudi Arabia ranks number three in terms of global demand for gold, trailing only the United States and India.
Saudi Arabia's total market for gold has ranked third in the world after the USA and India. In recent years, a strong demand has been seen for gold in the Saudi market, with over Saudi Riyals 13 billion (equivalent to US$3.5 billion) being spent on the yellow metal in the last two weeks of November 2008. This trend is reflecting opportunities in this sector as demand expected to rise higher as more investors turn to gold as a safe haven in the midst of the global financial crisis.
Since soaring to an all-time high of US$1,033.39 per ounce in March 2008, gold has plummeted 15.97%. Many Saudi investors see this as the right time for making investments in gold as its price is more reasonable. Saudi Arabia’s retail jewellery sector is looking up, and demand for jewellery has been increasing. Demand for gold reached a record high in the third quarter of 2008 as investors sought refuge from the financial crisis and volatile stock markets, according to the World Gold Council (WGC).The WGC said demand for gold reached an all-time quarterly record of US$32 billion between July 2008 and September 2008 as investors around the world sought refuge from the global financial meltdown. This was 45% higher than the previous record in the second quarter of 2008.
The gold and jewellery markets in Saudi Arabia, as well as the Arabian Gulf countries are considered to be some of the most rapidly growing markets in the world due to the huge purchasing power and unprecedented volume of trade in gold and jewellery in the region, and particularly in the Kingdom of Saudi Arabia. Out of a total US$7.2 billion of annual trade in gold and other jewellery, 80% are imports, and 20% made locally, making the Saudi market one of the hottest locations for such an industry.
With government decision to reduce the customs tariff on the imports of gold and jewellery from 12% to 15%, there was a rise in the volume of trade in gold and jewellery in Saudi Arabia.

5.5 Bright Prospects in Indian Jewellery Market
Indian Gems and Jewellery is highly fragmented with only 4% accounting for organised sector (2005). Family businesses dominate with 96% share. There are 15,000 players in the jewellery processing industry and 6,000 players in the diamond processing industry.
Indian market is a mix of different cultures where sometimes jewellery plays an important role such as marriages and siding population supports the industry further. Over a period of six years (2000-2006) Indian gems and jewellery market registered a CAGR of 10.3% and reached to US$13.5 billion turnover in 2006. Overall it is counted on World’s fastest growing market in terms of jewellery consumption.
Gold jewellery forms around 83% of the Indian jewellery market. Since 2003, demand for gold in India has grown at a CAGR of 12.4%. As per the World Gold Council’s FY07 report, India consumed 800 tonnes of gold in 2007, accounting for 22% of global gold consumption. Three quarters (600 tonnes) of this was used in manufacturing jewellery.
Also, India is the world's leading diamond cutting and polishing centre, accounting for 57% share of the global polished diamond market in terms of value, 80% share in terms of caratage and 90% share in terms of pieces.
Figure 5.4: Retail Sales of Jewelry in India (2000-2006, 2010E and 2015E)
7.42 7.24 6.6 7.38.9
11.7513.6
18.1
27.5
0
5
10
15
20
25
30
2000 2001 2002 2003 2004 2005 2006 2010E 2015E
Sales in US$ Billions
Source: A&M Mindpower and industry estimates
The growth in Indian jewellery market has been driven by many factors directly or indirectly of which changing life style, E-retailing, rising number of population between 23-45 years age group and purchasing power of middle income and high income groups contributed the most.

In 2010, retail sales for jewellery is expected to reach US$18.3 billion alone in India and further expected to reach US$28.3 billion by 2015. Despite the economic slowdown, this sector is expected to continue to shine in coming years. Rising raw material prices slowed the growth leaving loss in revenue in their revenue but future of this sector is secure.
5.6 Impact of Economic Recession over Diamond supply/demand
Almost all industry participants believe that there is a looming shortfall of diamond supply against demand. This is apparent because the number of kimberlites discovered has fallen behind the number required for the discovery of economically viable deposits in order to cover the ongoing depletion of reserves. Over time it has been estimated that increasing diamond supply may only amount to about 1%/year whereas diamond demand looks set to increase at 2%/year. It is this squeeze that is expected to push prices higher.
In more recent months the diamond market has been subject to extreme influence from the credit crunch which has put strain on the banking relationships in the diamond cutting centres. In particular, the diamantaires often finance their working stocks through short-term debt and this area of finance has all but dried up. As a consequence, the diamantaires were forced to liquidate their stocks and this generated a short-term oversupply of material into the market.
In order to bring the supply/demand situation back into balance De Beers and Debswana as the world’s largest producers on a combined basis closed a large proportion of their production capacity at the start of 2009. This has recently started to have some positive effect on diamond prices and Debswana has also recently started to remobilise its operations. Alrosa also aided the situation by producing but not selling diamonds. Interestingly, while the retail market remains weak, it is clear that some jewellers are attempting to hold price points, which bodes well for the future of the market. Indeed, with an improving economic backdrop and easing of liquidity in the cutting centres we anticipate that 2010 and beyond will see the recovery in diamond prices continue.

6. Driving Forces in Gems and Jewellery Sector
6.1 Increasing Urban Population with Contribution of Working Women
Over the past 30 years, the urban population has increased at a rate that by the end of 2008, more than half of the world population is living in cities. The reason for the increase in urbanization, especially in emerging economies of Asia and Africa is due to the geographical, cultural and economic factors. Urban areas provide better access to education and health facilities, wider employment opportunities and higher incomes.
Figure 6.1: Global Urban Population by Geography (%): (2004-2008)
0
10
20
30
40
50
60
70
80
90
NorthAmerica
Europe Oceania Asia LatinAmerica/Caribbean
Africa World
Population (%)
2004 2006 2008
Source: United Nations Population Division
As seen in the above graph, over the past four years, urbanization has increased in the countries of Asia (including the Middle East), Latin America/ Caribbean and Africa. Despite, larger market share being held by the US and Europe, these above mentioned regions are the future growing markets for the Gems and Jewelry industry.
The size of the female population also has an effect on the market because women are the leading consumers of jewellery and possess almost 90 percent of all jewellery purchased in a given year (including self-purchased and gifted jewellery). Furthermore, the number of marriages that occur annually is also a good indicator of jewellery demand, as engagement rings, wedding bands and other bridal jewellery account for a large portion of the fine jewellery market. Also, the 25- to 54-year old demographic are top spenders on jewellery and watches.

These socioeconomic trends, however, are most visible in urban areas, where most women work in companies and therefore their time schedule is busier. Increasing urbanization and the resultant increase in income have allowed consumers to buy better quality and more sophisticated food products, and nowhere has this been more in evidence than in the baby food market.
There have been considerable improvements in recent years in female labor market, with many women progressing from precarious jobs to wage and salaried employment. Induced by greater urbanization and access to education, these women now have greater employment potential, income-earning capacity and decision-making authority within the household. In 2006, 46% of the world’s working women were in wage and salaried employment compared with 41.1% ten years earlier. New opportunities have arisen, especially in tradable sectors and in home-based businesses linked to global production networks.
Figure 6.2: Contribution of Women to Employment Growth: 1991 - 2007 (%)
62
52.5
41
39
35
31
27
0 10 20 30 40 50 60 70
Advanced Economies
Latin America & the Caribbean
Sub- Saharan Africa
Central & Eastern Europe and Former Soviet Republics
Asia Pacific
Middle East
North Africa
Source: IILS estimates; ILO, 2008a.
Since, there are more working women today than a generation ago, a preference for platinum jewelry has been on the rise. Consequently, they have more money to spend on their luxuries. Apart from income, working women are more socialized and this leads to fashion jewelry demand.

6.2 Men’s jewellery Demand
In the past few years men’s jewellery has taken a safer place in the industry, especially among younger men in Spain, Italy, France, UK, Greece, Germany, the Netherlands, Belgium, Scandinavian countries and in some Eastern EU markets. Men’s have become more conscious for their looks and dressing and the trend of perfectionism supported the jewellery demand in this group of population. The modern man wants to create his own look, just as women have done for ages. Young men were influenced by the popular surfing, beach and urban fashion trends or by celebrities.
Popular items among men are silver, gold or beaded neck chains, pendants, bracelets, rings, earrings and belt buckles. Alongside stainless steel, silver is the material most being preferred by men. The shapes are usually clear and silver is often contrasted with black or with red gold.
In 2007/2008, black was a favoured colour in men’s jewellery collections being apparent in jewellery pieces with black enamel, leather, carbon fibre and black diamonds. Other hot items were tag pendants, rubber bracelets, chunky crosses and bold rectangular link chains of stainless steel or silver. Urban chic style jewellery featured neckwear and wrist wear with beads, diamonds and black and white enamel.
6.3 Jewellery a Symbol of Changing Lifestyle among working women
Now days with growing education rate and rising awareness female segment of the population has become independent, not only in developed countries but this trend has been seen in developing countries too. Women’s are no longer dependent upon their partners for their needs and they can easily manage their expenses according to the changing trend.
Working women are the most important segment for jewellery and represented around 65% of EU jewellery value sales in 2008. As a result of more foreign investments in Eastern EU states, the number of working women has grown steadily there. Despite the economic recession, the ratio of working women in the EU27 countries still rose from 55.5% to 59.1% of all EU women, between 2004 and 2008. Increases were observed in all EU countries, particularly in Bulgaria, Germany, Spain, the Netherlands, Austria, Poland and the Baltic States.
The Scandinavian countries and the Netherlands have high ratios of (part time) working women, while Malta, Italy and Greece had the lowest ratios. Women aged between 25 and 54 years were strongly represented, but the biggest growth was observed in the older age group (55 – 64 years), particularly in Austria, Germany, Slovakia, Finland, Spain, Italy and Ireland.

Older working women have become fashion aware over a longer period of time. The more working women means higher levels of disposable income and the growing importance of women’s appearance at work and in their social life. There is a clear trend in most countries among younger working women to reward themselves for working hard. They buy something extra that can be a well-designed jewellery piece adding an extra touch of elegance and personality to their outfit. The more classic icons of femininity (flowers, butterflies, charms, high heels, romantic inspiration) are played with by women of all ages. Especially in the UK, France and southern EU countries, women tend to express their ‘girl power’ more than before, but without losing touch with the soft and sensual.
This way working women contributes in the growth of the sector, pushing the demand for designer and elegant jewellery and developing regions like China and India.
6.4 Rising consumer spending and Personal Income
Globalization has redefined the forces that drive inflation, interest rates, wages, profits, employment, currencies, and economic growth. Since 2003, there has been a spurt of global growth, with decrease in unemployment rates and increase in real wages across the emerging economies. Low- and middle-income economies share of global output also increased from 34% to 41%, growing faster on average than high income economies. Few large countries such as China, India, and Russia are driving these averages. Prudent fiscal and monetary policies of the governments, decreased interest rates, increased investments and outsourcing services have all aided the growth in consumer income from 2001 to 2007.
Figure 6.3: World Gross National Income per capita (PPP): (2001 - 2007)
0
10,000
20,000
30,000
40,000
2001 2003 2007
Per C
apita Income (US$)
Low income Middle income Lower middle incomeUpper middle income Low & middle income East Asia & PacificEurope & Central Asia Latin America & Caribbean Middle East & North AfricaSouth Asia Sub-Saharan Africa High income
Source: The World Bank
Note: PPP: Purchasing Power Parity

The strong economic growth of the past few years propelled income level across the world, allowing consumers to spend more on food and have greater discretion in spending. In general, with rising income, consumers devote less time and effort to food preparation and reallocate spending away from raw food products to foods that are easy to prepare, require little preparation, and are convenient to eat. This particular behaviour also enabled the consumers to spend increasingly on baby food products.
In addition to rising income, demand for luxury jewelry in developing countries of Eastern Europe, Asia, Middle East and Africa also helped drive the growth of the industry in the above mentioned regions.
Total US consumer spending, an indicator for jewellery sales, fell a slight 0.5 percent, primarily from nondurable goods expenditures, in August 2009 compared to the same month in 2008.
US personal income, which drives how much consumers might spend on jewellery, fell 2.6 percent in August 2009 compared to the same month in 2008.

7. Gems and Jewellery Market Forecast
In recent years economic recession left an impact over the shining jewellery market with rising unemployment rate. In European Union, future prospects are uncertain for jewellery market as in most of the countries consumers are cutting down expenditures on jewellery. Also there are chances for second hand jewellery to pick a share in the market. Consumer confidence might return in 2010, but market growth will still be weak. Much will also depend on the price development of gold and platinum.
Since jewellery is an essential part of an outfit in most EU countries, further increases are expected for accessible silver and costume jewellery. A grading up to a higher quality of accessible jewellery is expected, which will be in terms of designs focussed on style in large EU market and Scandinavian markets. Also computer aided designs will continue to grab the attention of people follow fashion statements with raising demand for precious metal and coloured stones.
Figure 7.1: Global Jewelry Sales Forecast (2008-2009, 2010 & 2015)
178 180.2 185
225
0
50
100
150
200
250
2008 2009E 2010E 2015E
US$ Billions
Source: A&M Mindpower and Industry estimates

In 2008 and 2009, the U.S. jewellery retail industry has gone through a radical restructuring, as at least 5-10% of the industry has declared bankruptcy and/or closed but 2010 will bring some positive changes in the market demand with an upward shift in disposable income. US personal consumption expenditures for jewellery and watches are forecast to grow at an annual compounded rate of 4 percent between 2009 and 2014.
Figure 7.2: US Consumer Spending Growth on Jewelry (2009-2014E)
6%
1%
3%
4%
5% 5%
0%
1%
2%
3%
4%
5%
6%
7%
2009 2010E 2011E 2012E 2013E 2014E
Source: US Census bureau
Jewellery, Watches and clocks demand is expected to build again from jolt in 2008 to increase of 2.7% y/y reaching US$17.8 billion in 2013. The impact of economic downturn can be seen over the next few years with turning consumer’s interest to choose less expensive jewellery pieces. It is expected that by 2013 the US economy will be able to recover completely and after that once again demand for expensive jewellery rise up. In addition, gains will be fueled by consumers’ desire to accessorize their outfits with coordinating jewellery or a stylish watch.
Figure 7.3: Jewelry Demand Forecasted at Manufacturers Level (2008 & 2013E)
15.516
16.517
17.518
18.5
2008
2013E
US$ Millions
Source: A&M Mindpower estimates

8. Industry Players Profiling
8.1 Tiffany & Co.
8.1.1 Business Map Tiffany & Co. is one of the leading players in the international jewellery and accessory market with broad range of products offering like jewellery, crystal, china and flatware. It came into existence in 1837 and completed its IPO in 1987. The Company currently operates 88 stores in the Americas (76 in the United States), 99 stores in Asia-Pacific and 24 stores in Europe. Tiffany primarily caters to upper income consumers, but offers a range of products that capture a more diverse customer base.
The Company’s reportable segments are as follows:
Ø Americas includes sales in TIFFANY & CO. stores in the United States, Canada and Latin/South America.
Ø Asia-Pacific includes sales in TIFFANY & CO. stores in that region, as well as sales of TIFFANY & CO. products in certain markets through business-to-business, Internet and wholesale operations.
Ø Europe includes sales in TIFFANY & CO. stores in that region, as well as sales of TIFFANY & CO. products in certain markets through business-to-business, Internet and wholesale operations.
Ø Other consists of all non-reportable segments. Other consists primarily of wholesale sales of diamonds obtained through bulk purchases. In addition, other includes worldwide sales made by businesses operated under trademarks or trade names other than TIFFANY & CO., such as IRIDESSE, as well as earnings received from third-party licensing agreements.
Industry Codes
ANZSIC 2006 Codes:
4253 Watch and Jewellery Retailing
2299 Other Fabricated Metal Product Manufacturing Not Elsewhere Classified
4259 Other Personal Accessory Retailing
3732 Jewellery and Watch Wholesaling
2591 Jewellery and Silverware Manufacturing

NACE 2002 Codes:
5147 Wholesale of other household goods
5243 Retail sale of footwear and leather goods
3622 Manufacture of jewellery and related articles not elsewhere classified
2861 Manufacture of cutlery
5248 Other retail sale in specialised stores
NAICS 2002 Codes:
339911 Jewellery (except Costume) Manufacturing
423940 Jewellery, Watch, Precious Stone, and Precious Metal Merchant Wholesalers
332211 Cutlery and Flatware (except Precious) Manufacturing
448320 Luggage and Leather Goods Stores
44831 Jewellery Stores
8.1.2 Company Financials For the year ended Jan 31, 09, company’s net sales decreased 3% to US$2.86 billion affected by the global economic downturn, especially during the fourth quarter. Gross margin (gross profit as a percentage of net sales) improved 1.1 percentage points in 2008 and declined 1.1 percentage points in 2007. SG&A expenses decreased US$32.39 million, or 3%, in 2008 and increased US$194.24 million, or 19%, in 2007.
Total sales in the Americas decreased US$173.23 million, or 10%, in 2008 due to a decline in the number of units sold as compared to increase of 12% reaching US$183 million in 2007. This decrease included a 16%, or US$220.99 million, decline in U.S. comparable store sales, partly offset by US$58.06 million of sales in U.S. non-comparable stores.
Total sales in Asia-Pacific increased by 8% represented US$68.22 million in 2008 due to an increase in the average sales amount per unit as compared to 14% growth or US$105.75 million in 2007. This increase included comparable store sales growth of 4%, or US$28.48 million, and non-comparable store sales of US$33.17 million.
Total sales in Europe increased US$41.05 million, or 17%, in 2008 due to an increase in the number of units sold. This increase included non-comparable store sales of US$34.91 million. In 2007, total sales in Europe increased US$58.181 million, or 31%, due to an increase in the number of units sold.

Other sales declined US$14.82 million, or 18%, in 2008 and increased US$31.97 million, or 64%, in 2007. The decrease in sales in 2008 was attributed to lower wholesale sales of diamonds that were deemed not suitable for the Company’s needs, while the converse occurred in 2007. Wholesale diamond sales were US$54.08 million in 2008, US$70.41 million in 2007 and US$39.85 million in 2006.
Table 8.1: Tiffany & Co. Revenue by Geography in US$ millions (2005-2009)
Jan-09 Jan-08 Jan-07 Jan-06 Jan-05
United States 1,586.65 1,759.90 1,560.96 1,427.76 1,311.30
Asia/Pacific 922.03 853.83 748.03
Europe 284.61 243.68 185.47
Other Areas 66.72 81.62 508.52 394.22 401.4
Japan 498.52 491.32 490.82 492.1
Consolidated Total 2,860.01 2,938.81 2,560.71 2,312.81 2,204.81
Note: Figures in US$ Millions
Source: Company Reports
8.1.2 Business Strategies
Changing Store Prototype with Tightening Assortment and Reducing Inventory Level
Tiffany has shrunk its store prototype, which is driving higher returns and arguably a higher unit growth opportunity. Over the past few years, Tiffany has shifted toward a smaller store base. Prior to 1993, the Company utilized approximately 45% of the total floor space for retail selling. Stores opened between 1993 and 2001 utilized approximately 60-70% of the total floor space for retail selling and ranged from 4,000-7,000 gross sq. ft. Since 2001, new stores are approximately 5,000 sq. ft. and about 60-70% of the total floor space is devoted to retail selling. By decreasing the square footage devoted to inventory space and adjusting the per store merchandise assortment, Tiffany was able to decrease the total size of its stores. In the United States, new stores typically range from 4,000-8,000 sq. ft. Stores opened since 2001 range from 5,000-6,000 gross sq. ft., displaying jewellery, timepieces and a limited selection of china and crystal. The average U.S. store is approximately 42% smaller than the average store size in 1993.
Tiffany tightened assortment and reduced inventory levels. Tiffany stores primarily carry jewellery and timepieces, while a select number of stores carry china and crystal giftware items. The Company reduced the number of stores carrying china and crystal giftware and, in the stores carrying this product, limited the product assortment. The reduction in china and

crystal giftware products reduced the necessary amount of inventory needed, which enabled a smaller store size.
Figure 8.1: Average Store Sizes (1994-2008)
0
2,000
4,000
6,000
8,000
10,000
12,000
Gross Square Feet
Source: Company reports
Advertising A Way to Differentiate Tiffany’s Products
Tiffany competes based on product differentiation, focusing on quality and style, and therefore devotes a substantial portion of its advertising to preserving its high quality brand image and assuring brand recognition. Tiffany takes both a long and short-term view on advertisements, using advertising dollars to preserve its brand image as a luxury jeweler and to drive product demand. The worldwide advertising costs include dollars spent on media, production, catalogs, promotional events and other related items.
Tiffany uses its brand reputation as a main competitive factor, it also uses a portion of the advertising spend on public relations promotional activity through charity sponsorships, grants and merchandise donations. The Company also now advertises opening price points as part of its print advertising campaign, demonstrating that the brand has wide price reach.

8.2 Signet Group Ltd.
8.2.1 Business Map Signet is a retailer of jewellery, watches, gifts and fashion accessories, operating jewellery shops in the UK and the US. The company is registered and headquartered in England, with its primary listing on the London Stock Exchange. The company derives a substantial quantum of its revenues from the US market and is the largest in the US specialty jewellery sector. As part of its revenue expansion plans, Signet plans to aggressively increase the number of stores in the US.
Signet’s US division is the largest specialty retail jeweler in the US with approximately 8.8% share of the specialty jewellery market. It also became the largest specialty retail jeweler in North America during FY 2007.
Diamond jewellery contributes to a substantial portion of Signet’s revenues in the US, while gold and silver jewellery were the major revenue contributors in the UK. In FY 2007, sales of diamonds, gold and silver jewellery was primarily to cater to the bridal category, which accounted for approximately 45% of the merchandise sold during that year, and its participation in the sales mix has been growing over the years.
Industry Codes
ANZSIC 2006 Codes: 6240 - Financial Asset Investing NACE 2002 Codes: 7415 - Management activities of holding companies NAICS 2002 Codes: 551112 - Offices of Other Holding Companies US SIC 1987: 671 - Holding Offices UK SIC 2003: 7415 - Management activities of holding companies

Company Financials In fiscal 2009, total Group sales decreased to US$3,344.3 compared to US$3,665.3 million in 2008. In 2009 sales was down by 8.8% on a reported basis and 5.7% at constant exchange rates. This reflected lower sales in both the US and UK divisions. In fiscal 2009, gross margin was US$1,080.1 million (fiscal 2008: US$1,250.7 million), down by 13.6%. This reflected deleverage of the expense base. Selling, general and administrative expenses were US$969.2 million (fiscal 2008: US$1,000.8 million), down by 3.2%. This decrease reflected expense savings and the impact of the change in the pound sterling to US dollar exchange rate on selling, general and administrative expenses in the UK division and Group function.
US Division
In a very challenging retail environment, US same store sales were down 9.7% and total sales were US$2,536.1 million from US$2,705 million in 2008. Sales performance was primarily driven by the difficult economic conditions with same store sales falling by 6.0% in the first three quarters. Following the sharp deterioration in consumer sentiment in mid September, and a further decline in early December, same store sales in the fourth quarter were 16.1% lower than the comparable quarter in fiscal 2008.
UK Division
In fiscal 2009, same store sales decreased by 3.3% (H.Samuel down by 2.6% and Ernest Jones down by 4.0%). Total sales decreased by 3.8% at constant exchange rates and were US$808.2 million as reported (fiscal 2008: US$959.6 million). In the first nine months of fiscal 2009, same store sales increased by 0.8% (H.Samuel up by 1.1% and Ernest Jones up by 0.5%).
Figure 8.2: Signet Group Revenue by Segments (2007-2009)
2,652.10 2,705.702,536.10
907.1 959.6 808.2
0.00
500.00
1,000.00
1,500.00
2,000.00
2,500.00
3,000.00
2007 2008 2009
US$ Millions
US Trading UK Trading
Source: Company reports

8.3 Zale Corporation
8.3.1 Business Map Zale Corporation came into existence in 1924; it is a specialty retailer of fine jewellery that operates a number of different chains, such as Zales Jewelers, Zales Fine Jewellery Outlet, Gordon's Jewelers, Bailey Banks & Biddle Fine Jewelers, Peoples Jewelers, Mappins Jewelers and Piercing Pagoda. The company operates more than 2,300 locations throughout the United States, Canada and Puerto Rico. Zale Corporation is publicly traded on the New York Stock Exchange under the symbol ZLC and is headquartered in Irving, Texas.
Its Fine Jewellery segment is comprised of five brands, predominantly focused on the value-oriented consumer as our core customer target. Each brand specializes in fine jewellery and watches, with merchandise and marketing emphasis focused on diamond products.
The All Other segment includes insurance and reinsurance operations.
Industry Codes
ANZSIC 2006 Codes:
4251 Clothing Retailing
4253 Watch and Jewellery Retailing
NACE 2002 Codes: 5242 Retail sale of clothing 5248 Other retail sale in specialised stores
NAICS 2002 Codes: 448150 Clothing Accessories Stores 44831 Jewellery Stores US SIC 1987: 5632 Women's Accessory and Specialty Stores 5944 Jewellery Stores UK SIC 2003: 52423 Retail sale of other women's clothing 52484 Retail sale of jewellery, clocks and watches
8.3.2 Company Financials Zale Corporation’s comparable store sales declined by 6.8 percent during the first quarter of fiscal 2010 while Gross margin increased by 10 basis points to 48.6 percent compared to the same period in the prior year. In November 2009, comparable store sales declined by 18.6 percent compared to the same period in the prior year. Historically, the month of November has represented approximately 25 percent of total revenues for the second quarter of our fiscal year.

Table 8.2: Zale Corporation Revenues by Segments (2005-2009)
Jul-09 Jul-08 Jul-07 Jul-06 Jul-05
Fine Jewelry 1,535.68 1,876.28 1,876.68 1,864.28 1,768.48
Kiosk 232.81 249.51 262.61 276.61 280.91
All Other 11.3 12.4 13.6 13.1 12.9
Consolidated Total 1,779.71 2,138.01 2,153 2,154.01 2,062.21
Note: Figures in US$ Millions
Source: Company Reports
8.4 Gitanjali Gems
8.4.1 Business Map Gitanjali Gems is the largest diamond and jewellery company in India and one of the leading player in the global market; established in 1986. The company operates three business lines – (i) Diamond Processing and Jewellery Manufacture and Retail, (ii) Lifestyle, and (iii) Infrastructure. The company’s main focus areas for the immediate term are Diamonds & Jewellery and Infrastructure. Its value chain includes sourcing of rough diamonds – processing – wholesale & jewellery manufacture – jewellery branding – retailing in India and the US.
8.4.2 Company Financials
Jewellery contributed just 15% of total sales in FY06, its contribution has increased to 44% in FY08 and we expect this will increase further to 60% by FY12e.
EBIT and EBIT margins
Jewellery segment
Jewellery segment margins were 10.5% in FY06; they deteriorated to 7.6% in FY07 and 6.9% in FY08 due to:
• Foray into Indian branded jewellery business, where margins are lower than for exports since this segment is still in investment mode
• Acquisition of US chains, Rogers and Samuels, which were loss-making

Diamond segment
Margins in the diamond segment are low, in the range of 3-4%. This is a commodity business with low differentiation and we assume margins are flat going forward.
Segment EBIT to grow at a CAGR of 8% in the three years FY08-FY11E, in line with sales growth
Table 8.3: Gitanjali: Income Statement Snapshot (2007-2011E)
FY07 FY08 FY09E FY10E FY11E
Diamond Sales 23,833 27,523 30,010 32,210 34,372
y-o-y growth 15.3% 14.4% 10.1% 7.3% 6.7%
Jewellery Sales 11,156 21,621 27,605 34,640 43,011
y-o-y growth 201.5% 93.8% 27.7% 25.5% 24.2%
Total Sales 34,674 48,280 57,039 66,182 76,609
y-o-y growth 44.3% 39.2% 18.1% 16.0% 15.8%
Diamond EBIT 708 920 1,020 1,095 1,169
EBIT margin 3.0% 3.4% 3.4% 3.4% 3.4%
Jewellery EBIT
844 1,484 2,225 2,903 3,643
EBIT margin 7.6% 6.9% 8.1% 8.4% 8.5%
Total EBIT 1,649 2,398 3,245 3,998 4,811
EBIT margin 4.8% 5.0% 5.7% 6.0% 6.3%
INR Million
Source: Company Reports
8.4.3 Business Strategies
Geographic Expansion
Apart from balancing its presence across the value chain, Gitanjali is in the process of spreading its geographic presence. In addition to supplying polished diamonds across the globe and selling jewellery in India, Gitanjali fabricates jewellery for several jewellers based in the US, Middle East, Europe and South East Asia. Moreover, it has established retail

presence in the US with the acquisition of jewellery chains, Samuels and Rogers; it has plans to establish retail operations in China, too.
Focus on Jewellery Manufacturing and Sales
The company is consciously moving away from diamond processing to jewellery manufacture and sales, with the contribution of the diamond segment to fall from 85% in FY06 to 56% in FY08 and 44% in FY11e per our estimates. This would result in EBIT margin improvement from 4.3% in FY06 to 5.0% in FY08 and 6.3% in FY11e.
Gitanjali has become an integrated player straddling the entire value chain, including sourcing, diamond processing, jewellery fabrication and jewellery retailing. We believe that this structure gives Gitanjali benefits of scale and cost savings, enabling it to become the industry leader of the future.
Planning to Develop Special Economic Zones
Gitanjali plans to develop six SEZs (gems and jewellery as well as multi-purpose). We focus on Hyderabad SEZ, which has been approved by the government. The Hyderabad SEZ is spread over 170 acres, of which 50% will be the processing zone mainly devoted to gems and jewellery units and the remainder can be used for any purpose such as IT, residential, commercial or hotels. Gitanjali will have its own processing unit there, occupying 3,65,000 sq ft; it is currently partially in operation. The land is located 2 kms from the new airport at Hyderabad. The company plans to tie up with a real estate developer to develop the SEZ.