worldwide accounting diversity - · pdf filesouth korean telecommunications firm sk telecom...
TRANSCRIPT

Confirming Pages
23
Chapter Two
Worldwide Accounting Diversity Learning Objectives
After reading this chapter, you should be able to
• Provide evidence of the diversity that exists in accounting internationally.
• Explain the problems caused by accounting diversity.
• Describe the major environmental factors that influence national accounting sys-tems and lead to accounting diversity.
• Describe a judgmental classification of countries by financial reporting system.
• Discuss the influence that culture is thought to have on financial reporting.
• Describe a simplified model of the reasons for international differences in financial reporting.
• Categorize accounting differences internationally and provide examples of each type of difference.
INTRODUCTION
Considerable differences exist across countries in the accounting treatment of many items. For example, companies in the United States are not allowed to report property, plant, and equipment at amounts greater than historical cost. In contrast, companies in the European Union are allowed to report their assets on the balance sheet at market values. Research and development costs must be expensed as incurred in Japan, but development costs may be capitalized as an asset in Canada and France. Chinese companies are required to use the direct method in preparing the statement of cash flows, whereas most companies in the United States and Europe use the indirect method.
Differences in accounting can result in significantly different amounts being reported on the balance sheet and income statement. In its 2009 annual report, the South Korean telecommunications firm SK Telecom Company Ltd. described 15 sig-nificant differences between South Korean and U.S. accounting rules. Under South Korean generally accepted accounting principles (GAAP), SK Telecom reported 2009 net income of 1,056 billion South Korean won (KRW). If SK Telecom had used U.S. GAAP in 2009, its net income would have been KRW 1,357 billion, approxi-mately 28 percent larger. 1 Shareholders’ equity as stated under South Korean
1 The largest adjustments related to “retroactive application of equity method on business combination” and the recognition of gains on “currency and interest rate swap.”
dou10955_ch02_023-064.indd 23dou10955_ch02_023-064.indd 23 2/4/11 8:02 AM2/4/11 8:02 AM

Confirming Pages
24 Chapter Two
GAAP was KRW 12,345 billion but would have been KRW 14,261 billion under U.S. GAAP, a 16 percent difference. Braskem SA, a Brazilian chemical company, made 13 adjustments in 2009 to its Brazilian GAAP net income to report net income on a U.S. GAAP basis. These adjustments caused Brazilian GAAP income of 767.8 mil-lion Brazilian reais (BRL) to decrease by 70 percent, to 232.7 million reais under U.S. GAAP. Similarly, stockholders’ equity of BRL 4,592.5 million on a Brazilian GAAP basis decreased to only BRL 4,379.4 million under U.S. GAAP. 2
This chapter presents evidence of accounting diversity, explores the reasons for that diversity, and describes the problems that are created by differences in accounting practice across countries. Historically, several major models of accounting have been used internationally, with clusters of countries following them. These also are described and compared in this chapter. We describe the potential impact that culture has had on the development of national accounting systems and present a simplified model of the reasons for international differ-ences in financial reporting.
The final section of this chapter uses excerpts from annual reports to present additional examples of some of the differences in accounting that exist across countries. It should be noted that much of the accounting diversity that existed in the past has been eliminated as countries have abandoned their local GAAP in favor of International Financial Reporting Standards (IFRS) issued by the Inter-national Accounting Standards Board (IASB). This chapter provides a historical perspective of accounting diversity that should allow readers to more fully appre-ciate the harmonization and convergence efforts described in the next chapter.
EVIDENCE OF ACCOUNTING DIVERSITY
Exhibits 2.1 and 2.2 present consolidated balance sheets for the British company Vodafone Group PLC and its U.S. competitor Verizon Communications Inc. A quick examination of these statements shows several differences in format and ter-minology between the United Kingdom and the United States. Perhaps the most obvious difference is the order in which assets are presented. Whereas Verizon presents assets in order of liquidity, beginning with cash and cash equivalents, Vodafone presents assets in reverse order of liquidity, starting with goodwill. On the other side of the balance sheet, Vodafone presents its equity accounts before liabilities. In the equity section, “Called-up share capital” is the equivalent of the common stock account on a U.S. balance sheet and “Share premium account” is the contributed capital in excess of par value. Vodafone uses a “Capital redemp-tion reserve” to indicate an appropriation of retained earnings. Reserves are unknown in the United States. Vodafone includes “Provisions,” which represent estimated liabilities related to restructurings, legal disputes, and asset retirements, in both current and noncurrent liabilities. This line item does not appear in the U.S. balance sheet.
Common for U.S. companies, Verizon includes only consolidated financial statements in its annual report. In addition to consolidated financial statements, Vodafone also includes the parent company’s separate balance sheet in its annual report. This is shown in Exhibit 2.3 . In the parent company balance sheet, investments in subsidiaries are not consolidated but instead are reported as
2 The largest difference in stockholder’s equity stems from a difference in the accounting treatment for distributions to shareholders.
dou10955_ch02_023-064.indd 24dou10955_ch02_023-064.indd 24 2/4/11 8:02 AM2/4/11 8:02 AM

Confirming Pages
25
VODAFONE GROUP PLCConsolidated Balance Sheets
Consolidated Balance Sheet at 31 March
2009 2008Note £m £m
Noncurrent assets
Goodwill . . . . . . . . . . . . . . . . . . . . . . . . . . . . . . . . . . . 9 53,958 51,336
Other intangible assets. . . . . . . . . . . . . . . . . . . . . . . . . 9 20,980 18,995
Property, plant and equipment. . . . . . . . . . . . . . . . . . . 11 19,250 16,735
Investments in associated undertakings . . . . . . . . . . . . 14 34,715 22,545
Other investments . . . . . . . . . . . . . . . . . . . . . . . . . . . . 15 7,060 7,367
Deferred tax assets. . . . . . . . . . . . . . . . . . . . . . . . . . . . 6 630 436
Postemployment benefits. . . . . . . . . . . . . . . . . . . . . . . 26 8 65
Trade and other receivables . . . . . . . . . . . . . . . . . . . . . 17 3,069 1,067
139,670 118,546Current assets
Inventory . . . . . . . . . . . . . . . . . . . . . . . . . . . . . . . . . . . 16 412 417
Taxation recoverable . . . . . . . . . . . . . . . . . . . . . . . . . . 77 57
Trade and other receivables . . . . . . . . . . . . . . . . . . . . . 17 7,662 6,551
Cash and cash equivalents . . . . . . . . . . . . . . . . . . . . . . 18 4,878 1,699
13,029 8,724
Total assets . . . . . . . . . . . . . . . . . . . . . . . . . . . . . . . . 152,699 127,270
Equity
Called-up share capital. . . . . . . . . . . . . . . . . . . . . . . . . 19 4,153 4,182
Share premium account . . . . . . . . . . . . . . . . . . . . . . . . 21 43,008 42,934
Own shares held . . . . . . . . . . . . . . . . . . . . . . . . . . . . . 21 (8,036) (7,856)
Additional paid-in capital . . . . . . . . . . . . . . . . . . . . . . . 21 100,239 100,151
Capital redemption reserve . . . . . . . . . . . . . . . . . . . . . 21 10,101 10,054
Accumulated other recognised income and expense . . 22 20,517 10,558
Retained losses . . . . . . . . . . . . . . . . . . . . . . . . . . . . . . 23 (83,820) (81,980)
Total equity shareholders’ funds. . . . . . . . . . . . . . . 86,162 78,043
Minority interests . . . . . . . . . . . . . . . . . . . . . . . . . . . 1,787 1,168
Written put options over minority interests . . . . . . . . . (3,172) (2,740)
Total minority interests . . . . . . . . . . . . . . . . . . . . . . (1,385) (1,572)
Total equity . . . . . . . . . . . . . . . . . . . . . . . . . . . . . . . . 84,777 76,471
Noncurrent liabilities
Long-term borrowings . . . . . . . . . . . . . . . . . . . . . . . . . 25 31,749 22,662
Deferred tax liabilities. . . . . . . . . . . . . . . . . . . . . . . . . . 6 6,642 5,109
Postemployment benefits. . . . . . . . . . . . . . . . . . . . . . . 26 240 104
Provisions. . . . . . . . . . . . . . . . . . . . . . . . . . . . . . . . . . . 27 533 306
Trade and other payables. . . . . . . . . . . . . . . . . . . . . . . 28 811 645
39,975 28,826
Current liabilities
Short-term borrowings. . . . . . . . . . . . . . . . . . . . . . . . . 25, 35 9,624 4,532
Current taxation liabilities . . . . . . . . . . . . . . . . . . . . . . 4,552 5,123
Provisions. . . . . . . . . . . . . . . . . . . . . . . . . . . . . . . . . . . 27 373 356
Trade and other payables . . . . . . . . . . . . . . . . . . . . . . 28 13,398 11,962
27,947 21,973
Total equity and liabilities . . . . . . . . . . . . . . . . . . . . 152,699 127,270
EXHIBIT 2.1
dou10955_ch02_023-064.indd 25dou10955_ch02_023-064.indd 25 2/4/11 8:02 AM2/4/11 8:02 AM

Confirming Pages
26 Chapter Two
VERIZON COMMUNICATIONS, INC.Consolidated Balance Sheets
At December 31 (Dollars in Millions, Except per Share Amounts) . . . . . . . . . . . . . . . 2009 2008
Assets
Current assets
Cash and cash equivalents . . . . . . . . . . . . . . . . . . . . . . . . . . . . . . . . . . . . . . . . . . . . $ 2,009 $ 9,782
Short-term investments . . . . . . . . . . . . . . . . . . . . . . . . . . . . . . . . . . . . . . . . . . . . . . 490 509
Accounts receivable, net of allowances of $976 and $941 . . . . . . . . . . . . . . . . . . . . 12,573 11,703
Inventories . . . . . . . . . . . . . . . . . . . . . . . . . . . . . . . . . . . . . . . . . . . . . . . . . . . . . . . . 2,289 2,092
Prepaid expenses and other . . . . . . . . . . . . . . . . . . . . . . . . . . . . . . . . . . . . . . . . . . . 5,247 1,989
Total current assets. . . . . . . . . . . . . . . . . . . . . . . . . . . . . . . . . . . . . . . . . . . . . . . . 22,608 26,075
Plant, property, and equipment . . . . . . . . . . . . . . . . . . . . . . . . . . . . . . . . . . . . . . . . 228,518 215,605
Less accumulated depreciation. . . . . . . . . . . . . . . . . . . . . . . . . . . . . . . . . . . . . . . . . 137,052 129,059
91,466 86,546
Investments in unconsolidated businesses . . . . . . . . . . . . . . . . . . . . . . . . . . . . . . . . 3,535 3,393
Wireless licenses . . . . . . . . . . . . . . . . . . . . . . . . . . . . . . . . . . . . . . . . . . . . . . . . . . . 72,067 61,974
Goodwill . . . . . . . . . . . . . . . . . . . . . . . . . . . . . . . . . . . . . . . . . . . . . . . . . . . . . . . . . 22,472 6,035
Other intangible assets, net . . . . . . . . . . . . . . . . . . . . . . . . . . . . . . . . . . . . . . . . . . . 6,764 5,199
Other investments . . . . . . . . . . . . . . . . . . . . . . . . . . . . . . . . . . . . . . . . . . . . . . . . . . — 4,781
Other assets. . . . . . . . . . . . . . . . . . . . . . . . . . . . . . . . . . . . . . . . . . . . . . . . . . . . . . . 8,339 8,349
Total assets . . . . . . . . . . . . . . . . . . . . . . . . . . . . . . . . . . . . . . . . . . . . . . . . . . . . . . $227,251 $202,352
Liabilities and Shareowners’ Investment
Current liabilities
Debt maturing within one year . . . . . . . . . . . . . . . . . . . . . . . . . . . . . . . . . . . . . . . . $ 7,205 $ 4,993
Accounts payable and accrued liabilities. . . . . . . . . . . . . . . . . . . . . . . . . . . . . . . . . . 15,223 13,814
Other. . . . . . . . . . . . . . . . . . . . . . . . . . . . . . . . . . . . . . . . . . . . . . . . . . . . . . . . . . . . 6,708 7,099
Total current liabilities . . . . . . . . . . . . . . . . . . . . . . . . . . . . . . . . . . . . . . . . . . . . . 29,136 25,906
Long-term debt . . . . . . . . . . . . . . . . . . . . . . . . . . . . . . . . . . . . . . . . . . . . . . . . . . . . 55,051 46,959
Employee benefit obligations . . . . . . . . . . . . . . . . . . . . . . . . . . . . . . . . . . . . . . . . . . 32,622 32,512
Deferred income taxes . . . . . . . . . . . . . . . . . . . . . . . . . . . . . . . . . . . . . . . . . . . . . . . 19,310 11,769
Other liabilities. . . . . . . . . . . . . . . . . . . . . . . . . . . . . . . . . . . . . . . . . . . . . . . . . . . . . 6,765 6,301
Equity
Series preferred stock ($.10 par value; none issued) . . . . . . . . . . . . . . . . . . . . . . . . . — —
Common stock ($.10 par value; 2,967,610,119 shares issued in both periods) . . . . . 297 297
Contributed capital . . . . . . . . . . . . . . . . . . . . . . . . . . . . . . . . . . . . . . . . . . . . . . . . . 40,108 40,291
Reinvested earnings . . . . . . . . . . . . . . . . . . . . . . . . . . . . . . . . . . . . . . . . . . . . . . . . . 17,592 19,250
Accumulated other comprehensive loss (11,479) (13,372)
Common stock in treasury, at cost . . . . . . . . . . . . . . . . . . . . . . . . . . . . . . . . . . . . . . (5,000) (4,839)
Deferred compensation—employee stock ownership plans and other . . . . . . . . . . . 88 79
Noncontrolling interest . . . . . . . . . . . . . . . . . . . . . . . . . . . . . . . . . . . . . . . . . . . . . . 42,761 37,199
Total equity . . . . . . . . . . . . . . . . . . . . . . . . . . . . . . . . . . . . . . . . . . . . . . . . . . . . . . 84,367 78,905
Total liabilities and equity . . . . . . . . . . . . . . . . . . . . . . . . . . . . . . . . . . . . . . . . . . $227,251 $202,352
EXHIBIT 2.2
dou10955_ch02_023-064.indd 26dou10955_ch02_023-064.indd 26 2/4/11 8:02 AM2/4/11 8:02 AM

Confirming Pages
Worldwide Accounting Diversity 27
“Shares in group undertakings” in the “Fixed assets” section. Liabilities are called “Creditors” and receivables are “Debtors.” From the perspective of U.S. financial reporting, the UK parent company balance sheet has an unusual structure. Rather than the U.S. norm of Assets = Liabilities + Shareholders’ equity, Vodafone’s parent company balance sheet is presented as Assets − Liabilities = Shareholders’ equity. Closer inspection shows that the balance sheet presents the left-hand side of the equation as Noncurrent assets + Working capital − Noncurrent liabilities = Shareholders’ equity.
All of these superficial differences would probably cause a financial analyst little problem in analyzing the company’s financial statements. More important than the format and terminology differences are the differences in recognition and measurement rules employed to value assets and liabilities and to calculate income. As was noted in the introduction to this chapter, very different amounts of net income and stockholders’ equity can be reported by a company depend-ing on the accounting rules that it uses. For example, SK Telecom’s 2009 net income was 28 percent larger under U.S. GAAP than under South Korean GAAP; Braskem’s 2009 net income was 70 percent smaller under U.S. GAAP than under Brazilian GAAP.
EXHIBIT 2.3 VODAFONE GROUP PLCCompany Balance Sheets
Company Balance Sheet at 31 March
2009 2008Note £m £m
Fixed assets
Shares in group undertakings. . . . . . . . . . . . . . . . . . . . . . . . . . . . 3 64,937 64,922
Current assets
Debtors: amounts falling due after more than one year . . . . . . . . 4 2,352 821
Debtors: amounts falling due within one year . . . . . . . . . . . . . . . 4 126,334 126,099
128,797 126,920
Cash at bank and in hand . . . . . . . . . . . . . . . . . . . . . . . . . . . . . . 111 —
Creditors: amounts falling due within one year . . . . . . . . . . 5 (92,339) (98,784)
Net current assets . . . . . . . . . . . . . . . . . . . . . . . . . . . . . . . . . . . 36,458 28,136
Total assets less current liabilities . . . . . . . . . . . . . . . . . . . . . . 101,395 93,058
Creditors: amounts falling due after more than one year. . . 5 (21,970) (14,582)
79,425 78,476
Capital and reserves
Called-up share capital. . . . . . . . . . . . . . . . . . . . . . . . . . . . . . . . . 6 4,153 4,182
Share premium account . . . . . . . . . . . . . . . . . . . . . . . . . . . . . . . . 8 43,008 42,934
Capital redemption reserve . . . . . . . . . . . . . . . . . . . . . . . . . . . . . 8 10,101 10,054
Capital reserve . . . . . . . . . . . . . . . . . . . . . . . . . . . . . . . . . . . . . . . 8 88 88
Other reserves . . . . . . . . . . . . . . . . . . . . . . . . . . . . . . . . . . . . . . . 8 957 942
Own shares held . . . . . . . . . . . . . . . . . . . . . . . . . . . . . . . . . . . . . 8 (8,053) (7,867)
Profit and loss account. . . . . . . . . . . . . . . . . . . . . . . . . . . . . . . . . 8 29,171 28,143
Equity shareholders’ funds . . . . . . . . . . . . . . . . . . . . . . . . . . . 79,425 78,476
dou10955_ch02_023-064.indd 27dou10955_ch02_023-064.indd 27 2/4/11 8:02 AM2/4/11 8:02 AM

Confirming Pages
28 Chapter Two
REASONS FOR ACCOUNTING DIVERSITY
Why do financial reporting practices differ across countries? Accounting schol-ars have hypothesized numerous influences on a country’s accounting system, including factors as varied as the nature of the political system, the stage of eco-nomic development, and the state of accounting education and research. A sur-vey of the relevant literature has identified the following five items as being commonly accepted as factors influencing a country’s financial reporting prac-tices: (1) legal system, (2) taxation, (3) providers of financing, (4) inflation, and (5) political and economic ties. 3
Legal System There are two major types of legal systems used around the world: common law and codified Roman law. Common law began in England and is primarily found in the English-speaking countries of the world. Common law countries rely on a limited amount of statute law, which is then interpreted by the courts. Court decisions establish precedents, thereby developing case law that supplements the statutes. A system of code law, followed in most non-English-speaking countries, originated in the Roman jus civile and was developed further in European univer-sities during the Middle Ages. Code law countries tend to have relatively more statute or codified law governing a wider range of human activity.
What does a country’s legal system have to do with accounting? Code law countries generally have corporation law (sometimes called a commercial code or companies act), which establishes the basic legal parameters governing busi-ness enterprises. The corporation law often stipulates which financial statements must be published in accordance with a prescribed format. Additional accounting measurement and disclosure rules are included in an accounting law debated and passed by the national legislature. In countries where accounting rules are legis-lated, the accounting profession tends to have little influence on the development of accounting standards. In countries with a tradition of common law, although a corporation law laying the basic framework for accounting might exist (such as in the United Kingdom), specific accounting rules are established by the profession or by an independent nongovernmental body representing a variety of constitu-encies. Thus, the type of legal system in a country tends to determine whether the primary source of accounting rules is the government or a nongovernmental organization.
In code law countries, the accounting law tends to be rather general and does not provide much detail regarding specific accounting practices and may provide no guidance at all in certain areas. Germany is a good example of this type of country. The German accounting law passed in 1985 is only 47 pages long and is silent with regard to issues such as leases, foreign currency translation, and cash flow statements. 4 When no guidance is provided in the law, German companies refer to other sources, including tax law, opinions of the German auditing pro-fession, and standards issued by the German Accounting Standards Committee, to decide how to do their accounting. Interestingly enough, important sources of accounting practice in Germany have been textbooks and commentaries written by accounting academicians.
3 Gary K. Meek and Sharokh M. Saudagaran, “A Survey of Research on Financial Reporting in a Transna-tional Context,” Journal of Accounting Literature, 1990, pp. 145–82.
4 Jermyn Paul Brooks and Dietz Mertin, Neues Deutsches Bilanzrecht (Düsseldorf: IDW-Verlag, 1986).
dou10955_ch02_023-064.indd 28dou10955_ch02_023-064.indd 28 2/4/11 8:02 AM2/4/11 8:02 AM

Confirming Pages
Worldwide Accounting Diversity 29
In common law countries, where there is likely to be a nonlegislative organiza-tion developing accounting standards, much more detailed rules are developed. The extreme case might be the Financial Accounting Standards Board (FASB) in the United States, which provides a substantial amount of implementation guid-ance in its accounting standards codification (ASC) and updates and has been accused of producing a “standards overload.”
To illustrate this point, consider the rules related to accounting for leases estab-lished by the FASB in the United States and in German accounting law. In the United States, leases must be capitalized if any one of four very specific criteria is met. Additional guidance establishes rules for specific situations such as sales with leasebacks, sales-type leases of real estate, and changes in leases resulting from refundings of tax-exempt debt. In contrast, the German accounting law is silent with regard to leases. The only guidance in the law can be found in para-graph 285, which simply states that all liabilities must be recorded. 5
Taxation In some countries, published financial statements form the basis for taxation, whereas in other countries, financial statements are adjusted for tax purposes and submitted to the government separately from the reports sent to stockholders. Continuing to focus on Germany, the so-called congruency principle (Massgeblich-keitsprinzip) in that country stipulates that the published financial statements serve as the basis for taxable income. 6 In most cases, for an expense to be deductible for tax purposes it must also be used in the calculation of financial statement income. Well-managed German companies attempt to minimize income for tax purposes, for example, through the use of accelerated depreciation, so as to reduce their tax liability. As a result of the congruency principle, accelerated depreciation must also be taken in the calculation of accounting income.
In the United States, in contrast, conformity between the tax statement and financial statements is required only with regard to the use of the last-in, first-out (LIFO) inventory cost flow assumption. U.S. companies are allowed to use accel-erated depreciation for tax purposes and straight-line depreciation in the financial statements. All else being equal, because of the influence of the congruency princi-ple, a German company is likely to report lower income than its U.S. counterpart.
The difference between tax and accounting income gives rise to the necessity to account for deferred income taxes, a major issue in the United States in recent years. Deferred income taxes are much less of an issue in Germany; for many German companies, they do not exist at all. This is also true in other code law countries such as France and Japan.
Providers of Financing The major providers of financing for business enterprises are family members, banks, governments, and shareholders. In those countries in which company financing is dominated by families, banks, or the state, there will be less pressure for public accountability and information disclosure. Banks and the state will often
5 In compliance with European Union regulations, Germany requires publicly traded companies to use International Financial Reporting Standards (IFRS) to prepare their consolidated financial statements. German accounting law continues to be used by privately held companies and by publicly traded compa-nies in preparing parent company financial statements.
6 German taxable income is computed by comparing an opening and closing tax balance sheet, the Steuerbilanz. The tax balance sheet is based on the published balance sheet, the Handelsbilanz.
dou10955_ch02_023-064.indd 29dou10955_ch02_023-064.indd 29 2/4/11 8:02 AM2/4/11 8:02 AM

Confirming Pages
30 Chapter Two
be represented on the board of directors and will therefore be able to obtain infor-mation necessary for decision making from inside the company. As companies become more dependent on financing from the general populace through the pub-lic offering of shares of stock, the demand for more information made available outside the company becomes greater. It simply is not feasible for the company to allow the hundreds, thousands, or hundreds of thousands of shareholders access to internal accounting records. The information needs of those financial statement users can be satisfied only through extensive disclosures in accounting reports.
There can also be a difference in financial statement orientation, with stock-holders more interested in profit (emphasis on the income statement) and banks more interested in solvency and liquidity (emphasis on the balance sheet). Bankers tend to prefer companies to practice rather conservative accounting with regard to assets and liabilities.
Inflation Countries experiencing chronic high rates of inflation found it necessary to adopt accounting rules that required the inflation adjustment of historical cost amounts. This was especially true in Latin America, which as a region has had more infla-tion than any other part of the world. For example, throughout the 1980s and 1990s, the average annual rate of inflation rate in Mexico was approximately 50 percent, with a high of 159 percent in 1987. 7 Double- and triple-digit inflation rates render historical costs meaningless. Throughout most of the latter half of the 20th century, this factor primarily distinguished Latin America from the rest of the world with regard to accounting. 8
Adjusting accounting records for inflation results in a write-up of assets and therefore related expenses. Adjusting income for inflation is especially important in those countries in which accounting statements serve as the basis for taxation; otherwise, companies will be paying taxes on fictitious profits.
Political and Economic Ties Accounting is a technology that can be relatively easily borrowed from or imposed on another country. Through political and economic links, accounting rules have been conveyed from one country to another. For example, through previous colo-nialism, both England and France have transferred their accounting frameworks to a variety of countries around the world. British-style accounting systems can be found in countries as far-flung as Australia and Zimbabwe. French accounting is prevalent in the former French colonies of western Africa. More recently, it is thought that economic ties with the United States have had an impact on account-ing in Canada, Mexico, and Israel.
Correlation of Factors Whether by coincidence or not, there is a high degree of correlation between legal system, tax conformity, and source of financing. As Exhibit 2.4 shows, common law countries tend to have greater numbers of domestic listed companies, relying more heavily on equity as a source of capital. Code law countries tend to link taxa-tion to accounting statements and rely less on financing provided by shareholders.
7 Joseph B. Lipscomb and Harold Hunt, “Mexican Mortgages: Structure and Default Incentives, Historical Simulation 1982–1998,” Journal of Housing Research 10, no. 2 (1999), pp. 235–65.
8 Mexico continued its use of inflation accounting until 2007.
dou10955_ch02_023-064.indd 30dou10955_ch02_023-064.indd 30 2/4/11 8:02 AM2/4/11 8:02 AM

Confirming Pages
Worldwide Accounting Diversity 31
PROBLEMS CAUSED BY ACCOUNTING DIVERSITY
Preparation of Consolidated Financial Statements The diversity in accounting practice across countries causes problems that can be quite serious for some parties. One problem relates to the preparation of consoli-dated financial statements by companies with foreign operations. Consider Gen-eral Motors Corporation, which has subsidiaries in more than 50 countries around the world. Each subsidiary incorporated in the country in which it is located is required to prepare financial statements in accordance with local regulations. These regulations usually require companies to keep books in local currency using local accounting principles. Thus, General Motors de Mexico prepares financial statements in Mexican pesos using Mexican accounting rules and General Motors Japan Ltd. prepares financial statements in Japanese yen using Japanese standards. To prepare consolidated financial statements in the United States, in addition to translating the foreign currency financial statements into U.S. dollars, the parent company must also convert the financial statements of its foreign operations into U.S. GAAP. Each foreign operation must either maintain two sets of books pre-pared in accordance with both local and U.S. GAAP or, as is more common, recon-ciliations from local GAAP to U.S. GAAP must be made at the balance sheet date. In either case, considerable effort and cost are involved; company personnel must develop an expertise in more than one country’s accounting standards.
Access to Foreign Capital Markets A second problem caused by accounting diversity relates to companies gaining access to foreign capital markets. If a company desires to obtain capital by selling stock or borrowing money in a foreign country, it might be required to present a set of financial statements prepared in accordance with the accounting stan-dards in the country in which the capital is being obtained. Consider the case of the semiconductor manufacturer STMicroelectronics, which is based in Geneva, Switzerland. The equity market in Switzerland is so small (there are fewer than 8 million Swiss) and ST’s capital needs are so great that the company has found it necessary to have its common shares listed on the Euronext-Paris and Borsa Italiana stock exchanges in Europe and on the New York Stock Exchange in the United States. To have stock traded in the United States, foreign companies must either prepare financial statements using U.S. accounting standards or provide a reconciliation of local GAAP net income and stockholders’ equity to U.S. GAAP.
Domestic Listed Companies
Country Legal System NumberPer Million of
PopulationTax
Conformity
Italy Code 296 5.1 YesGermany Code 783 9.5 YesJapan Code 2,335 18.4 YesUnited Kingdom Common 2,792 45.6 NoAustralia Common 1,966 91.4 NoCanada Common 3,700 109.6 No
EXHIBIT 2.4 Relationship between Several Factors Influencing Accounting Diversity
Sources: Number of domes-tic listed companies obtained from World Federation of Exchanges (2009), www.world-exchanges.org . Coun-try populations obtained from CIA World Fact Book (2010).
dou10955_ch02_023-064.indd 31dou10955_ch02_023-064.indd 31 2/4/11 8:02 AM2/4/11 8:02 AM

Confirming Pages
32 Chapter Two
This can be quite costly. In preparing for a New York Stock Exchange (NYSE) list-ing in 1993, the German automaker Daimler-Benz estimated it spent $60 million to initially prepare U.S. GAAP financial statements; it expected to spend $15 mil-lion to $20 million each year thereafter. 9 The appendix to this chapter describes the case of Daimler-Benz in becoming the first German company to list on the NYSE. As noted in Chapter 1, the U.S. SEC eliminated the U.S. GAAP reconcili-ation requirement for those foreign companies using IFRS to prepare their finan-cial statements. However, foreign companies not using IFRS continue to provide U.S. GAAP information.
Comparability of Financial Statements A third problem relates to the lack of comparability of financial statements between companies from different countries. This can significantly affect the anal-ysis of foreign financial statements for making investment and lending decisions. In 2003 alone, U.S. investors bought and sold nearly $3 trillion worth of foreign stocks while foreign investors traded over $6 trillion in U.S. equity securities. 10 In recent years there has been an explosion in mutual funds that invest in the stock of foreign companies. As an example, the number of international stock funds increased from 123 in 1989 to 534 by the end of 1995. 11 T. Rowe Price’s New Asia Fund, for example, invests exclusively in stocks and bonds of companies located in Asian countries other than Japan. The job of deciding which foreign company to invest in is complicated by the fact that foreign companies use accounting rules different from those used in the United States and those rules differ from country to country. It is very difficult if not impossible for a potential investor to directly compare the financial position and performance of an automobile manufacturer in Germany (Volkswagen), Japan (Nissan), and the United States (Ford) because these three countries have different financial accounting and reporting standards. According to Ralph E. Walters, former chairman of the steering committee of the International Accounting Standards Committee, “either international investors have to be extremely knowledgeable about multiple reporting methods or they have to be willing to take greater risk.” 12
A lack of comparability of financial statements also can have an adverse effect on corporations when making foreign acquisition decisions. As a case in point, consider the experience of foreign investors in Eastern Europe. After the fall of the Berlin Wall in 1989, Western companies were invited to acquire newly privatized companies in Poland, Hungary, and other countries in the former communist bloc. The concept of profit and accounting for assets in those countries under com-munism was so different from accounting practice in the West that most West-ern investors found financial statements useless in helping to determine which enterprises were the most attractive acquisition targets. In many cases, the inter-national public accounting firms were called on to convert financial statements to a Western basis before acquisition of a company could be seriously considered.
9 Allan B. Afterman, International Accounting, Financial Reporting, and Analysis (New York: Warren, Gorham & Lamont, 1995), pp. C1-17, C1-22.
10 U.S. Department of Commerce, Bureau of Economic Analysis, “U.S. International Transactions,” Survey of Current Business, January 2005, pp. 45–76, Table 7a.
11 James L. Cochrane, James E. Shapiro, and Jean E. Tobin, “Foreign Equities and U.S. Investors: Breaking Down the Barriers Separating Supply and Demand,” NYSE Working Paper 95–04, 1995.
12 Stephen H. Collins, “The Move to Globalization,” Journal of Accountancy, March 1989, p. 82.
dou10955_ch02_023-064.indd 32dou10955_ch02_023-064.indd 32 2/4/11 8:02 AM2/4/11 8:02 AM

Confirming Pages
Worldwide Accounting Diversity 33
There was a very good reason why accounting in the communist countries of Eastern Europe and the Soviet Union was so much different from accounting in capitalist countries. Financial statements were not prepared for the benefit of investors and creditors to be used in making investment and lending decisions. Instead, financial statements were prepared to provide the government with information to determine whether the central economic plan was being fulfilled. Financial statements prepared for central planning purposes have limited value in making investment decisions.
Lack of High-Quality Accounting Information A fourth problem associated with accounting diversity is the lack of high-quality accounting standards in some parts of the world. There is general agreement that the failure of many banks in the 1997 East Asian financial crisis was due to three factors: a highly leveraged corporate sector, the private sector’s reliance on foreign currency debt, and a lack of accounting transparency. 13 To be sure, inadequate disclosure did not create the East Asian meltdown, but it did contribute to the depth and breadth of the crisis. As Rahman explains: “It is a known fact that the very threat of disclosure influences behavior and improves management, particu-larly risk management. It seems that the lack of appropriate disclosure require-ments indirectly contributed to the deficient internal controls and imprudent risk management practices of the corporations and banks in the crisis-hit coun-tries.” 14 International investors and creditors were unable to adequately assess risk because financial statements did not reflect the extent of risk exposure due to the following disclosure deficiencies:
• The actual magnitude of debt was hidden by undisclosed related-party transac-tions and off-balance-sheet financing.
• High levels of exposure to foreign exchange risk were not evident.
• Information on the extent to which investments and loans were made in highly speculative assets (such as real estate) was not available.
• Contingent liabilities for guaranteeing loans, often foreign currency loans, were not reported.
• Appropriate disclosures regarding loan loss provisions were not made.
Because of the problems associated with worldwide accounting diversity, attempts to reduce the accounting differences across countries have been ongoing for over three decades. This process is known as harmonization. The ultimate goal of harmonization is to have one set of international accounting standards that are followed by all companies around the world. Harmonization is the major topic of Chapter 3.
ACCOUNTING CLUSTERS
Given the discussion regarding factors influencing accounting practice world-wide, it should not be surprising to learn that there are clusters of countries that share common accounting orientation and practices. One classification scheme identifies three major accounting models: the Fair Presentation/Full Disclosure
13 M. Zubaidur Rahman, “The Role of Accounting in the East Asian Financial Crisis: Lessons Learned?” Transnational Corporations 7, no. 3 (December 1998), pp. 1–52.
14 Ibid., p. 7.
dou10955_ch02_023-064.indd 33dou10955_ch02_023-064.indd 33 2/4/11 8:02 AM2/4/11 8:02 AM

Confirming Pages
Class
Macro-uniform
DevelopedWesterncountries
Micro-based
Law-based
Tax-based
U.S.influence
CanadaUnited States
IrelandUnited KingdomNew ZealandAustralia
UKinfluence
Subclass
Government,economics
Continental:government,tax, legal
Businesspractice,pragmatic,British origin
Businesseconomics,theory
Netherlands
Sweden
JapanGermany
SpainBelgiumFranceItaly
Family Species
34 Chapter Two
Model, the Legal Compliance Model, and the Inflation-Adjusted Model. 15 The Fair Presentation/Full Disclosure Model (also known as the Anglo-Saxon or Anglo-American model) is used to describe the approach used in the United Kingdom and United States, where accounting is oriented toward the decision needs of large numbers of investors and creditors. This model is used in most English-speaking countries and other countries heavily influenced by the United Kingdom or the United States. Most of these countries follow a common law legal system. The Legal Compliance Model originated in the code law countries of continental Europe; it is also known as the Continental European model. It is used by most of Europe, Japan, and other code law countries. Companies in this group usually are tied quite closely to banks that serve as the primary suppliers of financing. Because these are code law countries, accounting is legalistic and is designed to provide information for taxation or government-planning purposes. The Inflation-Adjusted Model is found primarily in South America. This model resembles the Continental European model in its legalistic, tax, and government-planning orientation. This model distinguishes itself, however, through the exten-sive use of adjustments for inflation.
A Judgmental Classification of Financial Reporting Systems Concentrating on the Anglo-Saxon and Continental European Model countries, Nobes developed a more refined classification scheme that attempts to show how the financial reporting systems in 14 developed countries relate to one another. 16 Exhibit 2.5 presents an adaptation of Nobes’s classification.
15 Helen Gernon and Gary Meek, Accounting: An International Perspective, 5th ed. (Burr Ridge, IL: Irwin/McGraw-Hill, 2001), pp. 10–11.
16 Christopher W. Nobes, “A Judgemental International Classification of Financial Reporting Practices,” Journal of Business Finance and Accounting, Spring 1983.
EXHIBIT 2.5 Nobes’s Judgmental Classification of Financial Reporting Systems
Source: Christopher W. Nobes, “A Judgemental International Classification of Financial Reporting Practices,” Journal of Business Finance and Accounting, Spring 1983, p. 7.
dou10955_ch02_023-064.indd 34dou10955_ch02_023-064.indd 34 2/4/11 8:02 AM2/4/11 8:02 AM

Confirming Pages
Worldwide Accounting Diversity 35
The terms micro-based and macro-uniform describe the Anglo-Saxon and Con-tinental European Models, respectively. Each of these classes is divided into two subclasses that are further divided into families. Within the micro-based class of accounting system, there is a subclass heavily influenced by business econom-ics and accounting theory. The Netherlands is the only country in this subclass. One manifestation of the influence of theory is that Dutch companies may use current replacement cost accounting to value assets in their primary financial statements. The other micro-based subclass, of British origin, is more pragmatic and is oriented toward business practice, relying less on economic theory in the development of accounting rules. The British-origin subclass is further split into two families, one dominated by the United Kingdom and one dominated by the United States. Nobes does not indicate how these two families differ.
On the macro-uniform side of the classification, a “government, economics” subclass has only one country, Sweden. Swedish accounting distinguishes itself from the other macro-uniform countries in being closely aligned with national economic policies. For example, income smoothing is allowed to promote eco-nomic stability and social accounting has developed to meet macroeconomic concerns. The “continental: government, tax, legal” subclass primarily has Conti-nental European countries. This subclass is further divided into two families. Led by Germany, the law-based family includes Japan. The tax-based family consists of several Romance-language countries. The major difference between these fami-lies is that the accounting law is the primary determinant of accounting practice in Germany, whereas the tax law dominates in the Southern European countries.
The importance of this hierarchical model is that it shows the comparative dis-tances between countries and could be used as a blueprint for determining where financial statement comparability is likely to be greater. For example, compari-sons of financial statements between the United States and Canada (which are in the same family) are likely to be more valid than comparisons between the United States and the United Kingdom (which are not in the same family). However, the United States and the United Kingdom (which are in the same subclass) are more comparable than are the United States and the Netherlands (which are in differ-ent subclasses). Finally, comparisons between the United States and the Nether-lands (which are in the same class) might be more meaningful than comparisons between the United States and any of the macro-uniform countries.
AN EMPIRICAL TEST OF THE JUDGMENTAL CLASSIFICATION
The judgmental classification in Exhibit 2.5 was empirically tested in 1990. 17 Data gathered on 100 financial reporting practices in 50 countries (including the 14 countries in Exhibit 2.5 ) were analyzed using the statistical procedure of hierar-chical cluster analysis. The significant clusters arising from the statistical analysis are in Exhibit 2.6 . Clusters are analogous to the families in Nobes’s classification.
The results reported in Exhibit 2.6 clearly indicate the existence of two sig-nificantly different classes of accounting systems being used across these coun-tries and are generally consistent with the classes, subclasses, and families of Nobes’s classification. The major deviations from Nobes’s classification are that
17 Timothy S. Doupnik and Stephen B. Salter, “An Empirical Test of a Judgemental International Classifi-cation of Financial Reporting Practices,” Journal of International Business Studies, First Quarter 1993, pp. 41–60.
dou10955_ch02_023-064.indd 35dou10955_ch02_023-064.indd 35 2/4/11 8:02 AM2/4/11 8:02 AM

Confirming Pages
36 Chapter Two
the Netherlands is located in the UK-influence cluster (Cluster 1) rather than in a subclass by itself; Japanese accounting (Cluster 9) is not as similar to German accounting (Cluster 8) as hypothesized; and Belgium (located in Cluster 6) is not in the group with France, Spain, and Italy (Cluster 5). Indeed, there appears to be more diversity among the macro countries (as evidenced by the greater number of clusters) than among the countries comprising the micro class.
The large size of the UK-influence cluster (Cluster 1) shows the influence of British colonialism on accounting development. In contrast, Cluster 2, which includes the United States, is quite small. The emergence of Cluster 4, which includes several Latin American countries, is evidence of the importance of infla-tion as a factor affecting accounting practice.
The two classes of accounting reflected in Exhibit 2.6 differ significantly on 66 of the 100 financial reporting practices examined. Differences exist for 41 of the 56 disclosure practices studied. In all but one case, the micro class of countries provided a higher level of disclosure than the macro class of countries. There were also significant differences for 25 of the 44 practices examined affecting income measurement. Of particular importance is the item asking whether accounting practice adhered to tax requirements. The mean level of agreement with this statement among macro countries was 72 percent, whereas it was only 45 percent among micro countries. To summarize, companies in the micro-based countries provide more extensive disclosure than do companies in the macro-uniform coun-tries, and companies in the macro countries are more heavily influenced by taxa-tion than are companies in the micro countries. These results are consistent with the relative importance of equity finance and the relatively weak link between accounting and taxation in the micro countries.
EXHIBIT 2.6 Results of Hierarchical Cluster Analysis on 100 Financial Reporting Practices in 1990
Source: Timothy S. Doupnik and Stephen B. Salter, “An Empirical Test of a Judgemental International Classification of Financial Reporting Practices,” Journal of International Business Stud-ies, First Quarter 1993, p. 53.
Cluster 1
Australia Botswana Hong Kong Ireland Jamaica Luxembourg Malaysia Namibia Netherlands Netherlands Antilles Nigeria New Zealand Philippines Papua New Guinea South Africa Singapore Sri Lanka Taiwan Trinidad and Tobago United Kingdom Zambia Zimbabwe
Micro Class Macro Class
Cluster 2
Bermuda Canada Israel United States
Cluster 3
Costa Rica
Cluster 4
Argentina Brazil Chile Mexico
Cluster 5
Colombia Denmark France Italy Norway Portugal Spain
Cluster 6
Belgium Egypt Liberia Panama Saudi Arabia Thailand United Arab Emirates
Cluster 7
Finland Sweden
Cluster 8
Germany
Cluster 9
Japan
dou10955_ch02_023-064.indd 36dou10955_ch02_023-064.indd 36 2/4/11 8:02 AM2/4/11 8:02 AM

Confirming Pages
Worldwide Accounting Diversity 37
THE INFLUENCE OF CULTURE ON FINANCIAL REPORTING
In addition to economic and institutional determinants, national culture has long been considered a factor that affects the accounting system of a country. 18
Hofstede’s Cultural Dimensions Using responses to an attitude survey of IBM employees worldwide, Hofstede identified four cultural dimensions that can be used to describe general similari-ties and differences in cultures around the world: (1) individualism, (2) power distance, (3) uncertainty avoidance, and (4) masculinity. 19 More recently, a fifth dimension, long-term orientation, was identified. Individualism refers to a prefer-ence for a loosely knit social fabric rather than a tightly knit social fabric (collec-tivism). Power distance refers to the extent to which hierarchy and unequal power distribution in institutions and organizations are accepted. Uncertainty avoidance refers to the degree to which individuals feel uncomfortable with uncertainty and ambiguity. Masculinity refers to an emphasis on traditional masculine values of performance and achievement rather than feminine values of relationships, car-ing, and nurturing. Long-term orientation stands for the “fostering of virtues ori-ented towards future rewards, in particular perseverance and thrift.” 20
Gray’s Accounting Values From a review of accounting literature and practice, Gray identified four widely recognized accounting values that can be used to define a country’s account-ing subculture: professionalism, uniformity, conservatism, and secrecy. 21 Gray describes these accounting values as follows: 22
Professionalism versus Statutory Control —a preference for the exercise of individual professional judgment and the maintenance of professional self- regulation as opposed to compliance with prescriptive legal requirements and statutory control.
Uniformity versus Flexibility —a preference for the enforcement of uniform accounting practices between companies and for the consistent use of such practices over time as opposed to flexibility in accordance with the perceived circumstances of individual companies.
Conservatism versus Optimism —a preference for a cautious approach to mea-surement so as to cope with the uncertainty of future events as opposed to a more optimistic, laissez-faire, risk-taking approach.
Secrecy versus Transparency —a preference for confidentiality and the restriction of disclosure of information about the business only to those who are closely involved with its management and financing as opposed to a more transpar-ent, open, and publicly accountable approach.
18 One of the first to argue that accounting is determined by culture was W. J. Violet in “The Develop-ment of International Accounting Standards: An Anthropological Perspective,” International Journal of Accounting, 1983, pp. 1–12.
19 G. Hofstede, Culture’s Consequences: International Differences in Work-Related Values (London: Sage, 1980).
20 G. Hofstede, Culture’s Consequences: Comparing Values, Behaviours, Institutions, and Organizations across Nations, 2nd ed. (Thousand Oaks, CA: Sage, 2001), p. 359.
21 S. J. Gray, “Towards a Theory of Cultural Influence on the Development of Accounting Systems Inter-nationally,” Abacus, March 1988, pp. 1–15.
22 Ibid., p. 8.
dou10955_ch02_023-064.indd 37dou10955_ch02_023-064.indd 37 2/4/11 8:02 AM2/4/11 8:02 AM

Confirming Pages
38 Chapter Two
Gray argues that national culture values affect accounting values, as shown in Exhibit 2.7 . The accounting values of conservatism and secrecy have the greatest relevance for the information content of a set of financial statements. The rela-tionship between culture and each of these two accounting values is explained as follows:
Conservatism can be linked perhaps most closely with the uncertainty-avoidance dimension and the short-term versus long-term orientations. A preference for more conservative measures of profits and assets is consistent with strong uncertainty avoidance following from a concern with security and a perceived need to adopt a cautious approach to cope with uncertainty of future events. A less conservative approach to measurement is also consistent with a short-term orientation where quick results are expected and hence a more optimistic approach is adopted relative to conserving resources and investing for long-term trends. There also seems to be a link, if less strong, between high levels of individualism and masculinity, on the one hand, and weak uncertainty avoidance on the other, to the extent that an emphasis on individual achievement and performance is likely to foster a less conservative approach to measurement. 23
A preference for secrecy is consistent with strong uncertainty avoidance following from a need to restrict information disclosures so as to avoid conflict and compe-tition and to preserve security. . . . [H]igh power-distance societies are likely to be characterized by the restriction of information to preserve power inequalities. Secrecy is also consistent with a preference for collectivism, as opposed to individu-alism, in that its concern is for the interests of those closely involved with the firm rather than external parties. A long-term orientation also suggests a preference for secrecy that is consistent with the need to conserve resources within the firm and ensure that funds are available for investment relative to the demands of sharehold-ers and employees for higher payments. A significant but possibly less important link with masculinity also seems likely to the extent that in societies where there is more emphasis on achievement and material success there will be a greater ten-dency to publicize such achievements and material success. 24
Gray extended Hofstede’s model of cultural patterns to develop a framework that identifies the mechanism through which culture influences the development of corporate reporting systems on a national level. According to this framework (shown in Exhibit 2.8 ), the particular way in which a country’s accounting system
EXHIBIT 2.7 Relationships between Accounting Values and Cultural Dimensions
Source: Lee H. Radebaugh and Sidney J. Gray, Inter-national Accounting and Multinational Enterprises, 5th ed. (New York: Wiley, 2001), p. 49.
Accounting Values
Cultural Dimension Professionalism Uniformity Conservatism Secrecy
Power distance Neg. Pos. n/a Pos.Uncertainty avoidance Neg. Pos. Pos. Pos.Individualism Pos. Neg. Neg. Neg.Masculinity Pos. n/a Neg. Neg.Long-term orientation Neg. n/a Pos. Pos.
Pos. = Positive relationship hypothesized between cultural dimension and accounting value.Neg. = Negative relationship hypothesized between cultural dimension and accounting value.n/a = No relationship hypothesized.
23 Lee H. Radebaugh and Sidney J. Gray, International Accounting and Multinational Enterprises, 5th ed. (New York: Wiley, 2001), p. 47.
24 Ibid., p. 48.
dou10955_ch02_023-064.indd 38dou10955_ch02_023-064.indd 38 2/4/11 8:02 AM2/4/11 8:02 AM

Confirming Pages
Worldwide Accounting Diversity 39
develops is influenced by accountants’ accounting values and by the country’s institutional framework, both of which are influenced by cultural values. Thus, culture is viewed as affecting accounting systems indirectly in two ways: through its influence on accounting values and through its institutional consequences.
Using measures of each of the cultural values for a group of 40 countries, Hofst-ede classified countries into 10 different cultural areas. The Anglo cultural area, for example, is characterized by high individualism, low uncertainty avoidance, low power distance, and moderate masculinity. Given this pattern of cultural values, Gray hypothesized that Anglo countries (which include Australia, Canada, New Zealand, the United States, and the United Kingdom) would rank relatively low on the accounting values of conservatism and secrecy (or high on optimism and high on transparency). Exhibiting the opposite pattern of cultural values, the countries of the less developed Latin cultural area (which includes countries like Colombia and Mexico) are expected to rank relatively high in conservatism and secrecy. On a scale of 1 (low secrecy) to 7 (high secrecy) and a scale of 1 (low conservatism) to 5 (high conservatism), the different cultural areas were ranked as follows:
Cultural Area Secrecy Conservatism
Anglo 1 1Nordic 2 2Asian-Colonial 2 3African 3 4More developed Latin 3 5Less developed Asian 4 4Japan 5 5Near Eastern 5 5Germanic 6 4Less developed Latin 7 5
These rankings show the strong positive relation expected to exist between secrecy and conservatism. Countries that require limited disclosures in financial statements (high secrecy) are expected to more strictly adhere to the notion of con-servatism (high conservatism) in the measurement of assets and liabilities.
A number of studies have empirically examined the relationship between Hof-stede’s cultural values and national accounting systems. 25 Although the results of this research are mixed, most studies find a relationship between cultural val-ues and disclosure consistent with Gray’s hypothesis. However, these studies are unable to determine whether culture influences disclosure through its effect on accounting values or through its effect on institutional consequences. Research results on the relationship between culture and conservatism are less conclusive.
Religion and Accounting Religion plays an important role in defining national culture in many parts of the world and can have a significant effect on business practice. Under Islam, for example, the Koran provides guidance with respect to issues such as making charitable contributions and charging interest on loans. In some Islamic countries,
25 For a comprehensive review of this literature, see T. S. Doupnik and G. T. Tsakumis, “A Review of Empirical Tests of Gray’s Framework and Suggestions for Future Research,” Journal of Accounting Litera-ture, 2004, pp. 1–48
dou10955_ch02_023-064.indd 39dou10955_ch02_023-064.indd 39 2/4/11 8:02 AM2/4/11 8:02 AM

Confirming Pages
EXHIBIT 2.8 Framework for the Development of Accounting Systems
Source: Adapted from S. J. Gray, “Towards a Theory of Cultural Influence on the Development of Accounting Systems Internationally,” Abacus, March 1988, p. 7.
Institutional ConsequencesLegal systemCorporate ownershipCapital marketsProfessional associationsEducationReligion
Cultural DimensionsIndividualismPower distanceUncertainty avoidanceMasculinity
Ecological InfluencesGeographicDemographicGenetic/hygienicHistoricalTechnologicalUrbanization
External InfluencesForces of natureTradeInvestmentConquest
Accounting ValuesProfessionalismUniformityConservatismSecrecy
Accounting SystemsAuthorityEnforcementMeasurementDisclosure
Reinforcement
40 Chapter Two
banking companies operate under Shariah, the Islamic law of human conduct derived from the Koran. Because traditional accounting rules do not cover many of the transactions carried out by Islamic financial institutions (IFIs), the Account-ing and Auditing Organization for Islamic Financial Institutions (AAOIFI), a standard-setting body based in Bahrain, has been active in developing and pro-moting Islamic accounting standards.
Based on the AAOIFI’s work, the Malaysian Accounting Standards Board (MASB) developed MASB i-1, Presentation of Financial Statements of Islamic Finan-cial Institutions, in 2001. MASB i-1 states:
The general purpose of financial statements is to provide information about the financial position, performance and cash flows of IFIs, which are useful to a wide range of users in making economic decisions. It also portrays aspects of the manage-ment’s stewardship of the resources entrusted to it. All this information, along with other information in the notes to financial statements, allows users in assessing the degree of compliance of the IFIs with the prescribed Shariah requirements (para. 10).
In developing MASB i-1, the MASB consulted with the Malaysian Central Bank’s National Shariah Council on issues relating to Shariah. In April 2004, the MASB announced that it would introduce four new Islamic accounting standards related to ijarah (leasing), zakat (income tax), takaful (insurance), and mudarabah (deferred payments).
dou10955_ch02_023-064.indd 40dou10955_ch02_023-064.indd 40 2/4/11 8:02 AM2/4/11 8:02 AM

Confirming Pages
Strength of equity-outsider financingsystem
Culture, includinginstitutionalstructures
Externalenvironment
Class of accounting
Class AAccounting for outsideshareholders
Strong equity-outsider financing
Self-sufficientType 1 culture
Class of AccountingType of Financing SystemNature of Culture
Class BAccounting for taxand creditors
Weak equity-outsider financing
Self-sufficientType 2 culture
Worldwide Accounting Diversity 41
A SIMPLIFIED MODEL OF THE REASONS FOR INTERNATIONAL DIFFERENCES IN FINANCIAL REPORTING
Sifting through the many reasons that have been hypothesized to affect inter-national differences in financial reporting, Nobes developed a model with two explanatory factors: culture and the nature of the financing system. 26 Nobes argues that the major reason for international differences in financial reporting is different purposes for that reporting. A country’s financing system is seen as the most rele-vant factor in determining the purpose of financial reporting. Specifically, whether or not a country has a strong equity financing system with large numbers of out-side shareholders will determine the nature of financial reporting in a country.
Nobes divides financial reporting systems into two classes, labeled A and B. Class A accounting systems are found in countries with strong equity–outside shareholder financing. In Class A accounting systems, measurement practices are less conservative, disclosure is extensive, and accounting practice differs from tax rules. Class A corresponds to what may be called Anglo-Saxon accounting. Class B accounting systems are found in countries with weak equity–outside shareholder financing systems. Measurement is more conservative, disclosure is not as exten-sive, and accounting practice more closely follows tax rules. Class B corresponds to Continental European accounting.
Nobes posits that culture, including institutional structures, determines the nature of a country’s financing system. Although not explicitly defined, Nobes’s notion of culture appears to go beyond the rather narrow definition used in Gray’s framework, which relies on Hofstede’s cultural dimensions. Nobes assumes (with-out explaining how) that some cultures lead to strong equity-outsider financing systems and other cultures lead to weak equity-outsider financing systems. His simplified model of reasons for international accounting differences is as follows:
26 Christopher W. Nobes, “Towards a General Model of the Reasons for International Differences in Financial Reporting,” Abacus 34, no. 2 (1998), p. 166.
Most countries in the developed world have a self-sufficient culture. For these countries, Nobes applies his model as follows:
dou10955_ch02_023-064.indd 41dou10955_ch02_023-064.indd 41 2/4/11 8:02 AM2/4/11 8:02 AM

Confirming Pages
42 Chapter Two
Many countries in the developing world are culturally dominated by another country often as a result of European colonialism. Nobes argues that culturally dominated countries use the accounting system of their dominating country regardless of the nature of the equity financing system. Thus, countries with a Type 1 culture as well as countries historically dominated by a Type 1 country use Class A accounting systems.
Examples of Countries with Class A Accounting The United Kingdom is a culturally self-sufficient Type 1 country with a strong equity-outsider system. It has an outside shareholder–oriented Class A account-ing system. New Zealand is culturally dominated by the United Kingdom. It also has a strong equity-outsider financing system, probably because of the influence of British culture. New Zealand also has a Class A accounting system. According to Nobes’s model, this can be the result of New Zealand being culturally domi-nated by the United Kingdom (a Type 1 culture country), having a strong equity-outsider financing system, or both. The African nation of Malawi has a weak equity-outsider financing system, but as a former British colony (culturally domi-nated by the United Kingdom) it has adopted a Class A accounting system even though it has a weak equity-outsider financing system.
Nobes further suggests that as the financing system in a country evolves from weak equity to strong equity, the accounting system will also evolve in the direction of Class A accounting. He cites China as an example. Finally, Nobes argues that com-panies with strong equity-outsider financing will attempt to use Class A accounting even if they are located in a Class B accounting system country. He cites the German firms Deutsche Bank and Bayer and the Swiss company Nestlé as examples.
Recent Changes in Europe The simplified model developed by Nobes appears to explain accounting develop-ments that occurred in Europe over the past two decades. Because of the desire for companies to be competitive in attracting international equity investment, sev-eral European countries (with Class B accounting systems) developed a two-tiered financial reporting system in the late 1990s. Austria, France, Germany, Italy, and Switzerland gave stock-exchange-listed companies the option to use International Financial Reporting Standards (IFRS), a Class A accounting system, in preparing their consolidated financial statements. 27 The parent company statements, which serve as the basis for taxation, continued to be prepared using local accounting rules. Large numbers of German and Swiss companies (including Deutsche Bank, Bayer, and Nestlé), in particular, availed themselves of this opportunity to use IFRS.
This desire for companies to be competitive in the international capital market ultimately led the European Commission in 2005 to require all publicly traded companies within the European Union to use IFRS in preparing consolidated financial statements. Thus, it is no longer appropriate to think in terms of all German (or all French, all Italian, etc.) companies following the traditional Conti-nental European model of accounting. Publicly traded companies in the EU now use a set of accounting standards based upon the Anglo-Saxon model of account-ing in preparing their consolidated statements. However, in most cases, privately held companies in the EU continue to use local GAAP, as do public companies in preparing parent company financial statements.
27 International Financial Reporting Standards are issued by the International Accounting Standards Board and are discussed in more detail in Chapters 3 and 4.
dou10955_ch02_023-064.indd 42dou10955_ch02_023-064.indd 42 2/4/11 8:02 AM2/4/11 8:02 AM

Confirming Pages
Worldwide Accounting Diversity 43
FURTHER EVIDENCE OF ACCOUNTING DIVERSITY
In the remainder of this chapter we provide additional evidence of some of the differences in accounting that exist across countries. We categorize accounting differences in the following manner and provide examples of each of these types of difference:
1. Differences in the financial statements included in an annual report.
2. Differences in the format used to present individual financial statements.
3. Differences in the level of detail provided in the financial statements.
4. Terminology differences.
5. Disclosures differences.
6. Recognition and measurement differences.
We illustrate these differences by considering a typical set of U.S. financial state-ments as a point of reference.
Financial Statements U.S. companies are required to include a balance sheet, income statement, and statement of cash flows in a set of financial statements. In addition, schedules explaining the changes in retained earnings and accumulated other comprehen-sive income must be presented. Many U.S. companies provide this information in a separate statement of stockholders’ equity.
Virtually all companies worldwide provide a balance sheet and an income statement in a set of financial statements. Although not universal, most countries now also require presentation of a statement of cash flows. Mexico, for example, implemented such a requirement in 2008. In addition to a balance sheet, income statement, and statement of cash flows, the Austrian firm Strabag SE includes a statement of changes in fixed assets as one of its primary financial statements. This statement provides detail on the change during the year in the historical cost of noncurrent intangible assets, tangible assets, and investment property. A state-ment of changes in noncurrent assets often also is found in financial statements prepared by German companies.
Format of Financial Statements U.S. companies list assets and liabilities on the balance sheet in order of liquidity, from most liquid (cash) to least liquid (often intangible assets). The same is true in Canada, Mexico, and Japan. Companies in many countries (including most of Europe) list assets and liabilities in reverse order of liquidity. An example was presented in Exhibit 2.1 for a British company.
In the income statement format commonly used by U.S. companies, sales rev-enue and cost of goods sold are generally reported as separate line items, the difference being gross profit. Cost of goods sold includes manufacturing costs (materials, labor, and overhead) related to those items sold during the year. In addition to cost of goods sold, selling expense, administrative expense, research and development costs, and other operating expenses are subtracted to calcu-late operating income. Each of these line items includes costs related to materi-als (including supplies), labor, and overhead. Callaway Golf Company’s income statement presented in Exhibit 2.9 illustrates the format typically used by U.S.-based companies.
dou10955_ch02_023-064.indd 43dou10955_ch02_023-064.indd 43 2/4/11 8:02 AM2/4/11 8:02 AM

Confirming Pages
44 Chapter Two
In contrast to the operational format income statement commonly found in the United States, many European companies present their income statement using a type of expenditure format. An example is presented in Exhibit 2.10 for Südzucker AG, a German sugar manufacturer. Rather than presenting cost of goods sold as a single line item, Südzucker presents separate line items for cost of materials, personnel expenses, and depreciation. The line item Personnel expenses aggregates the total amount of personnel cost incurred by the company. In contrast, Callaway Golf allocates these expenses to the various categories of operating expense (man-ufacturing, selling, administrative, research and development). Similarly, the line item Depreciation includes depreciation on manufacturing assets, as well as assets used in administration, marketing, and other departments. The second line in Südzucker’s income statement, Change in work in progress and finished goods inven-tories and internal costs capitalised, adjusts for the manufacturing costs included in Cost of materials, Personnel expenses, Depreciation, and Other operating expenses that are not part of cost of goods sold in the current year. As a result of this adjustment, the amount related to the cost of goods sold subtracted in calculating operating income is the same as if cost of goods sold had been reported as a separate line item. Although much different in appearance, the format Südzucker uses to report
EXHIBIT 2.9
CALLAWAY GOLF COMPANY Consolidated Statements of Operations
(In Thousands, Except per Share Data)
Year Ended December 31,
2009 2008 2007
Net sales . . . . . . . . . . . . . . . . . . . . . . . . . . . . . . . . . . . . . . . . . . . $950,799 $1,117,204 $1,124,591
Cost of sales . . . . . . . . . . . . . . . . . . . . . . . . . . . . . . . . . . . . . . . . . 607,036 630,371 631,368
Gross profit . . . . . . . . . . . . . . . . . . . . . . . . . . . . . . . . . . . . . . . . 343,763 486,833 493,223
Selling expenses. . . . . . . . . . . . . . . . . . . . . . . . . . . . . . . . . . . . . . . 260,597 287,802 281,960
General and administrative expenses . . . . . . . . . . . . . . . . . . . . . . . 81,487 85,473 89,060
Research and development expenses . . . . . . . . . . . . . . . . . . . . . . . 32,213 29,370 32,020
Total operating expenses . . . . . . . . . . . . . . . . . . . . . . . . . . . . . . 374,297 402,645 403,040
Income (loss) from operations . . . . . . . . . . . . . . . . . . . . . . . . . . . . (30,534) 84,188 90,183
Interest and other income, net . . . . . . . . . . . . . . . . . . . . . . . . . . . . 2,685 1,863 3,455
Interest expense. . . . . . . . . . . . . . . . . . . . . . . . . . . . . . . . . . . . . . . (1,754) (4,666) (5,363)
Change in energy derivative valuation account (Note 10) . . . . . . . . — 19,922 —
Income (loss) before income taxes . . . . . . . . . . . . . . . . . . . . . . . . . (29,603) 101,307 88,275
Income tax provision (benefit) . . . . . . . . . . . . . . . . . . . . . . . . . . . . (14,343) 35,131 33,688
Net income (loss) . . . . . . . . . . . . . . . . . . . . . . . . . . . . . . . . . . . . . . (15,260) 66,176 54,587
Dividends on convertible preferred stock . . . . . . . . . . . . . . . . . . . . 5,688 — —
Net income (loss) allocable to common stockholders . . . . . . . . . . . $ (20,948) $ 66,176 $ 54,587
Earnings (loss) per common share: . . . . . . . . . . . . . . . . . . . . . . . . .
Basic . . . . . . . . . . . . . . . . . . . . . . . . . . . . . . . . . . . . . . . . . . . . . $ (0.33) $ 1.05 $ 0.82
Diluted. . . . . . . . . . . . . . . . . . . . . . . . . . . . . . . . . . . . . . . . . . . . $ (0.33) $ 1.04 $ 0.81
Weighted-average common shares outstanding. . . . . . . . . . . . . . .
Basic . . . . . . . . . . . . . . . . . . . . . . . . . . . . . . . . . . . . . . . . . . . . . 63,176 63,055 66,371
Diluted. . . . . . . . . . . . . . . . . . . . . . . . . . . . . . . . . . . . . . . . . . . . 63,176 63,798 67,484
dou10955_ch02_023-064.indd 44dou10955_ch02_023-064.indd 44 2/4/11 8:02 AM2/4/11 8:02 AM

Confirming Pages
Worldwide Accounting Diversity 45
income from operations does not affect the amount reported. The amount is the same regardless of whether the company uses the type of expenditure format or the cost of goods sold format.
The income statement prepared by Mexican companies includes a section gen-erally not found in other countries. Exhibit 2.11 presents the income statement for Cemex S.A.B. de C.V., the world’s largest supplier of building materials. After reporting Operating income, Cemex provides a calculation of Comprehensive financ-ing result that includes interest income and expense, gains and losses on financial instruments, foreign currency gains and losses, and the Monetary position result, which is a measure of the purchasing power gain or loss associated with holding monetary assets and liabilities during a period of inflation.
Most companies present operating profit, pretax income, and net income as measures of performance in their income statement. Exhibit 2.12 shows the income statement for Sol Meliá SA, a Spanish hotel chain, which provides several other and different measures of performance. The first performance measure reflected in Sol Meliá’s income statement is EBITDAR (earnings before interest, tax, depre-ciation, amortization, and rent expenses), which is then followed by EBITDA (EBITDAR minus rent expense), and then EBIT (EBITDA minus depreciation and amortization expense).
EXHIBIT 2.10
SÜDZUCKER AG Consolidated Income Statement
1 March 2009 to 28 February 2010
€ million Note 2009/10 2008/09
Income statement
Revenues 6 5,718.2 5,871.3
Change in work in progress and finished goods inventories and internal costs capitalised . . . . . . . . . . . . . . . . . . . . . . . . . . . 7 −256.1 −277.0
Other operating income. . . . . . . . . . . . . . . . . . . . . . . . . . . . . . . . . 8 157.9 238.5
Cost of materials . . . . . . . . . . . . . . . . . . . . . . . . . . . . . . . . . . . . . . 9 −3,445.1 −3,449.1
Personnel expenses . . . . . . . . . . . . . . . . . . . . . . . . . . . . . . . . . . . . 10 −671.8 −662.8
Depreciation . . . . . . . . . . . . . . . . . . . . . . . . . . . . . . . . . . . . . . . . . 11 −256.7 −249.7
Other operating expenses . . . . . . . . . . . . . . . . . . . . . . . . . . . . . . . 12 −854.0 −1,125.9
Income from operations . . . . . . . . . . . . . . . . . . . . . . . . . . . . . . . 13 392.4 345.3
Income from associated companies . . . . . . . . . . . . . . . . . . . . . . . . 14 2.0 21.6
Financial income . . . . . . . . . . . . . . . . . . . . . . . . . . . . . . . . . . . . . . 15 115.8 67.2
Financial expense . . . . . . . . . . . . . . . . . . . . . . . . . . . . . . . . . . . . . . 15 −161.8 −202.2
Earnings before income taxes . . . . . . . . . . . . . . . . . . . . . . . . . . 348.4 231.9
Taxes on income . . . . . . . . . . . . . . . . . . . . . . . . . . . . . . . . . . . . . . 16 −72.0 −48.7
Net earnings for the year . . . . . . . . . . . . . . . . . . . . . . . . . . . . . . 18 276.4 183.2
of which attributable to Südzucker AG shareholders . . . . . . . . . 200.1 162.2
of which attributable to hybrid capital . . . . . . . . . . . . . . . . . . . . 26.2 26.2
of which attributable to minority interests . . . . . . . . . . . . . . . . . 50.1 −5.2
Earnings per share (€). . . . . . . . . . . . . . . . . . . . . . . . . . . . . . . . . 18 1.06 0.86
Undiluted. . . . . . . . . . . . . . . . . . . . . . . . . . . . . . . . . . . . . . . . . . −0.02 0.00
Diluted. . . . . . . . . . . . . . . . . . . . . . . . . . . . . . . . . . . . . . . . . . . . 1.04 0.86
dou10955_ch02_023-064.indd 45dou10955_ch02_023-064.indd 45 2/4/11 8:02 AM2/4/11 8:02 AM
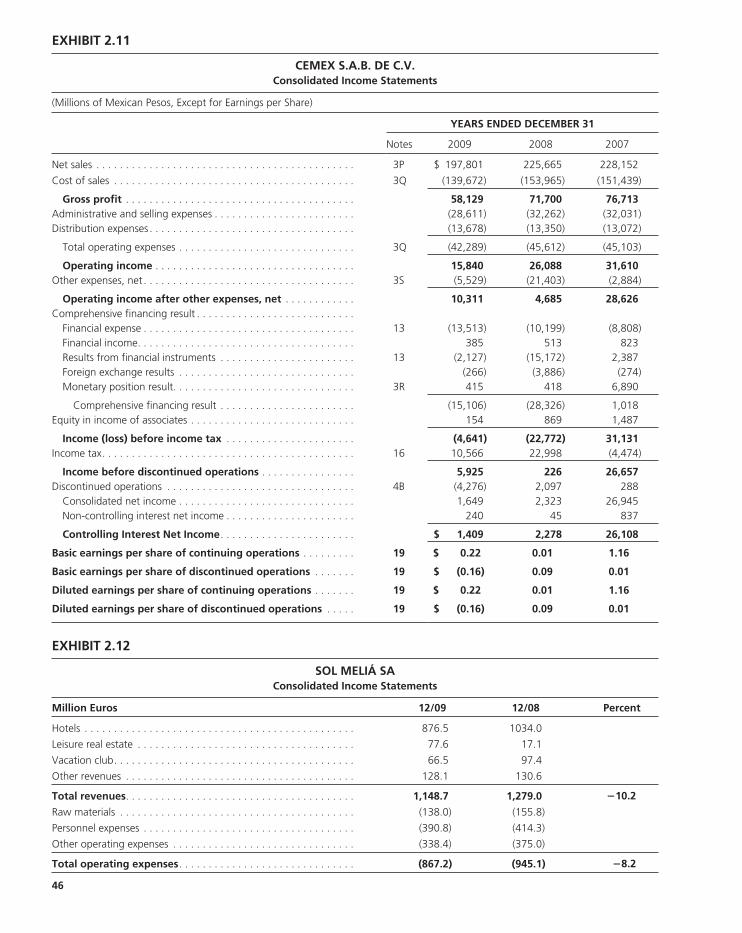
Confirming Pages
46
EXHIBIT 2.11
CEMEX S.A.B. DE C.V. Consolidated Income Statements
(Millions of Mexican Pesos, Except for Earnings per Share)
YEARS ENDED DECEMBER 31
Notes 2009 2008 2007
Net sales . . . . . . . . . . . . . . . . . . . . . . . . . . . . . . . . . . . . . . . . . . . . 3P $ 197,801 225,665 228,152
Cost of sales . . . . . . . . . . . . . . . . . . . . . . . . . . . . . . . . . . . . . . . . . 3Q (139,672) (153,965) (151,439)
Gross profit . . . . . . . . . . . . . . . . . . . . . . . . . . . . . . . . . . . . . . . 58,129 71,700 76,713Administrative and selling expenses . . . . . . . . . . . . . . . . . . . . . . . . (28,611) (32,262) (32,031)Distribution expenses . . . . . . . . . . . . . . . . . . . . . . . . . . . . . . . . . . . (13,678) (13,350) (13,072)
Total operating expenses . . . . . . . . . . . . . . . . . . . . . . . . . . . . . . 3Q (42,289) (45,612) (45,103)
Operating income . . . . . . . . . . . . . . . . . . . . . . . . . . . . . . . . . . 15,840 26,088 31,610Other expenses, net . . . . . . . . . . . . . . . . . . . . . . . . . . . . . . . . . . . . 3S (5,529) (21,403) (2,884)
Operating income after other expenses, net . . . . . . . . . . . . 10,311 4,685 28,626Comprehensive financing result . . . . . . . . . . . . . . . . . . . . . . . . . . . Financial expense . . . . . . . . . . . . . . . . . . . . . . . . . . . . . . . . . . . . 13 (13,513) (10,199) (8,808) Financial income. . . . . . . . . . . . . . . . . . . . . . . . . . . . . . . . . . . . . 385 513 823 Results from financial instruments . . . . . . . . . . . . . . . . . . . . . . . 13 (2,127) (15,172) 2,387 Foreign exchange results . . . . . . . . . . . . . . . . . . . . . . . . . . . . . . (266) (3,886) (274) Monetary position result. . . . . . . . . . . . . . . . . . . . . . . . . . . . . . . 3R 415 418 6,890
Comprehensive financing result . . . . . . . . . . . . . . . . . . . . . . . (15,106) (28,326) 1,018Equity in income of associates . . . . . . . . . . . . . . . . . . . . . . . . . . . . 154 869 1,487
Income (loss) before income tax . . . . . . . . . . . . . . . . . . . . . . (4,641) (22,772) 31,131Income tax. . . . . . . . . . . . . . . . . . . . . . . . . . . . . . . . . . . . . . . . . . . 16 10,566 22,998 (4,474)
Income before discontinued operations . . . . . . . . . . . . . . . . 5,925 226 26,657Discontinued operations . . . . . . . . . . . . . . . . . . . . . . . . . . . . . . . . 4B (4,276) 2,097 288 Consolidated net income . . . . . . . . . . . . . . . . . . . . . . . . . . . . . . 1,649 2,323 26,945 Non-controlling interest net income . . . . . . . . . . . . . . . . . . . . . . 240 45 837
Controlling Interest Net Income. . . . . . . . . . . . . . . . . . . . . . . $ 1,409 2,278 26,108
Basic earnings per share of continuing operations . . . . . . . . . 19 $ 0.22 0.01 1.16
Basic earnings per share of discontinued operations . . . . . . . 19 $ (0.16) 0.09 0.01
Diluted earnings per share of continuing operations . . . . . . . 19 $ 0.22 0.01 1.16
Diluted earnings per share of discontinued operations . . . . . 19 $ (0.16) 0.09 0.01
EXHIBIT 2.12
SOL MELIÁ SA Consolidated Income Statements
Million Euros 12/09 12/08 Percent
Hotels . . . . . . . . . . . . . . . . . . . . . . . . . . . . . . . . . . . . . . . . . . . . . . 876.5 1034.0
Leisure real estate . . . . . . . . . . . . . . . . . . . . . . . . . . . . . . . . . . . . . 77.6 17.1
Vacation club. . . . . . . . . . . . . . . . . . . . . . . . . . . . . . . . . . . . . . . . . 66.5 97.4
Other revenues . . . . . . . . . . . . . . . . . . . . . . . . . . . . . . . . . . . . . . . 128.1 130.6
Total revenues. . . . . . . . . . . . . . . . . . . . . . . . . . . . . . . . . . . . . . . 1,148.7 1,279.0 −10.2
Raw materials . . . . . . . . . . . . . . . . . . . . . . . . . . . . . . . . . . . . . . . . (138.0) (155.8)
Personnel expenses . . . . . . . . . . . . . . . . . . . . . . . . . . . . . . . . . . . . (390.8) (414.3)
Other operating expenses . . . . . . . . . . . . . . . . . . . . . . . . . . . . . . . (338.4) (375.0)
Total operating expenses. . . . . . . . . . . . . . . . . . . . . . . . . . . . . . (867.2) (945.1) −8.2
dou10955_ch02_023-064.indd 46dou10955_ch02_023-064.indd 46 2/4/11 8:02 AM2/4/11 8:02 AM

Confirming Pages
Worldwide Accounting Diversity 47
Level of Detail Differences exist in the level of detail provided in the individual financial state-ments. U.S. companies tend to provide relatively few line items on the face of the financial statements and then supplement these with additional detail in the notes. Callaway Golf’s income statement presented in Exhibit 2.9 is a case in point. The level of detail provided by U.S.-based companies can be contrasted with the extremely detailed income statement provided by Thai Airways International Public Company Limited as shown in Exhibit 2.13 . Instead of reporting operating expenses in only three line items as does Callaway Golf, Thai Airways presents 15 separate categories of operating expense. Even though considerable detail is provided on the face of the income statement, additional information is included in the notes to provide further detail on those line items labeled as Other. For example, Note 8.23 Other Income—Others, indicates that this line on the income statement includes gains on sales of assets, revenue from airport fees collected from passengers, and compensation revenue from the delayed delivery of aircraft.
Terminology The examination of Vodafone PLC’s balance sheet earlier in this chapter revealed a number of differences in the terminology used by Vodafone and a typical U.S. company. New Zealand–based Fletcher Building Group includes the following current assets on its balance sheet: Cash and liquid deposits, Current tax asset, Debtors, and Stocks. A “translation” of these terms into terminology commonly used in the United States would be: Cash and cash equivalents, Taxes receivable, Accounts receivable, and Inventories. Many non-English-language companies translate their annual reports into English for the convenience of English speak-ers. These companies typically choose between the British and the American for-mats and terminology in preparing convenience translations. Occasionally terms unfamiliar to both British and U.S. accounting are found in English language reports to reflect business, legal, or accounting practice unique to a specific coun-try. For example, the Brazilian petrochemical firm, Braskem SA, includes the line
EBITDAR . . . . . . . . . . . . . . . . . . . . . . . . . . . . . . . . . . . . . . . . . . . . 281.5 333.9 −15.7
Rental expenses . . . . . . . . . . . . . . . . . . . . . . . . . . . . . . . . . . . . . . . (79.4) (77.2)
EBITDA . . . . . . . . . . . . . . . . . . . . . . . . . . . . . . . . . . . . . . . . . . . . . 202.1 256.7 −21.3
Depreciation and amortization . . . . . . . . . . . . . . . . . . . . . . . . . . . . (96.9) (97.5)
EBIT . . . . . . . . . . . . . . . . . . . . . . . . . . . . . . . . . . . . . . . . . . . . . . . 105.2 159.2 −34.0
Net interest expense . . . . . . . . . . . . . . . . . . . . . . . . . . . . . . . . . . . (27.7) (71.0)
Exchange rate differences . . . . . . . . . . . . . . . . . . . . . . . . . . . . . . . 1.1 (9.1)
Other interest expense . . . . . . . . . . . . . . . . . . . . . . . . . . . . . . . . . . (11.8) (11.7)
Total financial profit/(Ioss). . . . . . . . . . . . . . . . . . . . . . . . . . . . . (38.5) (91.8) 58.1
Profit/(Ioss) from equity investments. . . . . . . . . . . . . . . . . . . . . . . . (12.8) (6.6)
Continuing earnings before taxes . . . . . . . . . . . . . . . . . . . . . . . 53.9 (98.3) −154.8
Discontinuing operations . . . . . . . . . . . . . . . . . . . . . . . . . . . . . . . . 0.0 0.0
Profit before taxes and minorities. . . . . . . . . . . . . . . . . . . . . . . 53.9 60.9 −11.5
Taxes . . . . . . . . . . . . . . . . . . . . . . . . . . . . . . . . . . . . . . . . . . . . . . . (10.4) (6.3)
Group net profit/(Ioss) . . . . . . . . . . . . . . . . . . . . . . . . . . . . . . . . 43.5 54.6 −20.4
Minorities (P)/L . . . . . . . . . . . . . . . . . . . . . . . . . . . . . . . . . . . . . . . . (5.4) (3.4)
Profit/loss of the parent company. . . . . . . . . . . . . . . . . . . . . . . 38.1 51.2 −25.6
dou10955_ch02_023-064.indd 47dou10955_ch02_023-064.indd 47 2/4/11 8:02 AM2/4/11 8:02 AM

Confirming Pages
48
EXHIBIT 2.13
THAI AIRWAYS INTERNATIONAL PUBLIC COMPANY LIMITED Consolidated Income Statements
For the years ended December 31, 2009 and 2008 Units: Baht
CONSOLIDATED
Notes 2009 2008
Revenues
Revenues from sale or revenues from services
Passenger and excess baggage. . . . . . . . . . . . . . . . . . . . . . . . . . . . 134,479,296,254 164,318,701,819
Freight . . . . . . . . . . . . . . . . . . . . . . . . . . . . . . . . . . . . . . . . . . . . . . 18,525,307,811 25,840,755,700
Mail . . . . . . . . . . . . . . . . . . . . . . . . . . . . . . . . . . . . . . . . . . . . . . . . 822,754,186 912,990,339
Other activities. . . . . . . . . . . . . . . . . . . . . . . . . . . . . . . . . . . . . . . . 7,775,384,234 9,045,532,774
Total revenues from sale or revenues from services . . . . . . . . 161,602,742,485 200,117,980,632
Other income
Interest income . . . . . . . . . . . . . . . . . . . . . . . . . . . . . . . . . . . . . . . 178,067,252 493,287,861
Others . . . . . . . . . . . . . . . . . . . . . . . . . . . . . . . . . . . . . . . . . . . . . . 8.23 2,093,717,478 1,994,352,142
Total other income . . . . . . . . . . . . . . . . . . . . . . . . . . . . . . . . . . . 2,271,784,730 2,487,640,003
Total revenues. . . . . . . . . . . . . . . . . . . . . . . . . . . . . . . . . . . . . . . 163,874,527,215 202,605,620,635
Expenses
Fuel and oil . . . . . . . . . . . . . . . . . . . . . . . . . . . . . . . . . . . . . . . . . . 47,014,753,162 89,459,872,853
Personnel. . . . . . . . . . . . . . . . . . . . . . . . . . . . . . . . . . . . . . . . . . . . 26,191,239,889 30,534,030,465
Management benefit expenses . . . . . . . . . . . . . . . . . . . . . . . . . . . 8.22 60,916,443 93,395,719
Flight service expenses . . . . . . . . . . . . . . . . . . . . . . . . . . . . . . . . . . 17,691,615,362 19,938,599,141
Crew expenses. . . . . . . . . . . . . . . . . . . . . . . . . . . . . . . . . . . . . . . . 5,243,530,868 6,542,134,756
Aircraft maintenance and overhaul costs . . . . . . . . . . . . . . . . . . . . 10,320,750,374 10,847,783,197
Depreciation and amortisation expenses . . . . . . . . . . . . . . . . . . . . 21,023,460,156 20,281,081,576
Lease of aircraft and spare parts. . . . . . . . . . . . . . . . . . . . . . . . . . . 1,531,697,470 3,650,964,476
Inventories and supplies . . . . . . . . . . . . . . . . . . . . . . . . . . . . . . . . . 8,496,583,764 8,826,777,548
Selling and advertising expenses . . . . . . . . . . . . . . . . . . . . . . . . . . 6,221,182,125 6,932,244,544
Insurance expenses . . . . . . . . . . . . . . . . . . . . . . . . . . . . . . . . . . . . 760,064,787 751,270,159
Damages arising from Antitrust / Competition Law . . . . . . . . . . . . . 8.18.5 — 4,290,169,870
Impairment losses of assets . . . . . . . . . . . . . . . . . . . . . . . . . . . . . . 529,056,765 4,749,840,736
Other expenses . . . . . . . . . . . . . . . . . . . . . . . . . . . . . . . . . . . . . . . 8.24 8,103,657,883 9,285,303,024
Losses (gains) on foreign currency exchange . . . . . . . . . . . . . . . . . (3,167,360,443) 4,471,388,154
Total expenses . . . . . . . . . . . . . . . . . . . . . . . . . . . . . . . . . . . . . . 150,021,148,605 220,654,856,218
Share of losses (profits) of investments by the equity method. . . . . 8,562,792 65,137,572
Profits (losses) before finance costs and income tax expenses. . . . . . . . . . . . . . . . . . . . . . . . . . . . . . . . 13,844,815,818 (18,114,373,155)
Finance costs . . . . . . . . . . . . . . . . . . . . . . . . . . . . . . . . . . . . . . . . . 5,737,562,830 5,485,264,531
Profits (losses) before income tax expenses. . . . . . . . . . . . . . . 8,107,252,988 (23,599,637,686)
Net tax expenses (tax income) . . . . . . . . . . . . . . . . . . . . . . . . . . . . 8.25 691,425,974 (2,285,253,584)
Net profits (losses) . . . . . . . . . . . . . . . . . . . . . . . . . . . . . . . . . . . 7,415,827,014 (21,314,384,102)
Profits (losses) attributable to:
Equity holders of the parent . . . . . . . . . . . . . . . . . . . . . . . . . 7,343,578,865 (21,379,451,415)
Minority interests . . . . . . . . . . . . . . . . . . . . . . . . . . . . . . . . . . . . . . 72,248,149 65,067,313
7,415,827,014 (21,314,384,102)
Basic earnings per share. . . . . . . . . . . . . . . . . . . . . . . . . . . . . . . 8.27
Net profits (losses) per share . . . . . . . . . . . . . . . . . . . . . . . . . . . . . 4.32 (12.58)
dou10955_ch02_023-064.indd 48dou10955_ch02_023-064.indd 48 2/4/11 8:02 AM2/4/11 8:02 AM

Confirming Pages
Worldwide Accounting Diversity 49
item Judicial deposits and compulsory loan as an asset on it balance sheet. Note 11 discloses that the judicial deposits relate to Tax contingencies and Labor and other claims, but provides no further information with regard to this asset. SK Telecom includes a noncurrent asset on its balance sheet called Guarantee deposits, which represents the amount of cash that customers have paid as a deposit to initiate telephone service. Among its current liabilities, SK Telecom reports the line item Withholdings, with no further explanation as to what this might be.
Disclosure Numerous differences exist across countries in the amount and types of informa-tion disclosed in a set of financial statements. Many of the disclosures provided by companies are required by law or other regulations. In addition, many com-panies around the world provide additional, voluntary disclosures often to better compete in obtaining finance in the international capital markets. The disclosures required to be made by publicly traded companies in the United States gener-ally are considered to be the most extensive in the world. Saudagaran and Bid-dle developed a ranking of the level of disclosure required by stock exchanges in eight major countries (see Exhibit 2.14 ). Consistent with Gray’s expectations with respect to secrecy the Anglo countries rank 1, 2, and 3 in the amount of disclosure provided, whereas the Germanic countries rank 7 and 8.
One must be careful in generalizing these disclosure rankings to all companies within a country. For example, the Swiss banking firm UBS AG provides exten-sive notes (108 pages in length) to its consolidated financial statements that are similar in scope and content to what is found in the annual reports of Anglo com-panies. The same can be said for other Swiss multinational corporations as well as for many multinationals in other non-Anglo countries.
There are an infinite number of differences that can exist in the disclosures pro-vided by companies. To illustrate the wide diversity, we provide several exam-ples of disclosures uncommon in the United States and most other countries. The Swedish appliance manufacturer AB Electrolux includes a note in its financial statements titled Employees and Remuneration (see Exhibit 2.15 ). This note reports the number of employees, their gender, and their total remuneration by geo-graphical area. By splitting total remuneration into the amount paid to boards and senior managers and the amount paid to other employees, the statement allows interested readers to see that it is the latter group that receives the vast majority of compensation.
The Brazilian mining company Vale includes a social report in the notes to its financial statements (see Exhibit 2.16 ). The report is based on a model developed by the Federal Accounting Board of Brazil (CFC) and highlights the investments
Country Overall Disclosure Level Rank
United States . . . . . . . . . . . . . . . . . . . . . . . . . . . 7.28 1Canada. . . . . . . . . . . . . . . . . . . . . . . . . . . . . . . . 6.41 2United Kingdom . . . . . . . . . . . . . . . . . . . . . . . . . 6.02 3Netherlands . . . . . . . . . . . . . . . . . . . . . . . . . . . . 4.75 4France . . . . . . . . . . . . . . . . . . . . . . . . . . . . . . . . 4.17 5Japan . . . . . . . . . . . . . . . . . . . . . . . . . . . . . . . . . 3.83 6Germany . . . . . . . . . . . . . . . . . . . . . . . . . . . . . . 3.81 7Switzerland. . . . . . . . . . . . . . . . . . . . . . . . . . . . . 3.17 8
EXHIBIT 2.14Stock Market Disclosure Levels
Source: S. M. Saudagaran and G. C. Biddle, “Foreign Listing Location: A Study of MNCS and Stock Exchanges in Eight Countries,” Journal of International Business Stud-ies, Second Quarter 1995, p. 331.
dou10955_ch02_023-064.indd 49dou10955_ch02_023-064.indd 49 2/4/11 8:02 AM2/4/11 8:02 AM

Confirming Pages
50 Chapter Two
Salaries and remuneration by geographical area for Board members, senior managers and other employees
2009 2008
Boards members and senior managers
Other employees Total
Boards members and senior managers
Other employees Total
Sweden
Parent Company . . . . . . . . . . 48 716 764 47 779 826
Other. . . . . . . . . . . . . . . . . . . 8 201 209 5 230 235
Total Sweden . . . . . . . . . . . 56 917 973 52 1,009 1,061
EU, excluding Sweden . . . . . . 99 5,797 5,896 88 5,765 5,853
Rest of Europe . . . . . . . . . . . . 10 768 778 10 700 710
North America . . . . . . . . . . . . 18 3,360 3,378 21 3,070 3,091
Latin America. . . . . . . . . . . . . 35 1,094 1,129 38 951 989
Asia . . . . . . . . . . . . . . . . . . . . 14 326 340 12 428 440
Pacific . . . . . . . . . . . . . . . . . . 4 641 645 1 498 499
Africa. . . . . . . . . . . . . . . . . . . 2 21 23 3 16 19
Total outside Sweden. . . . . 182 12,007 12,189 173 11,428 12,843
Group total . . . . . . . . . . . . . 238 12,924 13,162 225 12,437 13,987
Of the Board members in the Group, 77 were men and 12 were women, of whom 7 men and 4 women were in the Parent Company. Senior managers in the Group consisted of 186 men and 40 women, of whom 9 men and 3 women in the Parent Company. The total pension cost for Board members and senior man-agers in the Group amounted to 37m (48) in 2009.
Salaries, other remuneration and employer contributions
2009 2008
Salaries and remuneration
Employer contributions Total
Salaries and remuneration
Employer contributions Total
Parent Company . . . . . . . . . . 764 562 1,326 826 657 1,483
(whereof pension costs) . . . . . . . . . . . . . . . (159)1) (159)1) (259)1) (259)1)
Subsidiaries . . . . . . . . . . . . . . 12,398 3,477 15,875 11,836 3,695 15,531
(whereof pension costs) . . . . . . . . . . . . . . . (718) (718) (687) (687)
Group total . . . . . . . . . . . . . 13,162 4,039 17,201 12,662 4,352 17,014
(whereof pension costs). . . . . . . . . . . . . . . (877) (877) (946) (946)
1) Includes SEK 14m (20), referring to the President and his predecessors.
EXHIBIT 2.15
AB ELECTROLUX Excerpt from Note 27 Employees and Remuneration
Notes, all amounts in SEKm, unless otherwise stated
In 2009, the average number of employees for continuing operations was 50,633 (55,177), of whom 32,955 (35,562) were men and 17,678 (19,615) were women.
Average number of employees, by geographical area
Group
2009 2008
Europe. . . . . . . . . . . . . . . 25,292 28,138
North America . . . . . . . . . 10,384 11,398
Rest of world . . . . . . . . . . 14,957 15,641
Total . . . . . . . . . . . . . . . . 50,633 55,177
dou10955_ch02_023-064.indd 50dou10955_ch02_023-064.indd 50 2/4/11 8:02 AM2/4/11 8:02 AM

Confirming Pages
Worldwide Accounting Diversity 51
EXHIBIT 2.16
VALE SA Social Report
Consolidated
Basis for Calculations 2009 2008
Gross revenue . . . . . . . . . . . 49,812 72,766
Operating income before financial results and equity results . . . . . . . 13,181 27,400
Gross payroll . . . . . . . . . . . . 2,549 4,422
% of % of
Labor Indicators Amount PayrollOperating
Income Amount PayrollOperating
Income
Nutrition . . . . . . . . . . . . . . . 295 12% 2% 307 7% 1%
Compulsory payroll charges. . . . . . . . . . . . . . . 792 31% 6% 892 20% 3%
Transportation . . . . . . . . . . . 159 6% 1% 152 3% 1%
Pension plan. . . . . . . . . . . . . 208 8% 2% 431 10% 2%
Health . . . . . . . . . . . . . . . . . 339 13% 3% 297 7% 1%
Education. . . . . . . . . . . . . . . 105 4% 1% 174 4% 1%
Nursey . . . . . . . . . . . . . . . . . 3 — — 2 — —
Employee profit sharing plan . . . . . . . . . . . 868 34% 7% 548 12% 2%
Other . . . . . . . . . . . . . . . . . . 82 3% 1% 124 3% —
Total—Labor Indicators 2,855 112% 22% 2,927 66% 11%
% of % of
Social Indicators AmountOperating
IncomeNet Operating
revenue AmountOperating
IncomeNet Operating
revenue
Taxes (excluding payroll charges) . . . . . . . . 5,810 44% 12% 5,274 19% 7%
Taxes paid recover . . . . . . . . (571) −4% −1% (1,955) −7% −3%
Citizenship investments . . . . . . . . . . . — — — 409 1% 1%
Social actions and projects. . . . . . . . . . . . . 370 3% 1% 390 1% 1%
Culture . . . . . . . . . . . . . . . 100 3% 1% 102 — —
Native community. . . . . . . 19 — — 19 — —
Environmental investments . . . . . . . . . . . 1,397 11% 3% 808 3% 1%
Total-Social indicators 7,207 55% 14% 6,491 24% 9%
Workforce indicators . . . . . .
Number of employees at the end of the period . . 60,036 62,490
Number of admittances during the period . . . . . 2,633 7,673
dou10955_ch02_023-064.indd 51dou10955_ch02_023-064.indd 51 2/4/11 8:02 AM2/4/11 8:02 AM

Confirming Pages
52 Chapter Two
made by the company with respect to human resources, the environment, and social projects. In its Brazilian GAAP financial statements, Vale also presents a statement of added value (see Exhibit 2.17 ) that provides insight into the groups that benefit most from the company’s existence. Employees and the government received the largest distributions of added value by the company in 2009. The social report indicates among other things the costs in addition to gross payroll the company incurs related to its labor force. These include costs related to food, health, education, and profit sharing. In 2009, these costs amounted to 112 percent of gross payroll, with the largest amounts going to compulsory payroll charges and profit sharing.
VALE SAStatement of Added Value
Period Ended In Millions of Reals
Consolidated
2009 2008
Generation of added value
Gross revenue
Revenue from products and services. . . . . . . . . . . . . . . . . . . . . . . . . . . . . . . . . . . . . . . . . 49,812 72,766
Revenue from the construction of own assets. . . . . . . . . . . . . . . . . . . . . . . . . . . . . . . . . . 13,919 17,706
Allowance for doubtful accounts . . . . . . . . . . . . . . . . . . . . . . . . . . . . . . . . . . . . . . . . . . . (23) (32)
Less: Acquisition of products . . . . . . . . . . . . . . . . . . . . . . . . . . . . . . . . . . . . . . . . . . . . . . . . (1,219) (2,805)
Outsourced services . . . . . . . . . . . . . . . . . . . . . . . . . . . . . . . . . . . . . . . . . . . . . . . . . . . (6,242) (8,244)
Materials . . . . . . . . . . . . . . . . . . . . . . . . . . . . . . . . . . . . . . . . . . . . . . . . . . . . . . . . . . . (20,653) (23,958)
Fuel oil and gas. . . . . . . . . . . . . . . . . . . . . . . . . . . . . . . . . . . . . . . . . . . . . . . . . . . . . . . (2,777) (3,761)
Energy . . . . . . . . . . . . . . . . . . . . . . . . . . . . . . . . . . . . . . . . . . . . . . . . . . . . . . . . . . . . . (1,776) (2,052)
Impairment. . . . . . . . . . . . . . . . . . . . . . . . . . . . . . . . . . . . . . . . . . . . . . . . . . . . . . . . . . — (2,447)
Other costs . . . . . . . . . . . . . . . . . . . . . . . . . . . . . . . . . . . . . . . . . . . . . . . . . . . . . . . . . . (6,920) (6,829)
Gross added value . . . . . . . . . . . . . . . . . . . . . . . . . . . . . . . . . . . . . . . . . . . . . . . . . . . . . . 24,121 40,344
Depreciation, amortization and depletion. . . . . . . . . . . . . . . . . . . . . . . . . . . . . . . . . . . . . . . (5,447) (5,112)
Net added value . . . . . . . . . . . . . . . . . . . . . . . . . . . . . . . . . . . . . . . . . . . . . . . . . . . . . . . . 18,674 35,232
Received from third parties
Financial revenue . . . . . . . . . . . . . . . . . . . . . . . . . . . . . . . . . . . . . . . . . . . . . . . . . . . . . . . 866 1,221
Equity results . . . . . . . . . . . . . . . . . . . . . . . . . . . . . . . . . . . . . . . . . . . . . . . . . . . . . . . . . . 116 (1,325)
Total added value to be distributed . . . . . . . . . . . . . . . . . . . . . . . . . . . . . . . . . . . . . . . . 19,656 35,128
Personnel . . . . . . . . . . . . . . . . . . . . . . . . . . . . . . . . . . . . . . . . . . . . . . . . . . . . . . . . . . . . . 5,086 5,046
Taxes, rates and contribution . . . . . . . . . . . . . . . . . . . . . . . . . . . . . . . . . . . . . . . . . . . . . . 5,810 5,267
Taxes paid recover . . . . . . . . . . . . . . . . . . . . . . . . . . . . . . . . . . . . . . . . . . . . . . . . . . . . . . (571) (1,955)
Remuneration on third party’s capital . . . . . . . . . . . . . . . . . . . . . . . . . . . . . . . . . . . . . . . . 3,433 4,157
Inflation and exchange rate variation, net. . . . . . . . . . . . . . . . . . . . . . . . . . . . . . . . . . . . . (4,519) 902
Remuneration on stockholders’ equity . . . . . . . . . . . . . . . . . . . . . . . . . . . . . . . . . . . . . . .
Stockholders. . . . . . . . . . . . . . . . . . . . . . . . . . . . . . . . . . . . . . . . . . . . . . . . . . . . . . . . . . 3,373 5,640
Reinvested . . . . . . . . . . . . . . . . . . . . . . . . . . . . . . . . . . . . . . . . . . . . . . . . . . . . . . . . . . . 6,876 15,639
Minority interest. . . . . . . . . . . . . . . . . . . . . . . . . . . . . . . . . . . . . . . . . . . . . . . . . . . . . . . . 168 432
Distribution of added value . . . . . . . . . . . . . . . . . . . . . . . . . . . . . . . . . . . . . . . . . . . . . . . 19,656 35,128
EXHIBIT 2.17
dou10955_ch02_023-064.indd 52dou10955_ch02_023-064.indd 52 2/4/11 8:02 AM2/4/11 8:02 AM
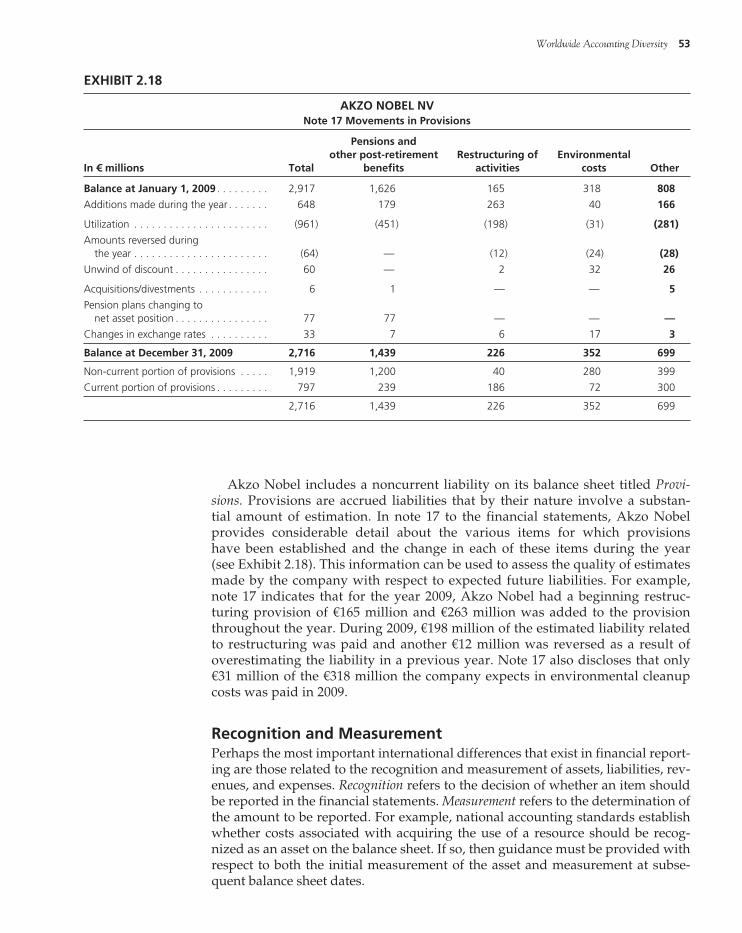
Confirming Pages
Worldwide Accounting Diversity 53
Akzo Nobel includes a noncurrent liability on its balance sheet titled Provi-sions. Provisions are accrued liabilities that by their nature involve a substan-tial amount of estimation. In note 17 to the financial statements, Akzo Nobel provides considerable detail about the various items for which provisions have been established and the change in each of these items during the year (see Exhibit 2.18 ). This information can be used to assess the quality of estimates made by the company with respect to expected future liabilities. For example, note 17 indicates that for the year 2009, Akzo Nobel had a beginning restruc-turing provision of €165 million and €263 million was added to the provision throughout the year. During 2009, €198 million of the estimated liability related to restructuring was paid and another €12 million was reversed as a result of overestimating the liability in a previous year. Note 17 also discloses that only €31 million of the €318 million the company expects in environmental cleanup costs was paid in 2009.
Recognition and Measurement Perhaps the most important international differences that exist in financial report-ing are those related to the recognition and measurement of assets, liabilities, rev-enues, and expenses. Recognition refers to the decision of whether an item should be reported in the financial statements. Measurement refers to the determination of the amount to be reported. For example, national accounting standards establish whether costs associated with acquiring the use of a resource should be recog-nized as an asset on the balance sheet. If so, then guidance must be provided with respect to both the initial measurement of the asset and measurement at subse-quent balance sheet dates.
AKZO NOBEL NV Note 17 Movements in Provisions
In € millions Total
Pensions and other post-retirement
benefitsRestructuring of
activitiesEnvironmental
costs Other
Balance at January 1, 2009 . . . . . . . . . 2,917 1,626 165 318 808
Additions made during the year . . . . . . . 648 179 263 40 166
Utilization . . . . . . . . . . . . . . . . . . . . . . . (961) (451) (198) (31) (281)
Amounts reversed during the year . . . . . . . . . . . . . . . . . . . . . . . (64) — (12) (24) (28)
Unwind of discount . . . . . . . . . . . . . . . . 60 — 2 32 26
Acquisitions/divestments . . . . . . . . . . . . 6 1 — — 5
Pension plans changing to net asset position . . . . . . . . . . . . . . . . 77 77 — — —
Changes in exchange rates . . . . . . . . . . 33 7 6 17 3
Balance at December 31, 2009 2,716 1,439 226 352 699
Non-current portion of provisions . . . . . 1,919 1,200 40 280 399
Current portion of provisions . . . . . . . . . 797 239 186 72 300
2,716 1,439 226 352 699
EXHIBIT 2.18
dou10955_ch02_023-064.indd 53dou10955_ch02_023-064.indd 53 2/4/11 8:02 AM2/4/11 8:02 AM
Confirming Pages
54 Chapter Two
We close this chapter by describing the diversity that exists with respect to measuring property, plant, and equipment (PPE) subsequent to acquisition. Pos-sible values at which these assets can be reported on the balance sheet include:
1. Historical cost (HC).
2. Historical cost adjusted for changes in the general purchasing power (GPP) of the currency.
3. Fair value (FV).
In most cases, GPP and FV accounting results in PPE being written up to an amount higher than historical cost. The counterpart to the asset write-up generally is treated as an increase in stockholders’ equity, often included in a Revaluation Reserve account. The larger asset value results in a larger depreciation expense and therefore smaller net income.
U.S. GAAP requires PPE to be carried on the balance sheet at historical cost less accumulated depreciation. If an asset is impaired, that is, its carrying value exceeds the amount of cash expected to result from use of the asset, it must be written down to fair value. Upward revaluation of fixed assets is not acceptable. HC accounting also is required in Japan. Although the specific rules vary from those in the United States, write-down to a lower value is required if a permanent impairment of value has occurred.
In contrast, under IFRS, publicly traded companies in the European Union are free to choose between two different methods for valuing their assets. PPE may be carried on the balance sheet at historical cost or at revalued amounts. The basis of revaluation is the fair value of the asset at the date of revaluation, which in many cases will be determined through appraisals. If a company chooses to report assets at revalued amounts, it has an obligation to keep the valuations up to date, which might require annual adjustments.
Until 2008, in Mexico, PPE was reported initially at historical cost and then restated in terms of GPP at subsequent balance sheet dates. Similarly, until the early 1990s, publicly traded companies in Brazil were required to use GPP in pre-paring financial statements. In addition to PPE inventories and investments also were adjusted upward for inflation on each balance sheet date, and receivables were discounted to their present value. These procedures no longer are required in Brazil but still may be followed at the option of the company.
Summary 1. Considerable diversity exists across countries with respect to the form and con-tent of individual financial statements, the rules used to measure assets and liabilities and recognize and measure revenues and expenses, and the magni-tude and nature of the disclosures provided in a set of financial statements.
2. Many environmental factors are thought to contribute to the differences in financial reporting that exist across countries. Some of the more commonly mentioned factors include legal system, the influence of taxation on financial reporting, corporate financing system, inflation, political and economic ties between countries, and national culture.
3. The diversity that exists in financial reporting creates problems for multina-tional corporations in preparing consolidated financial statements on the basis of a single set of accounting rules. Accounting diversity also can result in increased cost for companies in tapping into foreign capital markets. The com-parison of financial statements across companies located in different countries
dou10955_ch02_023-064.indd 54dou10955_ch02_023-064.indd 54 2/4/11 8:02 AM2/4/11 8:02 AM

Confirming Pages
Worldwide Accounting Diversity 55
is hampered by accounting diversity. Low-quality financial reporting contrib-uted to the financial crisis in East Asia in the 1990s.
4. Several authors have classified countries according to similarities and differ-ences in financial reporting. Two dominant models of accounting used in the developed world are the Anglo-Saxon model and the Continental European model.
5. Concentrating on the Anglo-Saxon and Continental model countries, Nobes developed a classification scheme that attempts to show how the financial reporting systems in 14 developed countries relate to one another. Nobes breaks down the two major classes of accounting system first into subclasses and then into families. This classification scheme shows how different families of accounting are related.
6. Culture has long been considered a determinant of accounting. Using the cul-tural dimensions identified by Hofstede, Gray developed a framework for the relationship between culture and accounting systems. Cultural values affect a country’s accounting system in two ways: (1) through their influence on the accounting values of conservatism, secrecy, uniformity, and professionalism shared by a country’s accountants and (2) through their influence on institu-tional factors such as the capital market and legal system.
7. In a more recent model of the reasons for international differences in financial reporting, Nobes suggests that the dominant factor is the extent to which cor-porate financing is obtained through the sale of equity securities to outsider shareholders. For whatever reason, some cultures lead to a strong equity-outsider financing system and other cultures lead to a weaker equity-outsider financing system. In countries with strong equity-outsider financing, mea-surement practices are less conservative, disclosure is extensive, and account-ing practice differs from tax rules. This is consistent with what may be called Anglo-Saxon accounting. In accounting systems found in countries with weak equity– outside shareholder financing systems, measurement is more conserva-tive, disclosure is not as extensive, and accounting practice follows tax rules. This is consistent with the Continental European accounting model.
8. Differences in financial reporting exist with regard to the financial statements provided by companies; the format, level of detail, and terminology used in presenting financial statements; the nature and amount of disclosure provided; and the principles used to recognize and measure assets, liabilities, revenues, and expenses.
Appendix to Chapter 2
The Case of Daimler-Benz Daimler-Benz was the first German company to list on the New York Stock Exchange (NYSE), doing so in 1993. This was a major event for the NYSE and the Securities and Exchange Commission (SEC) because German companies had previously refused to make the adjustments necessary to reconcile their German law–based financial statements to U.S. generally accepted accounting principles (GAAP). After some compromise on the part of the SEC and because of Daimler’s
dou10955_ch02_023-064.indd 55dou10955_ch02_023-064.indd 55 2/4/11 8:02 AM2/4/11 8:02 AM

Confirming Pages
56 Chapter Two
strong desire to enter the U.S. capital market (and be the first German company to do it), Daimler agreed to comply with SEC regulations.
Subsequent to its NYSE listing, Daimler-Benz filed an annual report on Form 20-F with the SEC. 1 In its 20-F filing, Daimler prepared financial statements in English, in both German deutschemarks (DM) and U.S. dollars, and, until 1996, according to German accounting principles. In the notes to the 1995 financial statements, Daimler provided a “Reconciliation to U.S. GAAP” in which adjust-ments were made to net income and stockholders’ equity prepared in accordance with German accounting law to reconcile to U.S. GAAP. The net effect of these adjustments over the period 1993–1995 is shown in Exhibit A2.1.
The fact that in 1993 Daimler-Benz reported a profit under German GAAP but a loss under U.S. GAAP created quite a stir in the international financial commu-nity. Because German companies were well known for intentionally understating income through the creation of hidden reserves, one would have expected German GAAP income to be smaller than U.S. GAAP income (as was true in 1994). In 1993, however, Daimler incurred a net loss for the year (as can be seen from the negative amount of U.S. GAAP income). To avoid reporting this loss, the company “released” hidden reserves that had been created in earlier years, thus reporting a profit of DM 615 million under German GAAP. The difference in German GAAP and U.S. GAAP income in 1993 of some DM 2.5 billion shows just how unreliable German GAAP income can be in reflecting the actual performance of a company. In fact, the German Financial Analysts Federation (DVFA) developed a method for adjust-ing German GAAP earnings to a more reliable amount (known as DVFA earnings).
In 1996, Daimler-Benz decided to abandon German GAAP and implement a U.S. GAAP accounting system worldwide. The 1996 annual report was prepared using U.S. GAAP and received a clean opinion on this basis from KPMG. The ratio-nale for this decision was outlined in the 1996 annual report and is reproduced in Exhibit A2.2. The company indicated that U.S. GAAP figures not only allowed external analysts to better evaluate the company but also served as a better basis for the internal controlling of the company. This clearly points out the differences in orientation between a typical macro-uniform accounting system that is geared toward minimizing taxes and protecting creditors, and a micro-based accounting system that has the objective of providing information that is useful for making decisions, not only by external parties but by management as well.
DAIMLER-BENZExcerpt from Form 20-F: Reconciliation to U.S. GAAP 1995
(all amounts in DM)1993 1994 1995
Net income as reported in the consolidated income statement under German GAAP. . . . . . . . . . . . . . . . . . . . . 615 895 (5,734)
Net income in accordance with U.S. GAAP. . . . . . . . . . . . . . . (1,839) 1,052 (5,729)
Stockholders’ equity as reported in the consolidated balance sheet under German GAAP . . . . . . . . . . . . . . . . . . 18,145 20,251 13,842
Stockholders’ equity in accordance with U.S. GAAP. . . . . . . . . . . . . . . . . . . . . . . . . . . . . . . . . . . . . . . . . 26,281 29,435 22,860
EXHIBIT A2.1
1 U.S. companies file their annual report with the SEC on Form 10-K; foreign companies file theirs on Form 20-F.
dou10955_ch02_023-064.indd 56dou10955_ch02_023-064.indd 56 2/4/11 8:02 AM2/4/11 8:02 AM

Confirming Pages
Worldwide Accounting Diversity 57
Questions 1. What are the two most common methods used internationally for the order in which assets are listed on the balance sheet? Which of these two methods is most common in North America? In Europe?
2. What are the two major types of legal systems used in the world? How does the type of legal system affect accounting?
3. How does the relationship between financial reporting and taxation affect the manner in which income is measured for financial reporting purposes?
DAIMLER-BENZExcerpts from Annual Report 1996
Excerpts from Value-Based Management, U.S. GAAP, and New Controlling Instruments (pages 44–45)
1996 Financial Statements Prepared Entirely in Accordance with U.S. GAAP for the First TimeSince our listing on the New York Stock Exchange we have increasingly aligned our external reporting in accordance with the information requirements of the international financial world. . . . With our 1996 annual report, we are the first German company to present an entire year’s financial statements in accordance with U.S. GAAP while at the same time complying with the German Law to Facilitate Equity Borrowing. The report thus also conforms with EU guidelines and European accounting principles.
Improved External Disclosure
Instead of providing various figures concerning the economic performance of the Company that are derived using the HGB and U.S. GAAP but that in some instances differ significantly from each other because of the distinct accounting philosophies, we supply a complete set of figures in conformance with U.S. GAAP for our shareholders, the financial analysts, and the interested public. In so doing, we fulfill accounting standards of the highest reputation worldwide, and we believe our approach more clearly and accurately reflects the economic performance, financial situation, and net worth of the Company than any other accounting system available at this time. This is not least due to the fact that U.S. accounting principles focus on investor information rather than creditor protection, which is the dominant concern under German accounting principles. Discretionary valuation is greatly limited, and the allocation of income and expenses to the individual accounting period is based on strict economic considerations.
Advantages for All ShareholdersUsing U.S. accounting principles makes it significantly easier to internationally active financial analysts or experienced institutional investors to accurately assess the financial situation and development of the Company. Moreover, it improves disclosure at Daimler-Benz as well as comparability on an international scale. This helps promote the worldwide acceptance of our stock.
Internal Controlling on the Basis of Balance Sheet Values in Accordance with U.S. GAAPThe U.S. GAAP not only made Daimler-Benz more transparent from an external perspective. Because the earnings figures as derived with American accounting principles accurately reflect the economic performance of the Company, we are now able to use figures from our external reporting for the internal controlling of the Company and its individual business units rather than relying on the internal operating profit used in the past. We thus make use of the same figures both internally and externally to measure the economic performance of the Company and the business units.
Excerpt from Letter to the Stockholders and Friends of Our Company (page 4)1996 marks the first time we have prepared our accounts in accordance with U.S. accounting principles which gives our investors worldwide the transparency they require. This means that our success as well as our shortcomings will be reported with new clarity. The terms operating profit, return on capital employed, and cash flow have become part of the language of the entire company and part of our corporate philosophy.
EXHIBIT A2.2
dou10955_ch02_023-064.indd 57dou10955_ch02_023-064.indd 57 2/4/11 8:02 AM2/4/11 8:02 AM

Confirming Pages
58 Chapter Two
4. Who are the major providers of capital (financing) for business enterprises? What influence does the relative importance of equity financing in a country have on financial statement disclosure?
5. What are the major problems caused by worldwide accounting diversity for a multinational corporation?
6. What are the major problems caused by worldwide accounting diversity for international portfolio investment?
7. What are the hypothesized relationships between the cultural value of uncer-tainty avoidance and the accounting values of conservatism and secrecy?
8. How are the Anglo and less developed Latin cultural areas expected to differ with respect to the accounting values of conservatism and secrecy?
9. According to Nobes, what are the two most important factors influencing dif-ferences in accounting systems across countries?
10. What are the different ways in which financial statements differ across coun-tries?
11. How are the various costs that comprise cost of goods sold reflected in a “type of expenditure” format income statement?
12. What information is provided in a statement of added value?
13. What are the alternative methods used internationally to present fixed assets on the balance sheet subsequent to acquisition?
1. Refer to the income statements presented in Exhibits 2.9 , 2.10 , 2.11 , 2.12 , and 2.13 for Callaway Golf Company, Südzucker AG, Cemex S.A.B. de CV, Sol Meliá SA, and Thai Airways.
Required: a. Calculate gross profit margin (gross profit/sales), operating profit margin
(operating profit/sales) and net profit margin (net earnings/sales) for each of these companies. If a particular ratio cannot be calculated, explain why not.
b. Is it valid to compare the profit margins calculated in part (a) across these companies in assessing relative profitability? Why or why not?
2. Access the financial statements from the most recent annual report of a foreign company and a domestic company with which you are familiar to complete this assignment.
Required: a. Determine the accounting principles (GAAP) the foreign and domestic com-
panies use to prepare financial statements.
b. Determine whether the foreign and domestic companies provide a set of financial statements that includes the same components (e.g., consolidated balance sheet, consolidated income statement, consolidated cash flows state-ment).
c. List five format differences in the companies’ income statements.
d. List five format differences in the companies’ balance sheets.
e. Note any terminology differences that exist between the two companies’ income statements and balance sheets.
Exercises and Problems
dou10955_ch02_023-064.indd 58dou10955_ch02_023-064.indd 58 2/4/11 8:02 AM2/4/11 8:02 AM

Confirming Pages
Worldwide Accounting Diversity 59
f. Assess whether the scope and content of the information provided in the notes to the financial statements is similar between the two companies.
g. Compare the overall presentation of the financial statements and notes to the financial statements between the two companies.
3. Access the financial statements from the most recent annual report of two for-eign companies located in the same country to complete this assignment.
Required: a. Determine the accounting principles (GAAP) the two foreign companies use
to prepare financial statements.
b. Determine whether the two foreign companies provide a set of financial statements that includes the same components (e.g., consolidated balance sheet, consolidated income statement, consolidated cash flows statement).
c. List any format differences in the companies’ income statements.
d. List any format differences in the companies’ balance sheets.
e. Note any terminology differences that exist between the two companies’ income statements and balance sheets.
f. Assess whether the scope and content of the information provided in the notes to the financial statements is similar between the two companies.
g. Compare the overall presentation of the financial statements and notes to the financial statements between the two companies.
4. Cultural dimension index scores developed by Hofstede for six countries are reported in the following table:
a1 = highest rank; 53 = lowest rank.b1 = highest rank; 34 = lowest rank.
Power DistanceUncertainty Avoidance Individualism Masculinity
Long-Term Orientation
Country Index Ranka Index Ranka Index Ranka Index Ranka Index Rankb
Belgium 65 20 94 5–6 75 8 54 22 38 18Brazil 69 14 76 21–22 38 26–27 49 27 65 6Korea (South) 60 27–28 85 16–17 18 43 39 41 75 5Netherlands 38 40 53 35 80 4–5 14 51 44 11–12Sweden 31 47–48 29 49–50 71 10–11 5 53 33 20Thailand 64 21–23 64 30 20 39–41 34 44 56 8
Required: Using Gray’s hypothesis relating culture to the accounting value of secrecy, rate these six countries as relatively high or relatively low with respect to the level of disclosure you would expect to find in financial statements. Explain.
5. Refer to Nobes’s judgmental classification of accounting systems in Exhibit 2.5 and consider the following countries: Austria, Brazil, Finland, Ivory Coast, Russia, South Africa.
Required: Identify the family of accounting in which you would expect to find each of these countries. Explain your classification of these countries.
dou10955_ch02_023-064.indd 59dou10955_ch02_023-064.indd 59 2/4/11 8:02 AM2/4/11 8:02 AM
Confirming Pages
60 Chapter Two
6. Five factors are often mentioned as affecting a country’s accounting prac-tices: (a) legal system, (b) taxation, (c) providers of financing, (d) inflation, and (e) political and economic ties.
Required: Consider your home country. Identify which of these factors has had the stron-gest influence on the development of accounting in your country. Provide spe-cific examples to support your position.
7. As noted in the chapter, diversity in accounting practice across countries gener-ates problems for a number of different groups.
Required: Answer the following questions and provide explanations for your answers.
a. Which is the greatest problem arising from worldwide accounting diversity?
b. Which group is most affected by worldwide accounting diversity?
c. Which group can most easily deal with the problems associated with accounting diversity?
8. Various attempts have been made to reduce the accounting diversity that exists internationally. This process is known as convergence and is discussed in more detail in Chapter 3. The ultimate form of convergence would be a world in which all countries followed a similar set of financial reporting rules and practices.
Required: Consider each of the following factors that contribute to existing accounting diversity as described in this chapter:
• Legal system
• Taxation
• Providers of financing
• Inflation
• Political and economic ties
• Culture
Which factor do you believe represents the greatest impediment to the inter-national convergence of accounting? Which factor do you believe creates the smallest impediment to convergence? Explain your reasoning.
Case 2-1
The Impact of Culture on Conservatism
PART I The framework created by Professor Sidney Gray in 1988 to explain the develop-ment of a country’s accounting system is presented in the chapter in Exhibit 2.8 . Gray theorized that culture has an impact on a country’s accounting system through its influence on accounting values. Focusing on that part of a country’s
dou10955_ch02_023-064.indd 60dou10955_ch02_023-064.indd 60 2/4/11 8:02 AM2/4/11 8:02 AM

Confirming Pages
Worldwide Accounting Diversity 61
accounting system comprised of financial reporting rules and practices, the model can be visualized as follows:
In short, cultural values shared by members of a society influence the account-ing values shared by members of the accounting subculture. The shared values of the accounting subculture in turn affect the financial reporting rules and practices found within a country.
With respect to the accounting value of conservatism, Gray hypothesized that the higher a country ranks on the cultural dimensions of uncertainty avoidance and long-term orientation, and the lower it ranks in terms of individualism and masculinity, then the more likely it is to rank highly in terms of conservatism. Conservatism is a preference for a cautious approach to measurement. Conserva-tism is manifested in a country’s accounting system through a tendency to defer recognition of assets and items that increase net income and a tendency to acceler-ate the recognition of liabilities and items that decrease net income. One example of conservatism in practice would be a rule that requires an unrealized contingent liability to be recognized when it is probable that an outflow of future resources will arise but does not allow the recognition of an unrealized contingent asset under any circumstances.
Required: Discuss the implications for the global convergence of financial reporting stan-dards raised by Gray’s model.
PART II Although Gray’s model relates cultural values to the accounting value of conser-vatism as it is embodied in a country’s financial reporting rules, it can be argued that the model is equally applicable to the manner in which a country’s accoun-tants apply those rules:
Required: Discuss the implications this argument has for the comparability of financial statements across countries, even in an environment of substantial international accounting convergence. Identify areas in which differences in cultural dimen-sions across countries could lead to difference in the application of financial reporting rules.
PART III Cancan Enterprises Inc. is a Canadian-based company with subsidiaries located in Brazil, Korea, and Sweden. (Hofstede’s cultural dimension index scores for these countries are presented in Exercise 4.) Cancan Enterprises must apply Canadian GAAP worldwide in preparing consolidated financial statements. Cancan has
Financial reportingrules and practices
Accounting valuesCultural dimensions
Accountant’s application offinancial reporting rules
Accounting valuesCultural dimensions
dou10955_ch02_023-064.indd 61dou10955_ch02_023-064.indd 61 2/4/11 8:02 AM2/4/11 8:02 AM

Confirming Pages
62 Chapter Two
developed a corporate accounting manual that prescribes the accounting policies based on Canadian GAAP that are to be applied by all the company’s operations. Each year Cancan’s internal auditors have the responsibility of ensuring that the company’s accounting policies have been applied consistently companywide.
Required: Discuss the implications that the model presented in Part II of this case has for the internal auditors of Cancan Enterprises in carrying out their responsibilities.
Case 2-2
SKD Limited
SKD Limited is a biotechnology company that prepares financial statements using internally developed accounting rules (referred to as SKD GAAP). To be able to compare SKD’s financial statements with those of companies in their home coun-try, financial analysts in Country A and Country B prepared a reconciliation of SKD’s current year net income and stockholders’ equity. Adjustments were based on the actual accounting policies and practices followed by biotechnology compa-nies in Country A and Country B. The following table shows the adjustments to income and stockholders’ equity made by each country analyst:
Country A Country B
Income under SKD GAAP. . . . . . . . . . . . . . . . . . . 1,050 1,050Adjustments: Goodwill amortization . . . . . . . . . . . . . . . . . . . 300 (100) Capitalized interest. . . . . . . . . . . . . . . . . . . . . . 50 50 Depreciation related to capitalized interest . . . . (20) (20) Depreciation related to revalued fixed assets . . — (8)
Income under local GAAP . . . . . . . . . . . . . . . . . . 1,380 972
Stockholders’ equity under SKD GAAP. . . . . . . . . 15,000 15,000Adjustments: Goodwill . . . . . . . . . . . . . . . . . . . . . . . . . . . . . 900 (300) Capitalized interest. . . . . . . . . . . . . . . . . . . . . . 30 30 Revaluation of fixed assets . . . . . . . . . . . . . . . . — 56
Stockholders’ equity under local GAAP . . . . . . . . 15,930 14,786
Description of Accounting Differences
Goodwill. SKD capitalizes goodwill and amortizes it over a 20-year period. Goodwill is also treated as an asset in Country A and Country B. However, goodwill is not amortized in Country A, but instead is subjected to an annual impairment test. Goodwill is amortized over a 5-year period in Country B.
Interest. SKD expenses all interest immediately. In both Country A and Country B, interest related to self-constructed assets must be capitalized as a part of the cost of the asset.
Fixed assets. SKD carries assets on the balance sheet at their historical cost, less accumulated depreciation. The same treatment is required in Country A. In Country B, companies in the biotechnology industry generally carry assets on the balance sheet at revalued amounts. Depreciation is based on the revalued amount of fixed assets.
dou10955_ch02_023-064.indd 62dou10955_ch02_023-064.indd 62 2/4/11 8:02 AM2/4/11 8:02 AM

Confirming Pages
Worldwide Accounting Diversity 63
Required: 1. With respect to the adjustments related to goodwill, answer the following:
a. Why does the adjustment for goodwill amortization increase net income under Country A GAAP but decrease net income under Country B GAAP?
b. Why does the goodwill adjustment increase stockholders’ equity in Country A but decrease stockholders’ equity in Country B?
c. Why are the adjustments to stockholders’ equity larger than the adjustments to income?
2. With respect to the adjustments made by the analyst in Country A related to interest, answer the following: a. Why are there two separate adjustments to income related to interest?
b. Why does the adjustment to income for capitalized interest increase income, whereas the adjustment for depreciation related to capitalized interest decreases income?
c. Why is the positive adjustment to stockholders’ equity for capitalized inter-est smaller than the positive adjustment to income for capitalized interest?
3. With respect to the adjustments made by the analyst in Country B related to fixed assets, answer the following: a. Why does the adjustment for depreciation related to revalued fixed assets
decrease income, whereas the adjustment for revaluation of fixed assets increases stockholders’ equity?
Afterman, Allan B. International Accounting, Financial Reporting, and Analysis. New York: Warren, Gorham & Lamont, 1995, pp. C1-17, C1-22.
Brooks, Jermyn Paul, and Dietz Mertin. Neues Deutsches Bilanzrecht. Düsseldorf: IDW-Verlag, 1986.
Cochrane, James L.; James E. Shapiro; and Jean E. Tobin. “Foreign Equities and U.S. Investors: Breaking Down the Barriers Separating Supply and Demand.” NYSE Working Paper, 95-04, 1995.
Collins, Stephen H. “The Move to Globalization,” Journal of Accountancy, March 1989.
Doupnik, Timothy S., and Stephen B. Salter. “An Empirical Test of a Judgemental International Classification of Financial Reporting Practices.” Journal of Interna-tional Business Studies, First Quarter 1993, pp. 41–60.
Doupnik, Timothy S., and George T. Tsakumis. “A Review of Empirical Tests of Gray’s Framework and Suggestions for Future Research.” Journal of Accounting Literature, 2004, pp. 1–48.
Gernon, H., and Gary Meek. Accounting: An International Perspective, 5th ed. Burr Ridge, IL: Irwin/McGraw-Hill, 2001.
Gray, S. J. “Towards a Theory of Cultural Influence on the Development of Accounting Systems Internationally.” Abacus, March 1988, pp. 1–15.
Hofstede, G. Culture’s Consequences: International Differences in Work-Related Values. London: Sage, 1980.
———. Culture’s Consequences: Comparing Values, Behaviors, Institutions, and Orga-nizations across Nations, 2nd ed. Thousand Oaks, CA: Sage, 2001.
References
dou10955_ch02_023-064.indd 63dou10955_ch02_023-064.indd 63 2/4/11 8:02 AM2/4/11 8:02 AM

Confirming Pages
64 Chapter Two
Malaysian Accounting Standards Board. MASB i-1, “ Presentation of Financial State-ments of Islamic Financial Institutions, ” 2001.
Meek, Gary K., and Sharokh M. Saudagaran. “A Survey of Research on Financial Reporting in a Transnational Context.” Journal of Accounting Literature, 1990, pp. 145–82.
Nobes, Christopher W. “A Judgemental International Classification of Financial Reporting Practices.” Journal of Business Finance and Accounting, Spring 1983.
———. “Towards a General Model of the Reasons for International Differences in Financial Reporting.” Abacus 34, no. 2 (1998), p. 166.
Radebaugh, Lee H., and Sidney J. Gray. International Accounting and Multinational Enterprises, 5th ed. New York: Wiley, 2002.
Rahman, Zubaidur M. “The Role of Accounting in the East Asian Financial Cri-sis: Lessons Learned?” Transnational Corporations 7, no. 3 (December 1998), pp. 1–52.
U.S. Department of Commerce. “U.S. International Transactions.” Survey of Cur-rent Business, January 2005, pp. 45–76.
Violet, William J. 1983. “The Development of International Accounting Standards: An Anthropological Perspective.” International Journal of Accounting, 1983, pp. 1–12.
dou10955_ch02_023-064.indd 64dou10955_ch02_023-064.indd 64 2/4/11 8:02 AM2/4/11 8:02 AM