world sugar outlook 2015
DESCRIPTION
What is the outlook for the sugar industry in the year 2015TRANSCRIPT

International Sugar Journal | ISJ's World Sugar Outlook 20153 PBwww.internationalsugarjournal.com
ISJ’s World Sugar Outlook 2015
Analysis and overview of the sugar and sweetener industries
JOURNAL
INTERNATIONALsugar
Sugar PlantSugar Refinery
Bioethanol PlantCogeneration PlantBio-based Industry
FROM BASIC ENGINEERING TO FULL TURNKEY PROJECT
Contact in Argentina: [email protected] www.dscontractors.com.ar
Contact in Brazil: [email protected] www.dsempral.com.br
Single Point Responsibility through EPC or EPCM+® with guaranteed:
Process Performances
Time Schedule
Budget

International Sugar Journal | ISJ's World Sugar Outlook 20154 5www.internationalsugarjournal.com
Extraction plants
Diffusers
Pulp presses
Fluidised-bed steam dryers
Evaporators
Crystallisation plants
Massecuite pumps
Centrifugals
Sugar dryers and coolers
Engineering and consulting
Assistance
E1810
The next generation – The new standardThe BMA E-series
Our revolutionary design focusing on sim-plicity and ease of operation as well as a decrease in downtime will exceed your utmost expectations: superior sugar qual-ity that suits your individual requirements, highest yields and low energy require-ments. That’s what we call efficient!
For further information contact: BMA, phone +49-531-8040, [email protected]; www.bma-worldwide.com
Passion
for
Progress

International Sugar Journal | ISJ's World Sugar Outlook 20154 5www.internationalsugarjournal.com
Contents
The EU sugar market post 2017 Leonardo Bichara Rocha
Editor: Arvind Chudasama MSc., MAgSt. (Qld), MCLIP Email: [email protected] Design and production: Snehal Sanghani Display and online advertising: Business Development Manager: Stuart Velden Direct: +44 (0)20 7017 7559 Email: [email protected] Marketing and circulation: Marketing Director Priyanka Adhikari Phone: +44 (0)20 3377 3045 Subscriptions: Phone: +44 (0)20 7017 5540 Email: [email protected] Publisher: Informa UK International Sugar Journal: Christchurch Court, 10-15 Newgate Street, London EC1A 7AZ, UK. Phone: +44 (0)20 7017 7500 Email: [email protected] www.agra-net.com
All technical articles have been approved by our panel of distinguished referees. Other editorial material appears at the discretion of the Editor. While information is compiled with all due care, Informa UK Ltd will not be liable for the consequences of anyone acting or refraining from acting in reliance on any information. ISBN 978-1-78207-335-2 ‘World Sugar & Ethanol Outlook’ is published annually by Informa UK Ltd. © 2014 Informa UK Ltd. Conditions of Sale: 1. All rights reserved, no part of this publication may be reproduced, stored in a retrieval system, or transmitted in any form or by any means, electronic, mechanical, photocopying, recording, or otherwise without prior written permission of the Publisher. Photocopying Licence: Informa UK Ltd. does not participate in a copying agreement with any Copyright Licensing Agency. Photocopying without permission is illegal. 2. All abstracting of the content for republication and sale must have prior permission from the Publisher. 3. The publication must not be circulated outside the staff who work at the address to which it is sent, without prior agreement with the Publisher.
Intercropping in sugarcane: A practice worth pursuing? Ramouthar, R. Rhodes, T. Wettergreen, U. Pillay, M.R. Jones, R. Van Antwerpen and S.D. Berry
Challenges and potential solutions for storage of large quantities of bagasse for power generation BS Purchase, S Rosettenstein and DV Bezuidenhoudt
Knowledge, an underexploited input for increasing not only cane productivity Arvind Chudasama
Figure 5: Exploded flange-‐connection of C-‐massecuite pipeline at outlet reheater (left) Bent floor-‐plates above place of explosion (right)
Several samples were taken around the spot where the accident occurred. The results given in (Table 2) indicate clearly that a chemical reaction, most probably due to Strecker degradation, took place that massively changed product characteristics.
Table 2: Chemical changes in products of C-‐massecuite degradation
Criteria Chemical change decrease of pH down to 4.9 decrease of polarization -‐ 11 % pol increase of reducing substances from 0.2 to 4.1 % dry matter increase of insolubles from 0.1 % to 6.3 % presence of furanes Yes
Even though the massecuite pipe above the centrifuges was open, massive increase in pressure occurred which finally led to the fatal explosion. The combination of high massecuite viscosity (after product) and a long distance between the place of heating and the discharge, caused that pressure to increase much faster than the massecuite could flow. It is after all an open question whether an open bottom valve of the vertical crystallizer would have been sufficient to avoid the pressure build-‐up.
Follow-‐up of the accident
The experience of such a fatal accident gave Suiker Unie the responsibility to take as much preventive measures as possible and to share the experience within the business. First actions taken were to repair the installation and to put fail-‐safe modifications in place before authorities gave permission to restart the production. In parallel much attention was paid to confidence building of the operators.
Strecker degradation an unknown phenomenon? Arend Wittenberg
Review and future options for computer modelling in the sugar industry F Plaza, GA Kent, DW Rackemann and DW Stephens
New build projects in the global sugar sector over July 2013 to August 2014 Arvind Chudasama
22
32
44
52
58
66
First estimate of the world sugar balance 2014/15 F.O. Licht
4
14
Intense sweeteners: Diversity prevails Lindsay Jolly
72
ISJ’s World Sugar Outlook 2015
Extraction plants
Diffusers
Pulp presses
Fluidised-bed steam dryers
Evaporators
Crystallisation plants
Massecuite pumps
Centrifugals
Sugar dryers and coolers
Engineering and consulting
Assistance
E1810
The next generation – The new standardThe BMA E-series
Our revolutionary design focusing on sim-plicity and ease of operation as well as a decrease in downtime will exceed your utmost expectations: superior sugar qual-ity that suits your individual requirements, highest yields and low energy require-ments. That’s what we call efficient!
For further information contact: BMA, phone +49-531-8040, [email protected]; www.bma-worldwide.com
Passion
for
Progress

International Sugar Journal | ISJ's World Sugar Outlook 20156 7www.internationalsugarjournal.com
First estimate of the world sugar balance 2014/15F.O. Licht
Email: [email protected] Tel: +49 (0)454 188 920 Website: www.agra-net.com
Introduction
World sugar futures remained under pressure in recent months as ample supplies of sugar are searching for a destination with the past 2013/14 (Oct/Sep) season producing a global surplus for the fourth consecutive season. Thus raw sugar prices hit 13.32 cents/lb on September 17, the lowest since May 2010, while October refined sugar futures touched $384.90 a tonne in the run-up to their expiry, the weakest for the front-month since April 2009.
The fast pace of crushing in Brazil’s key Centre South sugarcane region has added additional pressure on prices in October ‘14 as it increased available near-term supplies and made it more difficult for old-crop (2013/14) supplies from Thailand to find a final destination. Despite a fractional increase in CS sugar output in the season to mid-October there is unanimous agreement among analysts that cane and sugar totals will be sizeably reduced this year with a “sudden death” of the crushing season likely in coming weeks. A major element of weakness is the general lack of large-scale demand for sugar as many countries have already refilled inventories that were depleted during the deficit phase of the world sugar market. Last but not least, the sugar market was dealt another blow at the end of October when Brazilian president Dilma Roussef won another four-year term in office. Her tight victory in Sunday's election sent Brazilian financial markets plunging, as many investors had been hoping for pro-business challenger Aécio Neves. Adding pressure to the sugar market are concerns that subsidised
gasoline prices will remain in place with the re-election of Rousseff as her administration had used this tool to rein in inflation in recent years. The president of sugarcane industry group Unica called for a dialogue with Rousseff, asking her to clarify her stance on ethanol's place in Brazil's energy matrix.
Persisting weakness, and sometimes even further weakening of emerging market currencies against the US dollar have also added a bearish element to sugar prices. Many emerging market currencies continue to be plagued by political uncertainty as protests and geopolitical tensions have sprung up earlier this year.
Current indications are that the period of overproduction in the world sugar market may come to an end in 2014/15 with supply and demand almost matching. Our figures suggest that there will be a fractional deficit of 0.6 mln tonnes in 2014/15, which would follow an upwardly revised surplus of 4.7 mln tonnes in 2013/14. The numbers show that total output in 2014/15 on an Oct/Sep sugar year basis could be 178.7 mln tonnes, down from 181.4 mln the previous year but still 1.9 mln tonnes above apparent consumption. If around 2.5 mln tonnes of unrecorded consumption (the difference between exports and imports) are subtracted, the deficit in 2014/15 amounts to the aforementioned 0.6 mln tonnes (table 1).
We would like to recall that F.O. Licht does not include the sugar equivalent of beet and cane that were not processed into the end product crystal sugar (such as those used for fuel ethanol or biogas) in its sugar production estimates, which differs from the approach used
A major element of weakness is the general lack of large-scale demand for sugar as many countries have already refilled inventories that were depleted during the deficit phase of the world sugar market

International Sugar Journal | ISJ's World Sugar Outlook 20156 7www.internationalsugarjournal.com
by some sugar associations and official EU statistics. As always, all production figures are in raw value terms, which can be converted to white value terms by multiplying by 0.92.
Last but not least, it may be pointed out that our World Sugar Production forecasts are based on national crop years, while each country's numbers are recalculated to a uniform time period (in our case Oct/Sep) for our World Sugar Balance forecasts - the precondition for the calculation of the change in stocks (i.e. the surplus/deficit) during a given year (figure 1).
The sharpest decrease in output is expected in South America, where total output is seen falling by 3.5 mln tonnes year-on-year to just below 44.0 mln. Asian sugar production in 2014/15 is seen down 2.1 mln tonnes on the year at 66.2 mln, which is however still within sight of last year’s all-time high of 68.2 mln tonnes. North & Central American sugar output may be hardly changed at 22.4 mln tonnes compared with 22.1 mln last year, while African production is seen up 0.5 mln tonnes at nearly 12.0 mln. The strongest rise in output will be seen in Europe where sugar production is headed for a 2.0 mln tonne annual increase to 29.5 mln tonnnes. Last but not least, Oceania's sugar production may reach 4.8 mln tonnes, up modestly from 4.6 mln the year before (table 2).
Europe
European sugar production will rise significantly in 2014/15 as weather conditions will allow yields to reach bumper levels in many EU countries while the area under cultivation has been rather unchanged.
EU sugar production is seen rising by 1.6 mln tonnes on the year to 18.6 mln after output shrank for two consecutive years in the wake of the bumper 19.1 mln tonne crop in 2011/12. A mild and short winter allowed beet sowing to start early and be completed in a timely manner with favourable conditions in the course of the long growing season leading to strong beet growth. As a result, most countries expect yields at or close to record levels.
Russia's 2014/15 beet campaign is characterized by lower yields due to drought damage in July and August. With the first rise in area under cultivation in three years partly compensating for this we currently expect sugar output to fall modestly to 4.5 mln tonnes from 4.7 mln a year ago.
Turkey’s area under beet rose further in 2014/15 due to another rise in the production quotas. Sugar output of the country's 33 factories this season is therefore seen up a bit
Table 1. World sugar balance Oct/Sep (1,000 tonnes, raw value)
Sugar 2014/15 2013/14 2012/13 2011/12 2010/11
Opening stocks 77,270.5 72,594.0 64,764.3 58,348.5 57,004.9
Production 178,743.7 181,404.0 184,443.1 174,785.3 165,473.6
Imports 61,295.6 62,135.3 62,799.6 60,194.9 59,643.1
Consumption 176,834.4 175,176.3 172,153.6 167,892.3 162,438.4
Exports 63,793.7 63,686.5 67,259.5 60,672.0 61,334.7
Ending stocks 76,681.7 77,270.5 72,594.0 64,764.3 58,348.5
+/-Production -2,660.3 -3,039.1 9,657.8 9,311.7 6,341.4
+/-% -1.47 -1.65 5.53 5.63 3.98
+/-Consumption 1,658.1 3,022.7 4,261.3 5,453.9 411.0
+/-% 0.95 1.76 2.54 3.36 0.25
Stocks in % of consumption
43.36 44.11 42.17 38.57 35.92
Global surplus/deficit
-588.8 4,676.5 7,829.7 6,415.8 1,343.6
Note: May not add due to roundings; consumption excluding unrecorded disappearance
120
130
140
150
160
170
180
190
55
60
65
70
75
80
85
2003
/04
2004
/05
2005
/06
2006
/07
2007
/08
2008
/09
2009
/10
2010
/11
2011
/12
2012
/13
2013
/14
2014
/15
Ending StocksConsumption (incl. ΔEx-Im)Production
Stocks Prod/Cons
World Sugar Balance(mln tonnes, raw value)
F.O. Licht
Figure 1. World sugar balance
Table 2. World sugar production by regions Oct/Sep (1,000 tonnes, raw value)
2014/15 2013/14 2012/13 2011/12 2010/11
EU 18,604 17,005 17,448 19,070 15,894
Europe 29,501 27,477 28,607 30,828 24,735
Africa 11,979 11,497 11,248 10,346 10,336
N. & C. America 22,394 22,147 23,549 20,475 18,848
South America 43,963 47,434 48,669 43,024 46,217
Asia 66,150 68,212 67,129 66,293 61,388
Oceania 4,757 4,638 5,241 3,820 3,949
Total 178,744 181,404 184,443 174,785 165,474
Note: May not add due to roundings

International Sugar Journal | ISJ's World Sugar Outlook 20158 9www.internationalsugarjournal.com
from last year, at 2.7 mln tonnes.Ukraine's sugar beet harvest is expected
to be sharply higher than last year due to a combination of a rise in area as well as higher beet yields and sugar content. This may lift sugar output to 1.9 mln tonnes from 1.3 mln a year ago.
Africa
African sugar production is expected to rise to 12.0 mln tonnes in 2014/15 from 11.5 mln in 2013/14 – driven by expansion in Ethiopia and Sudan.
Sugar production on the continent is on the rise due to significant investment in some countries to raise self-sufficiency and capitalise on improved and preferential access to the EU market. Some of the projects have already come online, while others are yet under construction or in the phase of ramping up production to the newly installed capacity.
In South Africa the Oct/Sep year cuts across two campaigns, including the tail end of the local 2014/15 crush and the start of the next 2015/16 crush. Sugar production in local crop year 2014/15 was affected by dryness after output rose to a nine-year high in 2013/14. Output in 2015/16 is seen recovering somewhat, which means output on an
Oct/Sep basis is seen up only slightly at 2.5 mln tonnes from 2.4 mln in 2013/14.
Egypt's sugar output is seen hardly changed at 2.1 mln tonnes with around half of it coming from beet and the other half from cane. While cane expansion possibilities are limited there is investment in beet sugar production and refining capacities which may raise output in coming years.
Following several delays Sudan's new White Nile Sugar Factory was finally inaugurated in July 2012 but ramp-up of production at the facility has not yet had a sizeable impact on the country's total output. In fact, output even decreased to 693,000 tonnes in 2013/14 with a modest rise to 800,000 tonnes currently factored in for 2014/15.
Zimbabwe's sugar industry recovery continues as Tongaat Hulett raised output for the fourth consecutive year in 2013/14 after the industry hit rock bottom in 2009/10. Output is likely to rise further in 2014/15 as improved rainfall has aided crop development. We currently assume output to reach 491,600 tonnes, which would be the highest since 2002/03 when 580,000 tonnes were produced.
Zambia's cane yields in 2014/15 are expected to improve after the previous season’s
disappointing result, given the favourable growing conditions experienced and the benefit of a stable power supply in terms of irrigation optimisation. Top producer Zambia Sugar commenced crushing in the last week of March and output is expected to reach a new record of 440,000 tonnes. A similar output level is assumed for 15/16.
The Mozambican sugar industry may produce around 425,000 tonnes of sugar in 2014/15, up from 414,200 tonnes a year ago due to a rise in area and a recovery in cane yields.
The Ethiopian Sugar Corporation (ESC) announced that expansion projects at three existing mills have been completed, and the first of a planned seven new mills – Tendaho – has started trial production this month. While most of the mills will only become operational from 2015/16 onwards, sugar output is provisionally projected to rise to 500,000 tonnes in 2014/15 from 355,000 a year ago.
North & Central America
Sugar production in North & Central America is estimated at 22.4 mln tonnes, up from 22.1 mln in the previous year. The largest producer is the US followed by Mexico and Guatemala.
US sugar production is seen rising modestly to 7.7 mln tonnes from 7.6 mln the year before as beet sugar production is forecast to rise to 4.4 mln tonnes this season, partly offset by a fall in cane sugar production to 3.3 mln tonnes.
Mexico's sugar production in 2014/15 is seen remaining at 6.3 mln tonnes after output dropped sharply last year from a record 7.3 mln in 2012/13. Area is seen largely unchanged on the year and so are yields.
Guatemala's sugar industry has been in expansion mode in recent years. The country's 12 mills produced a record 2.9 mln tonnes of sugar in 2013/14, which compares with as little as 2.2 mln just three years before. For 2014/15 we currently expect output to be down somewhat at 2.8 mln tonnes.
Cuba's sugar industry has repeatedly failed to reach its production targets set ahead of the new crushing season as organisational and industrial problems and antiquated machinery usually hinder the mills from crushing the cane in the optimum time frame. This seems unlikely to be different in 2014/15 when the official plan calls for an increase in output by 15-20%. Thus we do not see output exceeding 1.8 mln tonnes.
South America
South American sugar production is
First estimate of the world sugar balance 2014/15

International Sugar Journal | ISJ's World Sugar Outlook 20158 9www.internationalsugarjournal.com
estimated to be sizeably reduced at 44.0 mln tonnes in 2014/15 from 47.4 mln the year before.
Brazil's 2014/15 balance year production cuts through two Centre South (CS) campaigns. It includes the tail end of the 2014/15 CS crush (1 October to the end of crushing operations in the CS) and the beginning of the next 2015/16 CS crush (up to September 30). Actual 2014/15 balance year output will therefore very much depend on the first half of the local 2015/16 crush, which is still difficult to predict at this point. Making matters worse, the dryness this year has not only affected cane yields in the current 2014/15 harvest but also hindered planting for the 2015/16 crop and proper fertilizer application, meaning that its effects will be felt for more than just one single year. Given that a further deterioration in output cannot be excluded, Brazil's total sugar production in raw value terms in 2014/15 on an Oct/Sep basis may fall to 36.0 mln tonnes from 39.7 mln in 2013/14.
Colombia's sugar production in 2014/15 is projected to be hardly changed on the year at 2.4 mln tonnes after output in calendar 2014 recovered from a very poor crop in calendar 2013.
Argentina may produce 2.1 mln tonnes of sugar in 2014/15, up from 1.8 mln in 2013/14 when output was affected by bad weather. Crushing in Argentina usually starts in May and ends in Nov/Dec, which means that Argentina's Oct/Sep 2014/15 production is made up mostly of what is locally referred to as the 2015 crop.
Peru is seen producing 1.2 mln tonnes of sugar in 2014/15, practically unchanged on the year.
Asia
The unabated rise in Asian cane sugar production seems to come to a halt in 2014/15 (for the time being) as several large-scale producers in the region are bound for a drop in output in the new season. The continent's cumulative output will still be the third-highest ever.
India's sugar industry is still caught between a rock and a hard place as the perennial heating-up of tension between millers, farmers and the government is delaying the start of the new crushing season. Despite the pile-up of huge arrears last season cane prices are still offering better returns to farmers than competing crops and the Indian Sugar Mills Association (ISMA) sees the acreage under cultivation in 2014/15 down only about 1% on the year at 5.294 mln ha. With a larger share of high-yielding cane varieties reported to be under cultivation we
currently assume a rise in sugar output to 27.0 mln tonnes (24.8 mln tonnes white value) from 26.5 mln a year ago, which would be the fifth consecutive year when the country's sugar production is set to exceed domestic consumption.
China's sugar market is still characterised by heavy imports which are pressuring domestic prices. Given that producers are operating in the red the acreage under cultivation has dropped for the new season. With challenging weather adding to the industry's woes cane sugar production may fall to 13.4 mln tonnes from 14.5 mln a year ago.
Thailand produced a record 11.6 mln tonnes of sugar in 2013/14, but dry weather in key growing areas is seen leading to a drop in sugar output to 10.5 mln tonnes in the new season.
Pakistan's cane sugar production surged to a record 5.9 mln tonnes in 2013/14 from 5.5 mln the year before as farmers expanded cane cultivation. With the industry reeling under excess supplies we have penciled in a slight drop to 5.4 mln tonnes in 2014/15, but some sources say a further rise to 6.5 mln tonnes may be on the cards.
Raw sugar production in the Philippines is forecast to rise fractionally year-on-year reaching around 2.5 mln tonnes.
Crushing in Indonesia usually starts in May and continues into December, which means that the crush affects to balance years. Most of 2014/15 balance year production is made up of what is usually referred to as the 2015 crush. Output is seen rising to about 2.7 mln tonnes in 2014/15, up from 2.5 mln a year ago.
Vietnam raised sugar output by 4% in 2013/14 due to a rise in the acreage under cane. The industry is suffering from high stocks, a problem that is exacerbated by cheaper sugar smuggled across the country's porous borders. However, acreage under cultivation is seen hardly changed on the year and output could therefore again reach about 1.7 mln tonnes.
Oceania
Sugar production in Oceania is estimated at nearly 4.8 mln tonnes, up from 4.6 mln a year ago.
Australia's sugar production in 2014/15 (Oct/Sep) is forecast to reach 4.5 mln tonnes, up from 4.4 mln last year. Harvesting in Australia usually starts around May/June, with large-scale processing taking place from July onwards to October before production volumes drop off significantly up to the end of the crush. The number for 2014/15 therefore includes the tail

International Sugar Journal | ISJ's World Sugar Outlook 201510 11www.internationalsugarjournal.com
end of this year's improved crush and the better part of the next 2015 crush, which we provisionally see at the same level as this year.
Fiji's sugar production in 2014/15 is seen rising to 210,000 tonnes from 199,000 expected for 2013/14. The industry is currently on a modest recovery path.
Sugar production in industrialised countries to recover
Sugar production in industrialised countries is seen recovering to 42.4 mln tonnes in 2014/15 after falling to 40.2 mln the year before. This would be within striking distance of the then 12-year high touched in 2011/12. Output in developing countries is forecast to fall by 4.9 mln tonnes to 136.4 mln – reflecting the projected sharp drop in Brazil.
Sugar production in importing countries is expected to remain unchanged at 87.6 mln tonnes, while sugar production in exporting countries is seen falling to 91.1 mln tonnes from last year's 93.7 mln.
World sugar consumption
What will shape world sugar demand in 2014/15?
It is widely accepted mainstream economic wisdom that population growth as well as economic growth are not only the key drivers of global sugar consumption, but also for many other staple foods (figure 2). In the case of sugar this is due to the fact that a rising standard of living usually leads to higher consumption of processed foods such as dairy, soft drinks etc. which have high sugar content. Also, the so-called income elasticity of sugar demand is usually higher for low-income countries than those in high-income countries (table 3).
It therefore always deserves taking a look at the growth prospects for the global economy, which is still struggling to get on track. But despite setbacks, an uneven global recovery continues. Largely due to weaker-than-expected global activity in the first half of 2014, the IMF in October reduced its growth forecast for the world economy downward to 3.3% for this year, 0.4 percentage points lower than in the April 2014 World Economic Outlook. The global growth projection for 2015 was lowered to 3.8%.
But despite the importance of these “general” drivers of consumption it is worth to take a second look at a few other developments that have sprung up earlier this year. Most of these can be described as impediments to growth. Firstly, the World Health Organization (WHO) in March launched a public consultation on its new draft guideline on sugars intake. With an expert peer-review process and the public consultation having been completed by the end of March, the draft guidelines are now being finalised.
The objective of this guideline is to provide recommendations on the consumption of free sugars to reduce the risk of diseases in adults and children, with a particular focus on the prevention and control of weight gain and dental caries. The WHO notes that there is increasing concern that consumption of free sugars, particularly in the form of sugar-sweetened beverages, may result in both reduced intake of foods containing more nutritionally adequate calories and an increase in total caloric intake, leading to an unhealthy diet, weight gain and increased risk of diseases.
New WHO draft guideline proposals
WHO’s current recommendation, from 2002, is that sugars should make up less than 10% of total energy intake per day. The new draft guideline also proposes that sugars should be
Table 3. World sugar consumption by regions Oct/Sep (1,000 tonnes, raw value)
2014/15 2013/14 2012/13 2011/12 2010/11
EU 19,173 18,856 18,948 18,955 19,072
Europe 31,247 30,941 30,997 30,995 30,862
Africa 19,646 19,521 18,963 18,396 17,525
N. & C. America 20,687 20,952 20,696 19,608 19,501
South America 21,356 21,165 21,126 21,045 20,455
Asia 82,184 80,886 78,665 76,146 72,393
Oceania 1,715 1,712 1,706 1,703 1,703
Total 176,834 175,176 172,154 167,892 162,438
Note: May not add due to roundings
100
120
140
160
180
World Sugar Consumption(mln tonnes, raw value)
F.O. Licht
Figure 2. World sugar consumption
First estimate of the world sugar balance 2014/15

International Sugar Journal | ISJ's World Sugar Outlook 201510 11www.internationalsugarjournal.com
less than 10% of total energy intake per day, but it further suggests that a reduction to below 5% of total energy intake per day would have additional benefits. Five per cent of total energy intake is equivalent to around 25 grams (around 6 teaspoons) of sugar per day for an adult of normal Body Mass Index (BMI).
The suggested limits on intake of sugars in the draft guideline apply to all monosaccharides (such as glucose, fructose) and disaccharides (such as sucrose or table sugar) that are added to food by the manufacturer, the cook or the consumer, as well as sugars that are naturally present in honey, syrups, fruit juices and fruit concentrates.
When finalised, the recommendations in this guideline can be used by program managers and policy planners to assess current intake of free sugars relative to a benchmark and develop measures to decrease intake of free sugars, where necessary, through public health interventions, the WHO said.
Policymakers in the UK seem to be beyond what the WHO is still thinking about. Campaign group Action on Sugar has stepped up its rhetoric with a seven-point plan to tackle childhood obesity - including proposals for a sugar tax, which it claimed was a direct response to an appeal from health secretary
Jeremy Hunt.Action on Sugar, which met with the health
secretary in April, said it had handed over its proposals in June, following a request by Hunt to suggest ways to tackle childhood obesity. Hunt eventually denied the government was planning a sugar tax, despite press revelations in early June that Public Health England had been drawing up proposals in draft plans for a new Department of Health consultation set to be launched June 26.
The seven measures called for are:
• Reduce added sugars by 40% by 2020 by reformulating food.
• Cease all forms of targeted marketing of ultra-processed, unhealthy foods and drinks to children.
• Dissociate physical activity with obesity via banning junk food sports sponsorships.
• Reduce fat in ultra-processed foods, particularly saturated fat - 15% reduction by 2020.
• Limit the availability of ultra-processed foods and sweetened soft drinks as well as reducing portion size.
• Incentivise healthier food and discourage drinking of soft drinks by introducing a sugar tax.
According to a survey by public health advocates released October 13, a majority of Mexicans say they are drinking less sugary drinks this year

International Sugar Journal | ISJ's World Sugar Outlook 201512 13www.internationalsugarjournal.com
• Remove responsibility for nutrition from the Department of Health and return it to an independent agency.A Department of Health spokesman said
that "childhood obesity is at its lowest since 1998 but more should be done." With the UK heading for general elections in 2015, shadow health secretary Andy Burnham confirmed (the opposition) Labour party was planning to slap new regulations on sugar levels in children's food if it came to power, although he repeated Labour's opposition to a sugar tax.
According to the campaign director for Action on Sugar, Katherine Jenner, EU law would likely see a sugar tax as an illegal barrier to trade, adding that her group would rather use pricing as an incentive. Jenner said one option is to use the sweetener aspartame, which is cheaper than sugar, to bring down both price and calorie content. Jenner told delegates at the UK Soft Drinks Industry Conference in London in May that soft drinks makers need to "act now or be forced to act later" when it comes to reducing sugar levels. Urging manufacturers to "quietly" reformulate their sugary drinks to reduce sugar content, Jenner said there will have to be consensus among the industry, health groups and government to make voluntary reductions work, adding that there is going to be a limited window of opportunity for voluntary reformulation.
Mexico introduces sugar tax
While a UK tax on sugar may not see the light of day, Mexico introduced a one peso (eight US cents) per litre tax on sugary drinks and an 8% tax on junk food such as potato chips, chocolates, candies and ice cream as part of a wider tax overhaul effective January 1, 2014. This made Mexico the first major soda market to tax high-calorie sodas, which could be a game changer as other countries may consider following suit.
Mexicans are the world's biggest soda drinkers, guzzling about 707. 8-ounce servings, on average, per year, according to Beverage Digest. The United States is the only other country in the same ballpark, clocking in at 701 servings.
According to a survey by public health advocates released October 13, a majority of Mexicans say they are drinking less sugary drinks this year. Just over half the 1,500 people who participated in the August survey said they have lowered their consumption of sugary drinks versus last year, while 98% said they considered drinking soda raises their risk for developing
diabetes and obesity. Nearly a fifth still drink more than three liters of soda a week, although in last year's survey a quarter of respondents drank that amount.
Carbonated beverage sales for Mexico's biggest soft-drink bottler, Coca-Cola Femsa, fell by 6.4% in Mexico during the first half of 2014, compared with the same period of 2013. The company blamed the slide on the soft-drink tax, bad weather, and a weak economy. Fellow Mexican Coke bottler Arca-Continental's sparkling drink sales in Mexico dropped 4.7% for the same period.
A separate study conducted earlier this year by Mexico's National Institute of Public Health measured the decline in sugary beverage consumption at 10% during the first three months of 2014, compared with the same period last year. That study also reported a 7% rise in purchases of beverages that are not subject to the new tax, such as plain bottled water and milk.
All in all, the tax appears to be crimping consumption of soda and sugary juices, with total sugar consumption in 2013/14 seen at 4.5 mln tonnes, down from nearly 4.7 mln a year earlier. Given that consumers tend to become accustomed to price increases over time we have assumed a similar consumption level in 2014/15.
Elsewhere, we assume that low domestic sugar prices in China as well as ongoing growth in the downstream food and beverage industries will continue to drive sugar consumption, with the total seen rising to 16.7 mln tonnes in 2014/15 from 16.2 mln a year ago. Prices in the domestic market have fallen further in the past year and are now ruling at about CNY4,000 per tonne, down from as much as CNY5,300 at this time a year ago. Low sugar prices are also supporting sugar consumption in India where prices are currently near year-ago values. All in all, we currently expect a rise in Indian consumption to 26.5 mln tonnes in 2014/15 from 26.1 mln in 2013/14.
Total Asian sugar consumption in 2014/15 is estimated to rise by 1.6% on the year to 82.2 mln tonnes, mainly a result of population and economic growth. Asia has been very much the powerhouse of world sugar consumption growth since the late 1980s. European sugar consumption is seen up a bit at 31.2 mln tonnes in 2014/15, while sugar consumption in North & Central America is expected to reach 20.7 mln tonnes, down from nearly 21.0 mln a year ago with the sugar tax in Mexico being a key contributor. Sugar consumption in South America is seen up only very little
Total Asian sugar consumption in 2014/15 is estimated to rise by 1.6% on the year to 82.2 mln tonnes
First estimate of the world sugar balance 2014/15

International Sugar Journal | ISJ's World Sugar Outlook 201512 13www.internationalsugarjournal.com
at 21.4 mln tonnes, compared with 21.2 mln last year. By far the largest consumer is Brazil with offtake in 2014/15 estimated at 12.8 mln tonnes, practically unchanged year-on-year due to a slack economy and already high per capita consumption. Sugar consumption in Africa is seen rising to 19.6 mln tonnes from 19.5 mln a year ago. Consumption in Oceania, at around 1.7 mln tonnes, is very stable with practically no year-on-year change. Australia accounts for the better part of total offtake, estimated at just above 1.3 mln tonnes.
All in all, we expect global sugar consumption to rise by 1.0% in 2014/15 and the total could reach 176.8 mln tonnes, up around 1.7 mln tonnes from last year. The forecast is rather conservative and may be revised upwards later in the year, if the necessity arises.
Sugar consumption in importing countries to reach all-time high
Developing countries are seen recording 1.5% growth in sugar consumption in 2014/15, with total consumption of these countries estimated at 129.5 mln tonnes - or about 73% of global demand. Sugar demand in industrialised countries continues to hover in a very narrow range between 46 and 47.5 mln tonnes. Offtake in 2014/15 is put at 47.3 mln tonnes, down fractionally from 47.5 mln last year.
Sugar consumption in importing countries is forecast to rise by 1.1% this year to 131.2 mln tonnes, a new all-time high. Major driver in this category is ongoing growth in India and China. Sugar offtake in exporting countries is seen rising only 0.5% in 2014/15, with the total estimated at 45.6 mln tonnes compared with 45.4 mln a year ago. Growth in this group of countries tends to be lower than in importing countries as ample availability of the sweetener comes along with rather high per caput consumption and therefore limited further growth potential.
Exportable production seen falling to 2010/11 level
Exportable production (production minus consumption) is estimated to reach 49.9 mln tonnes in 2014/15, down from 53.4 mln last year and the 2012/13 record of 56.6 mln tonnes. In fact, this will be the lowest level since 2010/11.
The effective decline will be even stronger as 4.4 mln tonnes of the total is being accounted for by the European Union, whose exports to the world market will remain limited at 1.374 mln tonnes of white sugar by the end of the 2016/17 season, or for another three seasons.
Exportable production from Africa is seen remaining rather unchanged at 2.4 mln tonnes (compared with 2.1 mln in 2013/14) as the increase in production on the continent is only sufficient to cover rising domestic demand which is fuelled by population growth. This may change from 2015/16 when several new mills are scheduled to come on stream in Ethiopia with the first one having started trial production earlier this month.
Exportable production in North & Central America is also seen hardly changed at 6.4 mln tonnes compared with 6.3 mln a year ago, with availability from the region’s three major exporters – Mexico, Guatemala and Cuba – seen rather stable.
Exportable production in Brazil is seen down sharply at 23.3 mln tonnes from nearly 27.0 in 2013/14 - due to the fact that sugar output will drop significantly in the current crushing season with no improvement foreseen for 2015/16. If realized, this would be the lowest availability of Brazilian sugars since the 2011/12 season.
Exportable production in Asia is seen falling to 8.3 mln tonnes from 9.9 mln last year due to the expected strong decrease in Thai output with Pakistan also seen having less sugar on hand to export this season.
For the fear of being repetitive, a flow figure such as exportable production does not account for stocks. This is of especial significance in the upcoming season as the strong increase in global stocks over the past few seasons should largely offset the reduced availability of sugar for export from the fresh crops. Thailand is just one example where traders still have sizable amounts of old-crop sugar for sale before fresh supplies enter the warehouses from next month. Despite a reduction in domestic inventories over the past year, India also still has ample sugar for export - if world prices allow the country to enter the export market. However, exports are not a feasible option at present world market quotations with the new government still undetermined over the continuation of an export subsidy introduced during 2013/14. Australia's exportable production in 2014/15 is seen up a bit at 3.2 mln tonnes.
Import demand seen falling further from 2012/13 all-time high
Gross imports are estimated to fall slightly to 61.3 mln tonnes in 2014/15 from 62.1 mln the year before.
China continues to import much beyond its requirements, taking over the role of the US Federal Reserve for the sugar market. The
International Sugar Journal | ISJ's World Sugar Outlook 201514 15www.internationalsugarjournal.com
Federal Reserve has been purchasing inferior assets of poor quality in recent years which neither the banks nor other investors wanted. Instead of acting in its historical role as the ‘lender of last resort’, the Federal Reserve has on its own expanded its mandate to become the ‘buyer of last resort’. The same is true for China as the country has been purchasing raw sugar from the
world market as if there is no tomorrow. In fact, Chinese refiners have been purchasing sugar for which there was no other demand, soaking up a significant chunk of the global surplus and thereby providing support to global sugar values which would otherwise have pressured international prices even further.
In fact, imports reached an astounding 4.1 mln tonnes in the recently-concluded 2013/14 season, up from 3.7 mln a year earlier and not far below a record 4.3 mln tonnes imported in 2011/12. Anecdotal evidence suggests that warehouses are brimming over in the country and the question is how long imports can continue at this level. With the further decline in domestic prices in recent months it seems likely that imports will fall in 2014/15 as out-of-quota imports do not make economic sense any longer. For 2014/15 we have therefore provisionally pencilled 2.5 mln tonnes of imports into our balance sheet.
Given that several countries have already used the market's drop to ever fresh lows in 2012/13 and 2013/14 to scale up imports and refill depleted inventories we think that import demand will moderate somewhat in 2014/15. Still, the projected import level of 61.3 mln tonnes is still rather high and compares with a record 62.8 mln tonnes imported in 2012/13.
Russia's imports may rise to 1.5 mln tonnes in 2014/15 from an estimated 1.1 mln the year before as a decline in domestic beet sugar output is seen raising import needs. If realized, this would be the highest Russian import level since 2010/11 when nearly 2.6 mln tonnes were brought in.
Indonesia is seen importing 3.7 mln tonnes of sugar in 2014/15, up from 3.2 mln a year
earlier. Domestic consumption is on the rise due to economic and population growth, while domestic production is stagnating. Making matters worse for domestic millers, the rise in demand is almost exclusively fuelled by growth in the food and beverage industries, which rely on refined sugar produced from imported raws instead of domestically produced plantation white sugar.
The United States imported about 3.4 mln tonnes of sugar in 2013/14 with Mexico supplying about 1.9 mln tonnes of deliveries. With ending stocks in 2013/14 being at the low end of what USDA considers a comfortable level and stagnant domestic production the country may even import a little more in 2014/15. This is despite a preliminary agreement struck with Mexico in recent days to limit unfettered access of Mexican sugar to the US market.
Total Asian sugar imports are estimated to reach 28.9 mln tonnes in 2014/15, down from 30.5 mln last year. European imports are seen up slightly at 11.8 mln tonnes from 11.3 mln a year ago, mostly due to the above-mentioned higher deliveries to Russia. African imports are seen falling modestly to 12.5 mln tonnes from 12.9 mln last season, due to higher domestic availability. North & Central American imports are bound to rise modestly to 5.5 mln tonnes from 5.2 mln a year ago due to the expected increase in US imports. Sugar imports into South America are negligible but seen rising somewhat to 2.1 mln tonnes from 1.8 mln a year ago.
Global stocks to fall for first time since 2009/10
The surplus or deficit in a given sugar year is understood to be the gap between production and global demand including unrecorded consumption, with the latter being the gap between exports and imports. A closer inspection of this approach reveals that the term surplus or deficit simply mean the increase or decrease in stocks.
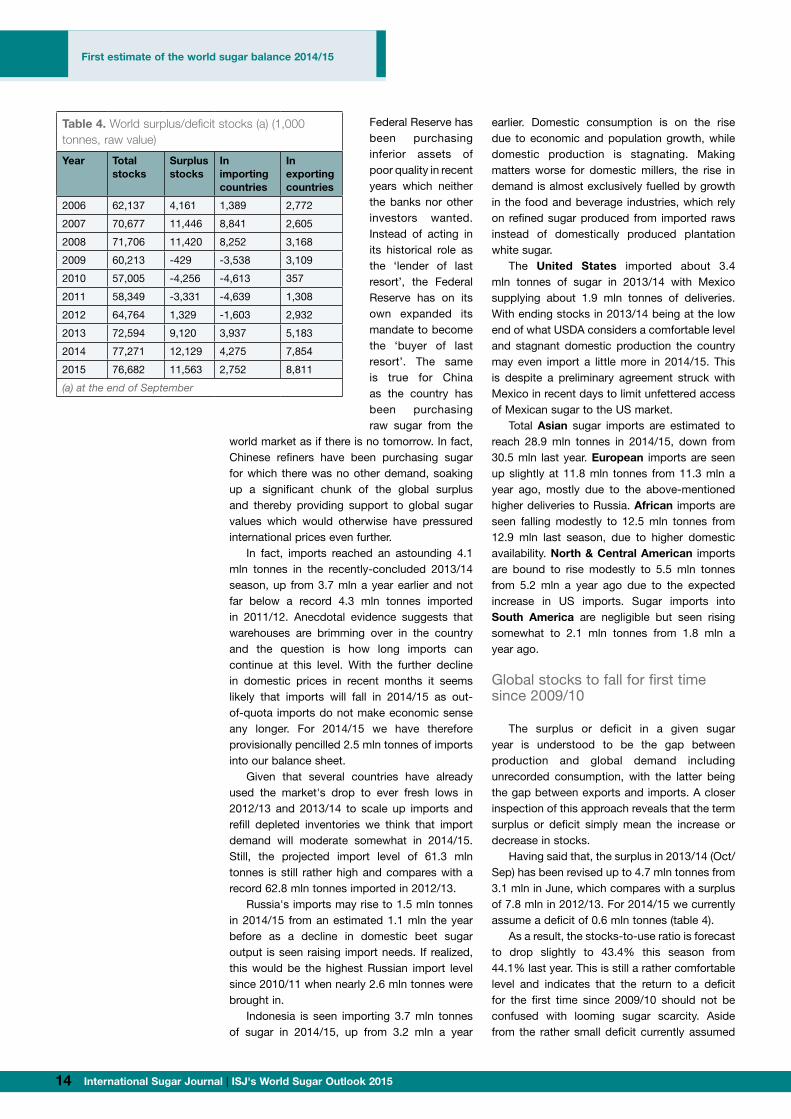
Having said that, the surplus in 2013/14 (Oct/Sep) has been revised up to 4.7 mln tonnes from 3.1 mln in June, which compares with a surplus of 7.8 mln in 2012/13. For 2014/15 we currently assume a deficit of 0.6 mln tonnes (table 4).
As a result, the stocks-to-use ratio is forecast to drop slightly to 43.4% this season from 44.1% last year. This is still a rather comfortable level and indicates that the return to a deficit for the first time since 2009/10 should not be confused with looming sugar scarcity. Aside from the rather small deficit currently assumed
Table 4. World surplus/deficit stocks (a) (1,000 tonnes, raw value)
Year Total stocks
Surplus stocks
In importing countries
In exporting countries
2006 62,137 4,161 1,389 2,772
2007 70,677 11,446 8,841 2,605
2008 71,706 11,420 8,252 3,168
2009 60,213 -429 -3,538 3,109
2010 57,005 -4,256 -4,613 357
2011 58,349 -3,331 -4,639 1,308
2012 64,764 1,329 -1,603 2,932
2013 72,594 9,120 3,937 5,183
2014 77,271 12,129 4,275 7,854
2015 76,682 11,563 2,752 8,811
(a) at the end of September
First estimate of the world sugar balance 2014/15

International Sugar Journal | ISJ's World Sugar Outlook 201514 15www.internationalsugarjournal.com
TECHNOLOGIES THERMIQUES
• Without gaskets, without�back flushing• Clear free flow channels for mixed, limed or clarified juice• Use of low pressure vapours and condensates• Compact and easy to clean• Robust and maintenance free• Multi-streams juice heaters available• Molasse cooler
the solution to your heat transfer
EASY TO CLEAN AND WIDE GAP WELDED PLATE HEAT EXCHANGERS PLATULAR®
platular®C U S T O M - B U I L T A N D V E R S A T I L E
H E A T T R A N S F E R S O L U T I O N SF O R T H E S U G A R I N D U S T R Y
www.barriquand.com +32 4377 42 49
for the new season it also takes time for the statistical surpluses and deficits to filter through into the physical market. This may be different in 2015/16 if the trend of falling production amid further rising consumption continues, with the dire financial situation of many sugar industries across the globe possibly supporting such a development.
Surplus stocks are those in excess of what is needed for an uninterrupted flow in the pipeline from factory to user and to cover consumption between the end of one production cycle and the beginning of the next. These point in the same direction and could remain at a rather high 11.5 mln tonnes at the end of September 2015, down only slightly from an estimate of 12.1 mln for September 2014. Whatever approach is applied it is evident that the market is still awash with sugar.
Outlook
Current indications for 2014/15 are that global sugar production will fall for the second consecutive season while consumption continues to rise modestly. This means that the world sugar market will likely see its first statistical deficit since 2009/10.
But even if there should be a deficit in 2014/15 it usually takes some time until a change in the market balance from surplus to deficit, or vice versa, makes its way into the trade flows. Stocks have accumulated during four seasons of global surplus and some countries are even brimming over with sugar. This is likely to cushion the market to some extent and may prevent a violent surge in values.
While the 2014/15 deficit will be a rather modest one of only 0.6 mln tonnes that should not have the potential to shatter global sugar markets, it is a clear indication that the tide is turning. Many domestic sugar industries across the world are suffering from selling sugar at prices below the cost of production, which is unsustainable in the long run and may further affect output in coming years.
Last but not least, 58 mills have already closed down in Brazil since 2008/09 but the situation for the local industry may even turn from bad to worse with the incumbent Dilma Roussef winning another four-year term in office at the Brazilian presidential elections on October 26. So while the market remains well supplied for the time being there are indeed some bullish elements on the horizon.

International Sugar Journal | ISJ's World Sugar Outlook 201516 17www.internationalsugarjournal.com
The EU is the world’s second largest sugar consumer (after India) as well as the world’s third largest sugar producer (after Brazil and India). The
bloc is also one of the world’s largest sugar importers – it was the largest importer of sugar between 2008 and 2011, losing the first spot to China in 2012. Prior to 2006, the EU was the world’s second largest exporter (after Brazil). Since 2006, following a policy that encouraged production cuts in the bloc, sugar exports have collapsed from over 6 mln tonnes to less than 2 mln tonnes, while imports, by contrast, have risen from around 2.5 mln tonnes to around 4 mln tonnes, raw value – see Fig. 1.
The impact of the 2006 reform on the industry
The 2006 Reform of the EU Sugar Regime had the main objective of incentivizing sugar production to migrate to more cost effective regions by offering higher cost producers a chance to surrender production quotas and leave the industry upon compensation.1 The Reform was implemented in the wake of a WTO panel ruling, which established that EU sugar exports, at the time in the order of around 5 mln tonnes a year, were cross-subsidised and, as such, should be capped to no more than 1.35 mln tonnes, white value. The European Commission, in a 2011 full impact assessment study2, considered the 2006 Reform to be relatively successful, as it eliminated some key
The EU sugar market post 2017 Leonardo Bichara Rocha*
FO Licht Sugar & Sweeteners Report The EU Sugar Market Post 2017
________________________________________________________________________________ 2
-4,000
-2,000
0
2,000
4,000
6,000
8,000
Thou
sand
tonn
es, r
aw v
alue
Fig. 1: EU Imports and Exports of Sugar
Imports Exports Net Exports
The EU is the world’s second largest sugar consumer (after India) as well as the world’s third largest sugar producer (after Brazil and India). The bloc is also one of the world’s largest sugar importers – it was the largest importer of sugar between 2008 and 2011, losing the first spot to China in 2012. Prior to 2006, the EU was the world’s second largest exporter (after Brazil). Since 2006, following a policy that encouraged production cuts in the bloc, sugar exports have collapsed from over 6 mln tonnes to less than 2 mln tonnes, while imports, by contrast, have risen from around 2.5 mln tonnes to around 4
mln tonnes, raw value – see Fig. 1.
Fundo Internacional de Desenvolvimento Agrícola – IFAD, Escritório Conjunto das Nações Unidas Elevador Lacerda, Praça Municipal Thomé de Souza , CEP: 40.020-010 , Salvador, Bahia
Brazil | Tel: +55-71 3183 5721 | Email: [email protected]
Figure 1. EU imports and exports of sugar
International Sugar Journal | ISJ's World Sugar Outlook 201516 17www.internationalsugarjournal.com
market control measures of domestic support, such as price intervention, production and export refunds. The Reform ended in 2009/10, with over 5.2 mln tonnes of quota sugar, white value, renounced. However, some 1 mln tonnes of quota sugar had been purchased by groups, mostly in France and Germany, leading to a net reduction in EU-wide production quotas in the order of 4 mln tonnes. Currently, several regulatory measures still apply: a) minimum beet prices; b) sugar production quotas; c) production charges (levied on the quota, amounting to EUR 12/tonne for sugar and inulin syrup and EUR 6/tonne for isoglucose); d) carry forward; e) private storage aid (never applied in practice); f) withdrawal schemes. The import duties have been and will be maintained at the level of EUR 419/tonne for white sugar and EUR 339/tonne for raw sugar, with CXL sugar imported at a EUR 98/tonne duty, and access for preferential partners of the EPA/EBA group and others kept within a duty free quota free mechanism.
As production of both sugar and isoglucose (HFS – High Fructose Syrup) is still regulated by fixed quotas distributed to Member countries, any production above the quotas cannot be freely released into the EU market. Instead, it
needs to be sold to the chemical or bioethanol industry or exported within the WTO limits of 1.35 mln tonnes. Sugar production quotas in the EU have fallen from 17.4 mln tonnes in 2005/06 to 13.3 mln tonnes in 2009/10 (rising slightly to 13.5 mln tonnes with the accession of Croatia in 2013). Isoglucose production
quotas fell only slightly from about 800 thousand tonnes to 700 thousand tonnes now. Sugar production quotas have been significantly reduced in Italy, Spain and Greece and production stopped altogether in five Member States - Ireland, Latvia, Slovenia, Bulgaria and continental Portugal. As a result, there has been a further concentration of production in the leading Member States: the market share of France and Germany increased from 43% of EU production to 52% on average. Sugar conglomerates such as Südzucker, AB Sugar, Tereos, Nordzucker, Pfeifer und Langen and Cristal Union have expanded output to reach 80% of the bloc’s total production.
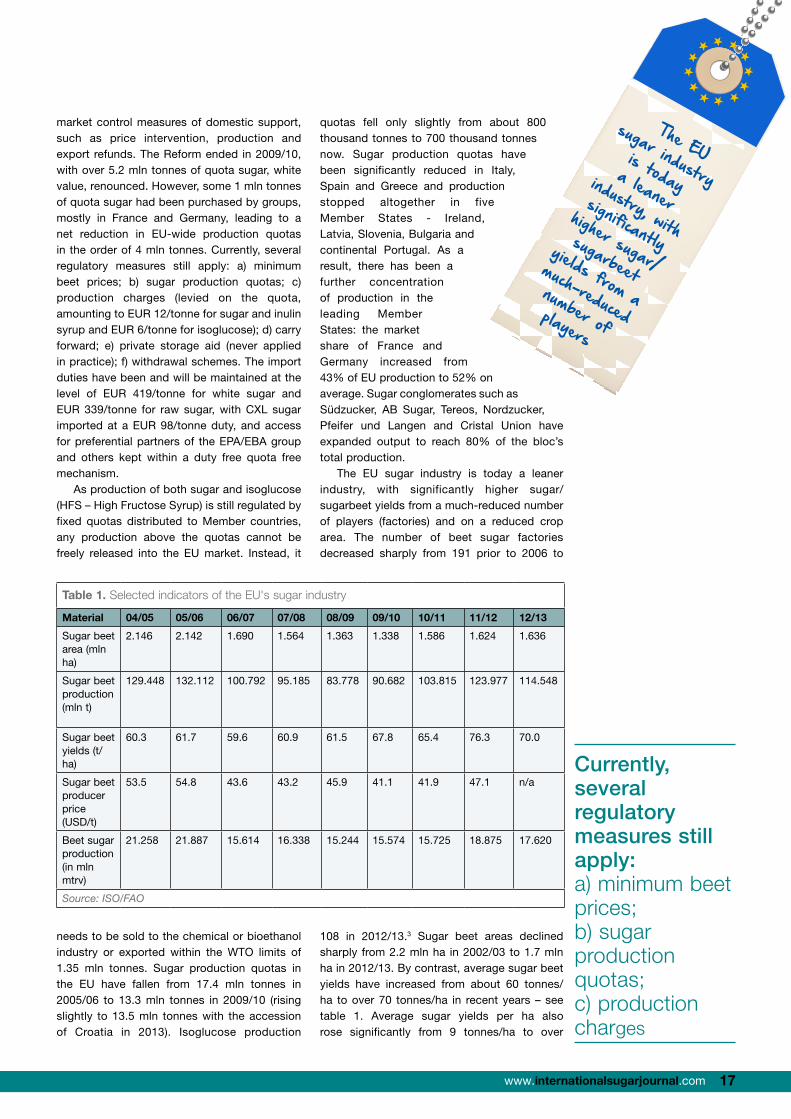
The EU sugar industry is today a leaner industry, with significantly higher sugar/sugarbeet yields from a much-reduced number of players (factories) and on a reduced crop area. The number of beet sugar factories decreased sharply from 191 prior to 2006 to
108 in 2012/13.3 Sugar beet areas declined sharply from 2.2 mln ha in 2002/03 to 1.7 mln ha in 2012/13. By contrast, average sugar beet yields have increased from about 60 tonnes/ha to over 70 tonnes/ha in recent years – see table 1. Average sugar yields per ha also rose significantly from 9 tonnes/ha to over
Table 1. Selected indicators of the EU's sugar industry
Material 04/05 05/06 06/07 07/08 08/09 09/10 10/11 11/12 12/13
Sugar beet area (mln ha)
2.146 2.142 1.690 1.564 1.363 1.338 1.586 1.624 1.636
Sugar beet production (mln t)
129.448 132.112 100.792 95.185 83.778 90.682 103.815 123.977 114.548
Sugar beet yields (t/ha)
60.3 61.7 59.6 60.9 61.5 67.8 65.4 76.3 70.0
Sugar beet producer price (USD/t)
53.5 54.8 43.6 43.2 45.9 41.1 41.9 47.1 n/a
Beet sugar production (in mln mtrv)
21.258 21.887 15.614 16.338 15.244 15.574 15.725 18.875 17.620
Source: ISO/FAO
The EU sugar industry is today
a leaner industry, with significantly
higher sugar/sugarbeet
yields from a
much-reduced number of players
Currently, several regulatory measures still apply: a) minimum beet prices; b) sugar production quotas; c) production charges

International Sugar Journal | ISJ's World Sugar Outlook 201518 19www.internationalsugarjournal.com
11 tonnes/ha while sugar beet prices have declined from an average of over USD 50/tonne to just over USD 40/tonne. Of importance, since 2005, average beet yields in the EU have risen by 20%, whilst maize and wheat yields have not shown any significant upward trend.
Sugar consumption and trade
The EU is a mature sugar market, with a high level of per capita consumption – 39kg in 2012 compared to a world average of 25kg. According to the ISO Sugar Consumption model, similarly to other developed markets, but unlike developing countries, sugar consumption growth in the EU can be largely explained by population growth – elasticity of demand of 66% - and to a lesser extent by income growth – elasticity of demand of 30%4.
Of interest, the EU received a major boost to its overall consumption levels from the accession of ten new member countries in 2004, which brought additional sugar consumption of 3 mln tonnes. The further enlargement of membership with the incorporation of Bulgaria and Romania in 2007 added another one mln tonnes, taking overall consumption to over 18 mln tonnes, raw value. Since then, consumption has been rising slowly at an average rate of about 1% a year, excepting the year of 2009, when consumption slumped as a result of the world financial crisis.
Since 2007 gross sugar imports have been consistently larger than 3 mln tonnes, raw value, while net sugar imports by the EU have averaged about 2 mln tonnes a year.
Figure 2 shows total EU imports of white and raw sugar between 2002 and 2012. Raw sugar imports traditionally account for up to 80% of the total volume of EU imports, with the sugar sourced mainly from traditional preferential partners of the ACP/LDC group (duty free) and CXL countries (import duty of EUR 98/tonne). White sugar imports originate mainly from the West Balkans and other European countries as well as more recently from Mauritius, the largest ACP sugar exporter to the EU. Sugar imports from ACP (African, Caribbean and Pacific) countries and LDCs (Least Developed Countries) are now duty-free quota-free. The EU has also signed some Free Trade Agreements with Latin American countries and others. Last but not least, the Commission has kept its prerogatives to allow duty-free imports of sugar and isoglucose for industrial use until 2016/17, which has been set at a level of 400 thousand tonnes since the 2008/09 season, although only a fraction of these quotas have in reality been filled.
Non-LDC ACP sugar imports
Total sugar imports from non-LDC ACPs have averaged around 1.3 mln tonnes over the past few seasons. Several ACP countries have been struggling to increase sugar production for further exports due to difficulties encountered to modernize their industries amid an increasingly competitive environment internationally. Among all LDCs and ACPs, the share of non-LDC ACPs has fallen from nearly 90% in the middle of the past decade to less than 70% now.
The largest non-LDC ACP sugar exporter to the EU is Mauritius, with a share of around 30% of total ACP shipments. Since 2009, Mauritius has been exporting white sugar to Südzucker under a 6-year contract. The other non-LDC ACPs export mostly raw sugar to the EU. While countries like Swaziland have managed to nearly double the volume of exports over recent years to over 250 thousand tonnes, raw value, others like Fiji and Jamaica faced difficulties, with shipments falling by as much as 50%.
Duty-free quota-free exports for ACPs will from October 2014 become conditional on their joining Economic Partnership Agreements.5 In the framework of EPAs, the EU grants duty-free quota-free access to the products originating in ACP countries (with a transition period for sugar) while ACPs offer progressive liberalisation of trade and can exclude products from liberalisation. By 7 February 2014, there were seven regions with on-going EPA negotiations with the EU: Caribbean, Pacific, West Africa, Central Africa, Southern African Development Community (SADC), Eastern and Southern Africa (ESA) and East African Community (EAC). Of interest, some countries within these regions have also initiated bilateral “stepping stone” (or “interim”) EPAs. Interim agreements establish
FO Licht Sugar & Sweeteners Report The EU Sugar Market Post 2017
________________________________________________________________________________ 5
with the sugar sourced mainly from traditional preferential partners of the ACP/LDC group (duty free) and CXL countries (import duty of EUR 98/tonne). White sugar imports originate mainly from the West Balkans and other European countries as well as more recently from Mauritius, the largest ACP sugar exporter to the EU. Sugar imports from ACP (African, Caribbean and Pacific) countries and LDCs (Least Developed Countries) are now duty-free quota-free. The EU has also signed some Free Trade Agreements with Latin American countries and others. Last but not least, the Commission has kept its prerogatives to allow duty-free imports of sugar and isoglucose for industrial use until 2016/17, which has been set at a level of 400 thousand tonnes since the 2008/09 season, although only a fraction of these quotas have in reality been filled.
Source: ISO
Non-LDC ACP sugar imports Total sugar imports from non-LDC ACPs have averaged around 1.3 mln tonnes over the past few seasons. Several ACP countries have been struggling to increase sugar production for further exports due to difficulties encountered to modernize their industries amid an increasingly competitive environment internationally. Among all LDCs and ACPs, the share of non-LDC ACPs has fallen from nearly 90% in the middle of the past decade to less than 70% now. The largest non-LDC ACP sugar exporter to the EU is Mauritius, with a share of around 30% of total ACP shipments. Since 2009, Mauritius has been exporting white sugar to
0
500
1,000
1,500
2,000
2,500
3,000
3,500
4,000
4,500
5,000
2002 2003 2004 2005 2006 2007 2008 2009 2010 2011 2012
Tota
l im
port
s by
the
EU
in t
hous
and
tonn
es
Years
Fig. 2: EU Imports of White and Raw Sugar, 2002-2012 (Raw Value, Thousand Tonnes)
Raw Sugar White Sugar
Figure 2. EU imports of white and raw sugar, 2002-2012 (raw value, thousand tonnes)
The EU sugar market post 2017

International Sugar Journal | ISJ's World Sugar Outlook 201518 19www.internationalsugarjournal.com
provisions on market access of goods but leave other aspects of the EPA (services, investments and trade related matters) open for further negotiations.
Sugar imports under Everything-but-Arms (EBA) initiative
Sugar imports by the EU from LDC (Least Developed Countries) producers are currently regulated by the Everything But Arms (EBA) initiative on a duty-free quota-free basis. In 2012 imports from this group of countries reached a record 600 thousand tonnes, significantly higher than the less than 200 thousand tonnes prior to the Reform of the EU sugar regime. As a result, the share of LDCs in total ACP/LDC preferential exports to the EU has increased from around 10% in the middle of the past decade to over 30% now.
The bulk of current deliveries from the LDC group come from seven countries: Mozambique, Zambia, Sudan, Cambodia, Malawi, Madagascar and Laos. Exports from Mozambique and Zambia have risen quite spectacularly over the recent years, with Mozambique shipping a record 234 thousand tonnes to the bloc in 2012, up from less than 40 thousand in 2006. Among other top LDC exporters, countries like Cambodia and Laos only started shipping sugar to the EU from 2008. Raw sugar deliveries from Cambodia in 2012/13 tripled to 50,700 tonnes as new mills came on stream and local output continues to rise.
CXL imports
The third category of sugar imports comprise sugar bought under special CXL arrangements, which incur an import duty of EUR 98/tonne for an annual quota of up to 677 thousand tonnes and include quantities calculated from compensatory adjustments regarding traditional partners of newer member states, such as Finland, Romania and Bulgaria. It also includes
India under special duty-free access for 10 thousand tonnes. Actual export volumes by CXL quota holders have been greater, as the commission has increased access through exceptional measures at times of low export availability from preferential partners.
Preferential import schemes with European Countries
Other agreements include duty-free tariff quotas for white sugar imports from western Balkan countries – known as the 'Balkans Initiative', which was adopted in 2000. This grants tariff quotas to eligible sugar products originating in Serbia, Albania, Bosnia and Herzegovina and the former Yugoslav Republic of Macedonia, the largest of which being the 180 thousand tonne quota held by Serbia. Moldova benefits from an Autonomous Trade Preferences agreement with the European Union, which includes a sugar export quota of 34 thousand tonnes. In addition, in 2012, it was agreed to establish export quotas for Ukrainian sugar to the EU at the amount of 20 thousand tonnes per year.
The new free trade agreements
On 26 June 2012, the EU signed a trade agreement with Colombia and Peru, which came into effect on March 1st 2013. The agreement with Colombia and Peru includes opening of a duty-free TRQ for 84,000 tonnes of sugar, of which Colombia has received 62,000 tonnes and Peru 22,000 tonnes.
On 29 June 2012, the EU signed with Central America an agreement leading to duty-free tariff quotas for agricultural products, which include sugar. The agreement was put in place in 2013. The trade deal has been applied with Honduras, Nicaragua and Panama since 1 August 2013, with Costa Rica and El Salvador since 1 October 2013 and with Guatemala since 1 December 2013.
Table 2. Total sugar imports by the EU from CXL countries (Thousand Tonnes, Raw Value)6
Origin 2002 2003 2004 2005 2006 2007 2008 2009 2010 2011 2012
Brazil 45 65 165 164 165 855 993 775 1,161 1,720 1,066
Cuba 94 66 110 40 63 131 73 125 75 74 210
Australia 1 2 1 1 1 18 11 27 0 12 13
India 57 18 22 11 28 48 14 14 5 28 17
Total CXL 197 151 298 216 257 1,052 1,091 941 1,241 1,834 1,306
Share of Brazil (in %) 22.8 43.0 55.3 76.0 64.3 81.2 91.0 82.3 93.5 93.7 81.6
Source: ISO
The EU is a mature sugar market, with a high level of per capita consumption – 39kg in 2012 compared to a world average of 25kg

International Sugar Journal | ISJ's World Sugar Outlook 201520 21www.internationalsugarjournal.com
For Panama, the EU has opened a duty-free import quota for sugar and sugar-containing products of 12,000 tonnes (in raw sugar equivalent) for 2013, which rises to 12,360 tonnes for calendar 2014 and will be increased by 360 tonnes each year from January 2015. For the other countries in Central America excluding Panama, the agreement allows duty-free imports of sugar and sugar-containing products at 150,000 tonnes (raw sugar equivalent) for 2013, rising to 154,500 tonnes for calendar 2014 and by 4,500 tonnes each year from January 2015.
Sugar refining
The reliance on rising quantities of sugar imports over the past eight years has aided the further development of raw sugar refining sector in the EU. Since 2006, new refineries have been opened in Member States where there was no refining activity before, like Denmark, Italy and Spain7. Second, some significant raw sugar refining capacity has been added to the EU with the accession of both Romania and Bulgaria, which traditionally imported some 300 and 500 thousand tonnes, respectively, of raw
sugar for refining. All in all, there are today 34 refineries today in the EU, of which 30 are defined as full-time refiners.8 Full-time refineries (until marketing year 2016/17) currently have a 3 months’ window to apply in priority for import licenses of raw sugar. Once this prerogative expires in 2016/17, all operators, including part-time refineries, beet processors that refine off crop or co-refine, as well as traders, will be able to apply for licenses since the first day of the marketing year.
The 2017 reform
On 26 June 2013 a political agreement on the Reform of the CAP was reached between the Commission, the European Parliament and the Council. The agreement included extending the current market provisions for sugar until 2016/17 and abolishing sugar and isoglucose production quotas, as well as minimum beet prices, thereafter.
The new regime will still have general safeguard measures that the European Commission can use in case of market disturbances. For example, it will be still possible to make use of private storage aid in case of domestic prices falling significantly below the reference prices, which will be kept unchanged:
i. For white sugar: EUR 404.4/tonne;ii. For raw sugar: EUR 335.2/tonne;
Until 2016/17, it will still be a prerogative of the Commission to adopt acts determining the appropriate quantity of out-of-quota sugar and imported raw sugar that can be released onto the Union market. The quotas for the production of sugar, isoglucose and inulin syrup at national or regional level during the transitional period until 30 September 2017 remain fixed at basically the final level of quotas allocated in marketing year 2010/2011.9 The transitional provisions still allow for out-of-quota to be transferred to the chemical or ethanol industry, to be carried forward to the next marketing year, to be released into the domestic market under special circumstances or exported within quantitative limits. Otherwise they are still subject to a surplus levy.
Isoglucose: How big a threat?
One of the key market focuses regarding the consequences of the 2017 Reform of the EU Sugar Regime is the potential threat coming from isoglucose, consumed by industrial users (especially soft drink industry but also dairy products) and produced mainly from maize (but also wheat) starch. Similarly to the sugar sector, isoglucose production in the EU has become more concentrated. Quotas for production of isoglucose are now concentrated in only nine member states, as opposed to 13 member states prior to the 2006 Reform .
Some market analysts estimate that up to 30% of the EU’s sugar consumption could be substituted by isoglucose, but that would mean an almost 100% penetration of isoglucose in the beverage industry, which is unlikely. As of early 2014, isoglucose prices were lower than sugar prices by some 10-20%10, although this gap could easily disappear and even change signs with additional sugar output following the abolition of quotas in 2017.
Isoglucose production is unlikely to rise in regions where there is already a grains production deficit in the EU. This includes the UK and Ireland in northern Europe, the Netherlands and Belgium as well as most of southern Europe, i.e. Portugal, Spain, Italy and Greece. Nevertheless, following the dismantling of production quotas, isoglucose output may rise in grains surplus regions, which include France, Germany and Poland, Austria and the Czech Republic. In these countries, the relative price between sugar and grains will be an important variable in determining the extent to which there will be substitutability in production between sugar and grains.
Quotas for production of isoglucose are now concentrated in only nine member states, as opposed to 13 member states prior to the 2006 Reform
The EU sugar market post 2017

International Sugar Journal | ISJ's World Sugar Outlook 201520 21www.internationalsugarjournal.com
The EU sugar market post 2017: ISO assessment and forecast
In a recent paper on the EU Sugar Market Post 2017 (MECAS(14)05), the ISO envisaged two scenarios for EU sugar production/consumption and trade in 2017. The first scenario is where sugar prices are relatively high in the EU – at USD 700/tonne for domestic white sugar- but relatively low in the world market – at USD 350/tonne for raw sugar – see fig. 3. In this scenario, EU sugar producers would be unable to avoid a higher penetration of isoglucose in the bloc’s industrial sweeteners consumption and would also fail to expand their presence into a depressed world market. Although this scenario sees the average EU sugar price falling, it will still remain above the threshold level of USD 650/tonne below which sugar starts to be considered as more cost-competitive than isoglucose in a quota-free environment. Production/consumption of isoglucose would rise to 2.7 mln tonnes, compared to 700 thousand tonnes today. Consequently, sugar consumption would fall from 18 mln tonnes to 16.8 mln tonnes.
Crucially, imports of sugar under preferential agreements would remain profitable, with import parity, even with payment of the full CXL duty, still lower than EU prices. Imports are projected to remain as high as 3.0 mln tonnes. Exports to the world market would be around 2.0 mln tonnes – see table 3.
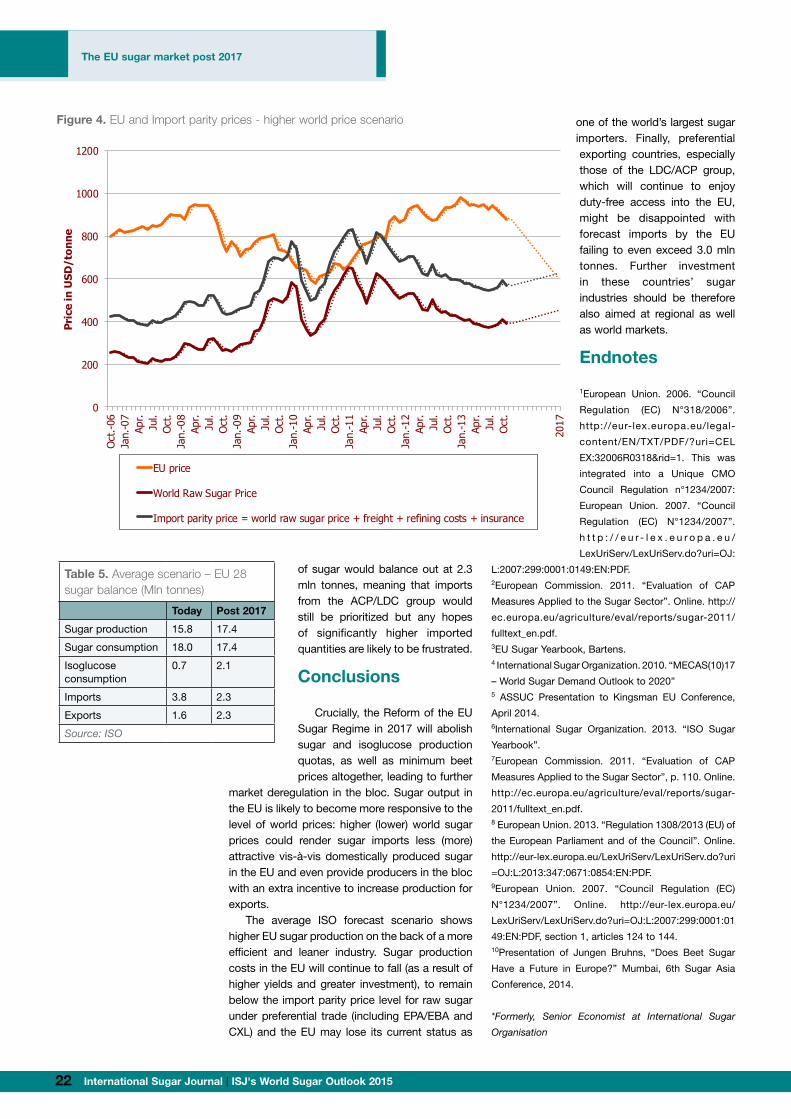
In the second scenario, EU sugar prices would be relatively low at USD 600/tonne, with
world raw sugar prices higher than in the first scenario at USD 450/tonne – see fig. 4. In this scenario, sugar would be able to fend off some of the threat coming from isoglucose production. Here we estimate production/consumption of isoglucose rising to only 1.5 mln tonnes. At the same time, domestically produced sugar would be cheaper than imported sugar under preferential agreements, whether they incur the CXL duty or not. This means that sugar production within the EU would also have an incentive to expand to export, as the EU price would be closer to the world market price. In this scenario, sugar production could expand by as much as 3.2 mln tonnes. Imports from the world market would drop to 1.5 mln tonnes, and exports would be as high as 2.5 mln tonnes – see table 4.The average scenario forecasts a balanced market in the EU, with production and consumption of sugar at 17.4 mln tonnes, and isoglucose production/consumption rising by 1.4 mln tonnes to 2.1 mln tonnes – see table 5. Imports and exports
Table 3. Scenario 1 – EU 28 sugar balance (Mln tonnes)
Today Post 2017
Sugar production 15.8 15.8
Sugar consumption 18.0 16.8
Isoglucose consumption
0.7 2.7
Imports 3.8 3.0
Exports 1.6 2.0
Source: ISO
FO Licht Sugar & Sweeteners Report The EU Sugar Market Post 2017
________________________________________________________________________________ 10
. Source: ISO Table 3: Scenario 1 – EU 28 sugar balance (Mln tonnes) Today Post 2017 Sugar production 15.8 15.8 Sugar consumption 18.0 16.8 Isoglucose consumption 0.7 2.7 Imports
3.8 3.0 Exports 1.6 2.0 Source: ISO In the second scenario, EU sugar prices would be relatively low at USD 600/tonne, with world raw sugar prices higher than in the first scenario at USD 450/tonne – see fig. 4. In this scenario, sugar would be able to fend off some of the threat coming from
isoglucose production. Here we estimate production/consumption of isoglucose rising to only 1.5 mln tonnes. At the same time, domestically produced sugar would be cheaper than imported sugar under preferential agreements, whether they incur the CXL duty or
0
200
400
600
800
1,000
1,200
Oct
.-06
Jan.
-07
Apr.
Jul.
Oct
.Ja
n.-0
8Ap
r.Ju
l.O
ct.
Jan.
-09
Apr.
Jul.
Oct
.Ja
n.-1
0Ap
r.Ju
l.O
ct.
Jan.
-11
Apr.
Jul.
Oct
.Ja
n.-1
2Ap
r.Ju
l.O
ct.
Jan.
-13
Apr.
Jul.
Oct
.
2017
Pric
e in
USD
/ton
ne
Fig. 3: EU and Import Parity Prices - Lower World Price Scenario
EU price
World Raw Sugar Price
Import parity price = world raw sugar price + freight + insurance + refining costs+ CXL duty
Figure 3. EU and import parity prices - lower world price scenario
Table 4. Scenario 2 – EU 28 sugar balance (Mln tonnes)
Today Post 2017
Sugar production 15.8 19.0
Sugar consumption 18.0 18.0
Isoglucose consumption
0.7 1.5
Imports 3.8 1.5
Exports 1.6 2.5
Source: ISO
International Sugar Journal | ISJ's World Sugar Outlook 201522 23www.internationalsugarjournal.com
of sugar would balance out at 2.3 mln tonnes, meaning that imports from the ACP/LDC group would still be prioritized but any hopes of significantly higher imported quantities are likely to be frustrated.
Conclusions
Crucially, the Reform of the EU Sugar Regime in 2017 will abolish sugar and isoglucose production quotas, as well as minimum beet prices altogether, leading to further
market deregulation in the bloc. Sugar output in the EU is likely to become more responsive to the level of world prices: higher (lower) world sugar prices could render sugar imports less (more) attractive vis-à-vis domestically produced sugar in the EU and even provide producers in the bloc with an extra incentive to increase production for exports.
The average ISO forecast scenario shows higher EU sugar production on the back of a more efficient and leaner industry. Sugar production costs in the EU will continue to fall (as a result of higher yields and greater investment), to remain below the import parity price level for raw sugar under preferential trade (including EPA/EBA and CXL) and the EU may lose its current status as
one of the world’s largest sugar importers. Finally, preferential exporting countries, especially those of the LDC/ACP group, which will continue to enjoy duty-free access into the EU, might be disappointed with forecast imports by the EU failing to even exceed 3.0 mln tonnes. Further investment in these countries’ sugar industries should be therefore also aimed at regional as well as world markets.
Endnotes
1European Union. 2006. “Council
Regulation (EC) N°318/2006”.
http://eur-lex.europa.eu/legal-
content/EN/TXT/PDF/?uri=CEL
EX:32006R0318&rid=1. This was
integrated into a Unique CMO
Council Regulation n°1234/2007:
European Union. 2007. “Council
Regulation (EC) N°1234/2007”.
h t t p : / / e u r - l e x . e u r o p a . e u /
LexUriServ/LexUriServ.do?uri=OJ:
L:2007:299:0001:0149:EN:PDF.2European Commission. 2011. “Evaluation of CAP
Measures Applied to the Sugar Sector”. Online. http://
ec.europa.eu/agriculture/eval/reports/sugar-2011/
fulltext_en.pdf.3EU Sugar Yearbook, Bartens.4 International Sugar Organization. 2010. “MECAS(10)17
– World Sugar Demand Outlook to 2020”5 ASSUC Presentation to Kingsman EU Conference,
April 2014.6International Sugar Organization. 2013. “ISO Sugar
Yearbook”.7European Commission. 2011. “Evaluation of CAP
Measures Applied to the Sugar Sector”, p. 110. Online.
http://ec.europa.eu/agriculture/eval/reports/sugar-
2011/fulltext_en.pdf.8 European Union. 2013. “Regulation 1308/2013 (EU) of
the European Parliament and of the Council”. Online.
http://eur-lex.europa.eu/LexUriServ/LexUriServ.do?uri
=OJ:L:2013:347:0671:0854:EN:PDF.9European Union. 2007. “Council Regulation (EC)
N°1234/2007”. Online. http://eur-lex.europa.eu/
LexUriServ/LexUriServ.do?uri=OJ:L:2007:299:0001:01
49:EN:PDF, section 1, articles 124 to 144.10Presentation of Jungen Bruhns, “Does Beet Sugar
Have a Future in Europe?” Mumbai, 6th Sugar Asia
Conference, 2014.
*Formerly, Senior Economist at International Sugar
Organisation
FO Licht Sugar & Sweeteners Report The EU Sugar Market Post 2017
________________________________________________________________________________ 12
.
Table 4: Scenario 2 – EU 28 sugar balance (Mln tonnes) Today Post 2017 Sugar production 15.8 19.0 Sugar consumption 18.0 18.0 Isoglucose consumption 0.7 1.5 Imports
3.8 1.5 Exports 1.6 2.5 Source: ISO. The average scenario forecasts a balanced market in the EU, with production and consumption of sugar at 17.4 mln tonnes, and isoglucose production/consumption rising by 1.4 mln tonnes to 2.1 mln tonnes – see table 5. Imports and exports of sugar would balance out at 2.3 mln tonnes, meaning that imports from the ACP/LDC group would still be prioritized but any hopes of significantly higher imported quantities are likely to be frustrated. Table 5: Average scenario – EU 28 sugar balance (Mln tonnes)
0
200
400
600
800
1000
1200
Oct
.-06
Jan.
-07
Apr.
Jul.
Oct
.Ja
n.-0
8Ap
r.Ju
l.O
ct.
Jan.
-09
Apr.
Jul.
Oct
.Ja
n.-1
0Ap
r.Ju
l.O
ct.
Jan.
-11
Apr.
Jul.
Oct
.Ja
n.-1
2Ap
r.Ju
l.O
ct.
Jan.
-13
Apr.
Jul.
Oct
.
2017
Pri
ce in
USD
/ton
ne
Fig. 4: EU and Import Parity Prices - Higher World Price Scenario
EU price
World Raw Sugar Price
Import parity price = world raw sugar price + freight + refining costs + insurance
Figure 4. EU and Import parity prices - higher world price scenario
Table 5. Average scenario – EU 28 sugar balance (Mln tonnes)
Today Post 2017
Sugar production 15.8 17.4
Sugar consumption 18.0 17.4
Isoglucose consumption
0.7 2.1
Imports 3.8 2.3
Exports 1.6 2.3
Source: ISO
The EU sugar market post 2017
International Sugar Journal | ISJ's World Sugar Outlook 201522 23www.internationalsugarjournal.com
LITHSOLVENTInhibitors for the protection of metalmaterials against acids
KEBO-DSScale inhibitor in evaporation stations
KEBOSOLActivators for alkaline cleaning solutions
KEBOCORCorrosion inhibitors for longtimeconservation of metal surfaces aswell as for closed and semi-open cooling water systems
KEBOPLEXScale control aids for cooling water and waste water systems as well as alcohol distilleries
KEBOCIDDisinfectant for juice extraction andcooling water circuits
KEBOSPUMAntifoams for each range of temperature
KEBO-XBoiler feed water conditioning agent
KELLER & BOHACEK GMBH & CO. KGP.O. BOX 33 02 60 . D-40435 DÜSSELDORFTELEPHONE: (0211) 96 53-0TELEFAX: (0211) 65 52 02e-mail: [email protected]: http//www.kebo.de
C002_divider_KEBO-4col.qxd 13/11/07 09:44 Page 1

International Sugar Journal | ISJ's World Sugar Outlook 201524 25www.internationalsugarjournal.com
Intercropping in sugarcane: A practice worth pursuing?Ramouthar, R. Rhodes, T. P.V.
P.V. Ramouthar, R. Rhodes, T. Wettergreen, U. Pillay,M.R. Jones, R. Van Antwerpen and S.D. BerrySouth African Sugarcane Research Institute, P/Bag X02, Mount Edgecombe, 4300, South Africa Email: [email protected]
Abstract The South African sugar industry recommends green manuring as a best management practice, but it can only be practised once every crop cycle (every 8-10 years). Intercropping was therefore investigated as a potential means of exploiting the benefits of green manuring over the entire sugarcane crop life. The objectives of this study were to determine the effects of intercropping on cane yield, and to investigate the possibility of reducing inorganic nitrogen (N) inputs in the presence of a leguminous intercrop. Four trials, with soybean, cowpea and/or lupin intercrops, were conducted at sites in Paddock, Nkwaleni and Pongola. In total, nine crops were harvested from four trials. Different rates (0, 33, 67 and 100%) of the recommended N were applied to the cane. In seven of the nine crops harvested (78%), no significant yield differences existed between cane-only controls and cane grown with intercrops. The crop response to N was generally poor, with significant yield differences between the 0% and 100% N cane-only controls observed in only 44% of the crops harvested. Analyses of the results show that in most cases where a response to nitrogen was seen, a significant reduction in yield was noted due to intercropping. Economic analysis of one trial showed that growing a sugarcane monocrop made more economic sense than intercropping. Practical and management considerations involved with intercropping must also be taken into account when intercropping. Keywords: economics, inorganic nitrogen, intercrop, legume, management, yield, sugarcane
Introduction
Sugarcane has been grown as a monocrop in the South African sugar industry for many years, often without an extended break between
crop cycles. In recent years, to improve soil health, growers have started to introduce fallow periods and, more importantly, green manures. Benefits of breaking the monocrop cycle with a green manure include breaking pest and disease
International Sugar Journal | ISJ's World Sugar Outlook 201524 25www.internationalsugarjournal.com
cycles and increasing microbial populations. Further benefits include nitrogen fixation (by legume crops), weed control, increased organic matter levels and water infiltration rates, and soil cover (Garside and Bell, 2007). Green manuring, however, can only be practised once during every crop cycle (i.e. every 8-10 years). Intercropping – planting an alternative crop between the rows of growing sugarcane – was therefore considered as a means of obtaining ‘green manuring’ benefits within each season.
Intercropping has been used successfully for many years in low input cropping systems around the world (Anil et al., 1998). Numerous benefits, such as increasing yield and land use efficiency (Dhima et al., 2007) improvement of yield stability within cropping systems (Lithourgidis et al., 2006), enhancing light, water and nutrient use (Lithourgidis et al., 2008), soil conservation improvement (Anil et al., 1998) and a method of control for weeds, insects and/or diseases (Willey, 1979; Vasilakoglou et al., 2008) have been reported. Moreover, the use of leguminous intercrops can help naturally increase the available nitrogen in the soil, thereby reducing the use of inorganic fertilisers (Tosti and Guiducci, 2010). Parsons et al. (1999, 2003) reported on the planting of vegetables between sugarcane rows to improve land use efficiency and profitability. Although the results of his studies showed reduced cane yields in the cane + vegetable plots compared to cane-only plots, intercropping proved more profitable where the correct management strategies were adhered to. The use of intercrops to manage nematodes on small scale grower farms in the South African sugarcane industry has also been investigated. In this study, sugar beans grown as an intercrop reduced the number of Meloidogyne (a particularly damaging nematode in sugarcane), but also reduced cane and sugar yield (Berry et al., 2009).
The objectives of this study were to evaluate the impact of growing an intercrop between sugarcane rows on cane yield, as well as to determine whether inorganic nitrogen application could be reduced in the presence of an intercrop. Finally, a study on the economic viability of intercropping with soybeans was conducted.
Materials and methods
Trial 1
In October 2009, a rainfed trial was planted at Paddock on the south coast of KwaZulu-Natal. The row spacing was 0.9 m. Each plot had three nett rows and two guard rows, each
row 10 m long. There was a 1 m break between each plot, in which no cane was planted. Plots were arranged in a randomised complete block design with six replicates of each treatment. Cane was planted double stick and cut into 3-4 budded setts before covering. Cowpeas were planted as an intercrop in the plant crop, and lupins in the first ratoon. In the plant crop, one row of cowpeas was planted between each cane row. In the first ratoon, one row of lupins was planted on either side of the cane row (i.e. two rows of lupins in each cane interrow). In the plant crop, intercrops were planted at the same time as the cane setts, and, in the ratoon, within one month of harvesting the cane. Some plots had intercrops from the plant crop, while in others, intercrops were planted only in the first ratoon. After three months, intercrops in half the plots were slashed and removed from the field (Figure 1, without residue treatment). Intercrops in the remaining plots were sprayed with herbicide and left to senesce in situ (Figure 1, with residue treatment). Control plots had cane only, without any intercrops. In all plots (intercropped as well as cane-only), the cane was harvested on an 18 month cycle for the plant and first ratoon crops, after which the trial was terminated. Phosphorus and potassium were supplied as per recommendations from the Fertiliser Advisory Service (FAS) at the South African Sugarcane Research Institute at Mount Edgecombe, while nitrogen was varied according to treatment (Figure 1).
Trial 2
In October 2009, an irrigated trial was planted inland from the KwaZulu-Natal north coast at Nkwaleni. The row spacing was 1.6 m. Each plot had three nett rows and two guard rows, each row 10 m long. There was a 1 m break between each plot, in which no cane was planted. Plots were arranged in a split-split plot design. Cane was planted double stick and cut into 3-4 budded setts before covering. Soybeans were planted as an intercrop, with one row of soybeans planted between each cane row in the plant crop. Thereafter, in each subsequent ratoon, one row of soybeans was planted on either side of the cane row (i.e. two rows of soybeans in each cane interrow). Intercrops were planted at the same time as plant crop, and, in the ratoon, within one month of harvesting the cane. Some plots had intercrops from the plant crop, while in others, intercrops were planted from the first ratoon only. At this site, all the plots with intercrops were planted on the same section of the field,
The objectives of this study were to evaluate the impact of growing an intercrop between sugarcane rows on cane yield, as well as to determine whether inorganic nitrogen application could be reduced in the presence of an intercrop

International Sugar Journal | ISJ's World Sugar Outlook 201526 27www.internationalsugarjournal.com
Intercropping in sugarcane: A practice worth pursuing?
next to the controls and other intercrop plots. After three months, intercrops in half the plots were slashed and removed from the field (Figure 1, without residue treatment). Control plots had cane only, without any intercrops. In all plots, the cane was harvested annually for the plant and first ratoon crops. The second ratoon had to be harvested at eight months, due to accidental ripening of the trial by the grower. Following the second ratoon, the trial was terminated. Phosphorus and potassium were supplied as per recommendations from the FAS while nitrogen was varied according to treatment (see Figure 1). Soybeans were protected from soybean rust with four 3-weekly sprays of Punch C® at 0.6 L/ha over December and January each year.
Trials 3 and 4
Two irrigated trials in Pongola commenced in ratoon crops in November 2010. One trial was on a private grower’s farm (Trial 3) and one at the SASRI research farm (Trial 4). Each plot was made up of three nett rows and two guard rows, each row 10 m long. The row spacing was 1.5 m. A 1 m break between each plot was cleared of sugarcane. Plots were arranged in a randomised complete block design, with six replicates of each treatment. Soybeans were planted as an intercrop in these trials, with one row of soybeans planted on either side of the cane row (i.e. two rows of soybeans in each cane interrow). Intercrops were planted within one month of harvesting the cane. After three months, intercrops in half of the plots were slashed and removed from the field (Figure 1, without residue treatment). Control plots had cane only, without any intercrops. In all plots, the
cane was harvested annually for two ratoons, after which the trials were terminated. Trial 3 was started in the second ratoon and Trial 4 in the first ratoon. Phosphorus and potassium were supplied as per recommendations from the FAS while nitrogen was varied according to treatment (See Figure 1). Soybeans were protected from soybean rust with four 3-weekly sprays of Punch C® at 0.6 L/ha, over December and January each year.
Treatments
The main treatments are summarised in Figure 1. Cane was planted as cane-only controls or with intercrops. The cane only controls had two nitrogen levels: 0% nitrogen (0N) and 100% nitrogen (100N) based on fertiliser recommendations from the FAS. The intercropped treatments had four nitrogen levels: 0% (0N), 33% (33N), 67% (67N) and 100% (100N) based on the FAS fertiliser recommendations. A ‘residue’ treatment was superimposed on each nitrogen level within the intercropped treatments, with some plots having the intercrop residue left on the soil surface (Figure 1, with residue treatment), and others where the residue was removed completely from the trial plot (Figure 1, without residue treatment). However, at Trial 4 in Pongola the residue was left on the soil surface in all intercropped treatments.
Sampling and processing
At each harvest, the cane in the nett rows of each plot was cut by hand and weighed. The yield of each plot was calculated and expressed as tons cane per hectare (tc/ha). From each plot, 12 stalks were randomly collected for sucrose content and juice quality analysis.
Data analyses Yield data (cane and recoverable value (RV) yield) from individual treatments were subjected to a general analysis of variance and, where data were missing, a restricted maximum likelihood (REML) analysis was used. REML analysis was also used to test for interactions between treatments and/or main effects of treatments. All analyses were performed using Genstat® Release 13.2. Means were separated using the Sidak test at the 5% significance level. Due to the design of Trial 2, intercropped plots in the plant crop were analysed using analysis of variance (ANOVA) and thereafter compared to the control using student t-tests.
Figure 1. Schematic describing treatments tested at each trial site.
Economic modelling To assess the economic implications of intercropping compared with conventional monocropping, a simple economic analysis was conducted. As far as possible, prices were as at 28 February 2013.
Modelling approach and scenarios A cost-benefit analysis was conducted for three intercropping scenarios, taking into account revenue generated from sales of sugarcane and harvested intercrops, and considering the costs of labour, pest control, intercrop establishment and harvesting costs, and inorganic nitrogen applications. For the sake of brevity, only one trial site was selected (rather than conducting four analyses with much repetition). Trial 4 was selected, as it was the most representative of the three irrigated soybean trials.
The net partial margin (NPM, R/ha) reflected only the costs and incomes that differed between the treatments, and was calculated for each scenario as the difference between the sum of income earned and the sum of costs incurred.
The three economic scenarios considered were: Scenario 1 (conventional cane-only monocrop), which was characterised by a higher N
application requirement (and costs) than the other treatments. Scenario 2 (non-harvested soybean intercrop), which reflected reduced N-application
costs to the sugarcane (due to the presence of a leguminous intercrop), as well as increased costs associated with establishing the intercrop and managing weeds in the intercropped situation.
Scenario 3 (harvested soybean intercrop), which reflected intermediate N-application costs, as much of the fixed N is removed via harvesting of soybean pods. This scenario also reflected the increased costs associated with establishing and harvesting the intercrop and managing weeds in the intercropped situation.
Ramouthar PV et al Proc S Afr Sug Technol Ass (2013) 86: 55 - 66
58
Figure 1. Schematic describing treatments tested at each trial site.

International Sugar Journal | ISJ's World Sugar Outlook 201526 27www.internationalsugarjournal.com
Data analyses
Yield data (cane and recoverable value (RV) yield) from individual treatments were subjected to a general analysis of variance and, where data were missing, a restricted maximum likelihood (REML) analysis was used. REML analysis was also used to test for interactions between treatments and/or main effects of treatments. All analyses were performed using Genstat® Release 13.2. Means were separated using the Sidak test at the 5% significance level. Due to the design of Trial 2, intercropped plots in the plant crop were analysed using analysis of variance (ANOVA) and thereafter compared to the control using student t-tests.
Economic modelling
To assess the economic implications of intercropping compared with conventional monocropping, a simple economic analysis was conducted. As far as possible, prices were as at 28 February 2013.
Modelling approach and scenarios
A cost-benefit analysis was conducted for three intercropping scenarios, taking into account revenue generated from sales of sugarcane and harvested intercrops, and considering the costs of labour, pest control, intercrop establishment and harvesting costs, and inorganic nitrogen applications. For the sake of brevity, only one trial site was selected (rather than conducting four analyses with much repetition). Trial 4 was selected, as it was the most representative of the three irrigated soybean trials.
The net partial margin (NPM, R/ha) reflected only the costs and incomes that differed between the treatments, and was calculated for each scenario as the difference between the sum of income earned and the sum of costs incurred.
The three economic scenarios considered were:• Scenario 1 (conventional cane-only
monocrop), which was characterised by a higher N application requirement (and costs) than the other treatments.
• Scenario 2 (non-harvested soybean intercrop), which reflected reduced N-application costs to the sugarcane (due to the presence of a leguminous intercrop), as well as increased costs associated with establishing the
intercrop and managing weeds in the intercropped situation.
• Scenario 3 (harvested soybean intercrop), which reflected intermediate N-application costs, as much of the fixed N is removed via harvesting of soybean pods. This scenario also reflected the increased costs associated with establishing and harvesting the intercrop and managing weeds in the inter
Soybean and sugarcane intercrop
Sugarcane and soybean yields were based on field trial observations (Trial 4). A soybean yield of 1.3 t/ha (12% moisture) was obtained in Trial 4, while cane yields of 85.7 tc/ha and 79.8 tc/ha, as obtained for the cane-only control and the 66%N intercropped treatments respectively, were used in the model. The commodity price for soybeans was assumed to be R4500/t.
Field staff rates and requirements
It was assumed that field staff costs (W, R/d) would amount to R99.40 for a 7-hour day. This figure was based on the SA Cane Growers’ Association 2012 figures (SACGA G-tables) for supervised field staff (including supervision costs) of R84/day (based on a minimum wage of R69/day). This figure was scaled according to the recent minimum wage increase to R105/day for a 9-hour day (Equation 1).
Soybean and sugarcane intercrop Sugarcane and soybean yields were based on field trial observations (Trial 4). A soybean yield of 1.3 t/ha (12% moisture) was obtained in Trial 4, while cane yields of 85.7 tc/ha and 79.8 tc/ha, as obtained for the cane-only control and the 66%N intercropped treatments respectively, were used in the model. The commodity price for soybeans was assumed to be R4500/t.
Field staff rates and requirements It was assumed that field staff costs (W, R/d) would amount to R99.40 for a 7-hour day. This figure was based on the SA Cane Growers’ Association 2012 figures (SACGA G-tables) for supervised field staff (including supervision costs) of R84/day (based on a minimum wage of R69/day). This figure was scaled according to the recent minimum wage increase to R105/day for a 9-hour day (Equation 1).
Eq 1
Two man-days were assumed to be required for establishing the intercrops (Scenarios 2 and 3), and 8 man-days would be required for manual harvest and threshing of harvested soybeans in Scenario 3. Weed control was assumed to be more labour-intensive for intercrops than monocrops, with the former requiring 12 man-days compared with 3 man-days for the latter.
Herbicide and fungicide costs Herbicide costs for Scenario 1 (monocrop) were calculated at R1095/ha, based on applications of 1 kg/ha Velpar DS (pre- to early post-emergence), 3.5 L/ha MCPA, 5 L/ha Ametryn and 0.9 L/ha Summit Super (post-emergence), and 0.05 kg/ha Servian and 0.1 L/ha Complement Super (for watergrass control).
Weed control in the intercropped scenarios was more challenging than the monocropped system, due to the simultaneous presence of a grass and a broadleaf crop in the field. For parts of the weed spectrum, then, manual weeding was the only option available. In the intercropped scenarios, herbicide and fungicide costs would amount to R2430/ha, based on 1.8 L/ha Metolachlor (pre- to early post-emergence), 3 L/ha Basagran and 2 L/ha Velocity Glifo (post-emergence), and 2.4 L/ha Punch C (over four applications, for rust control).
Intercropping establishment and harvesting costs The intercrop planting costs were based on a trailed minimum till mechanical planter operating cost (excluding labour and interest) of R311/h, travelling at 8 km/h on a clay soil, drawn by a 50 kW tractor at a cost of R135.44/h (Lubbe et al., 2013). At 60% field efficiency and a swath width of 2 m, the intercrop seed planter and tractor were assumed to cost a total of R465/ha to plant soybeans. Seed was assumed to cost R1225/ha, and inoculant R117/ha.
Nitrogen applications It was assumed that 2 man-days per hectare would be required for applying fertiliser of between 80 and 120 kg/ha. The following nitrogen rates were used:
Scenario 1: 120 kg/ha N (100% of the FAS recommendation for cane-only control) Scenario 2: 80 kg/ha N (as used in the 66% N intercropped treatments in Trial 4) Scenario 3: 105 kg/ha N (N reduction used in Scenario 2, reduced by 60% to account for
the amount of nitrogen removed in the harvested soybeans).
The N-carrier used was urea at a cost of R10.98/kg N.
Ramouthar PV et al Proc S Afr Sug Technol Ass (2013) 86: 55 - 66
59
Two man-days were assumed to be required for establishing the intercrops (Scenarios 2 and 3), and 8 man-days would be required for manual harvest and threshing of harvested soybeans in Scenario 3. Weed control was assumed to be more labour-intensive for intercrops than monocrops, with the former requiring 12 man-days compared with 3 man-days for the latter.
Herbicide and fungicide costs
Herbicide costs for Scenario 1 (monocrop) were calculated at R1095/ha, based on applications of 1 kg/ha Velpar DS (pre- to early post-emergence), 3.5 L/ha MCPA, 5 L/ha Ametryn and 0.9 L/ha Summit Super (post-emergence), and 0.05 kg/ha Servian and 0.1 L/ha Complement Super (for watergrass control).
Weed control in the intercropped scenarios was more challenging than the monocropped system, due to the simultaneous presence of a grass and a broadleaf crop in the field. For
Eq 1

International Sugar Journal | ISJ's World Sugar Outlook 201528 29www.internationalsugarjournal.com
parts of the weed spectrum, then, manual weeding was the only option available. In the intercropped scenarios, herbicide and fungicide costs would amount to R2430/ha, based on 1.8 L/ha Metolachlor (pre- to early post-emergence), 3 L/ha Basagran and 2 L/ha Velocity Glifo (post-emergence), and 2.4 L/ha Punch C (over four applications, for rust control).
Intercropping establishment and harvesting costs
The intercrop planting costs were based on a trailed minimum till mechanical planter operating cost (excluding labour and interest) of R311/h, travelling at 8 km/h on a clay soil, drawn by a 50 kW tractor at a cost of R135.44/h (Lubbe et al., 2013). At 60% field efficiency and a swath width of 2 m, the intercrop seed planter and tractor were assumed to cost a total of R465/ha to plant soybeans. Seed was assumed to cost R1225/ha, and inoculant R117/ha.
Nitrogen applications
It was assumed that 2 man-days per hectare would be required for applying fertiliser of between 80 and 120 kg/ha. The following nitrogen rates were used:• Scenario 1: 120 kg/
ha N (100% of the FAS recommendation for cane-only control)
• Scenario 2: 80 kg/ha N (as used in the 66% N intercropped treatments in Trial 4)
• Scenario 3: 105 kg/ha N (N reduction used in Scenario 2, reduced by 60% to account for the amount of nitrogen removed in the harvested soybeans).
The N-carrier used was urea at a cost of R10.98/kg N.
Results
Analyses of the individual treatments showed that there were no significant differences between the plots where intercrop residue was left on the surface and the plots where the residue was removed. This held true for all harvest times at all trial sites. The REML analyses showed that, with the exception of Trial 4 (first ratoon),
there was no significant interaction between the treatments at any harvest at any of the trial sites. Therefore individual treatments will be presented for Trial 4 in the first ratoon only, while main effects will be presented for all other harvests at all other trial sites.
At Paddock, there was no significant yield response to nitrogen in the plant crop (Table 1). Similarly, there was no significant difference in cane or RV yield between the cane only controls and the intercropped plots. A significant response to nitrogen was noted in the first ratoon but, again, no significant difference in cane or RV yield between the cane-only controls and the intercropped plots was found. In both crops, however, there was a tendency towards higher yields in the intercropped plots.
Owing to the trial design at Nkwaleni, all the plots with intercrops from the first ratoon only were at one end of the field, while those with intercrops grown from the plant crop, as well as the controls, were at the other end. The
part of the field with the ratoon-intercropped treatments experienced irrigation difficulties and was continuously waterlogged. Owing to the significant difference in field conditions between these treatments and the controls, the results generated for these treatments were omitted to prevent erroneous comparisons.
Similar to Paddock, no significant nitrogen response was noted in the plant crop at Nkwaleni
Table 1. Effect of varying nitrogen application rates and intercropping on cane and recoverable value (RV) yields under rainfed conditions at Paddock over a plant crop and one ratoon, harvested on an 18 month cycle. Means with the same letter are not significantly different at the 5% significance level. Please note comparisons are to be made for main effects only, i.e. different levels of nitrogen compared to each other, and controls and intercrops compared to each other
Plant crop First ratoon
Treatment Cane yield RV yield Cane yield RV yield
0N 80a 9.5a 56a 7.8a
33N 73a 8.8a 66b 9.5b
67N 74a 8.9a 71b 10.0b
100N 81a 9.7a 78c 11.1c
Control 77a 9.7a 66ab 9.4ab
Intercrop (PC)
86a 9.9a 70b 9.9b
Intercrop (R)*
N/A N/A 72b 10.2b
*These treatments received intercrops only from the first ratoon onwards
Intercropping in sugarcane: A practice worth pursuing?
The first ratoon yield results of the SASRI research farm trial (Trial 4) were the only results that showed an interaction between nitrogen levels applied and the presence of an intercrop

International Sugar Journal | ISJ's World Sugar Outlook 201528 29www.internationalsugarjournal.com
(Table 2), although a significant reduction in cane yield was noted for the intercropped plots compared to the cane only controls. A response to nitrogen was seen in the subsequent ratoons with all other rates yielding significantly better than the zero nitrogen treatment. Similar to the plant crop, a significant reduction in the intercropped plots compared to the cane-only controls was noted in the first ratoon. In direct contrast to the plant crop and first ratoon, the second ratoon showed a slight increase in yield in the intercropped plots, but the increase was
not significant (Table 2). Second ratoon yields were lower than the first due to an earlier harvest date (see Materials and Methods).
Although no significant response to nitrogen was noted in the second ratoon at the grower’s farm in Pongola, a significant increase in cane yield was noted with increasing nitrogen in the third ratoon (Table 3). A non-significant increase in RV yield was also noted.
The first ratoon yield results of the SASRI research farm trial (Trial 4) were the only results that showed an interaction between nitrogen levels applied and the presence of an intercrop. A significant increase in cane and RV yield was noted, with an increase in nitrogen levels in the intercropped plots (Figure 2). In the controls, however, although a slight decrease in yield was noted in the 0N control compared to the 100N control, this difference was not significant.
In the second ratoon at the research farm (Trial 4), a significant yield response to nitrogen was noted. Again, there was a (non-significant) trend towards reduced yields in the intercropped
Table 2. Effect of varying nitrogen application rates and intercropping on cane and recoverable value (RV) yields under irrigated conditions at Nkwaleni over a plant crop and two ratoons, harvested annually. Means with the same letter are not significantly different at the 5% significance level. Please note comparisons are to be made for main effects only, i.e. different levels of nitrogen compared to each other and controls and intercrops compared to each other
Plant crop First ratoon Second ratoon
Treatment Cane yield
RV yield
Cane yield
RV yield
Cane yield
RV yield
0N 79a 11.7a 72a 11.5a 44a 6.4a
33N 85a 12.4a 81b 13.1b 52b 7.7b
67N 70a 10.5a 87b 13.9b 54b 8.0b
100N 78a 11.5a 88b 13.9b 56b 8.3b
Control *86a 12.8a 92a 14.7a 48a 7.1a
Intercrop (PC)
*70b 10.2b 80b 12.7b 52a 7.8a
*Comparisons done using a two-sample t-test
Table 3. Effect of varying nitrogen application rates and intercropping on cane and recoverable value (RV) yields under irrigated conditions at Pongola (Trial 3) over two ratoons, harvested annually. Means with the same letter are not significantly different at the 5% significance level. Please note comparisons are to be made for main effects only, i.e. different levels of nitrogen compared to each other, and controls and intercrops compared to each other
Second ratoon Third ratoon
Treatment Cane yield RV yield Cane yield RV yield
0N 92a 13.1a 83a 11.2a
33N 90a 13.1a 84ab 11.5a
67N 91a 12.8a 102ab 13.7a
100N 100a 14.5a 106b 14.4a
Control 96a 13.8a 94a 12.6a
Intercrop (R)
90a 12.9a 93a 12.9a
Figure 2. Effect of varying nitrogen application rates and intercropping on cane and recoverable value (RV) yields under irrigated conditions at Pongola (Trial 4) in the first ratoon, harvested annually. Means with the same letter are not significantly different at the 5% significance level. Error bars represent standard error.
Figure 2. Effect of varying nitrogen application rates and intercropping on cane and recoverable value (RV) yields under irrigated conditions at Pongola (Trial 4) in the first ratoon, harvested annually. Means with the same letter are not significantly different at
the 5% significance level. Error bars represent standard error.
Table 4. Effect of varying nitrogen application rates and intercropping on cane and recoverable value (RV) yields under irrigated conditions at Pongola (Trial 4) in the second ratoon, harvested annually. Means with the same letter are not significantly different at the 5% significance level.
Please note comparisons are to be made for main effects only, i.e. different levels of nitrogen compared to each other, and controls and intercrops compared to each other.
Second ratoonTreatment Cane yield RV Yield
0N 70.6a 10.3a
33N 83.5ab 12.0ab
67N 86.0b 12.9b
100N 83.1b 12.7b
Control 84.6a 12.6a
Intercrop (R) 77.0a 11.4a
Economic analysis results The results of the economic analysis are shown in Table 5.
Based upon the net partial margins calculated using the results from Trial 4, Scenario 1 (cane-only) yielded the greatest profit per hectare, with a harvested soybean intercrop and non-harvested intercrop yielding lower returns.
A B
Ramouthar PV et al Proc S Afr Sug Technol Ass (2013) 86: 55 - 66
62

International Sugar Journal | ISJ's World Sugar Outlook 201530 31www.internationalsugarjournal.com
plots compared to the cane only controls (Table 4).
Economic analysis results
The results of the economic analysis are shown in Table 5.
Based upon the net partial margins calculated using the results from Trial 4, Scenario 1 (cane-only) yielded the greatest profit per hectare, with a harvested soybean intercrop and non-harvested intercrop yielding lower returns.
Discussion
Yield analyses
Even though a significant reduction in cane yield was noted in only two out of the
nine crops harvested, the general trend was towards a lower yield in the intercropped plots compared to the cane-only controls. Studies conducted in wheat using a faba bean intercrop system also showed a reduction in wheat biomass when the intercropped faba bean biomass was high, but an overall increase in wheat grain quality was still obtained. This was due to the competitiveness of the cereal being greater than that of the legume, therefore it was able to compensate once the legume competition was removed (Tosti and
Table 4. Effect of varying nitrogen application rates and intercropping on cane and recoverable value (RV) yields under irrigated conditions at Pongola (Trial 4) in the second ratoon, harvested annually. Means with the same letter are not significantly different at the 5% significance level. Please note comparisons are to be made for main effects only, i.e. different levels of nitrogen compared to each other, and controls and intercrops compared to each other
Second ratoon
Treatment Cane yield RV yield
0N 70.6a 10.3a
33N 83.5ab 12.0ab
67N 86.0b 12.9b
100N 83.1b 12.7b
Control 84.6a 12.6a
Intercrop (R) 77.0a 11.4a
Table 5. Cost and income sources and amounts (R/ha) for three scenarios: (1) cane-only monocrop; (2) non-harvested soybean/cane intercrop; (3) harvested soybean/cane intercrop. The net partial margin is the sum of income minus the sum of costs for each scenario
Cost and revenue parameters (R/ha)
Scenario 1(cane-only)
Scenario 2 (non-harvested soybean intercrop)
Scenario 3 (harvested soybean intercrop)
Revenue generated
Revenue from cane yield
42 746 39 936 39 936
Revenue from sale of intercrops
0 0 5 856
Cane harvesting costs
1 789 1 590 1 590
Weed and soybean rust control costs
1 393 3 623 3 623
N-application costs
1 516 1 077 1 352
Intercrop planting costs
0 2 004 2 004
Intercrop harvesting/treatment costs
0 0 795
Net partial margin
Net partial margin 38 048 31 642 36 428
Intercropping in sugarcane: A practice worth pursuing?

International Sugar Journal | ISJ's World Sugar Outlook 201530 31www.internationalsugarjournal.com
Guiducci, 2010). Studies by Lithourgidis et al. (2011) also showed a higher dry matter yield in the monocropped wheat plots compared to the wheat plots intercropped with peas. Conversely, intercropping of sweet potato and pigeon-pea (Nedunchezhiyan et al., 2011) and alfalfa and corn (Zhang et al., 2011) showed better yields than sweet potato or corn planted on its own. The forage quality of common fetch was also increased by intercropping with a legume. It has been established that in a soybean-sorghum intercropping scenario, the two plants do compete for nitrogen and phosphorus and that the stronger plant (in this case sorghum) can deplete the nutrient source (Ghosh et al., 2009). It can thus be rationalised that the success of an intercrop depends on the competitive difference between the intercrops. To intercrop with sugarcane and still get maximum sugarcane yields, the intercrop selected should be a crop that is less competitive than sugarcane. It is possible that the intercrops used in this study were too competitive for light, water and nutrients, causing some yield reduction in the sugarcane crop.
An unexpectedly poor response to nitrogen was noted in these trials. Less than half of the crops harvested showed a significant increase in yield with an increased nitrogen application rates. This made analysis of the results particularly challenging when attempting to discern the nitrogen effects of the leguminous intercrops. Out of the four crops where a significant response was seen, only one case showed that nitrogen could be reduced in the presence of an intercrop without negatively impacting yields. A more accurate picture of nitrogen contribution by the intercrops might be obtained from leaf analysis of the cane-only controls and the intercropped plots. Tosti and Guiducci (2010) analysed N content of wheat grown in the presence of a faba bean intercrop and found a significant increase (p<0.01) in the intercropped
plots compared to the monocropped control in one out of the two years tested. The non-significant difference in the first year is attributed to the much higher biomass exhibited by the legume compared to the cereal, and therefore the wheat was out-competed by the legume. Here too, the competition between the intercrop and the cane seemed to be greater than the effect of nitrogen.
Economic analysis
Based on the results obtained, intercropping does not appear to be an economically viable option for commercial growers, even when income from a modest soybean harvest is taken into account. However, it is difficult to assign a monetary value to an exercise designed primarily to improve soil health. Soil changes occur gradually and are unlikely to become noticeable – in terms of improved cane yields – within the first two seasons. It is thus somewhat challenging to assess the economic viability of a practice such as intercropping.
In the three scenarios studied, lower cane yields (as obtained in Trial 4) were assigned to the intercropped plots than to the cane-only controls. Even when equal cane yields were assigned to all scenarios (data not shown), the cane-only scenario was still the economic winner. Scenario 3 (harvested soybean intercrop) is perhaps the least currently realistic of the three economic scenarios considered, because of difficulties associated with soybean market access in Pongola. Market access throughout the sugar industry, in fact, is likely to be limited. However, this scenario might become more feasible if a larger number of sugarcane growers in a particular region were to grow soybeans, either as break crops or intercrops. This could facilitate the combined purchase of planting and harvesting equipment, thereby reducing costs, or else encourage a contractor to service the area. Even with such arrangements, however,

International Sugar Journal | ISJ's World Sugar Outlook 201532 33www.internationalsugarjournal.com
the fact remains that, when planted as an intercrop, the soybeans will most likely need to be harvested by hand so that the sugarcane will not be damaged, and this is a labour-intensive operation. If this challenge can be overcome, and at least 50% greater intercrop yields can be obtained, Scenario 3 could become the most economically attractive scenario.
Practical considerations
Although intercropping does promise some benefits, in a commercial situation a large number of practical considerations need to be taken into account. Intercropping entails conducting extra field operations such as sowing the seed and harvesting the intercrop or slashing it back so that it does not outgrow the sugarcane. Weed control in intercropping scenarios is also more difficult as there is often a combination of broadleaf (intercrop) and grass plants (sugarcane) within the same field, making selection of herbicides difficult, both in terms of current weed control, and the use of residual products which could kill an intercrop planted at a later date. A crop such as soybeans needs particular attention in terms of planting, disease control and nutrition which is very different to growing cane. The potential also exists for the intercrop species to resist eradication and become a weed problem in the field. Identification and protection of the intercrops can also be challenging. In one of the trials described above, the intercrops were mistaken for weeds, and sprayed with herbicide. It must be emphasised, then, that intercropping, on the whole, is a much more management intensive operation than growing sugarcane alone.
Future work
Data on various soil health parameters were collected during the trials described in this paper. Analysis of these data are underway and will be reported on in future if robust conclusions can be made regarding the impacts of intercropping on soil health.
Conclusions
To answer the question posed in the title, based on the results of the study and the lessons learned during the trials, intercropping does not seem to be an attractive proposition for commercial growers. Sugarcane yields were generally reduced by the presence of an intercrop and, because nitrogen responses in the study were generally poor, no conclusions regarding
reduced nitrogen applications could be made. Economic analyses suggested that a sugarcane-soybean intercrop system is less profitable (in the short term) than a sugarcane only system. From a soil health perspective, however, it may be beneficial, but this is difficult to quantify and was not quantified in this study. A more likely application could be in the small scale sector where growers could make maximum use of their limited land to plant staple food crops (Parsons, 1999; 2003).
Acknowledgements
The authors would like to thank the following people for their contribution to the paper: Sifiso Mhlaba, Nikki Sewpersad, Michiel Smit, Surashna Hariparsad, Peta Campbell, Peter Tweddle, Johan Nel, Kurt Stock, Rodney Morgan and Herman Bardenhorst/Lourens (the manager/growers from the farms on which the trials were conducted), the Extension Specialists in those areas where the trials were conducted and the field technicians from SASRI who performed most of the physical work for this study. *This paper was presented at the 2013 South African Sugar Technologists Association's annual conference and is published here with the agreement of the Association
References
Anil L, Park J, Phipps RH, Miller FA (1998). Temperate
intercropping of cereals for forage: a review of the
potential for growth and utilization with particular
reference to the UK. Grass Forage Sci 53: 301-317.
Berry SD, Dana P, Spaull VW and Cadet P (2009).
Effect of intercropping on nematodes in two small-
scale sugarcane farming systems in South Africa.
Nematropica 39: 11-33.
Dhima KV, Lithourgidis AS, Vasilakoglou IB and Dordas
CA (2007). Competition indices of common vetch and
cereal intercrops in two seeding ratio. Field Crops Res
100: 249-256.
Garside AL and Bell MJ (2007). The value of legume
breaks to the sugarcane cropping system – cumulative
yields for the next cycle, potential cash returns from
the legume, and duration of the break effect. Proc Aust
Soc Sug Cane Technol 29: 299-308.
Ghosh PK, Tripathi AK, Bandyopadhyay KK and Manna
MC (2009). Assessment of nutrient competition and
nutrient requirement in soybean/sorghum intercropping
system. Europ J Agron 31: 43-50.
Lithourgidis AS, Dordas CA, Lazaridou TB and
Papadopoulos II (2008). Silage yield and protein
content of common bean intercropped with corn in
two-row replacements. pp 217-218 In: Proceedings
Intercropping in sugarcane: A practice worth pursuing?
Economic analyses suggested that a sugarcane-soybean intercrop system is less profitable (in the short term) than a sugarcane only system
International Sugar Journal | ISJ's World Sugar Outlook 201532 33www.internationalsugarjournal.com
10th ESA Congress, Bologna, Italy, 15-19 September
2008. Italian J Agron
Lithourgidis AS, Vasilakoglou IB, Dhima KV, Dordas A
and Yiakoulaki MD (2006). Forage yield and quality of
common vetch mixtures with oat and triticale in two
seeding ratios. Field Crops Res 99:106-113.
Lithourgidis AS, Vlachostergios DN, Dordas CA and
Damalas CA (2011). Dry matter yield, nitrogen content
and competition in pea-cereal intercropping systems.
Europ J Agron 34: 287-294.
Lubbe PA, Archer CG and Whitehead ENC (2013).
Guide to machinery costs 2012/13. Department
of Agriculture, Forestry and Fisheries, Republic of
South Africa. Directorate of Communication Services,
Pretoria.
Nedunchezhiyan M, Laxminarayana K, Rajasekhara
Rao K and Satapathy BS (2011). Sweet potato (Ipomea
batatas L.) – based strip intercropping: I. interspecific
interactions and yield advantage. Acta Agron Hun. 59:
137-147.
Parsons MJ (1999). Intercropping with sugarcane. Proc
S Afr Sug Technol Ass 73: lviii-lxv.
Parsons MJ (2003). Successful intercropping with
sugarcane. Proc S Afr Sug Technol Ass 77: 77-98.
Tosti G and Guiducci M (2010). Durum wheat-faba
bean temporary intercropping: Effects on nitrogen
supply and wheat quality. Europ J Agron 33: 157-165.
Vasilakoglou I., Dhima K, Lithourgidis A and
Eleftherohorinos I (2008). Competitive ability of winter
cereal-common vetch intercrops against sterile oat.
Exp Agric 44: 509-520.
Willey RW (1979). Intercropping-its importance
and research needs. Part 1. Competition and yield
advantage. Field Crop Abstr 32 :1-10.
Zhang G, Yang Z and Dong S (2011). Interspecific
competitiveness affects the total biomass yield in
alfalfa and corn intercropping system. Fied Crops Res
124: 66-73.
P U TS C H ® G R O U PStord
The Stord Twin Screw Press
• for optimal dewatering effi ciency• robust design and low maintenance costWe support your operations worldwide – on site!
Stord International ASKokstadfl aten 17P. O. Box 4, Kokstad, NO-5863 Bergen – NorwayPhone: +47 55 98 40 20 · Fax +47 55 98 40 [email protected]
Anzeige_FO_Licht_e.indd 1 28.10.13 08:53

International Sugar Journal | ISJ's World Sugar Outlook 201534 35www.internationalsugarjournal.com
Challenges and potential solutions for storage of large quantities of bagasse for power generation
Bosch Projects, PO Box 2009, Durban, 4000, South [email protected] [email protected]
Email: [email protected] | [email protected] | [email protected]
Abstract Prolonged storage of large quantities of bagasse for off-season power generation presents challenges different from those associated with small-scale storage or large-scale, wet storage for pulp and paper production. The challenges include loss of fuel value, spontaneous combustion, bagasse handling and a variety of health and environmental impacts. Experiences with these challenges in Australia and Brazil are reviewed and suggestions made for alternative storage methods. Theoretical requirements for good storage are outlined. The possible special requirement of pasteurised bagasse from diffusers is highlighted. Keywords: bagasse, storage, power generation, bagassosis, combustion, diffuser bagasse
BS Purchase, S Rosettenstein and DV Bezuidenhoudt
Introduction
The increased demand for renewable energy has created opportunities for selling energy derived from bagasse. The simplest
route to such energy is combustion accompanied by steam and electricity generation. For commercial success, it is important that the expensive capital equipment is used throughout the year despite the seasonal production of bagasse. This dictates that

International Sugar Journal | ISJ's World Sugar Outlook 201534 35www.internationalsugarjournal.com
bagasse be stored for use during off-crop, or that an alternative fuel be used during off-crop. In most cases it is not viable to use an alternative fuel, therefore storage of large quantities of bagasse is a requirement. Very large quantities (>100 000 t) may be involved in cases where an optimised (high pressure) power generation unit draws surplus bagasse from a number of surrounding factories.
The storage of large quantities of bagasse presents challenges that are not faced by the existing small-scale, short-term storage systems that are operated by factories for use during start-ups and short stoppages. It might be assumed that experience with large-scale storage systems has been developed in countries like Mauritius and India, where off-crop power generation takes place. In these countries, however, most of the mill-based generation systems form an integral part of the national power supply, so they are sized to burn all the bagasse as it is produced and to then use coal during off-crop. There is thus no need to store bagasse.
Knowledge based on large-scale storage at pulp and paper factories is of limited value because the bagasse is stored in a water-saturated state. The storage system delivers bagasse that is too wet for combustion.
The trend towards power generation from bagasse has been accompanied by progress in developing other large-scale uses for the material, e.g. ethanol production (www. betarenewables.com) and bagasse-to-fuel via small-scale Fischer-Tropsch technology (www.oxfordcatalysts.com). Most of these other uses require minimum water in the bagasse and maximum preservation of the fuel components. They add to the need for effective non-saturated storage techniques.
This paper highlights the new challenges and gives perspectives on storage systems and their potential for large-scale application.
Perspectives on various options
Wet (saturated) bulk storage
This is appropriate where the bagasse is to be used in a wet state, e.g. for pulping. The bagasse is hydraulically transported and deposited in a pile that is kept saturated so as to minimise oxygen within the pile. This method has major application at present, but it has obvious disadvantages for bagasse that is to be used for combustion. In South Africa, it is applied at Felixton and Gledhow for depithed bagasse that is used in paper and cardboard. There is some loss of material during storage and handling
(Morgan et al., 1974). A disadvantage of this system is that the bagasse is laid down and retrieved as a dilute (3-5%) slurry, meaning that considerable energy has to be spent in moving water.
Bulk storage without added water
The bagasse is piled without adjusting the moisture content. This method has been used for relatively small-scale projects, but is currently of interest for the increasing number of projects that require large-scale storage for co-generation. There are, however, challenges associated with large-scale application of the method, and these justify a separate section within this paper.
Baled storage
Bales are formed, either with or without binding material. The bale size and degree of compaction vary according to requirements. By selecting an appropriate bale size and by stacking bales with air spaces between them, it has been possible to control the heat build-up in the bales and to enable the heat and air circulation to dry the bagasse from 50% to about 20% moisture. This is the basis of the so-called ‘Bagatex-20’ (Anon, 1986) method of bagasse storage. Compared to pile storage, it involves the additional expense of baling equipment and bale breaking equipment but it may reduce transport costs and allow long periods of stable storage. The moisture reduction leads to less loss of dry matter during prolonged storage and to higher net fuel value for combustion.
Baling was commonly used when bagasse was stored for manufacture of boards because it was thought to give better quality boards than bagasse from wet bulk storage. However, there are examples of bales having to be discarded because deterioration during storage caused the bagasse to form boards of unacceptable quality. This, together with high labour requirement for handling of bales, caused some conversion from baling to wet-bulk storage (Bernhardt, 1968).
Baling is generally used when trash is collected from the fields. It may also be appropriate where large quantities of bagasse need to be moved between mills. This is practised in India, where large continuous bales are ‘extruded’ into vehicles as a means of loading.
Briquetting
Briquetting involves higher compression than
The storage of large quantities of bagasse presents challenges that are not faced by the existing small-scale, short-term storage systems that are operated by factories for use during start-ups and short stoppages

International Sugar Journal | ISJ's World Sugar Outlook 201536 37www.internationalsugarjournal.com
baling. It produces a fuel with low moisture and high calorific value that can be used as a substitute for coal, or as a convenient cooking fuel. The bagasse must first be ground to uniform small particle size. It may then be charred (to increase carbon content and reduce moisture), mixed with a binder (molasses or flour) and compressed into a cylindrical form. Alternatively, it is not charred but is compressed and heated so that the lignin melts and acts as a binder, thereby saving the need for added binder (charring destroys the binding properties of lignin).
Briquetting is an expensive process suited to small-scale niche markets, but generally not economical for large-scale storage. Some bagasse briquettes resembling small logs were made by UCL Company Ltd. Most bagasse briquetting takes place in South East Asia.
Pelleting
This is essentially similar to briquetting but produces smaller and denser particles. The energy consumption by the pelleting process is substantial, being approximately as follows
(www.cpmeurope.nl):Pellet diameters range between 6 and 18
mm, with the smaller pellets being ideal for household furnaces and the larger ones for industrial furnaces. Pelleting offers advantages of dust control, reduction of shipping costs, ease of feeding and improved control of combustion. It also enables convenient presentation of materials for animal feeds.
During the 1980s, pelleted bagasse, combined with molasses and minerals, was produced at Maidstone for export to Europe as an animal feed. Sand in the bagasse caused costly wear of the pelleting dies. Some pelleting is done in Brazil for export to Europe as a biomass fuel, but the quantity is small and dependent on a market incentivised to reduce CO2 emissions.
Torrefication with briquetting (bio-coal production)
This involves drying and heating the bagasse under controlled conditions such that some volatiles are driven off but most of the energy value remains in the dried residual material,
which can be briquetted and stored (Bergman et al., 2005). This torrefication process might have future potential for satellite processing of biomass prior to transport to a central facility. It is essentially an energy-efficient form of charcoal production.
Bio-oil production
Thermal treatment of bagasse to produce volatile oils is another means of ‘compressing’ bagasse for storage and transport purposes. The development of a mini, modular SASOL-type process by Oxford Catalysts (www.oxfordcatalysts.com) has led to a recent announcement of a joint venture in Brazil aimed at producing liquid fuels from bagasse. It is anticipated that if this process is successful it will be more profitable than electricity sales from bagasse, but it is unlikely to be commercialised in the immediate future.
Challenges associated with large-scale, non-saturated storage
Compared to most boiler fuels, bagasse has the disadvantage of a high (about 50%) moisture content. This diminishes its fuel value and makes the fuel prone to deterioration during storage. Another disadvantage is that
the bagasse is produced at the factory (not the farm) so there is no opportunity for off-site scattered storage. Fuels such as switchgrass are relatively dry (<20% moisture) when harvested, and can be stored on farms without significant loss.
The major challenges in storing large quantities of bagasse include:
• loss of fuel value due to microbial activities during prolonged storage,
• chances of spontaneous combustion,• environmental impacts and• health issues associated with bagassosis.
Some bulk storage guidelines are available from research in the timber industry (reviewed by Searcy and Hess, 2010), but this research highlights differences that exist between different circumstances and sources of wood. Care is needed in applying the timber-based information to bagasse. An increasing source of biomass fuel is young trees that are grown in rows and harvested by chipping the entire tree, including leaves and bark. The harvested material is
Process: Drying Grinding Pelleting Cooling Other Total
kWh/t: 5 15 50 2.5 2.5 75
Challenges and potential solutions for storage of large quantities of bagasse for power generation

International Sugar Journal | ISJ's World Sugar Outlook 201536 37www.internationalsugarjournal.com
similar to bagasse in texture and moisture content. Storage of this material presents similar challenges to those of bagasse and has prompted research on storage techniques (Springer, ca.1979). A distinct disadvantage of whole-tree harvesting is that the bark and leaves provide nutrients for the agents of decay. Although bagasse is relatively free of these nutrients, the timber experience suggests that diffuser bagasse to which filter mud has been returned may behave differently because the mud is rich in nutrients.
Loss of fuel value due to deterioration
Measurement of losses from bulk piles is difficult and seldom attempted. Using open-weaved bags containing bagasse buried in wet bulk piles, Morgan et al. (1974) measured the following losses of dry mass:
In this case, losses were minimised by the anaerobic and acid conditions in the saturated storage system. Much higher losses can be expected from moist (unsaturated) conditions if the
microorganisms have greater access to air.One of the early reports of bulk storage
without moisture adjustment (Bernhardt, 1968) suggested that there was less than 5% loss but gave no details of how this was measured. The author assumed that the high pile (18 m) prevented air ingress, thereby preserving the bagasse. Bernhardt’s estimated (not measured) loss for baled material was 15%; however, Lois-Correa et al. (2010) made careful measurements and found that the loss in a closely packed stack of bales was 20-25% after only 40 days. Drying the bagasse to 25% moisture before baling reduced the loss to about 3% in 40 days, rising to only 6.5% after 120 days.
Dos Santos et al. (2011) observed that, in Brazil, bagasse is stored in piles of about 100 000 t by simply dozing the bagasse into place without much planning. Dos Santos et al. used thermo-gravimetric methods to track changes in the major components of bagasse during storage in one such pile (no added water). They concluded that after 150 days of storage, the loss in calorific value could be up to 32%, due mainly to the loss of the hemicellulose component.
Measurements in the timber industry
(summarised by Searcy and Hess, 2010) confirmed that drying to below 25% moisture almost eliminated subsequent deterioration, but that above 25% moisture, losses were proportional to initial moisture content. At 51% moisture, fine wood chips deteriorated at a rate of 2.2% per month, averaged over six months. The rate of loss (with timber) is generally much higher in the first few weeks than later. If similar dynamics apply to bagasse, this suggests that the bagasse storage system should be run on a last-in-first-out (LIFO) basis, at least for the early off-crop.
Although definitive information is lacking, the threat of serious loss during storage is evident. In the context of overall efficiency in the conversion of biomass to electricity, the storage stage is critical because it can probably affect energy recovery by as much as 25%.
Spontaneous combustion
Large piles of biomass are prone to self-heating that can lead to spontaneous combustion. Compared to timber, bagasse has the advantage that the plant cells have been killed and therefore do not contribute to the heating effect. However, spontaneous combustion, or accidental ignition, is a real problem. Bagasse fires in India have caused the loss of entire (10 000 t) storage piles (Lokapure et al., 2012).
The Australian industry has had partial success in developing a computer model that is reasonably accurate in predicting heat, moisture and oxygen movements in piles of loose or baled bagasse (Hobson and Mann, 2005, www.assct.com.au/). This has some value in anticipating fires, but its major future use is in decisions relating to the influence of storage formats on bagasse drying during storage. The model highlights the wide range of temperature and moisture conditions that exist in a pile of stored bagasse, even after 200 days. For example, a small (3 x 3 m) pile of closely stacked bales is likely to have a core temperature of 65°C, with only the outer 25 cm being close to ambient temperature.
In Australia, there is a tendency to store in multiple piles so as to mitigate the effect of fire. Fire fighting equipment is an important component of bagasse storage systems.
Bagassosis
This is a respiratory disease resulting from exposure to fungal spores from mouldy bagasse. It is thought to be the result of hypersensitivity to
Storage period
Drying
(wks) Loss of dry mass
(%)
2 1.7
8 4.3
20 5.3

International Sugar Journal | ISJ's World Sugar Outlook 201538 39www.internationalsugarjournal.com
the spores rather than infection, but this is not proven. The disease is sometimes misdiagnosed as tuberculosis. In one case, a factory using bagasse to make boards had no cases of bagassosis for 12 years but suddenly had a severe outbreak affecting more than 50% of the workers. The outbreak coincided with a change in source of bagasse from heat-dried bagasse to bagasse that was stored without drying. The outbreak occurred despite the use of masks (McMaster, 1974).
Environmental issues
Water pollution is caused by run-off from bagasse piles. It is therefore necessary to have an impervious base with channels leading to a collection pond, from which the polluted water can be passed to effluent treatment if necessary. The pond provides a convenient source of water for fire-fighting.
Bagasse dust is a major problem in windy areas and at bagasse transfer points. The problem has been so severe in Australia that consideration has been given to depithing the bagasse before storage. Models suggest that depithed bagasse will create 70% less dust than whole bagasse (Rainey et al., 2012). Surrounding storage areas with a barrier of trees and/or high wooden fencing helps to reduce the problem. Loading and transfer points may need to be enclosed. It is significant that the large storage piles at Felixton and Gledhow in South Africa consist of depithed bagasse. This, together with wet storage, has probably precluded the development of dust problems.
Noise and light have caused problems at storage sites close to residential areas. Reversing beepers have had to be disabled, thereby compromising safety.
Odour is sometimes a problem, particularly when piles are being broken.
From the foregoing, it is evident that there are significant environmental challenges associated with large-scale storage. Although the Australian sugar industry has co-operated with the Environment Protection Agency in drawing up guidelines, there has been strong community activism against a proposed large bagasse storage project.
Recent Australian and Brazilian experiences with piled storage
Developments in Australia have been summarised in a workshop on bagasse storage (www.assct.com.au/) and by Trayner (2008). This information is further summarised below.
Bagasse quantities and equipment at Pioneer cogeneration plant
At Pioneer cogeneration plant, about 110 000 t of bagasse is stored for use during off-crop. This amount is transferred in from three surrounding mills with the stock being built up over about 24 weeks and reclaimed in ten weeks.
The decision to transfer bagasse to a central plant rather than to generate at each of the four mills was based on:
• The critical role of fuel handling for cost effective operations.
• The requirement for close management of the bagasse storage to ensure: - Minimum fuel degradation. - Cost effective and safe handling without interruption by wet weather. - Minimum environmental impact.
• Ensuring economy of scale and energy efficiency by using the bagasse in a modern 65 bar, 37 MW condensing power plant.
Bagasse is transported to the central plant using six walking floor trucks with load volumes of 106 m3 (23 t). No baling is involved.
The bagasse is stored in discrete piles of about 10 000 t each so as to minimise the impact of fire.
Existing equipment at the mills was considered inappropriate for the large quantities involved. Appropriate equipment selected after consultation with mining, grain and cotton industries consisted of:• a storage pad and surrounding roads
designed to ensure that operations can continue during wet weather. This requires a compacted sloping hard-core with run-off collection and facilities for transfer of the run-off to the factory effluent plant. If run-off is not facilitated, there is a danger of water being ‘wicked’ into the bagasse and initiating conditions for spontaneous combustion,
• a special all-weather pad for use in extreme wet conditions,
• two dozers with extended blades for building and compressing piles,
• one front-end loader with a ‘pusher-bar’ that was designed in-house and resembles an inverted inclined ‘scratcher’ powered by the loader power-take-off. The pusher bar pushes bagasse up into piles while the loader remains on the ground,
• two 30 t excavators with extended buckets (5 m3) used for reclaiming the bagasse and
From the foregoing, it is evident that there are significant environmental challenges associated with large-scale storage
Challenges and potential solutions for storage of large quantities of bagasse for power generation

International Sugar Journal | ISJ's World Sugar Outlook 201538 39www.internationalsugarjournal.com
loading into trucks. These, being tall, have also been used for dragging tarpaulins into place over the piles,
• two high-sided 15 t trucks for transporting reclaimed bagasse to the mill,
• sixty tarpaulins (55 x 24 m) for covering the piles,
• two stitching machines for tarpaulin repairs,• thermocouples for monitoring pile
temperatures, and• a fire fighting system, including run-off storage
dam for water supply. Experiences with equipment at Pioneer
Experience with this equipment highlighted:
• piles built by dozer are about 25% more compact than those built by pusher-bar, and the bagasse in the more compact piles has longer storage life but
• pusher bars could handle bagasse at three to four times the rate of dozers, and at significantly lower cost. A dozer can handle about 30 t/h.
• excavators could reclaim bagasse at a rate of 200 t/h whereas front end loaders performed at about half this rate,
• wind has a major effect on bagasse handling operations, especially when dozers are building piles,
• during reclamation, tarpaulins need to be peeled back little by little so as to maintain dust control and rain protection,
• dust control has proved a major challenge, such that truck loading from the mills now tends to take place within a closed building,
• good lighting and good traffic control with planned sequencing of pile reclamation have proven critical, and
• environmental issues of noise, dust, odour, light and traffic management have required attention.
Covering of piles
For the Pioneer project the covering is considered necessary to:• reduce water ingress,• provide a barrier against oxygen,• protect against external sources of ignition
and• minimise dust and odour problems and to
minimise the amount of polluted leachate requiring effluent treatment.In drier climates there is no need to cover
the bagasse with tarpaulins. Calculations based
on the water-holding capacity of bagasse suggest that rain penetration would be as shown in Table 1
This shallow p e n e t r a t i o n , alternating with surface drying, explains the minimal penetration by rain, often referred to as the ‘self-thatching’ effect. Prolonged light rain without intermittent drying would be problematic.
Other Australian projects
Bundaberg Sugar operates six mills with a variety of cogeneration activities at each. Some inter-mill transfer of bagasse takes place and up to 35 000 t of bagasse has been stored at one site. The technology is essentially similar to that described for Pioneer but, being in a drier area, not all piles are covered. The uncovered piles are relatively small (100 x 25 m) and profiled to minimise rain ingress.
Mackay Sugar has small stockpiles at each of four mills. Each mill exports some power to the grid, and excess bagasse is transported to Racecourse mill for off-crop refining. In 2004, Racecourse had a 59 000 t stockpile.
Multiple small piles are built with wheeled front-end loaders and covered. The piles stand on a hard pad with drainage to a holding dam. Tall wooden fences combined with tree screening help to reduce dust. A road irrigation system has proved necessary to minimise road dust. Odour has proved problematic, especially when breaking down old piles. There have been two instances of spontaneous combustion, each seemingly related to excess water in the pile, resulting in heat generation about 1.5 m from the surface.
Based on past experience, Mackay Sugar’s future plans to store 100 000 t of bagasse will incorporate:
• better dust containment facilities at loading points, including fully enclosed buildings with dust extraction facilities,
• vacuum cleaning facilities within the bagasse systems,
• improved sealing of truck doors,
Table 1. Theoretical depth of rain penetration to bagasse piles, assuming no run-off.
General condition
Surface density (kg dry/m3)
Initial surfacemoisture(%)
Penetrationby 100 mm rain(cm)
Air laid pile (no compaction)
74 50 37
Compacted pile
100 50 27
Air laid, part dry
74 25 32
Compacted, part dry
100 25 23
Shallow penetration, alternating with surface drying, explains the minimal penetration by rain, often referred to as the ‘self-thatching’ effect.

International Sugar Journal | ISJ's World Sugar Outlook 201540 41www.internationalsugarjournal.com
• conveyer systems that are completely enclosed and fitted with dust extraction systems at transfer points,
• full sealing of roads,• storage times limited to 16 weeks, and• storage areas that are far from residences and
are screened. Experience in Brazil
Judging from Google Earth images, the Boa Vista mill has a circular pile with a diameter of about 150 m. A conveyer drops bagasse at a fixed point near the edge of the pile and a dozer (or loader) works on top of the flat pile, either distributing the incoming bagasse or retrieving bagasse for return to the mill via a second conveyer.
According to an informal report of the International Cane Energy Network (1994), the Sao Martino mill stores up to 200 000 t of bagasse at 50% moisture in triangular piles that are packed down with bulldozers and front-end loaders.
The option of baling
History
In the 1920s, the Celotex corporation experimented with baling and suffered numerous fires due to spontaneous combustion. The fire problem was solved by making small bales (250 kg at 50% moisture) and carefully stacking these to ensure that heat could escape through gaps between the bales. This method was used for 40 years but was abandoned due to its high labour requirement.
Attempts to reduce labour costs by making bigger bales (600-800 kg at 50% moisture) and mechanically stacking them reduced the costs but gave poor quality product, because the centres of the bales overheated (70°C) and accumulated acid that attacked the hemi-cellulose.
In 1968, Bernhardt reported that Valentine Pulp and Paper Co had tried storing bagasse in large bulk piles (without wetting or compaction) and had found it significantly less expensive and more effective than their previous system of bales, which often deteriorated. Since that time, bulk piles have generally replaced baled storage.
The Bagatex-20 process
This process was patented in the 1980s and hailed as the best solution for bagasse storage (Anon, 1986). The process was developed by the Brazilian sugar factory Usina Santa Lydia,
with the objective of storing bagasse for use as boiler fuel. Its success was claimed to depend on the addition of a ‘bio-chemical catalyst’ which causes controlled fermentation of residual sugars resulting in heating of the baled bagasse, and consequential drying from 50 to 20% moisture without overheating. It was claimed that large size bales could be used because the additive slows the rate of fermentation thereby preventing overheating. Vented stacking of the treated bales is still critical for achieving the necessary heat dissipation and drying. The drying prevents subsequent deterioration of the bagasse and raises the net calorific value (NCV).
The Bagatex-20 report (Anon, 1986) has some seemingly contradictory claims, in that the additive supposedly accelerates fermentation to cause timely drying, but it also inhibits the fermentation to prevent overheating. It was claimed that bales without additive took between 62 and 111 days to dry to 20%, whereas with additive the drying was complete within 20 days. Without additive, the bales developed hot spots with charring of the bagasse.
Australian researchers (Dawson et al., 1990) conducted trials with baled bagasse in which they compared storage with and without a simulated Bagatex additive. They found that they could achieve drying to 20% within 30 days without additive and that the various additive components had little effect apart from slight acceleration of heating when yeast was included.
Despite numerous references to the Bagatex-20 publications of the 1980s, no reference has been found to commercial application of the process on the large scale required for weeks of off-crop power generation. This is probably due to the costs implicit in the following process summary:
• Prepare special catalytic bio-chemical fluid (seemingly consisting of yeast, vinasse and sucrose, urea and ethanol).
• Spray the fluid onto bagasse at the entrance to the baler.
• Bale into bales measuring 0.8 x 1.05 x 1.2 m or 1.6 m and weighing 600 or 900 kg respectively, bound with four strands of wire.
• Palletise (three bales in height) with wooden spacers between the bales to allow good ventilation.
• Transport by fork lift to a special conditioning
Table 2. Moisture, temperature and pH dynamics in bales
Day Moisture (%)
Temperature (°C)
pH
0 50 28 7.1
2 42 - 4.4
4 35 46 3.9
7 33 - -
10 28 61 2.9
12 27 62 2.8
14 25 - -
20 20 57 2.8
23 19 - -
26 17 55 3.6
30 15 51 5.5
34 14 - -
Vented stacking of the treated bales is still critical for achieving the necessary heat dissipation and drying
Challenges and potential solutions for storage of large quantities of bagasse for power generation

International Sugar Journal | ISJ's World Sugar Outlook 201540 41www.internationalsugarjournal.com
warehouse that facilitates escape of moisture, heat and acids released from the bales (The required floor-space is approximately 10 m2/daily ton of bagasse input (wet basis)).
• Transport to storage site and cover with tarpaulins.The changes that take place in the first 34
days of the Bagatex process are shown in Table 2.
The reason for giving details of the Bagatex-20 process, despite its limited use, is covered later.
Theory of controlled fermentation
Acid and heat formation
The microbiology and chemistry of changes taking place in stored bagasse are discussed in detail by Cusi (1980). Residual sugar in the bagasse provides substrate for rapid growth of yeasts and bacteria. Heat is generated and, in the absence of oxygen, the sugar is converted into organic acids, causing the pH to decline. The acid conditions inhibit microbial activity and thereby partly preserve the bagasse. The rise in temperature is usually sufficient to cause a change in microbial population from mesophilic to thermophilic organisms able to grow at 50°C. If moisture is able to escape then the heat causes drying of the bagasse, which is important for subsequent preservation.
Acid and cellulose consumption
After the readily available sugars have been consumed, the hemicellulose and cellulose in bagasse becomes the substrate for microbes. The rate of oxygen consumption slows and anaerobic conditions are slowly replaced by aerobic conditions in which the organic acids can be consumed, leading to a rise in pH and loss of preservative. The rate at which this occurs depends on the packing density. If there is sufficient moisture remaining then cellulose-digesting bacteria and fungi attack the bagasse, leading to loss of fuel value and development of fungal spores (bagassosis).
Microbiology and chemistry
It has been assumed that lactic acid formed by Lactobacillus bacteria is the main cause of acidity. On this assumption, the Ritter process for bagasse preservation involves the addition of Lactobacillus cultures, together with molasses. The exact composition of the Bagatex additive is not known for certain but is thought to involve yeast, vinasse, sugar, urea and ethanol.
Presumably the ethanol is added because it is a good substrate for acetic acid production.
In retrospect, it seems unlikely that lactobacilli are the main players in acid formation. Analyses on stored bagasse from Felixton (Morgan et al., 1974), where lactobacilli inoculum had been added as part of the Ritter process, showed only trace amounts of lactic acid but significant quantities of acetic, propionic and butyric acids. These three acids give the characteristic odour of overloaded anaerobic effluent ponds and are probably the cause of offensive odour from some bagasse piles. It is also these acids that cause severe inhibition (preservation) of anaerobic effluent treatment systems if they are allowed to accumulate.
The so-called controlled fermentation in the Bagatex process does involve elements of acceleration and inhibition in that sugar and urea are added to accelerate the formation of acids and heat but the acid accumulation (pH <3) then controls the fermentation by inhibiting bacteria, thereby preserving the bagasse and preventing spontaneous combustion. After the accelerated fermentation (7-10 days), the pH rises slowly due to oxidation of the acids as oxygen slowly enters the bagasse. This loss of acid inhibition takes place first in the surface layers, explaining why the dangerously high temperatures inevitably occur about 1.5 m below the surface (optimum combination of air access and heat insulation).
Variability
The wide variety of results associated with baling are not surprising when considering the range of factors that are influential, such as:
• quantity of residual sugar in bagasse,• moisture content at baling,• bale size and density and• bale stacking/ventilation patterns.
These factors are highlighted by a 2010 study (Lois-Correa et al.) in which adequate drying temperatures were achieved but, compared to the Bagatex process, relatively slow drying took place (bales were piled and covered immediately without provision for ventilation). The loss of dry matter due to deterioration was 20-25% within 40 days, but this loss was less than 3% in a treatment involving drying of bagasse prior to baling.
Suggested combination of Bagatex-20 with bulk piles
‘De-mystifying’ the technology of the Bagatex

International Sugar Journal | ISJ's World Sugar Outlook 201542 43www.internationalsugarjournal.com
process could be important for enabling its application to bulk piles. The challenge is to ensure that sufficient sugar is feeding appropriate bacteria with limited access to oxygen but sufficient ventilation to enable drying. Monitoring of temperature and pH could provide valuable management information. If the piles could benefit from the extensive drying inherent in the Bagatex process then the substantial benefit of higher fuel value and long-term stability would apply.
Various reports (e.g. ASSCT workshop 2005 (www.assct.com.au/) and Cusi, 1980) indicate that air-laid piles do not store well unless some compaction is applied to minimise air ingress. A common means of compaction is the driving of dozers on the pile but this is inefficient and consumes fossil fuel (diesel). Perhaps compaction could be done as the bagasse leaves the mill by using a continuous baler (Figure 1).
The continuous baler:
• uses no binders, • is powered by relatively inexpensive and
renewable energy (electricity from bagasse),• produces chunks of compressed bagasse
(approximately 760 x 760 x 200 mm) that may be of appropriate configuration, when dumped randomly, to enable ventilation of moisture without allowing aerobic conditions in the bulk of the bale,
• enables control of dust, and• would save diesel if dozers and loaders are
subsequently used to build the bagasse piles, because the pre-compacted bagasse enables higher tonnages per load (with air-laid piles a ten-ton bulldozer with extended blade moves only about 600 kg (dry basis) of bagasse (Cusi, 1980)).A disadvantage of the continuous baler is that
some form of bale-breaker would be necessary to homogenise the bagasse for feeding to boilers.
For the controlled heating and drying stage (about 20 days) the bales would need to lie in a pile of limited height. Additional material would then be added to the pile at intervals. This implies the building of several piles simultaneously; however, the process could take place in a single pile covering a large area but with carefully managed distribution over the area. A view of the Boa Vista system in Brazil (Figure 2) suggests that this type of layering (without bales) takes place there. The circular pile has a diameter of approximately 150 m and the tracks of the dozer/loader can be seen radiating out from the fixed point where bagasse is deposited or retrieved.
The option of forced drying before storage
Springer (1979) gives results suggesting that it may be economical to dry whole tree chips before storage. These chips, containing leaves and bark, are prone to extensive deterioration if not dried. Bagasse drying, using flue gas, is applied at some sugar factories but the economics suggest that it is generally better to use the flue gas for heating air and water going to the boiler, rather than investing in bagasse driers. This logic may be different at factories that use substantial amounts of stored bagasse. If the bagasse is dried it:
• is stable in storage (i.e. fuel is saved),• gives higher recoverable energy (less water to
be evaporated),• gives less flue gas to be cleaned (less fan
power required) because there is less vapour (this is counteracted by the higher amount of flue gas produced during the drying process),
• enables higher furnace rating and boiler efficiency.When burning partially dried bagasse the
furnace temperature tends to be high enough to cause clinker. To prevent this, air heating needs to be reduced so as to reduce the grate temperature (Magasiner, 1987). This is an example of the interactions that arise in assessing bagasse storage together with best use of recovered heat. It is beyond the scope of this paper to assess the economics of different heat recovery systems for factories burning stored bagasse but, if the impact on bagasse storage is taken into account, it may yield results that are different from those for a standard sugar factory.
The special case of diffuser bagasse
When considering the theory of good bagasse storage, it is evident that diffuser bagasse requires special consideration because:
• The high extraction achieved in diffusers could mean that there is insufficient residual sugar in the bagasse for early generation of heat and acids.
• The pasteurisation of bagasse during diffusion eliminates all non-spore-forming bacteria, thereby giving spore-formers an early advantage. These include cellulose digesting species which might dominate and cause severe deterioration, especially if they are not inhibited by acids.
• In cases where filter mud is added to the
loss of dry matter due to deterioration was 20-25% within 40 days, but this loss was less than 3% in a treatment involving drying of bagasse prior to baling. Suggested combination of Bagatex-20 with bulk piles ‘De-mystifying’ the technology of the Bagatex process could be important for enabling its application to bulk piles. The challenge is to ensure that sufficient sugar is feeding appropriate bacteria with limited access to oxygen but sufficient ventilation to enable drying. Monitoring of temperature and pH could provide valuable management information. If the piles could benefit from the extensive drying inherent in the Bagatex process then the substantial benefit of higher fuel value and long-term stability would apply. Various reports (e.g. ASSCT workshop 2005 (www.assct.com.au/) and Cusi, 1980) indicate that air-laid piles do not store well unless some compaction is applied to minimise air ingress. A common means of compaction is the driving of dozers on the pile but this is inefficient and consumes fossil fuel (diesel). Perhaps compaction could be done as the bagasse leaves the mill by using a continuous baler (Figure 1).
Figure 1. Continuous baler loading a truck in India. (Photo: B Purchase) The continuous baler:
• uses no binders, • is powered by relatively inexpensive and renewable energy (electricity from bagasse), • produces chunks of compressed bagasse (approximately 760 x 760 x 200 mm) that may
be of appropriate configuration, when dumped randomly, to enable ventilation of moisture without allowing aerobic conditions in the bulk of the bale,
• enables control of dust, and • would save diesel if dozers and loaders are subsequently used to build the bagasse piles,
because the pre-compacted bagasse enables higher tonnages per load (with air-laid piles a
Figure 1. Continuous baler loading a truck in India. (Photo: B Purchase)
figure shows a situation where multiple vehicles may waste time queuing at a bottle-neck caused by insufficient capacity at the reclaim hoppers. It is possible to reduce vehicle travel, and number of vehicles, by having multiple discharge points, but the conveyer network is then more complex, with additional transfer points.
Figure 3. Calculated reclaim rates based on cycle time data and a fixed receiver capacity. Linear mechanical stackers Another alternative to a single discharge point is discharge via a linear discharge system. Figure 4 shows an elevated conveyor and travelling transfer device (tripper) which discharges to create a linear pile. This installation is at the Raizen Jatai sugar factory in Brazil (note the extended discharge chutes for reduction of dust).
Figure 4. Elevated conveyor with travelling discharge device (tripper) and associated vehicle. (Photo: N du Plessis)
Figure 3. . Calculated reclaim rates based on cycle time data and a fixed receiver capacity.
figure shows a situation where multiple vehicles may waste time queuing at a bottle-neck caused by insufficient capacity at the reclaim hoppers. It is possible to reduce vehicle travel, and number of vehicles, by having multiple discharge points, but the conveyer network is then more complex, with additional transfer points.
Figure 3. Calculated reclaim rates based on cycle time data and a fixed receiver capacity. Linear mechanical stackers Another alternative to a single discharge point is discharge via a linear discharge system. Figure 4 shows an elevated conveyor and travelling transfer device (tripper) which discharges to create a linear pile. This installation is at the Raizen Jatai sugar factory in Brazil (note the extended discharge chutes for reduction of dust).
Figure 4. Elevated conveyor with travelling discharge device (tripper) and associated vehicle. (Photo: N du Plessis)
Figure 4. . Elevated conveyor with travelling discharge device (tripper) and associated vehicle. (Photo: N du Plessis)
Challenges and potential solutions for storage of large quantities of bagasse for power generation

International Sugar Journal | ISJ's World Sugar Outlook 201542 43www.internationalsugarjournal.com
diffuser, the nutrients in the mud would assist the cellulose d i g e s t i n g bacteria.• H a v i n g been heated, the bagasse fibre is softened and therefore likely to behave differently when baled or compacted.• D i f f u s e r bagasse tends to
have high levels of ash which would contribute to clinker formation if partially dried bagasse was retrieved from storage.It is proposed that the first two items could
be addressed by adding a small amount of cold, stale factory effluent mixed with molasses to the imbibition water at the final dewatering mill. Stale effluent contains many acid-forming bacteria (evidenced by its behaviour in overloaded anaerobic effluent dams).
Alternative equipment options
Equipment used for bagasse handling in Australian mills has been listed earlier. Other options are available, with the choice being dependent on local conditions. These options include the following:
Mechanical loader/dozer stacking and reclaiming via a single discharge and
reclaim point
This is the system illustrated in Figure 2. Excess b a g a s s e is dumped by an e l e v a t e d conveyor at a fixed p o i n t . Front end l o a d e r s a n d /
or bulldozers are used to back stack and compress the pile. The same vehicles then reclaim to feed hoppers. For larger storage piles, the disadvantage of this method is that the vehicles have to travel long distances. For indicative purposes, guidelines from an equipment supplier have been used to calculate vehicle requirements for reclaiming bagasse from different distances (Figure 3). The results indicate the vehicle requirements but highlight the need for care in eliminating bottle-necks. The figure shows a situation where multiple vehicles may waste time queuing at a bottle-neck caused by insufficient capacity at the reclaim hoppers.
It is possible to reduce vehicle travel, and number of vehicles, by having multiple discharge points, but the conveyer network is then more complex, with additional transfer points.
Linear mechanical stackers
Another alternative to a single discharge point is discharge via a linear discharge system. Figure 4 shows an elevated conveyor and travelling transfer device (tripper) which discharges to create a linear pile. This installation is at the Raizen Jatai sugar factory in Brazil (note the extended discharge chutes for reduction of dust).
A second option, a boom stacker, is illustrated in Figures 5 and 6. The bagasse in the illustrations is used for pulp and paper but the boom stacker could have a role in storage for co-generation. Boom stackers are common in other industries involving bulk handling.
Both types of linear stackers still require vehicles to distribute the bagasse and increase
loss of dry matter due to deterioration was 20-25% within 40 days, but this loss was less than 3% in a treatment involving drying of bagasse prior to baling. Suggested combination of Bagatex-20 with bulk piles ‘De-mystifying’ the technology of the Bagatex process could be important for enabling its application to bulk piles. The challenge is to ensure that sufficient sugar is feeding appropriate bacteria with limited access to oxygen but sufficient ventilation to enable drying. Monitoring of temperature and pH could provide valuable management information. If the piles could benefit from the extensive drying inherent in the Bagatex process then the substantial benefit of higher fuel value and long-term stability would apply. Various reports (e.g. ASSCT workshop 2005 (www.assct.com.au/) and Cusi, 1980) indicate that air-laid piles do not store well unless some compaction is applied to minimise air ingress. A common means of compaction is the driving of dozers on the pile but this is inefficient and consumes fossil fuel (diesel). Perhaps compaction could be done as the bagasse leaves the mill by using a continuous baler (Figure 1).
Figure 1. Continuous baler loading a truck in India. (Photo: B Purchase) The continuous baler:
• uses no binders, • is powered by relatively inexpensive and renewable energy (electricity from bagasse), • produces chunks of compressed bagasse (approximately 760 x 760 x 200 mm) that may
be of appropriate configuration, when dumped randomly, to enable ventilation of moisture without allowing aerobic conditions in the bulk of the bale,
• enables control of dust, and • would save diesel if dozers and loaders are subsequently used to build the bagasse piles,
because the pre-compacted bagasse enables higher tonnages per load (with air-laid piles a
ten-ton bulldozer with extended blade moves only about 600 kg (dry basis) of bagasse (Cusi, 1980)).
A disadvantage of the continuous baler is that some form of bale-breaker would be necessary to homogenise the bagasse for feeding to boilers. For the controlled heating and drying stage (about 20 days) the bales would need to lie in a pile of limited height. Additional material would then be added to the pile at intervals. This implies the building of several piles simultaneously; however, the process could take place in a single pile covering a large area but with carefully managed distribution over the area. A view of the Boa Vista system in Brazil (Figure 2) suggests that this type of layering (without bales) takes place there. The circular pile has a diameter of approximately 150 m and the tracks of the dozer/loader can be seen radiating out from the fixed point where bagasse is deposited or retrieved.
Figure 2. Bagasse pile at Boa Vista (Brazil). The option of forced drying before storage Springer (1979) gives results suggesting that it may be economical to dry whole tree chips before storage. These chips, containing leaves and bark, are prone to extensive deterioration if not dried. Bagasse drying, using flue gas, is applied at some sugar factories but the economics suggest that it is generally better to use the flue gas for heating air and water going to the boiler, rather than investing in bagasse driers. This logic may be different at factories that use substantial amounts of stored bagasse. If the bagasse is dried it:
• is stable in storage (i.e. fuel is saved), • gives higher recoverable energy (less water to be evaporated),
Figure 2. Bagasse pile at Boa Vista (Brazil).
figure shows a situation where multiple vehicles may waste time queuing at a bottle-neck caused by insufficient capacity at the reclaim hoppers. It is possible to reduce vehicle travel, and number of vehicles, by having multiple discharge points, but the conveyer network is then more complex, with additional transfer points.
Figure 3. Calculated reclaim rates based on cycle time data and a fixed receiver capacity. Linear mechanical stackers Another alternative to a single discharge point is discharge via a linear discharge system. Figure 4 shows an elevated conveyor and travelling transfer device (tripper) which discharges to create a linear pile. This installation is at the Raizen Jatai sugar factory in Brazil (note the extended discharge chutes for reduction of dust).
Figure 4. Elevated conveyor with travelling discharge device (tripper) and associated vehicle. (Photo: N du Plessis)

International Sugar Journal | ISJ's World Sugar Outlook 201544 45www.internationalsugarjournal.com
the width of the pile. Without these vehicles, the low bulk density of bagasse means that the required length of traverse would probably be too long to be economical.
Radial boom stackers
Depending on site layout, it may be appropriate to use radial boom stackers that slew in an arc, producing doughnut-shaped stacks on either side of a central conveyer. The length of the boom is a limiting factor, with costs going up exponentially as the length is increased.
Summary and conclusions
Bulk storage in piles without addition of water is recommended as the choice method for large quantities of bagasse boiler fuel, but care is needed in managing the piles. The two-phase nature of the storage chemistry needs to be recognised with the need to encourage acid formation in stage one and to protect the acids from oxidation in stage two. The need to meet biological requirements within the constraints of engineering realities, presents challenges for further research and innovation.
Where storage periods exceed about three months some form of compaction of the bagasse is necessary to restrict aeration during stage two. This can be achieved by driving vehicles over the bagasse piles, but an alternative of compaction by a continuous baler located at the factory deserves investigation.
International experiences with bulk piles should continue to be monitored, with cognisance taken of probable opportunities for cost reduction by avoiding extensive use of dozers and loaders. Development of alternative stacking and compacting techniques is called for, preferably allowing controlled ventilation for about 20 days after depositing the bagasse.
The opportunity to increase the fuel value of bagasse by drying during storage is worth pursuing. Judging from the Bagatex-20 process, this could be achieved by simultaneously building multiple piles of bagasse ‘chunks’ (produced by a continuous baler) such that each layer dries for 7-10 days before being covered by another layer. The space between chunks would assist with initial ventilation but most of the bagasse would be sufficiently compacted to restrict access to oxygen. The electrically driven stationary baler would reduce costs of pile compaction and stacking, and would reduce dust.
Significant environmental challenges exist
and require early recognition and planning.The likely difference in behaviour of diffuser
bagasse (compared to mill-run bagasse) needs to be recognised – the possible benefit of adding sugar and bacteria to this bagasse before storage requires investigation.
*This paper was presented at the 2013 South African Sugar Technologists Association's annual conference and is published here with the agreement of the Association
References
Anon (1986). The ‘Bagatex-20’ process for rapid
drying of baled bagasse by accelerated and controlled
fermentation, when using a bio-chemical catalyst.
Technical Report by Groupe Sucres et Denrees, Paris.
49 pages. (Summarised by Atchison JE (1986) A new
process for rapid drying and storage of bagasse. Sugar
y Azucar, October 1986: 38-44).
Bergman PCA, Boersma AR, Zwart RWR and Kiel JHA
(2005). Torrefaction for biomass co-firing in existing
coal-fired power stations ‘Biocoal’. Technical Report No.
ECN-C-05-013 of ECN Biomass, prepared for Dutch
Ministry of Economic Affairs. 71 pages (downloadable
from www.ecn.nl/biomass).
Bernhardt DR (1968). Bulk storage of bagasse. Proc
Am Soc Sug Cane Technol 15: 24-29.
Cusi DS (1980). The storage and conservation of
bagasse. Sugar y Azucar August 1980: 39-51.
Dawson MW, Dixon TF and Inkerman PA (1990).
Moisture loss from baled bagasse during storage. Proc
Aust Soc Sug Cane Technol 1990: 199-206.
dos Santos ML, de Lima OJ, Nassar EJ, Ciuffi KJ
and Calefi PS (2011). Study of the storage conditions
of sugarcane bagasse through thermal analysis (in
Portuguese). Quim Nova 34: 507-511.
Hobson PA and Mann AP (2005). The prediction of
heating and spontaneous combustion in bagasse
stockpiles. An update on model capabilities.
Presentation at ASSCT Bagasse storage Workshop
(www.assct.com.au/).
Lokapure RB, Kadam AP and Nerle VB (2012). Fire
protection of sugarcane bagasse – A case study
of Renuka Sugar’s 30MW co-generation plant at
Ichalkranji. International Journal of Engineering
Research and Applications 2: 1617-1620. (www.ijera.
com).
Lois-Correa J, Flores-Vela A, Artega-Grimaldo and
Berman-Delgado J (2010). Experimental evaluation
of sugar cane bagasse storage in bales. J Appl Res
Technol 8(3): 365-375.
Magasiner N (1987). The effect of fuel moisture content
on the performance of a typical bagasse fired watertube
boiler. Proc S Afr Sug Technol Ass 61: 86-89.
McMaster L (1974). Bagassosis/Bagasse Worker’s
Lung – A review. Technical Report 1015, Sugar Milling
A second option, a boom stacker, is illustrated in Figures 5 and 6. The bagasse in the illustrations is used for pulp and paper but the boom stacker could have a role in storage for co-generation. Boom stackers are common in other industries involving bulk handling.
Figure 5. Boom stacker in India.
A second option, a boom stacker, is illustrated in Figures 5 and 6. The bagasse in the illustrations is used for pulp and paper but the boom stacker could have a role in storage for co-generation. Boom stackers are common in other industries involving bulk handling.
Figure 5. Boom stacker in India.
Figure 5. .Boom stacker in India
Figure 6. .Aerial view of Boom stacker piles.
Challenges and potential solutions for storage of large quantities of bagasse for power generation

International Sugar Journal | ISJ's World Sugar Outlook 201544 45www.internationalsugarjournal.com
Research Institute, Durban, South Africa.
Morgan R, Bruijn J, Gonin C and McMaster
L (1974). Wet bulk storage of bagasse. Proc
Int Soc Sug Cane Technol 15: 1793-1819.
Rainey TJ, Mann AP, Bakir H and O’Hara
IM (2012). A preliminary study into the
environmental consequences of a sugar
factory depithing operation. Proc Aust Soc
Sug Cane Technol 34 (downloaded from
http://eprints.qut.edu.au/50738/).
Searcy EM and Hess JR (2010). Uniform-
format feedstock supply system: A
commodity-scale design to produce an
infrastructure-compatible biocrude from
lignocellulosic biomass. Idaho National
Laboratory Ext-10-20372, USA.
Springer EL (1979). Should whole-tree
chips for fuel be dried before storage?
Forest Products Laboratory Research Note
FPL-0241, United States Department of
Agriculture, USA.
Trayner P (2008). Bagasse storage and
transport for the Pioneer cogeneration
project. Int Sug J 110(1316): 475-481.
Appendix
Data relevant to bagasse storage
Densities of piled bagasse
If fresh bagasse is deposited from an overhead conveyer without mechanical compaction (i.e. air-laid) it tends to form a conical pile with angle of repose of 47°. The average density (dry basis) of the whole pile depends on the height of the pile, approximately as follows (Cusi, 1980):
These densities are about 45 kg/m3 less than those for equivalent water-laid piles, which have flat tops (Cusi, 1980). It is emphasised that the figures refer to whole piles, not columns of different heights within a pile. Morgan et al. (1974) cut and weighed columns
of different heights from water-laid piles. Their ‘spot’ measurements gave appreciably higher average density figures than those quoted by
Cusi for entire piles because the average for the pile is influenced by the shape of the pile.
Area requirements
Based on the air-laid densities and angle of repose given above by Cusi, the following storage area requirements can be calculated for different pile heights and lengths (assuming the piles are linear and have a triangular cross-section). The calculations include a 20 m space between piles.
Compaction perspective
Densities of baled bagasse
Continuous balers produce bales with densities of 600 to 700 kg of fresh bagasse/m3 (www.ishaengineering.com and Dawson et al., 1990). Bales used in the Bagatex-20 process had densities of 600 to 670 kg/m3.
A second option, a boom stacker, is illustrated in Figures 5 and 6. The bagasse in the illustrations is used for pulp and paper but the boom stacker could have a role in storage for co-generation. Boom stackers are common in other industries involving bulk handling.
Figure 5. Boom stacker in India.
A second option, a boom stacker, is illustrated in Figures 5 and 6. The bagasse in the illustrations is used for pulp and paper but the boom stacker could have a role in storage for co-generation. Boom stackers are common in other industries involving bulk handling.
Figure 5. Boom stacker in India.
Figure 6. .Aerial view of Boom stacker piles.
Height(m)
Average density(dry basis) (kg/m3)
10 88
15 94
20 100
25 105
Area (ha) required for 10 000 t fresh bagasse (50% moist.)
Ridge length (m)*
Pile height (m)
10 15 20 25
25 4.31 2.24 1.42 1.01
50 3.49 1.84 1.19 0.85
75 3.16 1.67 1.08 0.78
100 2.97 1.57 1.01 0.73
*The ridge is shorter than the base of the pile
Area (ha) required for 10 000 t fresh bagasse (50% moist.)
Compaction instrument
Compaction pressure (kg/cm2)
Reference
Top 1 m of air-laid bagasse
0.02 Calculated from Morgan et al. (1974)
Top 1 m of water-laid bagasse
0.08
Tracks of bulldozer
0.60 Cusi (1980)
Continuous baler
5.20 www.ishaengineering.com

International Sugar Journal | ISJ's World Sugar Outlook 201546 47www.internationalsugarjournal.com
Knowledge, an underexploited input for increasing not only cane productivityInternational Sugar Journal, IBI, Christchurch Court, 10-15 Newgate Street, London, EC1A 7HD, UK Email: [email protected]
Abstract Increasing cane productivity continues to be one of the greatest challenges in the sugar industry against the backdrop of yield stagnation. Expansion in cane production will largely have to come from increasing productivity as expanding current areas and or identifying suitable new cane-producing areas become less of an option. Unlike the sugar beet sector, particularly in the EU and USA where beet productivity rates at farms are on average around 30% less than those obtained at research stations, the probable divide between cane yield differences at a farm and research station, is markedly higher. This paper argues that one of the compelling reasons explaining the huge difference in yields in the cane sector is probably to do with under exploitation of knowledge as an input. Whereas in the USA and EU there are examples of effective collaborative structures among growers, factories and research stations facilitating knowledge transfer, with the exception of Australia and South Africa, the cane industry is bereft of such successful models. In countries where cane yields are hovering at around 50-70 t/ha, opportunities for significantly increasing yields through employing the concept of marginal gains, whereby each aspect of the value chain in the production of cane is addressed to the highest standard, are real. Keywords: knowledge, inputs, productivity, marginal gains, social organisation
Arvind Chudasama
Introduction
Several years ago, The New England Journal of Medicine featured an article where surgeons from best, average and poor
performing heart-transplant units in the US visited each other’s units during actual surgery. Subsequent to these exchanges, the mortality rates of transplantees from all the units went down significantly, particularly those from the poor performing units.

International Sugar Journal | ISJ's World Sugar Outlook 201546 47www.internationalsugarjournal.com
It was apparent that the knowledge exchange and sharing that this initiative was instrumental in promoting, yielded a significant dividend performance-wise.
In agricultural production, the process of knowledge sharing and application of latest research products is a bit more complex, if not insurmountable, as it involves a collaborative structure that needs to be fluid among farmers, extension workers and researchers. In the sugar industry, complexity is added by the necessary involvement of sugar mills.
The main challenge for growers anywhere is to bridge the yield gap between that obtained at a research station with output obtained from the same cultivar at a farm. In the beet sugar sector in Europe, as Table 1 suggests, yield differences between research stations and growers are on average around 30% (Jaggard et al., 2012). In the cane sugar sector, achieving similar levels of productivity would be something to marvel at.
The theoretical possible yield for sugarcane is about 350 t/ha per year. Very few sugarcane industries manage to achieve even half of this. Table 2 suggests that, at best, yields are some one-third or one-quarter of the potential.
Yield stagnation
It is apparent from the foregoing that cane productivity is a major issue in the cane sugar sector.
A recently published review (Ray et al., 2012) signposts the emerging issue of yield stagnation that is beginning to pressure on global agriculture. Agricultural output will have to roughly double by 2050 on the back of a rise in population, meat and dairy consumption and biofuel use. For this to be realised, there has to be a significant rise in crop productivity. However, the review suggests that yield stagnation and collapse across 24-39% of maize-, rice-, wheat- and soybean-growing areas is countering yield advances in other areas. These four crops currently provide some 64% of agricultural calorie production.
While the review does not posit data on trends in sugarcane productivity in the leading producing countries, it is apparent that the picture is no different, if not bleaker. In the cane industry in the US over the period 1980-81 to 2012-13, the yields have practically remained the same – the yields for these two years are 83.8 t/ha and 81.4 t/ha, respectively. During the recent past in Brazil, cane yields have tumbled from 89 t/ha to 69 t/ha. An extensive replanting campaign is helping yields to recover. In India, while the yields have increased over the period
1985-86 to 2010-11 from 60 t/ha to 70 t/ha, there have been significant f l u c t u a t i o n s annually. In Pakistan, a similar picture emerges over the period 1996-97 to 2010-11 when yields increased from 43.5 to 56.1 t/ha. In Australia, cane yields peaked at 100 t/ha during 1996-98, declining to around 80-90 t/ha currently. In Thailand, cane yields dropped from 77.3 t/ha last year to 70.7 t/ha this year. The Philippines situation is a tale of two halves that is doubtless repeated elsewhere in the global industry – productivity from large farms (>100 ha) is 73.4 t/ha while that from small farms (<5 ha) is 50.3 t/ha.
Knowledge as an input
Arguably, one of the central underlying factors for a wide gap in cane productivity, but a relatively short one with beet productivity, is probably to do with access to knowledge, and conversion of this knowledge into action. Along with capital inputs such as fertilisers and crop protection chemicals, knowledge is a vital input in agricultural production. Indeed, it should be apparent that the dividend from productivity increases that come with applying relevant knowledge is, arguably, as much use as capital inputs.
It is no accident that, in the beet sugar sector in Europe, yield differences between research stations and growers are narrowing. Beet sugar processors such as Nordic Sugar, British Sugar and Sudzucker have developed solid and proactive links with both research stations and beet growers. This effective social organisation is conducive to knowledge sharing, resulting inevitably in an increase in output and production of quality beet.
A recently published study (Cock et al., 2011) based on research in the cane sugar sector in Colombia confirms that knowledge transfer to farmers is facilitated by social organisation that promotes sharing of information, and that
Table 1. Average sugar yields (t/ha) from sugar beet in European countries and in the area contracted to American Crystal Sugar Co-operative: 2006-10
Country Variety trials
Delivered Mean gap
% achieved
Sweden 13.01 9.21 3.80 70.8
Denmark* 13.29 10.92 2.37 82.2
Netherlands 15.20 12.20 3.00 80.3
Belgium 16.02 12.28 3.74 76.7
England 14.94 9.39 5.55 62.9
France 15.99 13.32 2.67 83.3
Germany** 15.77 10.11 5.66 64.1
Austria 17.12 10.81 6.31 63.1
Italy 14.55 9.10 5.45 62.5
Spain 19.99 15.03 4.96 75.2
Red River Valley, USA
10.22 9.77 0.45 95.6
*2006-2009, **White sugar yieldSource: Jaggard et al. (2012)
Table 2. Cane yields for selected countries for 2011-12
Country Yield(t/ha)
Colombia 120
Costa Rica 61
Guatemala 90
Mexico 70
Mozambique 80
Nicaragua 102
Peru 123 (53-190)*
South Africa 60
Swaziland 98
Thailand 77
Zimbabwe 85
Source: USDA; *Values in brackets depict range

International Sugar Journal | ISJ's World Sugar Outlook 201548 49www.internationalsugarjournal.com
farmers readily adopt the positive results that stem from their own experiences. The authors conclude that “strong social organisation appears to be essential for the development of effective operational research in agriculture”.
The converse is also true. Cock et al. (2011) cite a study of fruit growers in the Andes where “lack of strong social organisation led to a breakdown in the system of continually obtaining information on the effectiveness of innovative practices and, hence, continuous improvement of the production system”. The wide yield disparity between small holders and those farmers with significantly large cane area in the Philippines probably suggests a similar situation operating there.
The transition from an industrial economy to one that is knowledge-driven has brought in its wake a fundamental rethink in securing competitive advantages. Instead of economies of scale, in the knowledge economy, competitive edge is informed by and based on economies of expertise derived by leveraging knowledge that resides in an organisation’s network through intra-organisational and inter-organisational relationships. However, this idea that knowledge is a vital input in any areas of activity is not necessarily a recent discovery, but rather the understanding how it can be better exploited to serve a particular purpose, certainly appears to be.
Knowledge theory – a very brief introduction
It is worth stepping back here and to recall one of the fundamentals of knowledge management.
Knowledge, an underexploited input for increasing not only cane productivity
Fig. 1a. Human-powered flying machine. (The invention has a wing spread of about 33 feet. The wings are driven by the back pedals, which the flier operates with an alternating leg motion. The effect of this thrust is amplified by the hand-operated crank. The machine incorporates complex gears and ingenious solutions for transmitting motion.)
Fig. 1b. Pile driver (This machine, invented by Francesco di Giorgio (Siena, 1439-1501) is used to drive poles into the ground in order to lay solid foundations for buildings. The hoist by means of two ropes control the vertical travel of the two hooks that alternately raise the drop hammer. When the carrying hook reaches the maximum height, it
Figure 1a. Human-powered flying machine (The invention has a wing spread of about 33 feet. The wings are driven by the back pedals, which the flier operates with an alternating leg motion. The effect of this thrust is amplified by the hand-operated crank. The machine incorporates complex gears and ingenious solutions for transmitting motion.)
Figure 1b. Pile driver (This machine, invented by Francesco di Giorgio (Siena, 1439-1501) is used to drive poles into the ground in order to lay solid foundations for buildings. The hoist by means of two ropes control the vertical travel of the two hooks that alternately raise the drop hammer. When the carrying hook reaches the maximum height, it is forced to release the hammer. The other hook is then positioned to pick up the hammer, and the cycle is repeated.) Modern version on the right hand side.

International Sugar Journal | ISJ's World Sugar Outlook 201548 49www.internationalsugarjournal.com
Some years ago, a former CEO of Hewlett Packard said to the effect “if we only knew what we now know, we would probably be three times as successful”. During the ’90s when there was a wave of downsizing in many large firms, little care was exercised to preserve valuable organisational knowledge gleaned over a long period when many senior staff were let go. In the case of one company, Ford, they had to rehire some of these staff as consultants to source their valuable knowledge that they simply could not duplicate overnight.
Knowledge process embraces the following truisms:
• I know what I know• I know what I don’t know• I don’t know what I know• I don’t know what I don’t know
The most compelling of these is “I don’t know what I don’t know”.
If one is to review the history of knowledge management disasters, one of the candidates would surely be the Renaissance engineers whose innovations, while engineering marvels of the day, had one significant shortcoming which rendered their machines less effective (Anon, 2013). At the time, the concept of energy and power was not understood. Indeed, if these concepts were well understood, the industrial revolution would have probably taken place much earlier than the further 250 years that it subsequently took.
A few examples of these are noted in Figures 1a-c sourced from the travelling exhibition “The art of invention: Leonardo and the engineers of the Renaissance”4 that passed through the
Science Museum in London in October 1999. While the Renaissance engineers can be
forgiven for designing and developing machines well ahead of their time, the wide gap in cane productivity must seriously be questioned. It is not as if that there is no applicable knowledge for farmers to successfully utilise. In all probability, lack of an effective collaborative structure among growers, millers and research institutions is at play here.
Samuel Johnson, the celebrated English writer born in the 18th century, said “Knowledge is of two kinds. We know a subject ourselves, or we know where we can find information upon it.” This distinction between knowledge and information is an important one, and worth exploring to glean insight into how knowledge can be productively employed. Too often, 'information' and 'knowledge' have been used fairly interchangeably to the detriment of knowledge transfer in particular.
Distinction between knowledge and information
Knowledge, essentially, is ‘organised information’ and the process of organising it is purely intellectual. Information is the product of processing, sorting and combining data (and data are raw, unconnected facts). Information per se cannot be visualised as a ‘brick’ that has some pre-defined intrinsic worth, but rather like clay that the user can mould for constructing his or her sense, and this construction is dependent on the individual’s knowledge base. That is, the ‘enabling value’ of information is contingent on the effectiveness with which it is applied by the
is forced to release the hammer. The other hook is then positioned to pick up the hammer, and the cycle is repeated.) Modern version on the right hand side.
Fig. 1c. Revolving crane with hoist (Working model after Bonaccorso Ghiberti (Florence, 1451-1516) - The crane is fitted with a vertical pin-gear wheel that activates a jack for lifting light weights and a screw-operated platform for shifting the lifted load sideways.) Modern version on the right hand side.
While the Renaissance engineers can be forgiven for designing and developing machines well ahead of their time, the wide gap in cane productivity must seriously be questioned. It is not as if that there is no applicable knowledge for farmers to successfully utilise. In all probability, lack of an effective collaborative structure among growers, millers and research institutions is at play here. Samuel Johnson, the celebrated English writer born in the 18th century, said “Knowledge is of two kinds. We know a subject ourselves, or we know where we can find information upon it.” This distinction between knowledge and information is an important one, and worth exploring to glean insight into how knowledge can be productively employed. Too often, 'information' and 'knowledge' have been used fairly interchangeably to the detriment of knowledge transfer in particular. Distinction between knowledge and information Knowledge, essentially, is ‘organised information’ and the process of organising it is purely intellectual. Information is the product of processing, sorting and combining data (and data are raw, unconnected facts). Information per se cannot be visualised as a ‘brick’ that has some pre-defined intrinsic worth, but rather like clay that the user can mould for constructing his or her sense, and this construction is dependent on the individual’s knowledge base. That is, the ‘enabling value’ of information is contingent on the effectiveness with which it is applied by the user. Examine the following:
Figure 1c. Revolving crane with hoist (Working model after Bonaccorso Ghiberti (Florence, 1451-1516) - The crane is fitted with a vertical pin-gear wheel that activates a jack for lifting light weights and a screw-operated platform for shifting the lifted load sideways.) Modern version on the right hand side.
While the Renaissance engineers can be forgiven for designing and developing machines well ahead of their time, the wide gap in cane productivity must seriously be questioned

International Sugar Journal | ISJ's World Sugar Outlook 201550 51www.internationalsugarjournal.com
user.
Examine the following:
Knowledge - Information = 1
Rapid progress is limited under this circumstance where acquired knowledge is not regularly refreshed by new actionable information to expand this knowledge base to make an informed decision. In an agricultural context, this model is representative of situations where farmers' knowledge base is built up over a period of time mainly through their own 'informal' research on their farms and informal knowledge networks ...built around traditional channels of communication, such as the use of the 'folk media', word-of- mouth, and example as in apprenticeships. This has certainly yielded the development of quality innovative practices: intercropping and agroforestry are just two of these examples. They represent good examples of the holistic approach to agricultural development. That is, they are a stage before the logical progression to the 'science of the
abstract' when the use of products of dedicated research into input use, input intensification and input efficiency takes over.
Knowledge + Information = 1+
Under this circumstance, there is a likelihood of much rapid progress where new relevant information adds to the existing knowledge base leading to its further development. The caveat here is that the level of information processing and use, and the quality of output from this use is contingent on users' knowledge base and cognitive abilities. Further, as the knowledge base expands, less and less information is required to refine it. The oft observation made is a testimony to this. Senior consultants generally rely mostly on their personal knowledge while their junior counterparts rely on a range of information sources to satisfy their information needs to support an informed decision. Secondly, the quality of the knowledge base impacts upon the ability to select information or be selective about what specific information is required to fill a particular information gap. This ability to utilise
Figure 2. Template for increasing sugar beet productivity in UK during 2012-15
Knowledge, an underexploited input for increasing not only cane productivity

International Sugar Journal | ISJ's World Sugar Outlook 201550 51www.internationalsugarjournal.com
new knowledge effectively as a result of having the technical know-how is particularly illustrative of the differences between progress made in agricultural development in developing and emerging economies as opposed to developed countries.
One of the features of advances in new developments is that it not only involves understanding new knowledge and its application, it also involves the more difficult element of unlearning any past practices that have been counter intuitively superseded. One example is reduced inputs of fertilisers in beet production without seeing declines in yield.
Information - Knowledge = 0
This scenario is self-explanatory. No amount of information, no matter its quality, is of use if there is no relevant knowledge base to action it. For example, I can give 'you' all the latest information on astrophysics, but if you have no grounding on the subject, you are not going to make sense of it. A study by ICRISAT in Kenya in one farming community revealed that farmers used the wrong chemical, at the wrong doses at the wrong time to control insect pests in pigeonpeas. In one district, farmers used fungicides recommended for use on tomatoes to control insect pests of pigeonpeas. This lack of knowledge in differentiating between insecticides and fungicides was as much due to limited access to formal advice. The above expression suggests why the laudable aim of making information available is not necessarily going to move mountains. Indeed, the problem is not only about availability or accessibility to actionable information, but the end user having the capability to make sense of and use this information. Initiatives directed only at improving access to information are not enough.
A much more integrated approach that sets out to develop the technical knowledge base and skills through education and training, in tandem with information provision, is likely to lead to more effective exploitation of information that is made available.
Marginal gains, collectively significant
Prior to the Beijing Olympics in 2008, Great Britain’s cycling team was not world renowned. Soon after the 2004 Olympics, UK Sports appointed a Head of Marginal Gains. The purpose of this was to study in-depth accumulation of incremental improvement that would collectively contribute to significant advantage over their rivals. Every aspect of athlete preparation and
lifestyle, equipment, clothing, training methods, nutrition and anything else which might produce a marginal gain was examined. Some of the strategies and tactics that were subsequently deployed included:• never using an Olympic courtesy bus to avoid
possible infections• made-to-measure shoes with custom-made
soles – this was considered a huge innovation• Spraying alcohol on bike wheels to remove a
layer of dirt and increase tackiness before a standing start
• The 'black box' or integrated performance measurement box – the size of a matchbox under a rider's saddle
• To establish actual distance raced down to the last millimetre – literally, videos of complete performances were made
• Fish oil and Montmorency cherries, high in antioxidants were eaten in large quantities as they help muscles recover quicker.
In 2008, the British Cycling team came away with 8 gold medals compared with 2 in the 2004 Olympics. The team leveraged knowledge to the extent that its competitors did not, to secure the competitive advantage it subsequently demonstrated.
The concept of marginal gains is not new in agriculture either, but it is simply not fully exploited as it should. Australian industry has for some years been focusing cane production research into yield stability. Eoin Wallis, the former CEO of BSES Limited, made a pertinent observation in the industry’s Canegrowers Magazine a few years ago. He pointed out that along the value chain from soil cultivation right through to harvesting, a grower can potentially increase cane yields by some 35 t/ha by adhering to best practice at all stages. For example, an additional 15 t cane/ha can be had from forthright control of weeds, pests and diseases, another few more tonnes from appropriate fertiliser application, and so on. The point here is that there is knowledge in the industry that can be productively exploited - but it is not.
In a clear extension of seeking marginal gains along the value chain in sugar beet production to help maintain increased productivity, the British Beet Research Organisation (BBRO) (2013) produced a blueprint 4X4 Yield Initiative (Figure 2). The aim of this initiative is to help growers to increase yields on average by 4% over the period 2012-15.
To support growers adopt best practice and techniques to increase beet productivity, BBRO has a dedicated communications program
In 2008, the British Cycling team came away with 8 gold medals compared with 2 in the 2004 Olympics. The team leveraged knowledge to the extent that its competitors did not, to secure the competitive advantage it subsequently demonstrated.

International Sugar Journal | ISJ's World Sugar Outlook 201552 53www.internationalsugarjournal.com
“targeted at effective knowledge transfer” via a variety of means, predominantly social interactions. This embraces: technical meetings, decision-maker training, field demonstrations, operator training courses, printed technical bulletins, electronic communications (e.g. internet portal, email and text messages), face-to-face advice, and plant clinic.
It is apparent that these initiatives help build a common shared background that facilitates communication between the parties and, invariably, knowledge transfer.
Concluding comment
With the increasing consolidation in the sugar industry, it is within the wit of the many large companies in the cane sugar industry to proactively develop an effective knowledge-transfer structure along the lines developed by the likes of BBRO. Yes, in some industries, there are enormous challenges. For example, on average a sugar mill in India deals with 40 000 cane growers. This clearly is likely to put enormous strain on executing knowledge-transfer initiatives without significant investment. But these are not insurmountable. To restate, the dividend from applying knowledge is as great as any of the complementary capital inputs, if not more. Indeed, over the last twenty years, the key driver for increasing agricultural productivity has been know-how (figure 3).
References
Anon. (2013). The art of invention: Leonardo and the
engineers of the Renaissance http://brunelleschi.imss.
fi.it/ingrin/index.html. Accessed 7 April 2013.
British Beet Research Organisation. (2013). 4x4
Yield Objectives. http://www.bbro.co.uk/sites/
default/files/4x4%20Yield%20Objectives%20-%20
Delivery%20Plan%20July%202012_0.pdf. Accessed
7 April 2013.
Cock, J., Oberthür, T., Isaacs, C. et al. (2011). Crop
management based on field observations: Case
studies in sugarcane and coffee. Agricultural Systems,
104: 755-769.
Fuglie, K., Wang, S.L. and Ball, V.E. (eds) (2012)
Productivity growth in agriculture: an international
perspective. CAB International, Wallingford:UK, 392pp
Jaggard, K.W., Koch, H-J., Arroyo Sanz, J.M. et al.
(2012). The yield gap in some sugar beet producing
countries. Int Sugar J., 114: 496-499.
Ray, D.K., Ramankutty, N., Mueller, N.D., West, P.C. and
Foley, J.A. (2012). Recent patterns of crop yield growth
and stagnation. Nature Communications (DOI10.1038/
ncomms2296).
Figure 3. Sources of expansion in agricultural productivity over the period 1961-2009
(Know-how)
Knowledge, an underexploited input for increasing not only cane productivity

International Sugar Journal | ISJ's World Sugar Outlook 201552 53www.internationalsugarjournal.com
bioprocess plants
Established in 1921, VOGELBUSCH is world renowned for biotechnological expertise in fermentation, separation, distillation, and evaporation, and offers a wide range of proprietary technologies for the industrial production of biocommodities, such as alcohol, bioethanol, vinegar, yeast, organic acids, glucose and high fructose syrup (HFS).
Stand out from the rest with a customized, state-of-the-art plant. Whether you require technology and process design, detailed engineering, start-up assistance, supply of key equipment, and/or turnkey supply of complete process units, we will tailor our services to meet your needs.
VOGELBUSCH Biocommodities GmbHBlechturmgasse 11 | 1051 Vienna | Austria [email protected] | www.vogelbusch-biocommodities.com
TAILOREDto suit you

International Sugar Journal | ISJ's World Sugar Outlook 201554 55www.internationalsugarjournal.com
Strecker degradation, an unknown phenomenon?Suiker Unie, Central Office Suiker Unie, P.O. Box 100, 4750 AC Oud Gastel, The Netherlands
Email: [email protected]
Abstract On 1 November 2003, an explosion occurred in the sugar house of Puttershoek
sugar factory (Suiker Unie, The Netherlands). Because the cause of the incident
was not immediately known, but seemed to be a result of Strecker degradation
in combination with 'runaway behavior' (uncontrolled reaction), a literature study
was begun. Only a few reports about incidents in beet sugar manufacture were
found. Suiker Unie wanted to take measures to avoid such incidents in the future
and so began research to obtain parameters in order to make a quantitative
analysis of the risk potential as result of this kind of 'runaway behavior' in sugar
production. The first measurements confirmed that molasses and other sugar
house products can exhibit 'runaway behavior' when exposed to relatively high
temperatures. Besides research on the kinetic aspects of Strecker degradation
Suiker Unie carried out a safety study within their factories. Critical equipment
and process situations were identified and preventive measures were taken in
the field of installation and organization.
Keywords: Strecker degradation, sugar house, runaway reaction, explosion,
preventive measures
Introduction
For a sugar technologist and especially those in operational duties, it is important to know particular process risks. On November 1st 2013, an explosion caused by a Strecker degradation resulted in a fatal accident in the Puttershoek
plant of Suiker Unie, The Netherlands. This paper is meant to bring relevant knowledge about the phenomenon of Strecker degradation and create awareness. It is not meant to give a detailed information about the chemical reactions involved1. But there are a couple of facts that in the author’s opinion every sugar
Arend Wittenberg

International Sugar Journal | ISJ's World Sugar Outlook 201554 55www.internationalsugarjournal.com
technologist and factory manager should know about Strecker degradation: It is an exothermic reaction and part of the Maillard reaction group. Dicarbonyl- and amino-components form several typical products, such as ketones, pyrazins, pyrroles and furans. Parallel carbon-dioxide and ammonia are set free, causing a typical smell. The runaway reaction can even take place in products of very high purities as the trials of Foster (1974) showed. The chemical pathway at high purities has not yet been investigated to the author’s best of knowledge. Strecker reaction is promoted by the presence of amino acids, dicarbonyls (for instance, from invert sugar, frequently coming together with low pH values in the sugar house) and high temperatures. The reaction results in foaming, pressure and temperature rising and forming of sugar coal. Runaway behavior is possible as soon as heat production is higher than heat removal.
Literature review suggests that similar incidents have taken place in the beet- and cane-sugar industry in all sorts of massecuite and run-offs (Table 1). During the evaluation of the accident in Puttershoek ten years ago it was realized that there was little information available about this phenomenon. Also, it was realized that factory people were not all aware about the particular risks when for instance using steam for cleaning blocked massecuite pipes.
A short overview is given about sugar industry investigations after incidents where Strecker degradation potentially occurred is given here. The fatal accident at Puttershoek and the activities which Suiker Unie started to prevent this process risk in future are then described. Finally an overview of the established technical and organizational prevention measures is given.
Sugar industry investigations
In 1962, Hoewert reported investigations carried out after an explosion of a molasses
pipeline in Germany. His lab-scale experiments with heated molasses showed pressures above 40 bar caused by excessive gas forming after around 20 h of heat-treatment (Figure 1). He also proposed several safety-measures on tank storage of molasses. Initiated by the explosion of an A-massecuite pipe while steaming out, Foster (1974) used a sealed bomb to look at the relation between temperature, massecuite concentrations, purity and time. He showed exothermic behavior of the reaction and committed an incubation time before the runaway behavior starts (Figure 2). He also stated that degradation behaviour occurs even in the absence of amino acids.
Mantovani and Vaccari (1994) published a literature survey about molasses decomposition.
Table 1. Published incidents most likely caused by Strecker degredation
Year Incident Place Reported by
< 1962 Molasses pipeline to tank exploded Germany Hoewert, 1962
< 1974 Cut-over-pipe A-pan Australia Foster, 1974
1978 Cut-over-pipe A-pan Darnall, South Africa Getaz et al, 2006
1987 Heavy foaming molasses tank Karpalund, Sweden Tjebbes, 1987
1990 C-pan exploded Walschleben, Germany Anonymous, 1991
1991 B-pan exploded Glogow, Poland Walerianczyk, 1993
1995 Low-raw massecuite pipe exploded Nampa, USA Rearick & Kusterer, 1999
2003 C-massecuite pipe exploded Puttershoek, The Netherlands
Platje et al., 2006
2005 Cut-over/drain-pipe attached to continuous pan
Central America Getaz et al, 2006
2010 Cut-over pipe, unknown product Louisiana, USA Anonymous, 2010
In 1962, Hoewert reported investigations carried out after an explosion of a molasses pipeline in Germany. His lab-‐scale experiments with heated molasses showed pressures above 40 bar caused by excessive gas forming after around 20 h of heat-‐treatment (Figure 1). He also proposed several safety-‐measures on tank storage of molasses. Initiated by the explosion of an A-‐massecuite pipe while steaming out, Foster (1974) used a sealed bomb to look at the relation between temperature, massecuite concentrations, purity and time. He showed exothermic behavior of the reaction and committed an incubation time before the runaway behavior starts (Figure 2). He also stated that degradation behaviour occurs even in the absence of amino acids.
Mantovani and Vaccari (1994) published a literature survey about molasses decomposition. They advised not to exceed a certain temperature for molasses storage.
After an explosion of a low-‐raw-‐massecuite at Nampa factory in the USA in 1995, Rearick and Kusterer (1999) analyzed several product samples after the explosion and stated a chemical decomposition which clearly pointed to Strecker degradation. Furthermore, they discussed several safety measures, especially the importance of avoiding a certain coincidence of circumstances.
Figure 1: Behavior of molasses when heat treated on lab scale (Hoewert, 1962)
Figure 1. Behavior of molasses when heat treated on lab scale (Hoewert, 1962)
44 Literature review suggests that similar incidents have taken place in the beet- and cane-sugar industry in all sorts of massecuite and run-offs

International Sugar Journal | ISJ's World Sugar Outlook 201556 57www.internationalsugarjournal.com
Strecker degradation, an unknown phenomenon?
They advised not to exceed a certain temperature for molasses storage.
After an explosion of a low-raw-massecuite at Nampa factory in the USA in 1995, Rearick and Kusterer (1999) analyzed several product samples after the explosion and stated a chemical decomposition which clearly pointed to Strecker degradation. Furthermore, they discussed several safety measures, especially the importance of avoiding a certain coincidence of circumstances.
Getaz et al. (2006) highlighted the importance of publicizing causes and consequences. They gave detailed descriptions of two explosions of massecuite cut-over-lines: one took place in Darnall, South Africa, in 1978 on A-product, the other in Central America in 2005 on C-product. In both cases the use of high-pressure-steam was identified as the initiator of Strecker decomposition. As prevention measures they proposed either not to use high-pressure for steaming or to avoid closed systems.
The general lesson when regarding all those papers is that Strecker degradation can occur under the most usual factory circumstances.
Fatal accident at Puttershoek factory 2003
In the following section, the accident that happened on November 1st at Puttershoek factory is described in detail. Figure 3 shows a simplified process scheme of the after product station of that factory.
The C-massecuite is produced in batch vacuum pans, cooled down sequentially in horizontal and vertical crystallizers to 53 °C, then heated up again in an FCB-reheater to decrease massecuite viscosity. Finally the massecuite passes into continuous centrifuges. As part of the control system there is a temperature- (blue) and a pressure-transmitter (red) mounted in the massecuite pipe above the centrifuges. The readings of these two transmitters are shown in Figure 4 to help to explain the chronology of the accident.
1. There was normal production until 2 a.m. when there was a sudden stop of the C-centrifugals
caused by a broken axle of the affination mingler underneath the batch pans. The after product station had to be stopped immediately. As soon as it became clear that it would take a couple of hours to repair the mingler, beet slicing was reduced to a minimum and preparations were taken to recycle massecuite from above the centrifuges back to the reception minglers to keep it moving.2. Due to a plug of crystallized C - p r o d u c t , m a s s e c u i t e circulation could not be started. It was decided to fully stop beet slicing.
Figure 2: Induction times of diverse sugar house products (Foster, 1974)
Getaz et al. (2006) highlighted the importance of publicizing causes and consequences. They gave detailed descriptions of two explosions of massecuite cut-‐over-‐lines: one took place in Darnall, South Africa, in 1978 on A-‐product, the other in Central America in 2005 on C-‐product. In both cases the use of high-‐pressure-‐steam was identified as the initiator of Strecker decomposition. As prevention measures they proposed either not to use high-‐pressure for steaming or to avoid closed systems.
The general lesson when regarding all those papers is that Strecker degradation can occur under the most usual factory circumstances.
Fatal accident at Puttershoek factory 2003
In the following section, the accident that happened on November 1st at Puttershoek factory is described in detail. Figure 3 shows a simplified process scheme of the after product station of that factory.
Figure 2. Induction times of diverse sugar house products (Foster, 1974)
Figure 3: Simplified process-‐scheme of C-‐product installation
The C-‐massecuite is produced in batch vacuum pans, cooled down sequentially in horizontal and vertical crystallizers to 53 °C, then heated up again in an FCB-‐reheater to decrease massecuite viscosity. Finally the massecuite passes into continuous centrifuges. As part of the control system there is a temperature-‐ (blue) and a pressure-‐transmitter (red) mounted in the massecuite pipe above the centrifuges. The readings of these two transmitters are shown in Figure 4 to help to explain the chronology of the accident.
1. There was normal production until 2 a.m. when there was a sudden stop of the C-‐centrifugals caused by a broken axle of the affination mingler underneath the batch pans. The after product station had to be stopped immediately. As soon as it became clear that it would take a couple of hours to repair the mingler, beet slicing was reduced to a minimum and preparations were taken to recycle massecuite from above the centrifuges back to the reception minglers to keep it moving.
2. Due to a plug of crystallized C-‐product, massecuite circulation could not be started. It was decided to fully stop beet slicing.
3. To remove the plug, 3 bar steam was injected into the pipe above the centrifuges. The automatic massecuite valve underneath the vertical crystallizer closed as the pressure was above set-‐point. Due to slight massecuite-‐movement the
TI
PIC
VCC53 ºC
reheater
HCC58-‐60 ºC
C-‐minglers
C-‐centrifuges
vacuum pans
TI
PIC
TITI
PIC
VCC53 ºC
reheater
HCC58-‐60 ºC
C-‐minglers
C-‐centrifuges
vacuum pans
VCC53 ºC
reheater
HCC58-‐60 ºC
C-‐minglers
C-‐centrifuges
vacuum pans
HCC = horizontal cooling crystallizerVCC = vertical cooling crystallizer
Figure 3. Simplified process-scheme of C-product installation

International Sugar Journal | ISJ's World Sugar Outlook 201556 57www.internationalsugarjournal.com
3. To remove the plug, 3 bar steam was injected into the pipe above the centrifuges. The automatic massecuite valve underneath the vertical crystallizer closed as the pressure was above set-point. Due to slight massecuite-movement the pressure dropped slowly and the automatic-valve opened again. To maintain the pressure in the massecuite pipe the valve was set to manual control and shut. From this moment on the only outlet of the pipeline was through the massecuite plug. 4. At 02:13 p.m. the massecuite temperature at the outlet of the reheater reached 100 °C.5. At 04:27 p.m. the pressure in the massecuite pipe increased massively. At above 13 bar a flange connection failed and massecuite sprayed all over (Figure 5). An operator who was inspecting the scene at that moment was burned massively by the hot massecuite and died later that day at hospital. The typical smell of
burned sugar and gaseous reaction products were the first indicators that Strecker degradation had taken place. Within the Suiker Unie there was little knowledge about this runaway-reaction available at that time – and nothing within the Puttershoek factory.
Several samples were taken around the spot where the accident occurred. The results given in (Table 2) indicate clearly that a chemical reaction, most probably due to Strecker degradation, took place that massively changed product characteristics.
Even though the massecuite pipe above the centrifuges was open, massive increase in pressure occurred which finally led to the fatal explosion. The combination of high massecuite viscosity (after product) and a long distance between the place of heating and the discharge, caused pressure to increase much faster than the massecuite could flow. It is after all an open question whether an open bottom valve of the vertical crystallizer would have been sufficient to avoid the pressure build-up.
Follow-up of the accident
The experience of such a fatal accident gave Suiker Unie the responsibility to take as much preventive measures as possible and to share the experience within the business. First actions taken were to repair the installation and to put fail-safe modifications in place before authorities gave permission to restart the production. In parallel much attention was paid to confidence building of the operators.
After the campaign, a study on the runaway behavior of technical sucrose solutions was initiated, which was carried out in cooperation with several European sugar companies (Platje et al. 2006). Calorimetric analyses were carried using an accelerating rate calorimeter. To gain more quantitative information about the kinetics of the reaction, several sugar house products were collected from different factories in Europe, also including cane-molasses. From calorimetric measurements it was learned that the adiabatic
pressure dropped slowly and the automatic-‐valve opened again. To maintain the pressure in the massecuite pipe the valve was set to manual control and shut. From this moment on the only outlet of the pipeline was through the massecuite plug.
4. At 02:13 p.m. the massecuite temperature at the outlet of the reheater reached 100 °C.
5. At 04:27 p.m. the pressure in the massecuite pipe increased massively. At above 13 bar a flange connection failed and massecuite sprayed all over (Figure 5). An operator who was inspecting the scene at that moment was burned massively by the hot massecuite and died later that day at hospital.
The typical smell of burned sugar and gaseous reaction products were the first indicators that Strecker degradation had taken place. Within the Suiker Unie there was little knowledge about this runaway-‐reaction available at that time – and nothing within the Puttershoek factory.
Figure 4: Chronology of Puttershoek accident (temperature and pressure at inlet of centrifuges)
0
20
40
60
80
100
0:00 2:00 4:00 6:00 8:00 10:00 12:00 14:00 16:00time
tem
pera
ture
/ ºC
0
2
4
6
8
10
pres
sure
/ ba
r
temperaturepressure
0
20
40
60
80
100
0:00 2:00 4:00 6:00 8:00 10:00 12:00 14:00 16:00time
tem
pera
ture
/ ºC
0
2
4
6
8
10
pres
sure
/ ba
r
temperaturepressure
Figure 4. Chronology of Puttershoek accident (temperature and pressure at inlet of centrifuges)
Figure 5: Exploded flange-‐connection of C-‐massecuite pipeline at outlet reheater (left) Bent floor-‐plates above place of explosion (right)
Several samples were taken around the spot where the accident occurred. The results given in (Table 2) indicate clearly that a chemical reaction, most probably due to Strecker degradation, took place that massively changed product characteristics.
Table 2: Chemical changes in products of C-‐massecuite degradation
Criteria Chemical change decrease of pH down to 4.9 decrease of polarization -‐ 11 % pol increase of reducing substances from 0.2 to 4.1 % dry matter increase of insolubles from 0.1 % to 6.3 % presence of furanes Yes
Even though the massecuite pipe above the centrifuges was open, massive increase in pressure occurred which finally led to the fatal explosion. The combination of high massecuite viscosity (after product) and a long distance between the place of heating and the discharge, caused that pressure to increase much faster than the massecuite could flow. It is after all an open question whether an open bottom valve of the vertical crystallizer would have been sufficient to avoid the pressure build-‐up.
Follow-‐up of the accident
The experience of such a fatal accident gave Suiker Unie the responsibility to take as much preventive measures as possible and to share the experience within the business. First actions taken were to repair the installation and to put fail-‐safe modifications in place before authorities gave permission to restart the production. In parallel much attention was paid to confidence building of the operators.
Figure 5. Exploded flange-connection of C-massecuite pipeline at outlet reheater (left)Bent floor-plates above place of explosion (right)
Table 2. Chemical changes in products of C-massecuite degradation
Criteria Chemical change
decrease of pH
down to 4.9
decrease of polarization
- 11 % pol
increase of reducing substances
from 0.2 to 4.1 % dry matter
increase of insolubles
from 0.1 % to 6.3 %
presence of furanes
Yes

International Sugar Journal | ISJ's World Sugar Outlook 201558 59www.internationalsugarjournal.com
induction times of those products is strongly dependent on temperature (Table 3). There was no clear dependency seen from the product quality on the induction time, especially at lower temperatures. But it can be concluded that for temperatures above 100 °C the adiabatic induction time for all sugar house products is shorter than several hours.
Taking into account the kinetic parameters, the thermodynamic behavior of product spheres with different diameters were modeled (Figure 6). As can be seen in the left graph, a product-sphere of 0.5 m size at 100 °C will show runaway behavior, whereas a smaller sphere of the same product will not. From the studies on induction times and the modeling of the reaction kinetics it was concluded that under sugar factory conditions where temperatures of 100°C are possible, all products can exhibit runaway behavior.
Preventive measures against Strecker degradation
To transfer insights into the industrial practice
Suiker Unie carried out a safety study at all their plants with three main elements:
1. critical equipment and process situations,2. technical measures for prevention,3. organizational measures. Table 4 gives an overview of equipment
and process situations during sugar production process that are critical with respect to Strecker degradation. Generally all equipment where heat transfer takes place or heat supply is present has to be considered as critical. Typical risk situations are unstable process conditions: start-ups, shut-downs, technical or technological failures, blockages, use of steam, break-down of electrical supply, break-down of air supply.
The technical measures identified are meant to either create fail-safe systems or to increase the process reliability. Where possible, steam supplies for cleaning or deblocking purposes were exchanged with water supplies. Where steam still has to be used, venting or draining valves were installed in pipelines and manifolds, especially for massecuite, to avoid closed bodies when cleaning. Especially with high-viscous massecuites, it is of importance that
After the campaign, a study on the runaway behavior of technical sucrose solutions was initiated, which was carried out in cooperation with several European sugar companies (Platje et al. 2006). Calorimetric analyses were carried using an accelerating rate calorimeter. To gain more quantitative information about the kinetics of the reaction, several sugar house products were collected from different factories in Europe, also including cane-‐molasses. From calorimetric measurements it was learned that the adiabatic induction times of those products is strongly dependent on temperature (Table 3). There was no clear dependency seen from the product quality on the induction time, especially at lower temperatures. But it can be concluded that for temperatures above 100 °C the adiabatic induction time for all sugar house products is shorter than several hours.
Table 3: Adiabatic induction times (hours) for sugar house products (Platje et al. 2006)
Taking into account the kinetic parameters, the thermodynamic behavior of product spheres with different diameters were modeled (Figure 6). As can be seen in the left graph, a product-‐sphere of 0.5 m size at 100 °C will show runaway behavior, whereas a smaller sphere of the same product will not. From the studies on induction times and the modeling of the reaction kinetics it was concluded that under sugar factory conditions where temperatures of 100°C are possible, all products can exhibit runaway behavior.
Adiabatic induction times50 60 70 80 90 100 110 120 130 140
dil.molasses (old) - 840 360 165 79 39 20 11 6 -a-juice 1353 484 185 74 32 14 6.5 3.2 1.6 0.82b1-juice 2014 637 216 78 30 12 5.1 2.3 1 0.5c-juice 241 108 51 25 13 6.7 3.7 2.1 1.2 0.73c-cuite 1292 469 181 74 32 14 6.7 3.3 1.7 0.87dil.molasses 483 192 81 36 17 8 4.1 2.1 1.1 0.64b1-juice_bis 3505 1050 339 117 43 16.5 6.7 2.9 1.3 0.6molasses P&L Elsdorf 1720 602 224 88 37 16 7.3 3.5 1.7 0.9molasses SZ Ochsenfurt 603 226 90 38 17 7.6 3.7 1.8 0.9 0.5molasses cane sugar Marseille 1470 426 133 44 16 5.9 2.3 1 0.4 0.2
start temperature [°C]
Table 3. Adiabatic induction times (hours) for sugar house products (Platje et al. 2006)
Figure 6: Mathematic modeling of runaway behavior (Platje et al. 2006)
Preventive measures against Strecker degradation
To transfer insights into the industrial practice Suiker Unie carried out a safety study at all their plants with three main elements:
1. critical equipment and process situations,
2. technical measures for prevention,
3. organizational measures.
Table 4 gives an overview of equipment and process situations during sugar production process that are critical with respect to Strecker degradation. Generally all equipment where heat transfer takes place or heat supply is present has to be considered as critical. Typical risk situations are unstable process conditions: start-‐ups, shut-‐downs, technical or technological failures, blockages, use of steam, break-‐down of electrical supply, break-‐down of air supply.
The technical measures identified are meant to either create fail-‐safe systems or to increase the process reliability. Where possible, steam supplies for cleaning or deblocking purposes were exchanged with water supplies. Where steam still has to be used, venting or draining valves were installed in pipelines and manifolds, especially for massecuite, to avoid closed bodies when cleaning. Especially with high-‐viscous massecuites, it is of importance that the installation of heat entrance (f.i. steam supply) and venting is close to each other to avoid unacceptable pressure peaks.
0 2 4 6 8 10 120
200
400
600
800
1000
1200
tem
p [C
]
tijd [uren]
diameter= 0.5 [m]
0 5 10 15 2020
40
60
80
100
120
tem
p [C
]
tijd [uren]
diameter= 0.2 [m]
D = 0.2 m Tstart = 120 °C
è no runaway
D = 0.5 m Tstart = 100 °C
è runaway !
Figure 6. Mathematic modeling of runaway behavior (Platje et al. 2006)
Table 4. Equipment and process situations critical for Strecker degradation
Equipment Process situations
crystallisers start-up, shut-down
minglers failures
massecuite pumps
blockages
massecuite pipes
use of steam
heat exchangers
break-down of electrical supply
cooling crystallizers
break-down of air supply
reheaters
centrifuges
molasses (juice) storage
molasses to beet-pulp-pellets
Strecker degradation, an unknown phenomenon?

International Sugar Journal | ISJ's World Sugar Outlook 201558 59www.internationalsugarjournal.com
the installation of heat entrance (f.i. steam supply) and venting is close to each other to avoid unacceptable pressure peaks.
To avoid uncontrolled heating, fixed steam connections were replaced with removable couplings or with block-and-bleed connections. Last but not least, electrical supplies to minglers and crystallisers were optimized to reduce the risk of stand-still.
When it comes to organizational measures, the first but maybe the most important measure was to define a simple and easy to remember rule-of-thumb. Similar to the ideas of Rearick and Kusterer (1999) the so-called Stecker-triangle
was defined (Figure 7). If at least one of the corners of the triangle is taken away, the risk is controlled: heat, time or an enclosed system.
With training and coaching, knowledge and awareness amongst the production staff were increased and a shift in behavior at risk-related activities was initiated. Furthermore responsibilities and procedures (figure 5) were clearly defined and are now part of the factory safety system within Suiker Unie. Maintaining the awareness and the relevant knowledge about Strecker degradation, its particular risks and the measures against it, are of highest importance to prevent any further accidents in this field. Therefore, this topic is since 2010 also part of the yearly sugar technology short course at the Technical University of Berlin.
Endnote
1More information about the chemistry of Strecker
degradation in for instance Schönberg and Moubacher
(1952), V.D. Poel et al (1998), Berger (2007)
*This is the amended version of the paper presented at the 2014 Sugar Industry Technologists conference in Toronto, Canada.
References
Anonymous (1991): Bilanz der Arbeitssicherheit 1990:
Anstieg der Betriebs- und Wegeunfälle, Zuckerindustrie,
116, pp 555 – 558.
Anonymous (2010): Massecuite explosion hazard,
experience with massecuite decomposition, Chilworth
Global, Inc., found as handout at SIT 2010.
Berger, R. G. (2007): Flavours and Fragrances, Strecker
degradation, Chapter 12.2.2.
Foster, D. H. (1974): The explosive decomposition
of heated massecuite, Proc. Int. Soc. Sugar Cane
Technol. 15, pp 1196-1205.
Getaz, M., R. D. Archibald, D. J. Love (2006):
Experiences of massecuite pipeline explosions caused
by the high temperature decomposition of molasses,
Proc. S. Afr. Sug. Technol. Ass. 80, pp 391.
Hoewert, E. (1962): Zerknall der Abfülleitung einer
Melasse-Speicheranlage infolge Zersetzung der
Melasse, Z. f. Zuckerindustrie 2, pp 77-79.
Mantovani, G., G. Vaccari (1994): Spontaneous
decomposition of molasses during storage, Sugar
Journal, 56, No. 11, pp 17-19 (part I), No. 12, pp 16-18
(part II).
Platje, T., A. Wittenberg, A. Timmermans (2006):
Study of the “runaway behavior” of technical sucrose
solutions, Zuckerindustrie 131, pp 231-238
Poel, P.W. van der, H. Schiweck, T. Schwartz (1998):
Sugar Technology, Strecker Degradation, Chapter
2.4.3.4.
Rearick, D.E., J. Kusterer (1999): Explosive
decomposition of low raw fillmass, Sug Ind Technol.,
paper #759.
Schönberg, A., R. Moubacher (1952): The Strecker
Degradation of α-Amino Acids,
Chem. Rev., 50 (2), pp 261–277.
Tjebbes, J. (1987): Molasses accident, Sockerbolaget
report, PK, No. 3/1987, unpublished.
Walerianczyk, E. W. (1993): Explosion eines
Verdampfungskristallisators in der Zuckerfabrik
Glogau, Zuckerindustrie 188, pp 469 – 470.
To avoid uncontrolled heating, fixed steam connections were replaced with removable couplings or with block-‐and-‐bleed connections. Last but not least, electrical supplies to minglers and crystallisers were optimized to reduce the risk of stand-‐still.
Table 4: Equipment and process situations critical for Strecker degradation
Equipment Process situations
crystallisers minglers massecuite pumps massecuite pipes heat exchangers cooling crystallizers reheaters centrifuges molasses (juice) storage molasses to beet-‐pulp-‐pellets
start-‐up, shut-‐down failures blockages use of steam break-‐down of electrical supply break-‐down of air supply
When it comes to organizational measures, the first but maybe the most important measure was to define a simple and easy to remember rule-‐of-‐thumb. Similar to the ideas of Rearick and Kusterer (1999) the so-‐called Stecker-‐triangle was defined (Figure 7). If at least one of the corners of the triangle is taken away, the risk is controlled: heat, time or an enclosed system.
Figure 7: Strecker-‐triangle, avoid hazard by taking away at least one of the corners
With training and coaching, knowledge and awareness amongst the production staff
were increased and a shift in behavior at risk-‐related activities was initiated. Furthermore
heatheat
enclosedenclosedsystemsystemtimetime
heatheatheatheat
enclosedenclosedsystemsystemenclosedenclosedsystemsystemtimetimetimetime
Figure 7. Strecker-triangle, avoid hazard by taking away at least one of the corners
Table 5. Risk controlling procedures
Process case → Activity
process stop / blockages
pH control on massecuite/juicecontrol of foaming
low pH drain at high temperature/time
high temperature use water in place of steam to prevent blockages
long residence time
steam only when equipment is open or empty (for heating-up or cleaning purposes)kick-off meeting
high-risk activities
To avoid uncontrolled heating, fixed steam connections were replaced with removable couplings or with block-and-bleed connections.

International Sugar Journal | ISJ's World Sugar Outlook 201560 61www.internationalsugarjournal.com
Review and future options for computer modelling in the sugar industry
Abstract Computer modelling has been used extensively in some processes in the sugar
industry to achieve significant gains. This paper reviews the investigations
carried out over approximately the last twenty five years, including the successes
but also areas where problems and delays have been encountered. In that time
the capability of both hardware and software have increased dramatically. For
some processes such as cane cleaning, cane billet preparation, and sugar
drying, the application of computer modelling towards improved equipment
design and operation has been quite limited. A particular problem has been the
large number of particles and particle interactions in these applications, which,
if modelled individually, is computationally very intensive. Despite the problems,
some attempts have already been made and knowledge gained on tackling
these issues. Even if the detailed modelling is wanting, a model can provide
some useful insights into the processes. Some options to attack these more
intensive problems include the use of commercial software packages, which
are usually very robust and allow the addition of user-supplied subroutines to
adapt the software to particular problems. Suppliers of such software usually
charge a fee per CPU licence, which is often problematic for large problems that
require the use of many CPUs. Another option to consider is using open source
software that has been developed with the capability to access large parallel
resources. Such software has the added advantage of access to the full internal
coding. This paper identifies and discusses the detail of software options with
the potential capability to achieve improvements in the sugar industry.
Keywords: computer modelling, CFD, DEM, sugar processing
F Plaza1, GA Kent, DW Rackemann and DW Stephens2
1Queensland University of Technology, Brisbane, Australia, 2Applied CCM, Melbourne, Australia Email: [email protected]
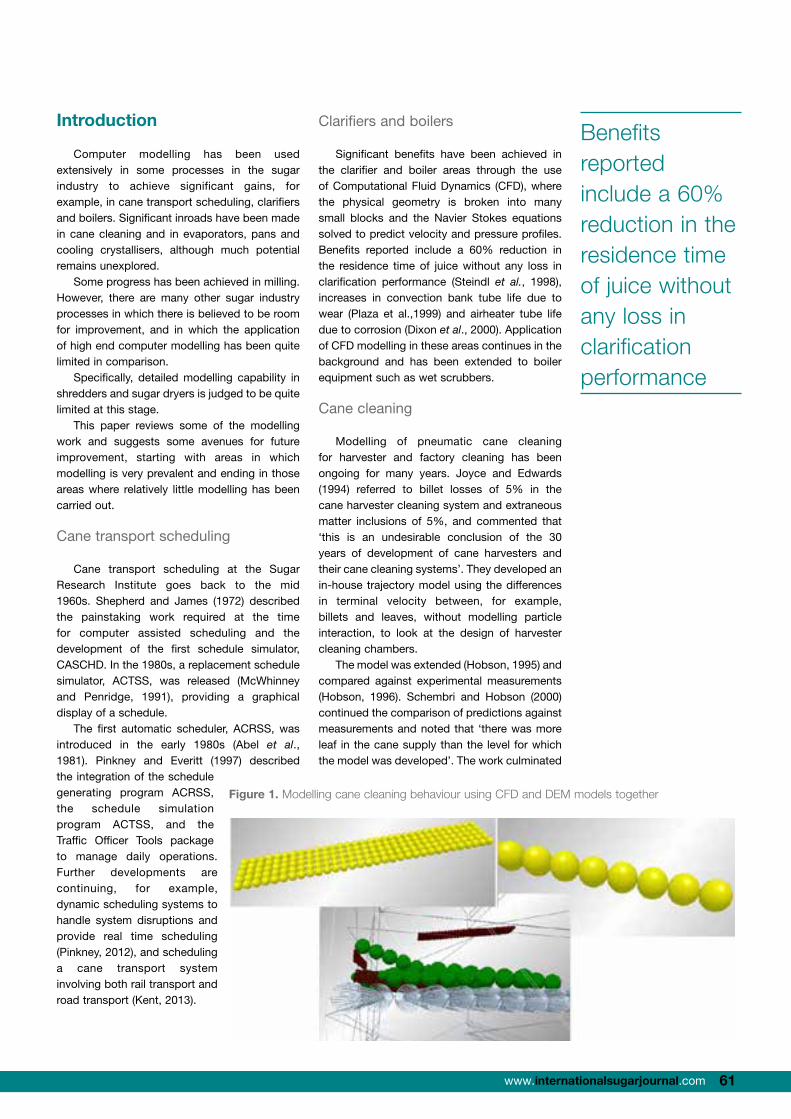
International Sugar Journal | ISJ's World Sugar Outlook 201560 61www.internationalsugarjournal.com
Introduction
Computer modelling has been used extensively in some processes in the sugar industry to achieve significant gains, for example, in cane transport scheduling, clarifiers and boilers. Significant inroads have been made in cane cleaning and in evaporators, pans and cooling crystallisers, although much potential remains unexplored.
Some progress has been achieved in milling. However, there are many other sugar industry processes in which there is believed to be room for improvement, and in which the application of high end computer modelling has been quite limited in comparison.
Specifically, detailed modelling capability in shredders and sugar dryers is judged to be quite limited at this stage.
This paper reviews some of the modelling work and suggests some avenues for future improvement, starting with areas in which modelling is very prevalent and ending in those areas where relatively little modelling has been carried out.
Cane transport scheduling
Cane transport scheduling at the Sugar Research Institute goes back to the mid 1960s. Shepherd and James (1972) described the painstaking work required at the time for computer assisted scheduling and the development of the first schedule simulator, CASCHD. In the 1980s, a replacement schedule simulator, ACTSS, was released (McWhinney and Penridge, 1991), providing a graphical display of a schedule.
The first automatic scheduler, ACRSS, was introduced in the early 1980s (Abel et al., 1981). Pinkney and Everitt (1997) described the integration of the schedule generating program ACRSS, the schedule simulation program ACTSS, and the Traffic Officer Tools package to manage daily operations. Further developments are continuing, for example, dynamic scheduling systems to handle system disruptions and provide real time scheduling (Pinkney, 2012), and scheduling a cane transport system involving both rail transport and road transport (Kent, 2013).
Clarifiers and boilers
Significant benefits have been achieved in the clarifier and boiler areas through the use of Computational Fluid Dynamics (CFD), where the physical geometry is broken into many small blocks and the Navier Stokes equations solved to predict velocity and pressure profiles. Benefits reported include a 60% reduction in the residence time of juice without any loss in clarification performance (Steindl et al., 1998), increases in convection bank tube life due to wear (Plaza et al.,1999) and airheater tube life due to corrosion (Dixon et al., 2000). Application of CFD modelling in these areas continues in the background and has been extended to boiler equipment such as wet scrubbers.
Cane cleaning
Modelling of pneumatic cane cleaning for harvester and factory cleaning has been ongoing for many years. Joyce and Edwards (1994) referred to billet losses of 5% in the cane harvester cleaning system and extraneous matter inclusions of 5%, and commented that ‘this is an undesirable conclusion of the 30 years of development of cane harvesters and their cane cleaning systems’. They developed an in-house trajectory model using the differences in terminal velocity between, for example, billets and leaves, without modelling particle interaction, to look at the design of harvester cleaning chambers.
The model was extended (Hobson, 1995) and compared against experimental measurements (Hobson, 1996). Schembri and Hobson (2000) continued the comparison of predictions against measurements and noted that ‘there was more leaf in the cane supply than the level for which the model was developed’. The work culminated
Benefits reported include a 60% reduction in the residence time of juice without any loss in clarification performance
Plaza F et al. Proc Aust Soc Sugar Cane Technol Vol 36 2014 ______________________________________________________________________________________
290
significantly improved capabilities for modelling sugar mill processes. It was being applied in the coal industry to increase the flow rate and reduce the wear at conveyor transfer points. Sugar Research Limited (SRL) and Queensland University of Technology (QUT) have had a preliminary look at using the CFD code FLUENT (Anon., 2009b) and the DEM code EDEM, both commercial software packages, to model the behaviour of billets and leaves interacting with each other, with an air stream and with physical boundaries.
In particular, the potential of the software to model flexible particles, such as a leaf wrapping over a billet, was flagged. Figure 1 shows the representation of a leaf and a billet using spheres, and a simulation underway in real time.
Fig. 1—Modelling cane cleaning behaviour using CFD and DEM models together.
The results were promising, with predictions showing some leaves caught by the billets, while others worked past the billets and were carried away by the air flow. However, the large number of particles, and the need to represent wide, thin elements such as leaves with a large number of spheres (the leaf shown in Figure 1 is modelled as 4 mm thick, when in reality a leaf is 0.2 mm thick), lead to a very large computational load.
Even with the availability of hundreds of central processing units (CPUs) in high performance computer systems such as at QUT, the software must be coded to take advantage of the large number of CPUs, plus the modelling can be costly as commercial software licenses are usually charged per CPU used. Development that allows the representation of irregular and planar shaped particles without the need for using sphere is continuing.
For example, the DEM software package ROCKY (Anon., 2012a), which has only been commercially available for a few years, has the capability of modelling large aspect ratio or irregularly shaped particles without the use of spheres, although not to the extent required for the geometry of a cane leaf. This capability significantly reduces the required computing load. Evaporators, vacuum pans and cooling crystallisers
Some improvements for juice processing have been achieved without the use of high powered computer modelling. For example, modifications and subsequent results are presented for a Roberts design evaporator by Wright et al. (2003). However, as Wright et al. (2003) commented ‘research based on computational fluid dynamics modelling (Steindl, 2003) has shown that substantial improvements to the juice flow pattern could be made’.
There has been an enormous effort in measuring the boiling behaviour in the juice side of evaporators and vacuum pans and in developing the modelling capability of that behaviour. For example, for vacuum pans: Wright (1966), Austmeyer and Schliephake (1983), Rouillard (1985), Atkinson et al. (2000), Stephens (2001), Stephens and Harris (2002), Rackemann et al. (2006a, b),
Figure 1. Modelling cane cleaning behaviour using CFD and DEM models together

International Sugar Journal | ISJ's World Sugar Outlook 201562 63www.internationalsugarjournal.com
in the installation at Condong Mill of a prototype pneumatic trash separation plant (Schembri et al., 2002). During commissioning, the three dimensional CFD program FURNACE (Boyd and Kent, 1986) assisted in rectifying some aerodynamic instability problems, which had not been predicted by the in-house cane cleaning models. However, FURNACE could not predict the interaction of the cane particles or the effect of the particles on the air stream.
Since that time, there have been significant advances in the wider engineering community in modelling the interaction of fluids (such as air) and particles (such as billets and leaves) using coupling of CFD and Discrete Element Modelling (DEM) methods. DEM models the impact and friction forces between individual particles. The effect of the presence of particles on the air flow and vice-versa can be simulated by coupling the two sets of software. Also, the interaction with boundaries can be modelled more accurately.
In late 2009, the DEM software EDEM (Anon., 2009a) was identified as having significantly improved capabilities for modelling sugar mill processes. It was being applied in the coal industry to increase the flow rate and reduce the wear at conveyor transfer points. Sugar Research Limited (SRL) and Queensland University of Technology (QUT) have had a preliminary look at using the CFD code FLUENT (Anon., 2009b) and the DEM code EDEM, both commercial software packages, to model the behaviour of billets and leaves interacting with each other, with an air stream and with physical boundaries.
In particular, the potential of the software to model flexible particles, such as a leaf wrapping over a billet, was flagged. Figure 1 shows the representation of a leaf and a billet using spheres, and a simulation underway in real time.
The results were promising, with predictions showing some leaves caught by the billets, while others worked past the billets and were carried away by the air flow. However, the large number of particles, and the need to represent wide, thin elements such as leaves with a large number of spheres (the leaf shown in Figure 1 is modelled as 4 mm thick, when in reality a leaf is 0.2 mm thick), lead to a very large computational load.
Even with the availability of hundreds of central processing units (CPUs) in high performance computer systems such as at QUT, the software must be coded to take advantage of the large number of CPUs, plus the modelling can be costly as commercial software licenses are usually charged per CPU used. Development that allows the representation of irregular and planar shaped particles without the need for
using sphere is continuing.For example, the DEM software package
ROCKY (Anon., 2012a), which has only been commercially available for a few years, has the capability of modelling large aspect ratio or irregularly shaped particles without the use of spheres, although not to the extent required for the geometry of a cane leaf. This capability significantly reduces the required computing load.
Evaporators, vacuum pans and cooling crystallisers
Some improvements for juice processing have been achieved without the use of high powered computer modelling. For example, modifications and subsequent results are presented for a Roberts design evaporator by Wright et al. (2003). However, as Wright et al. (2003) commented ‘research based on computational fluid dynamics modelling (Steindl, 2003) has shown that substantial improvements to the juice flow pattern could be made’.
There has been an enormous effort in measuring the boiling behaviour in the juice side of evaporators and vacuum pans and in developing the modelling capability of that behaviour. For example, for vacuum pans: Wright (1966), Austmeyer and Schliephake (1983), Rouillard (1985), Atkinson et al. (2000), Stephens (2001), Stephens and Harris (2002), Rackemann et al. (2006a, b), and for evaporators: Watson (1987), Ingram et al. (1998), Steindl (2003), Pennisi et al. (2004), Broadfoot and Tan (2005), and Broadfoot and Dunn (2007). This list of investigations is far from complete.
The more recent modelling of vacuum pans by Rackemann et al. (2006a) provided predictions of the effect of design features on the volumetric flow rate through the calandria. Only a small part of the actual geometry was modelled using symmetry, for example, a five degree wedge of the three dimensional representation for a batch vacuum pan, in order to reduce computational load.
Rackemann et al. (2006b) carried out steam side modelling of vacuum pans and evaporators, typically modelling a quarter of the geometry. The calandria was modelled as a porous region, with individual tubes not modelled. Despite limitations in the condensation physics of the CFD model, and poor agreement with some pressure measurements, the modelling identified some deficiencies in the flow of steam within the calandria and was able to recommend modifications to the design. Some of the recommendations have been adopted for new
Research based on computational fluid dynamics modelling has shown that substantial improvements to the juice flow pattern could be made
Review and future options for computer modelling in the sugar industry

International Sugar Journal | ISJ's World Sugar Outlook 201562 63www.internationalsugarjournal.com
designs, however any resulting benefits have not been quantified because rigorous measurements of performance such as comparing two similar vessels with and without the modifications have not been carried out.
Typically the heat transfer in evaporators occurring between the condensing steam and the juice within the calandria tubes is limited by the heat transfer on the juice side and not the steam side. This limiting behaviour is due to the lower heat transfer coefficient on the juice side of the tube wall compared to the steam side (condensing saturated steam). However, a coupled 3D simulation between the juice and steam sides could be useful, for example, to predict the best location for juice downtakes. The modelling of incondensable gases and their best way of removal is a future objective. Investigations in the evaporator and vacuum pan area are active and continuing.
The flow and mixing of massecuite in a stirred, vertical crystalliser was studied and modelled by Harris et al. (1995) and Sima and Harris (1997, 1999). Using CFD they identified problems such as considerable short-circuiting, and through the installation of baffles achieved success in narrowing the residence time distribution of the vessel. As noted by McBain et al. (2002) this was achieved even though the modelling required numerous simplifying assumptions in order to apply CFD to such a large and complex vessel. McBain et al. (2002) presented experimental and CFD modelling that improved the understanding of some of the mechanisms occurring in the crystalliser, and the causes of the discrepancies between factory measurements and CFD predictions.
There are fairly recent developments that may be applicable to sugar industry processes. For example, one feature of the software STAR-CCM+ (Anon., 2013a) of interest for predicting the growth of crystals in vacuum pans and crystallisers is the capability to simulate the growth of a coating thickness on particles. For example, Goodwin and Debus (2013) provide examples of modelling the coating of pharmaceutical tablets in both a rotating drum and a fluidised bed.
The transfer mechanisms and driving forces are probably quite different but the modelling capability of material transfer from a bulk liquid to individual particles through detailed interaction is likely to be of use in the future.
Population balance models based on the method of moments have been successfully coupled with CFD to allow simulation of nucleation, molecular growth, agglomeration and breakage in crystallisation processes in
the minerals industry (Hutton et al., 2011). Application of these techniques to vacuum pans and crystallisers has yet to be performed.
Milling
The detailed modelling of the crushing process of sugar cane in a milling unit has the potential to deliver industry benefits. Possible improvements to the process are reduced bagasse moisture, increased sucrose extraction, lower energy use, and reduced capital and operating costs. The modelling uses Finite Element Modelling (FEM), which works out the relationship between stresses and strains, and can also determine the juice flow through the fibrous material (permeability behaviour). Zhao (1993) applied and modified an in-house software code. Subsequent work, for example, Adam (1997), Downing et al. (1999), and Kent (2003), used the commercial software package ABAQUS (Anon., 2012b).
As noted by Leitch (1996), the ABAQUS software has a number of critical state models (Wood, 1990) developed for modelling soil behaviour. They were judged at the time to have the best chance of modelling the elastic and plastic behaviour of bagasse, the large deformations involved (with decreases in volume by a factor of seven), and compression pressures ranging from a few kilopascals at the feed (Donnelly) chute to as much as 20 000 kPa at the delivery nip. However, those critical state models had been specially built for soil, and reservations were held about their capability to model bagasse behaviour in a milling unit (Schembri et al., 1998).
Plaza (2002) showed experimentally that the mechanical behaviour of prepared cane and bagasse is critical state behaviour similar to that of soils. However, it was also shown that there were significant limitations in the existing models when applied to the modelling of the behaviour of prepared cane and bagasse.
For example, improvements were required to predict the important shear stresses (the sum of the shear stresses at the surface of the roll being the torque required to drive the roll). Despite these limitations, Kent (2004) was able to use an ABAQUS FEM computational model to develop a better empirical equation to predict mill feeding (and therefore mill speed), with the potential to better set milling units to meet crushing rate and performance targets. The empirical equation was judged to require experimental validation before being widely used. This is yet to happen.
The development of a material model specifically for bagasse is continuing with limited

International Sugar Journal | ISJ's World Sugar Outlook 201564 65www.internationalsugarjournal.com
resources (Plaza, 2013). The economic drivers for improving the milling process are as strong and may even be stronger now than when the initial modelling began in the 1990s due, for example, to the potential cogeneration revenue.
Cane billet preparation
Shredder design improvements have been ongoing (Cullen and McGinn, 1974; Clarke, 1985; Cullen, 1986; Letizia and McDougall, 1988; Santarossa and Anderson, 2013) including FEM to develop alternative shredder hammer tip designs (Loughran et al., 2005).
The energy use in shredders has been
studied in detail (Schembri and Harris, 1996; Schembri, 1998; Schembri and Harris, 1998).
Schembri (2004) modelled the situation of smashing a single billet by using DEM to reproduce the measured breakage mechanism during impact.
At that time, the DEM method was nowhere near as well developed as CFD for addressing industrial problems.
Simulating the processing of cane billets and extraneous
matter into prepared cane in a shredder involves modelling the flow, interaction, and reduction in size of a large number of discrete particles.
The cane particles interact with other cane particles, fast moving metal surfaces, stationary metal boundaries, and with air. There is little information available on attempts to model this problem as a whole.
It is likely that a model that can simulate all the processes taking place can provide insights to provide more efficient preparation, better feeding, and reduce wear and windage. SRL and QUT have had a preliminary look at using the software CFD package FLUENT and the DEM package EDEM in combination and they do have the basic capability to model all the above, including the breakage of the billets into small fibres and the build up of the fibres in the gaps of the gridbar.
Figure 2 shows the modelling of a partial collision of a shredder hammer with a single billet of cane and subsequent disintegration of the billet. However, the computational load is even higher than the cane cleaning problem due to the larger number of particles.
Sugar drying
Sugar dryer design and operation is described, for example, by Hodgson and Keast (1984), Baird and Beatts (1989), Steindl et al. (1994), Schinkel and Tait (1994), Shardlow et al. (1996), and Lee et al. (2004). Most of these papers present computer models for performance prediction, with a wealth of sugar properties and sugar mill experimental data provided.
Experiments to determine the detailed mechanisms in sugar drying have been carried out, for example, by Xie and White (1997), who looked at the drying of molasses films. Schinkel and Tait (1994) and Hodgson and Keast (1984)
Plaza F et al. Proc Aust Soc Sugar Cane Technol Vol 36 2014 ______________________________________________________________________________________
293
breakage of the billets into small fibres and the build up of the fibres in the gaps of the gridbar. Figure 2 shows the modelling of a partial collision of a shredder hammer with a single billet
of cane and subsequent disintegration of the billet. However, the computational load is even higher than the cane cleaning problem due to the larger number of particles.
Fig. 2—Modelling of a partial collision of a shredder hammer with a single billet of cane.
Sugar drying
Sugar dryer design and operation is described, for example, by Hodgson and Keast (1984), Baird and Beatts (1989), Steindl et al. (1994), Schinkel and Tait (1994), Shardlow et al. (1996), and Lee et al. (2004). Most of these papers present computer models for performance prediction, with a wealth of sugar properties and sugar mill experimental data provided.
Experiments to determine the detailed mechanisms in sugar drying have been carried out, for example, by Xie and White (1997), who looked at the drying of molasses films. Schinkel and Tait (1994) and Hodgson and Keast (1984) make reference to the importance of the shape of the flights. Hodgson and Keast (1984) stated that ‘conventional flight shapes have flat sides. Only with flights of a curved shape is it physically possible to produce a uniform distribution within a cylindrical drum’. This change in design may well be worth pursuing.
The continuing development of computer models intimates that there is still room for improvement in the prediction of the performance of sugar dryers. The sugar dryer problem is well suited to a combination of CFD simulation (the air flow) and DEM (a distribution of sugar crystals).
In processes such as sugar drying, cane cleaning, and shredding, which require large computer resources, one option is to use open source software. For example CFDEM (Goniva et al., 2010) is an interface where the CFD code OpenFOAM (Anon., 2013b) and the DEM code LIGGGHTS (Anon., 2013c) can work together to simulate fluid and particle behaviour. LIGGGHTS has been developed from the code LAMMPS. LAMMPS has been provided freely by the Sandia National Laboratories in the United States since the mid 1990s. An example of CFDEM modelling a rotary dryer (not a sugar dryer) is shown in Figure 3. These codes have been designed to be capable of massively parallel simulations (a large number of CPUs used simultaneously to solve one problem).
Figure 2. Modelling of a partial collision of a shredder hammer with a single billet of cane
Plaza F et al. Proc Aust Soc Sugar Cane Technol Vol 36 2014 ______________________________________________________________________________________
294
Fig. 3—Modelling of a rotary dryer (~1 million particles) using open source software (Kloss et al., 2011).
Conclusions Computer modelling in particular processes has delivered some significant gains to the
Australian sugar industry. It is likely that investment in extending modelling capability into other less advanced areas, if carried out, will be of economic benefit to the industry. Some options for furthering the modelling have been suggested.
*The paper was presented at the 2014 Australian SSCT…………. References Abel DJ, Stark KP, Murry CR, Demoulin Y-M (1981) A routing and scheduling problem for a rail
system: a case study. Journal of the Operational Research Society 32, 767–774. Adam CJ (1997) Application of computational porous media mechanics to the rolling of prepared
sugar cane. PhD Thesis, James Cook University of North Queensland, Townsville. Anon. (2009b) ANSYS. http://www.ansys.com (accessed November 2012). Anon. (2009a) EDEM: DEM for mining and mineral processing. www.dem-solutions.com,
(accessed November, 2009). Anon. (2012a) ROCKY: DEM chute analysis technology. Granular Dynamics International.
http://www.conveyor-dynamics.com, (accessed August, 2012). Anon. (2012b) ABAQUS.: Dassault Systemes Simulia Corp.: Providence, RI, USA. Anon. (2013a) STAR-CCM+. http://www.cd-adapco.com (accessed December 2013). Anon. (2013b) OpenFOAM. http://www.openfoam.org (accessed December 2013). Anon. (2013c) LIGGGHTS. http://www.liggghts.com (accessed December 2013). Atkinson BJ, Stephens DW, Harris JA, Schneider PA (2000) The net pressure driving force due to
boiling in calandria tubes. Proceedings of the Australian Society of Sugar Cane Technologists 22, 449–455.
Austmeyer KE, Schliephake D (1983) Solution flow and exchange and heat transfer in a heating tube of an evaporation-crystalliser. International Sugar Journal 85, 328–333.
Baird JC, Beatts RM (1989) Design and operational aspects of Macknade’s sugar dryer station. Proceedings of the Australian Society of Sugar Cane Technologists 11, 237–245.
Boyd RK, Kent JH (1986) Three-dimensional furnace modelling. In ‘21st Symposium. (Int) on Combustion’. pp. 265–274 (The Combustion Institute:, Pittsburgh).
Broadfoot R, Dunn KG (2007) Assessing the effect of juice properties and operating conditions on the heat transfer in Robert evaporators. Proceedings of the Australian Society of Sugar Cane Technologists 29, (electronic format) 10 pp.
Figure 3. Modelling of a rotary dryer (~1 million particles) using open source software (Kloss et al., 2011).
Review and future options for computer modelling in the sugar industry

International Sugar Journal | ISJ's World Sugar Outlook 201564 65www.internationalsugarjournal.com
make reference to the importance of the shape of the flights. Hodgson and Keast (1984) stated that ‘conventional flight shapes have flat sides. Only with flights of a curved shape is it physically possible to produce a uniform distribution within a cylindrical drum’. This change in design may well be worth pursuing.
The continuing development of computer models intimates that there is still room for improvement in the prediction of the performance of sugar dryers. The sugar dryer problem is well suited to a combination of CFD simulation (the air flow) and DEM (a distribution of sugar crystals).
In processes such as sugar drying, cane cleaning, and shredding, which require large computer resources, one option is to use open source software. For example CFDEM (Goniva et al., 2010) is an interface where the CFD code OpenFOAM (Anon., 2013b) and the DEM code LIGGGHTS (Anon., 2013c) can work together to simulate fluid and particle behaviour. LIGGGHTS has been developed from the code LAMMPS. LAMMPS has been provided freely by the Sandia National Laboratories in the United States since the mid 1990s. An example of CFDEM modelling a rotary dryer (not a sugar dryer) is shown in Figure 3. These codes have been designed to be capable of massively parallel simulations (a large number of CPUs used simultaneously to solve one problem).
Conclusions
Computer modelling in particular processes has delivered some significant gains to the Australian sugar industry. It is likely that investment in extending modelling capability into other less advanced areas, if carried out, will be of economic benefit to the industry. Some options for furthering the modelling have been suggested.
*This paper was presented at the 2014 Australian Society of Sugar Cane Technologists annual conference and is published here with the agreement of the Society.
References
Abel DJ, Stark KP, Murry CR, Demoulin Y-M (1981)
A routing and scheduling problem for a rail system:
a case study. Journal of the Operational Research
Society 32, 767–774.
Adam CJ (1997) Application of computational porous
media mechanics to the rolling of prepared sugar
cane. PhD Thesis, James Cook University of North
Queensland, Townsville.
Anon. (2009b) ANSYS. http://www.ansys.com
(accessed November 2012).
Anon. (2009a) EDEM: DEM for mining and mineral
processing. www.dem-solutions.com, (accessed
November, 2009).
Anon. (2012a) ROCKY: DEM chute analysis technology.
Granular Dynamics International. http://www.conveyor-
dynamics.com, (accessed August, 2012).
Anon. (2012b) ABAQUS.: Dassault Systemes Simulia
Corp.: Providence, RI, USA.
Anon. (2013a) STAR-CCM+. http://www.cd-adapco.
com (accessed December 2013).
Anon. (2013b) OpenFOAM. http://www.openfoam.org
(accessed December 2013).
Anon. (2013c) LIGGGHTS. http://www.liggghts.com
(accessed December 2013).
Atkinson BJ, Stephens DW, Harris JA, Schneider PA
(2000) The net pressure driving force due to boiling in
calandria tubes. Proceedings of the Australian Society
of Sugar Cane Technologists 22, 449–455.
Austmeyer KE, Schliephake D (1983) Solution flow
and exchange and heat transfer in a heating tube of
an evaporation-crystalliser. International Sugar Journal
85, 328–333.
Baird JC, Beatts RM (1989) Design and operational
aspects of Macknade’s sugar dryer station.
Proceedings of the Australian Society of Sugar Cane
Technologists 11, 237–245.
Boyd RK, Kent JH (1986) Three-dimensional furnace
modelling. In ‘21st Symposium. (Int) on Combustion’.
pp. 265–274 (The Combustion Institute:, Pittsburgh).
Broadfoot R, Dunn KG (2007) Assessing the effect of
juice properties and operating conditions on the heat
transfer in Robert evaporators. Proceedings of the
Australian Society of Sugar Cane Technologists 29,
(electronic format) 10 pp.
Broadfoot R, Tan SY (2005) Understanding juice flow
patterns in Robert evaporators. Proceedings of the
Australian Society of Sugar Cane Technologists 27,
(electronic format) 11 pp.
Clarke CD (1985) The 2.75 m shredder installation at
Farleigh Mill Proceedings of the Australian Society of
Sugar Cane Technologists 7, 331–335.
Cullen RN (1986) The influence of shredder design
on cane preparation. Proceedings of the International
Society of Sugar Cane Technologists 19, 831–838.
Cullen RN, McGinn JA (1974) Shredder performance
and its effect on milling. Technical Report No. 124,
Sugar Research Institute.
Dixon TF, Plaza F, Mann AP (2000) Prevention of
airheater corrosion. Proceedings of the Australian
Society of Sugar Cane Technologists 22, 491–497.
Downing CM, Loughran JG, Domanti SA (1999)
Parameter estimation for highly deformable porous
media. APCOM’99, 4th Asian Pacific Conference
onin Computational Mechanics, 15–17 Dec 1999,
Singapore, pp. 923–928.
Goniva C, Kloss C, Hager A, Pirker S (2010) An Open
Computer modelling in particular processes has delivered some significant gains to the Australian sugar industry.

International Sugar Journal | ISJ's World Sugar Outlook 201566 67www.internationalsugarjournal.com
Source CFD-DEM Perspective., Proceedings of the 5th
OpenFOAM (R) Workshop, 21–24 June, Gothenburg,
Sweden.
Goodwin S, Debus K (2013) Numerical simulation:
Enabling continuous manufacture in the pharmaceutical
industry. What’s new in process technology
http://www.ProcessOnline.com.au (accessed
December 2013).
Harris JA, Robinson JA, Vigh S. (1995). Mathematical
modelling of flow and heat transfer in a vertical
crystalliser. Proceedings of the Australian Society of
Sugar Cane Technologists 17, 216–221.
Hobson PA (1995) Modelling interaction between
cane particles during high pour rate pneumatic cane
cleaning. Proceedings of the Australian Society of
Sugar Cane Technologists 17, 61–69.
Hobson PA (1996) Wind tunnel validation of a model
for high pour rate pneumatic cane cleaning systems.
Proceedings of the Australian Society of Sugar Cane
Technologists 18, 286–291.
Hodgson MCJ, Keast WJ (1984) Rotary drier flight
design. Proceedings of the Australian Society of Sugar
Cane Technologists 6, 211–218.
Hutton K, Stephens DW, Livk I (2011) Implementation
of the Quadrature Method of Moments in a 3D CFD
pipe geometry for gibbsite precipitation. Proceedings
of the 8th International Conference on CFD in Oil and
Gas, Metallurgical and Process Industries, Trondheim,
Norway, 21–23 June.
Ingram GD, Steindl RJ, Doolan CJ (1998) Computational
modelling of evaporator fluid flow. Proceedings of the
Australian Society of Sugar Cane Technologists 20,
550–568.
Joyce KN, Edwards BP (1994) Modelling of trajectories
in pneumatic cane cleaning. Proceedings of the
Australian Society of Sugar Cane Technologists 16,
257–263.
Kent GA (2003) Increasing the capacity of Australian
raw sugar factory milling units. PhD Thesis, James
Cook University of North Queensland, Townsville.
Kent GA (2004) Predicting mill speed. Proceedings of
the Australian Society of Sugar Cane Technologists 26,
(electronic format) 10 pp.
Kent GA (2013) Developing schedules for mixed rail
and road cane transport systems. Proceedings of the
Australian Society of Sugar Cane Technologists, 35,
(electronic format) 8 pp.
Kloss C, Goniva C, Amberger S, Hager A, Aigner
A, Friedl M, Pirker S (2011) Enhancing LAMMPS
cCapabilities –, Granular mModels, cCoding cConcepts,
CAD iInteroperability and cCoupling to cContinuum
mMethods. 2nd LAMMPS Workshop, Albuquerque,
August 2011. www.cfdem.com (accessed December
2013).
Lee A, Sheehan ME, Schneider PA (2004) Solids
transport in rotary sugar dryers. Proceedings of the
Australian Society of Sugar Cane Technologists, 26,
(electronic format) 7 pp.
Leitch CJ (1996) An experimental investigation into
the constitutive behaviour of prepared sugar cane,
M.Eng.Sc. Thesis, James Cook University of North
Queensland, Townsville.
Letizia RI, McDougall EE (1988) The performance of
a cane shredder fitted with feed rolls. Proceedings of
the Australian Society of Sugar Cane Technologists 10,
299–306.
Loughran JG, Anderson SI, Camuglia J, Trapp N (2005)
Enhancing the life of shredder hammer tungsten carbide
tips. Proceedings of the Australian Society of Sugar
Cane Technologists 27, (electronic format) 10 pp.
McBain GD, Harris, JA, Miller, KF, Vigh, SN (2002)
Temperature distribution in a vertical cooling crystalliser.
Proceedings of the Australian Society of Sugar Cane
Technologists 24, (electronic format) 7 pp.
McWhinney W, Penridge LK (1991) ACTSS—Animated
cane transport scheduling system. ACADS/AITPM
Seminar on Transport Simulation Systems, 8 pp.
Pennisi SN, Liow J-L, Schneider PA (2004) CFD model
development for a final effect evaporator. Proceedings
of the Australian Society of Sugar Cane Technologists,
26, (electronic format) 14 pp.
Pinkney AJ (2012) Real-Time cane transport scheduling.
Proceedings of the Australian Society of Sugar Cane
Technologists, 34, (electronic format) 6 pp.
Pinkney AJ, Everitt PG (1997) Towards an integrated
cane transport scheduling system. Proceedings of the
Australian Society of Sugar Cane Technologists 19,
420–425.
Plaza F (2002) Measuring, modelling and understanding
the mechanical behaviour of bagasse. PhD Thesis,
University of Southern Queensland, Toowoomba.
Plaza F (2013) Determining the material properties for
heavily over-consolidated bagasse through parameter
estimation. Proceedings of the International Society of
Sugar Cane Technologists 28, (electronic format) 9 pp.
Plaza F, Dixon, TF, Dickinson, NL, Fitzmaurice, AL,
Owens, M (1999) Performance of baffled boilers with
redesigned convection banks. Proceedings of the
Australian Society of Sugar Cane Technologists 21,
432–437.
Rackemann DW, Broadfoot R, Stephens DW (2006a)
Improved modelling of natural circulation vacuum pans.
Proceedings of the Australian Society of Sugar Cane
Technologists 28, (electronic format) 12 pp462–473.
Rackemann DW, Plaza F, Stephens DW (2006b)
Steam side calandria modelling of vacuum pans and
evaporators Proceedings of the Australian Society of
Sugar Cane Technologists 28, (electronic format) 13
pp483–495.
Rouillard EEA (1985) A study of boiling parameters
under conditions of laminar non-Newtonian flow with
particular reference to massecuite boiling. PhD Thesis,
University of Natal, South Africa.
Santarossa LG, Anderson SI (2013) Shredder
improvements. Proceedings of the Australian Society of
Sugar Cane Technologists 35, (electronic format) 16 pp.
Review and future options for computer modelling in the sugar industry

International Sugar Journal | ISJ's World Sugar Outlook 201566 67www.internationalsugarjournal.com
Schembri MG (1998) A detailed investigation into the
comminution of sugar cane. PhD Thesis, University of
Southern Queensland, Toowoomba.
Schembri MG (2004) Improving the understanding of
cane preparation by measuring the progress of power
usage and cane size reduction through the shredder.
Proceedings of the Australian Society of Sugar Cane
Technologists 26, (electronic format) 13 pp.
Schembri MG, Harris HD (1996) Measuring the
preparation of sugar cane under single impact loading.
Proceedings of the Australian Society of Sugar Cane
Technologists 18, 242–248.
Schembri MG, Harris HD (1998) Examining the
effectiveness of smashing cane by impact loading in the
shredder, Proceedings of the Australian Society of Sugar
Cane Technologists 20, 340–348.
Schembri MG, Hobson PA (2000) Cane cleaning using a
horizontal blower system. Proceedings of the Australian
Society of Sugar Cane Technologists 22, 98–103.
Schembri MG, Hobson, PA, Paddock R (2002) The
development of a prototype factory-based trash
separation plant. Proceedings of the Australian Society
of Sugar Cane Technologists 24, (electronic format) 10
pp12–18.
Schembri MG, Kirby JM, Kent GA (1998) Describing
the mechanical behaviour of prepared cane using
critical state theory. Proceedings of the Australian
Society of Sugar Cane Technologists 20, 313–319.
Schinkel AL, Tait PJ (1994) Guidelines for better sugar
dryer operation. Proceedings of the Australian Society
of Sugar Cane Technologists 16, 299–306.
Shardlow PJ, Wright PG, Watson LJ (1996) Sugar drier
modelling and control. Proceedings of the Australian
Society of Sugar Cane Technologists 15, 368–375.
Shepherd EE, James RA (1972) Computer-assisted
scheduling for cane railway systems. Proceedings of
the Queensland Society of Sugar Cane Technologists,
39, 333–341.
Sima MA, Harris JA (1997) Modelling of a low grade
vertical cooling crystalliser using computational fluid
dynamics. Proceedings of the Australian Society of
Sugar Cane Technologists 19, 448–455.
Sima MA, Harris JA (1999) Numerical modelling of
flow in a vertical cooling crystalliser. Journal of Fluids
Engineering 121(1), 148–154.
Steindl RJ (2003) Improved Roberts evaporator
performance through circulation modelling with CFD.
Proceedings of the Australian Society of Sugar Cane
Technologists, 25, (electronic format) 14 pp.
Steindl RJ, Fitzmaurice, AL, Alman CW (1998) Recent
developments in clarifier design. Proceedings of the
Australian Society of Sugar Cane Technologists 20,
477–483.
Steindl RJ, Sheehan M, Cameron IT (1994) A material
transport model for rotary drum sugar dryers.
Proceedings of the Australian Society of Sugar Cane
Technologists 16, 287–294.
Stephens DW (2001) Modelling natural circulation
in batch vacuum pans., PhD thesis, James Cook
University, Townsville.
Stephens DW, Harris JA (2002) Prediction of
evaporation, pressure driving force, and heat transfer in
calandria tubes. Proceedings of the Australian Society
of Sugar Cane Technologists 24, 431–436.
Watson LJ (1987) Heat transfer mechanisms in
evaporators. Proceedings of the Australian Society of
Sugar Cane Technologists 9, 221–227.
Wood DM (1990) ‘Soil behaviour and critical state soil
mechanics’. (Cambridge University Press: UK).
Wright PG (1966) Circulation movements in sugar
vacuum pans. Proceedings of the Queensland Society
of Sugar Cane Technologists 33, 179–184.
Wright PG, Silva T.A, Pennisi SN (2003) The SRI
evaporator – a new Roberts design. Proceedings of
the Australian Society of Sugar Cane Technologists 25,
(electronic format) 11 pp.
Xie YW, White ET (1997) The drying of sugar crystals.
Proceedings of the Australian Society of Sugar Cane
Technologists 19, 493–501.
Zhao SY (1993) Finite element solution of saturated-
unsaturated porous materials with application
to the rolling of prepared sugar cane. PhD Thesis,
University of Wales, United Kingdom.

International Sugar Journal | ISJ's World Sugar Outlook 201568 69www.internationalsugarjournal.com
New build projects in the global sugar sector over July 2013 to August 2014
Introduction
While the sugar industry has been grappling with the bearish price pressure over the past three years, investment in building new sugar factories, refineries and expanding capacity has been keen in some geographical regions. What follows is basically snapshot of projects reported in the global media over past year. It has to be stressed though, very rarely is there a full disclosure in terms of investment, factory capacity, agricultural production and investors.
It should be apparent from the tabulated information that:• The greatest investment is in the cane sugar
sector• Geographically, Africa has received the lion’s
share of interest investment wise, and• With the exception of Egypt, expansion in the
beet sugar sector is pretty minimal
Arvind Chudasama
International Sugar Journal, IBI, Christchurch Court, 10-15 Newgate Street, London, EC1A 7HD, UK Email: [email protected]

International Sugar Journal | ISJ's World Sugar Outlook 201568 69www.internationalsugarjournal.com
ASIA
Where Investment Factory/refinery capacity Agricultural Production
Indonesia, Blora US$151.8 million 6000 t cane/day (tcd) 20,000 cane growers supply to the mill
Comments The factory opened on 4th June 2014. It is owned by PT Gendhis Multi Manis (GMM). Profit sharing split is 70 (farmers): 30 (mill).
Thailand, Nakhon Rachasima province
US$ 133.3 million Capacity expansion from 12,000 tcd to 35,000 tcdEthanol plant – 200,000 litres/day
Comments Factory owned by Khonburi Sugar (KS). Projects financed from loans (2.9 billion baht). The rest coming from KS. Investment spread over two years for the new build.
Philippines, Manjuyod, Negros Oriental province
US$ 35 million 30 million litres/year cane ethanol plant
Comments Universal Robina Corp, major ethanol producer in the country is the investor. Feedstock will be blackstrap molasses.
Malaysia, Johor US$250 mln-270 mln 2 mln tonnes
Comments Joint venture between MSM Malaysia Holdings (51%) and Al Khaleej International (49%) for sugar refinery build. The refinery is expected to come online in 2016.
Nepal, Himal Sugar Mills Ltd.,Chandra Ayodhyapur VDC, Siraha district
US$20.39 mln 2500 tcd The mill has given US$25.5 per bigha (2603.7 m2) to 45,000 farmers to incentivise them to grow cane
Comments Scheduled to come online April 2014.
India, Chhattisgarh, Kabirdham district
U$ 24,521,900 25,000 t sugar
Comments State government initiative involving some 20,000 farmers who will contribute to share capital of Rs 100,000,000 (U$ 1,634,690).
Laos/Vietnam
Comments Vietnamese producer Hoang Anh Gia Lai Group plans to invest US$1.2 billion in planting maize, sugar cane, rubber and oil palm trees in Laos, Vietnam.
AFRICA
Sudan, Port Sudan 450,000
Comments Sugar refinery scheduled to come online in 2014.
Mashkour sugar mill, White Nile
Comments India gave a loan of US$125 mln for the project.
Al-Jazirah State and Abu-Qutah area
Euros 670 mln (US$894.3 mln)
90,000 t white sugar (Abu-Qutah) At Abu- Qutah, 200,000 acres (89,371 ha) allocated for sugar and fodder crops and animal production. At Al-Jazirah, 620,000 acres (250,905 ha) devoted to agriculture.
Comments Factories to be built in both locations with Italy’s MID group. Not clear if there will be more than two.
Sennar State 500,000 t sugar 205,000 acres (82,960 ha) allocated for cane
Comments Sennar State government signed a Memorandum of Understanding (MoU) with an Algerian company for the project.
Ghana US$250 mln 100,000
Comments Investor is the A Mauritius sugarcane firm Omnicane. Factory will be located in Northern Ghana.
Komenda sugar factory, Central region
US$59 mln 1250 tcd
Comments Ghana’s government has secured a US$35 million loan from the Indian government to revive the Komenda sugar factory. It has also secured a US$24 million loan for irrigation for the cultivation of sugar cane on a 1500 acres (607 ha). The sugar plant will be constructed by SEFTECH India PVT. Limited. Cogen unit will sell up to 1 MW to the public grid.
Savelugu (northern Ghana)

International Sugar Journal | ISJ's World Sugar Outlook 201570 71www.internationalsugarjournal.com
Comments The Ministry of Trade and Industry has signed a MoU with Japan's Marubeni Corporation on the establishment of a sugar mill at Savelugu. The complex will cover between 10,000 and 30,000 ha and comprises a cane plantation as well as a sugar mill.
Kenya, Busia Sugar, Busibwabo area in Matayos Constituency
USS$41.4 mln 3000 tcd 4000 cane farmers contracted to supply from their holdings totaling 8,000 acres (3237.5 ha). The factory is targeting 30,000 farmers with an estimated acreage of 67,000 (27,114 ha)
Comments The factory is expected to create 500 direct jobs.
Kakamega county US$0.74 million
Comments EU funds road improvement to Mumias sugar factory for gravelling of a 20 km road. Poor roads to the factory have have been costly for the cane growers.
South Mugirango constituency US$27.6 million
Comments The Kisii government in partnership with a foreign investor (?) making the investment. Rhe factory will create 600 jobs.
Trans Mara, Narok County US$24.3 million
Comments A Brazilian investor has pledge to establish the factory.
Lolgorian, Trans Mara US$115.6 million
Comments The Narok county government has signed the construction deal with Bajarambapu Group of Companies from India along with MoU.
Kwale county 3000 tcd Cane supply from 1,200 registered outgrowers (3,200 ha). KISCOL plans to have 5,500 ha under cane.
Comments Scheduled to come online in June 2014. Subsurface drip irrigation system will reduce water need by 40% for the company.
Nigeria US$2.57 bln
Comments • Dangote to invest $2 bln on projects in 6 states to produce about 1.5 million tonnes sugar and expand its Savannah Sugar Numan from current 6,500 hectare (ha) to 21,000 ha by 2018 to produce 100,000 tonnes sugar annually• HoneyGold Group is to invest $300 million on two sites in Adamawa state to produce 200,000 tonnes sugar annually• Crystal Sugar Mills is spending $30 million to expand its operations to produce 60,000 tonnes sugar/annum by 2018 from its recently acquired 1,500 TCD Sugar plant at Hadejia, Jigawa state• Confluence Sugar Coy is investing $240million in Kogi State to produce 200,000 tonnes sugar/annum on about 37,000 ha of land at Ibaji
Jigawa sugar mill, Kaugama, Jigawa state
US$250 mln 150,000 t sugar 20,000 ha for cane
Comments Investor is Dangote. The project will create 10,000 jobs at sugarcane farm, and 5,200 for the plant. Seasonal jobs are expected to be 8,000. Planned cogen unit will generate 60MW.
Port Harcourt, Rivers State
Comments BUA Sugar Refinery will open its second sugar refinery next year.
Kogi State 1 mln t sugar
Comments BUA has acquired 100,000 ha of land cane production. Factory plans to process 10 mln tonnes of cane into 1 mln tonnes of sugar annually.
Tanzania, Bagamoyo US$602.2 mln 130,000 t sugar + 10,000 litres fuel ethanol daily
Comments The Tanzanian government launched the joint Agro EcoEnergy sugar project. African Development Bank will issue TZS 850 billion (US$521.6 million) loans. The remaining TZS150 billion will be from the government. Plant scheduled to come online in 2016/17.
Ethiopia
Comments Seven new sugar factories to start production by end of 2015. These are Tendaho- 1 and 2, Omo-Kuraz-1, Kesem, two of the Tana Beles factories and Arjo- Dedesa. Once operational, this will boost the country's sugar production capacity to 1.58 million tons.
Ethiopia US$2.5 bln
New build projects in the global sugar sector over July 2013 to August 2014

International Sugar Journal | ISJ's World Sugar Outlook 201570 71www.internationalsugarjournal.com
Comments Chinese government to finance construction of five sugar mills in Afar, Tigray and South Ethiopia.
South Omo Zone 12,000 tcd 5000 ha cane plantation
Comments Last reports indicated Omo-Kuraz sugar mill is 80% complete. Chinese Construction Company Limited (CCCC) tasked to build roads to factory as well as a bridge over the Omo River.
Tendaho sugar mill, Afar region
13,000 tcd (first stage)26,000 tcd (final stage)619,000 t sugar
Comments Plant scheduled to be operational in April 2014. Cogen unit has 120 MW capacity. Ethanol plant expected to produce 55.4 mln litres.
Amhara Regional State US$111 mln 4400 tcd 6183 ha
Comments Hiber Sugar Share Company is the only private venture planned for the country’s sugar sector.
Tigrai Regional State US$100 mln 484,000 t sugar 20,827 m3 ethanol 45,000 ha cane
Comments With funding from Israeli banks, Israeli construction company, Natifa financing the Wolkayit Sugar development project planned by the Ethiopian Government.
Angola, Cacuso municipality, northern Malanje province
260,000 t sugar
Comments The Angolan Bioenergy Company (Biocom) will start operations in September 2014. The plant is 92% complete. Its cogen unit has the capacity to produce 28 MW. Ethanol plant has the capacity for 30 mln litres. BIOCOM project is integrated in Agro- Industrial Park of Capanda and it is a partnership between the Angolan state, through the National Private Investment Agency (ANIP) and Sonangol Holding, with a share of 20%, Angolan Damer company and the Brazilian Odebrecht firm, both with 40% each.
Angola 315,00 t sugar 75,000 ha
Comments Japanese trading house Marubeni Corporation is investing in the project which includes production of 30 mln litres ethanol.
South Africa, KwaZulu Natal US$111 mln 1.5 mln cubic m3 ethanol 15,000 ha cane
Comments Silvapen Group, the South African - Brazilian company is planning to build the plant in Jozini. Cane juice is the feedstock. 94 MW cogen unit is planned – 84 MW will be sold to national grid.
Swaziland, Lubombo region US$265.3 million
Comments The project concept and pre-feasibility study for the Nsoko-Msele Integrated Sugar Mill Project were carried out in 2011 and 2012. Works are scheduled to begin in mid-2014 and is expected to come online in April 2017. Mauritius-based Alteo Group is the chosen strategic partner for the project. The sugar, ethanol and cogen project is expected to generate 6450 new jobs.
Mozambique, Zambezia Province
US$300 million 15,000 ha (first phase)
Comments Companhia do Sena plans rebuild a new factory on the site of the mill that produced sugar 3 decades ago. The project is due to begin in 2015
Zambia US$300 mln (?)
Comments Germany's second-largest sugar refiner Nordzucker is planning to build a sugar refinery in Zambia.
Malawi, Salima US$30 million
Comments Two new sugar factories, funded by the Indian government, expected to come online by 2016.
Algeria, Grande Raffinerie Dahmani
350,000-700,000 t refined sugar
Comments The joint venture between Algerian food manufacturer LaBelle (65%) and France's Cristal Union (35%) that commenced in 2010 and held up due to various problems is set to come online in second half of 2014.
Egypt, Delta Sugar’s Al Hamoul factory
US$ 28 million Capacity expansion from 15,000 to 17,500 t sugar/day
Comments Forty percent financed by the company and the rest will come shareholders’ funds
Al Sharqiya Governorate US$ 372 mln 500,000 t beet sugar

International Sugar Journal | ISJ's World Sugar Outlook 201572 73www.internationalsugarjournal.com
Comments The plant, scheduled to be operational in 2016, will co-refine raw sugar following beet campaign. Al Nouran Group have secured financing for the project, which is coming from a consortium of banks in Egypt, the U.A.E., Lebanon and elsewhere, in particular Banque Misr, Bank Audi, and Abu Dhabi Islamic Bank, while a Shariah-compliant mezzanine financing and working capital package worth $271 million is from the Saudi-based multilateral Islamic Corporation for Development and the Kuwait-based Arab Fund for Economic and Social Development.
Cairo- Alexandria Road/Aswan
Comments • Saudi Arabian food firm Savola is conducting a feasibility study to establish a new 250,000 t sugar plant.• Sugar Integrated Industries Company has also agreed with an Emirate company to build a 250,000mt sugar plant in Aswan at an estimated investment cost of EGP5 billion (US$699 mln).
LATIN AMERICA + WEST INDIES
Cuba US$2.2 mln/plant
Comments State-run AZCUBA plans to implement 765 MW of co-generation power in 19 plants from 2015 to 2030.
Nicaragua, Montelimar mill US$38 mln Expand capacity from 2300 to 4100 tcd and sugar production from 33,000 to 67,000 y
Comments Project funded through World Bank loan of US$ 15 mln. There will also be investment in irrigation, harvesting and transportation equipment plus other infrastructure in the field. 1300 new jobs will be generated.
Peru, La Libertad province
Comments Casa Grande sugar refinery complex was originally scheduled to be completed 1-1/2-years ago, but construction was delayed due to political reasons out of the company's influence.
Dominican Republic
Comments Bagasse based San Pedro Bio Energy cogen unit has 30 MW capacity. The Cristóbal Colón mill will use 10 MW and the rest will be exported to the grid. The plant is expected to be operational by September 2015.
Jamaica US$200 mln
Comments Chinese company Pan-Caribbean Limited, operators of the Monymusk and Frome sugar factories plant to modernise the two plants. The investment includes some US$40 mln to 50 mln in agriculture production at Monymusk.
AUSTRALIA
Australia, Queensland, near Ingham
US$535 mln 330,000 t sugar100 MW cogen unit90,000 to 200,000 litres ethanol/day
Comments China's Nanning Good Fortune Heavy Industries Co Ltd is one of the major investors.
Queensland, MSF Sugar U$41 million
Comments Money will be spent increasing capacity at South Johnstone mill and modernising factories at Mulgrave Central (Gordonvale) and Atherton Tableland.
BRAZIL
Guarani US$328 mln Expanding milling capacity from 21 mln to 23 mln t
Comments Tereos International’s unit upgrade is scheduled to be completed in 2015/16.
n-butanol plant US$250 mln (?) 100,000 t
Comments The Brazilian biotech company GranBio and the Belgium company Rhodia are partnering to produce bio n-butanol from sugarcane crop residues and bagasse. It is expected to be operational by 2015.
FORMER USSR
Belarus, Grodno region US$100 mln
Comments Fifth sugar factory in the country with the participation of French investors.
Russia (Sucden) US$100 mln
Comments The investment will be used to expand capacity of two of its three Russian plants and buy more land. The company was to 600,000 tonnes of beet sugar in 2017/18 from the current 475,000 tonnes.
Uzbekistan, Tashkent 1000 t refined sugar
Comments Refinery expected to come online in the third quarter of 2014.
New build projects in the global sugar sector over July 2013 to August 2014

International Sugar Journal | ISJ's World Sugar Outlook 201572 73www.internationalsugarjournal.com
For over 30 years Veco has been producing high-quality electroformed screens for continuous centrifuges. This experiencewas used to develop a sugar screen with superior characteristics: VecoFlux. Featuring all the benefi ts of our standard screens, such as conical holes to reduce blinding and clogging, the thicker VecoFlux screen has a much higher open area for more throughputand is available with smaller slots for capturing even the tiniest sugar crystals. www.vecoprecision.com
VecoFlux screen. Maximize separation, optimize throughput.
Continuous centrifuge screens
A member of SPGPrints Group
Veco ad 182x130.indd 1 28-10-13 16:43

International Sugar Journal | ISJ's World Sugar Outlook 201574 75www.internationalsugarjournal.com
Intense sweeteners: Diversity prevailsLindsay Jolly
International Sugar Organization, 1 Canada Square, London E14 5AA, UK Email: [email protected] Tel: + 44 20 7513 1144
Introduction
Over the past 12 months the fortunes of the different high intensity sweeteners (HIS) have been mixed and differ widely. The global market for HIS is reportedly growing, with plant-derived stevia sweeteners providing the fastest growth. According to market researchers Mintel and Leatherhead1 in a report released early this year, the proportion of new products containing HIS rose from 3.5% of all food and drink launches in 2009 to 5.5% in 2012. Their assertion is that this
trend is set to continue, with much of the growth in the global HIS market driven by consumer concerns over sugar intake. At the same time there appears to be consumer wariness about artificial sweeteners, creating strong interest in "natural" plant derived intensive sweeteners. Even so, the author notes that food and beverage manufactures will continue to use artificial HIS due to lower cost and in many applications artificial HIS still provide a better taste than the natural HIS available on the market.
Also according to that report, of those products that used HIS, just 5% contained solely plant-derived sweeteners such as stevia in 2009, and a further 2% used a blend of artificial and plant-derived sweeteners. In 2013, products sweetened with plant-derived sweeteners alone had surged to 15% of the total, with a further 3% containing a blend of both artificial and plant-derived sweeteners. Between 2011 and 2013, plant-derived sweeteners reached a high of 28% of launches in North America.
Stevia's market share in value terms remains relatively small compared with that of other sweeteners, at just 8% of the total intense sweeteners market globally. Artificial sweeteners, such as acesulfame-K, sucralose and aspartame are still dominant in the market (figure 1). Due to its use in blends, acesulfame K leads in launch activity, however, the share of products using the sweetener has gradually declined from 56% in 2009 to 49% of launches in 2013. Sucralose takes the second spot and its use has remained constant over the past five years, found in around 40% of all products launched with an intense sweetener. Aspartame
Figure 1.
Upon reviewing several sources within the public domain, the author estimates that on a sugar equivalent basis, consumption of HIS rose by almost 4% in 2012 to around 18.4 mln tonnes white sugar equivalent (wse), whereas in the same year consumption of high fructose syrup was static at around 13.7 mln tonnes but consumption of sugar also rose by 4% to around 154 mln tonnes wse. HIS therefore accounted for an estimated 10% of the global sweeteners market (on a sugar equivalent basis, figure 2).
Figure 2.
Figure 1. Indicative consumption of HIS 2012 - white sugar eqivalent

International Sugar Journal | ISJ's World Sugar Outlook 201574 75www.internationalsugarjournal.com
comes in next, however, its share is consistently dropping year on year, going from being used in 40% of 2009 launches to 32% of 2013 launches. Categories still heavily reliant on artificial sweeteners include sugar confectionery, desserts and ice cream, dairy products and carbonated soft drinks.
Upon reviewing several sources within the public domain, the author estimates that on a sugar equivalent basis, consumption of HIS rose by almost 4% in 2012 to around 18.4 mln tonnes white sugar equivalent (wse), whereas in the same year consumption of high fructose syrup was static at around 13.7 mln tonnes but consumption of sugar also rose by 4% to around 154 mln tonnes wse. HIS therefore accounted for an estimated 10% of the global sweeteners market (on a sugar equivalent basis, figure 2).
Stevia
Stevia sweeteners (particularly Rebaudioside A - Reb A) have continued to gain regulatory approval around the world and are now used in Canada, India, South Africa, Thailand and Indonesia amongst other countries. This follows EU approval in 2011 and US approval in December 2008. Furthermore, with improved taste, increased consumer "buy-in" for natural plant-derived intense sweeteners, stevia has been gaining traction with consumers. In doing so, stevia sweeteners are upsetting the traditional "pecking order" of more established sweeteners.
Data from Mintel (a global market research company) shows that the European Union accounted for 40% of all new stevia-containing foods and drinks around the world in 2013. Upon approval in November 2011 multinational companies were able to take advantage of several years of product development in the United States in particular, where stevia extracts were approved for use in 2008.
In the US, Dr Pepper Snapple (DPS) announced early this year that it was set to trial stevia-sweetened versions of its flagship sodas Dr Pepper, 7-UP and Canada Dry in the US this year. DPS earlier reported net sales were down 1% year-on-year for Q4 ending December 2013, noting that carbonated soft drink (CSD) sales declines - for diet varieties in particular - reflecting consumer wariness of artificial sweeteners.
DPS is striving to boost CSD demand by testing stevia and sugar-sweetened versions of its flagship brands. Dr Pepper is the first of the US soda 'Big Three' - along with PepsiCo and Coke - to trial stevia in its US brands; but last
year Coke launched Coca-Cola Life in Argentina.
Cargill launches new age of stevia sweeteners
In May 2013 Cargill launched a new range of stevia-based sweeteners - ViaTech - which the company claimed opened up new territory for food and beverage formulators. The new sweeteners range enables sugar use to be cut by 75% - and in some cases 100% - without compromising taste. The company noted in a press release that during the past couple of years, many 'next-generation' stevia-based sweeteners have been launched promising to tackle the lingering bitter and liquorice notes that creep in as stevia is added and sugar is reduced. Typically, once sugar content is reduced by over 50%, these "off notes" become more pronounced, having in the past been addressed using flavour modifiers and bitter blockers.
PureCirlce commercialising Reb D and Reb X
Meanwhile, on the production side the two leading producers of stevia sweeteners - PureCircle and GLG Lifetech - have reportedly production capacity in excess of market demand for Reb A. Another producer is Sweet Greenfields (SG) in the United States. Late in 2013, leading stevia supplier PureCircle said it is ready to commercialise its two next generation
Stevia
Stevia sweeteners (particularly Rebaudioside A - Reb A) have continued to gain regulatory approval around the world and are now used in Canada, India, South Africa, Thailand and Indonesia amongst other countries. This follows EU approval in 2011 and US approval in December 2008. Furthermore, with improved taste, increased consumer "buy-in" for natural plant-derived intense sweeteners, stevia has been gaining traction with consumers. In doing so, stevia sweeteners are upsetting the traditional "pecking order" of more established sweeteners.
Data from Mintel (a global market research company) shows that the European Union accounted for 40% of all new stevia-containing foods and drinks around the world in 2013. Upon approval in November 2011 multinational companies were able to take advantage of several years of product development in the United States in particular, where stevia extracts were approved for use in 2008.
In the US, Dr Pepper Snapple (DPS) announced early this year that it was set to trial stevia-sweetened versions of its flagship sodas Dr Pepper, 7-UP and Canada Dry in the US this year. DPS earlier reported net sales were down 1% year-on-year for Q4 ending December 2013, noting that carbonated soft drink (CSD) sales declines - for diet varieties in particular - reflecting consumer wariness of artificial sweeteners.
DPS is striving to boost CSD demand by testing stevia and sugar-sweetened versions of its flagship brands. Dr Pepper is the first of the US soda 'Big Three' - along with PepsiCo and Coke - to trial stevia in its US brands; but last year Coke launched Coca-Cola Life in Argentina.
Figure 2. Global sweetener market shares - 2012

International Sugar Journal | ISJ's World Sugar Outlook 201576 77www.internationalsugarjournal.com
stevia products - Reb D and Reb X - in 2014. Reb D is claimed to have one of the best sweetness profiles of any steviol glycoside while Reb X has been jointly developed with Coca-Cola.
The FDA issued a 'No Objection' letter to PureCircle's GRAS determination for Reb D in July last year while its GRAS determination for Reb X has also been formally submitted to the FDA. PureCircle received approval for Reb X in January 2014.
According to market analysts, Reb D approval was likely to have a significant effect on the US CSD market since both PepsiCo and the Coca-Cola are PureCircle clients, and are likely to consider launches using the new stevia ingredient. PepsiCo has a stevia supply agreement with PureCircle running until June 2014.
PureCircle said that it was preparing for immediate commercialisation of ≥95% Reb D. The company also admits that it is likely that Reb D will not be used as the sole sweetener in all products because it will be priced higher than other high purity steviol glycosides and will likely be blended to attain desired flavour profiles.
In terms of new markets, PureCircle is expanding its presence in Latin America with a new facility in Mexico City. According to Mintel more than 100 stevia-sweetened products have been launched in Latin America in the past year. GLG Life Tech resumes trading
Mid 2013 GLG Life Tech - the globe's other key supplier of stevia sweeteners - resumed trading on the Toronto Stock Exchange (TSX). GLG's stock price plummeted in 2011 after the company reported a sharp drop in sales and revealed they had renegotiated their 10-year supply agreement with Cargill, such that it would no longer be obliged to purchase 80% of its stevia supply from GLG. The company considers its deal with COFCO (China National Cereals, Oils, and Foodstuffs Corporation) - China's largest food company - as a game changer. GLG is now COFCO's preferred supplier of stevia ingredients and technologies and the two are working together to develop new zero or reduced sugar products.
Fermentation stevia technology makes gains
One of the constraints to the expansions of stevia sweeteners is their manufacturing costs. The cost of producing stevia sweeteners from leaves is formidable due to high extraction costs as well as the land, agricultural and capital investment requirements. For this reason in
March 2013 Swiss firm Evolva Holding partnered with Cargill to develop and commercialise stevia extracts derived from a fermentation process, rather than through traditional extraction.Evolva has been working on the technology for the past several years, to produce commercially viable sweeteners that are molecularly identical to stevia extracts, but without relying on the cultivation, processing and refining of stevia plants. It claims that the fermentation process will allow it to select and produce specific steviol glycosides - the components responsible for stevia's sweet taste. Its fermentation technology uses low-cost, sustainable carbohydrate feedstock.
Interestingly, a small biotechnology company, Stevia First Corp. (STVF), has also been developing a microbial fermentation method it licensed from Vineland Research and Innovation Centre of Ontario, Canada, for producing high quality stevia.
Presently, stevia is considerably more expensive to make than synthetic or artificial sweeteners. Both Cargill (with Evolva) and STVFare attempting to boost the commercial feasibility of stevia as a natural zero calorie sugar substitute, by lowering its production cost by as much as 70% while securing a constant supply line. However, it is not only cost. An enhanced product quality could possibly see stevia sweeteners overtake artificial sweeteners such as aspartame or sucralose.
STVF is still in its development stage. It has yet to bring its product to market and losses are likely to build further as the company develops its product. However there is the possibility of a similar agreement between STVF and a possible partner in a major food or Beverage Company should the fermentation process prove viable.
In November 2013 there were reports that the pace of progress on the joint development program of Cargill and Evolva was exceeding initial expectations. This was followed by an announcement in May 2014 that Cargill and Evolva had achieved a major technical milestone in their joint development program of fermentation-based minor steviol glycosides. As a result of the achievement Cargill was to make a $1 mln milestone payment to Evolva.
Sucralose
Whilst Tate & Lyle (T&L) remains the world's largest sucralose supplier, Chinese producers are ramping up production further, providing fierce competition. Chinese high intensity sweeteners specialist Niutang Chemical reportedly started its new 1,200 tonne capacity sucralose facility during March 2013, with deliveries beginning in
One of the constraints to the expansions of stevia sweeteners is their manufacturing costs.
Intense sweeteners: Diversity prevails

International Sugar Journal | ISJ's World Sugar Outlook 201576 77www.internationalsugarjournal.com
the second quarter of 2013. This is the company's fourth expansion in five years. The new facility includes new technologies, automation and process improvement steps to ensure the company manages overall production costs. Niutang is one of several Chinese manufacturers cleared of infringing market leader Tate & Lyle's sucralose production patents in 2009, along with JK Sucralose.
JK Sucralose - the world's second largest producer of sucralose - was confident its sales of the sweetener would grow by 50% in 2013 as new capacity comes online and demand for zero or reduced sugar products continues to increase. The company launched micronised sucralose and liquid sucralose in 2013. Production capacity at its facility in China's Jiangsu Province is set to grow over the next five years. Its annual capacity is currently 1,500 tonnes, but this will increase to 1,800 tonnes by the end of year. The company's target in 2015 is 3,500 to 4,000 tonnes and 6,000 tonnes by 2018.
Late in 2013, sucralose prices out of China were reported to have fallen by 25% since their peak last year, according to marketers of the sweetener in the United States. While many US firms were struggling to get hold of sucralose from China early last year, the opposite is now true, with buyers reporting a glut of product on the market and a sharp reduction in prices. UniSweet, which is one of the top three players in Chinese sucralose production and has two plants with a combined capacity of more than
500 tonnes, has noted that a lot of additional capacity had come on-stream in the past year. Furthermore, several firms had re-opened or re-located facilities that were previously shut/restricted owing to environmental and regulatory issues in China.
T&L announced early February 2014 that the company had recently renewed a number of customer contracts, some of which are multi-year. These have been completed in a market where the competitive environment has intensified, driven by a significant overhang of unsold Chinese sucralose, T&L said in a press release. With these contracts in place, T&L anticipate the rate of price decline in SPLENDA brand sucralose will increase in the final quarter and given current market dynamics, prices in the 2015 financial year are expected to be around 15% lower than the current financial year. Despite this the company continues to see good long-term opportunities for growth in the market for SPLENDA sucralose, leading to operational efficiencies at their McIntosh facility.
T&L also announced the establishment of a new SPLENDA Alliance with McNeil Nutritionals. The Alliance includes terms for ongoing supply after a supply agreement in 2004 expired in April. The terms of that realignment included the making of annual payments by McNeil to T&L based on McNeil's sales of tabletop products during the 10 years following the realignment. These payments are not a feature of the new Alliance and accordingly, the final such payment
While many US firms were struggling to get hold of sucralose from China early last year, the opposite is now true

will be received in respect of the year ending 31 March 2014 and is expected to amount to approximately $11 mln.
Aspartame
One of the leading producers of aspartame, Ajinomoto, was reportedly fighting to stabilise profitability during 2013 after suffering significant losses during 2012. In Ajinomoto's full-year results announcement, the company admitted that the market situation was deteriorating.
In April this year Ajinomoto announced it would close its Gravelines facility in northern France by end-2014. Gravelines has been supplying the food and drink industry throughout Europe, the Middle East and Africa with AminoSweet Aspartame (made from aspartame and amino acids). Ajinomoto has revealed it will focus its aspartame production activity in Japan.
The biggest market for aspartame is the United States but it is unduly dependent on bulk supply of aspartame, according to the company. Ajinomoto's policy is now to shift from volume and size to value-added business.
Importantly for the chemical sweetener, the European Food Safety Authority (EFSA) completed earlier this year a major review of aspartame's safety, concluding that the sweetener is safe for the general population at current consumption levels. According to EFSA's Panel on Food Additives and Nutrient Sources Added to Foods (ANS Panel), this opinion represents one of the most comprehensive risk assessments of aspartame ever undertaken. The only group for whom EFSA considered aspartame consumption to be risky was for those with phenylketonuria, characterised by an inability to break down the amino acid phenylalanine, which is present in aspartame as well as a wide variety of other foods.
Looking further ahead Ajinomoto has revealed, within the context of a 'Roadmap for Business Structure Improvement', that it hopes to secure US regulatory approval for Monatin in 2015, a naturally occurring sweetener for food and beverage use extracted from South African plant Sclerochiton ilicifolius.
Advantame
Advantame is also produced by Ajinomoto - derived from the same amino acids as Aspartame, but around x100 sweeter. The company has been working to extend regulatory approvals to Southeast Asia, China, South America, Japan and Europe. In November 2013, EFSA concluded that advantame is safe for human
consumption. EFSA noted that the sweetener is stable under normal storage conditions, but that there is some instability in acidic beverages and heat-treated foods. Advantame and its main metabolite were tested in mice, rats, rabbits, dogs and humans, and found to be poorly absorbed by the body. In May 2014, the US FDA approved the sweetener for general use in food and beverages.
According to Ajinomoto, taste panels found that caloric sweeteners in some beverages could be reduced up to 30 or 40% with no difference in perceived flavour and sweetness with the addition of advantame. The ingredient can also be used as a flavour enhancer for ingredients such as dairy, fruit and mint.
The US follows Australia and New Zealand in its approval of advantame as a general purpose sweetener. Advantame is the sixth artificial sweetener to gain FDA approval, joining acesulfame potassium (ace-K), aspartame, saccharin, sucralose and neotame. On 3 June 2014, the European Commission approved advantame.
Looking forward....
2013 saw considerable growth in HIS consumption at the global level as well as a large number of product launches for stevia sweeteners. This is beginning to impact the market fortunes of older-generation HIS. A key driver for the future is the fact that soft drinks account for around 40% of offtake of the mainly older-generation artificial HIS. Stevia has only just recently begun to penetrate this segment. However per person consumption of CSD is stagnating and even declining in some mature markets such as the US. As well as perhaps having to shift market focus to developing countries with strong income growth, beverage companies may also increasingly strive to incorporate naturally-derived HIS. At the same time, in developed countries the longer term outlook for HIS in lower calorie or zero calorie foods and beverages will be positive should consumer concerns over obesity, diabetes and sugar intake swell further.
*The views expressed are those of the author and in no way are those of the ISO secretariat or of any of its member countries.
References
1See http://www.mintel.com/press-centre/food-and-
drink/stevia-set-to-steal-intense-sweetener-market-
share-by-2017-reports-mintel-and-leatherhead-food-
research.
Intense sweeteners: Diversity prevails


Index of advertisers
Babbini SpA 65
Barriquand Technologies Thermiques 13
BMA AG Cover ii
De Smet SA Engineers & Contractors Cover i
Honiron Corp 9
ISJ Subscriptions 78
Keller & Bohacek GmbH & Co 21
Stord International AS 31
Thomas Broadbent & Sons Ltd 77
Veco bv 71
Vogelbusch Biocommodities GmbH 51
JOURNAL
INTERNATIONALsugar 3 easy ways to subscribe...1. To order online please visit www.internationalsugarjournal.com2. Call Priyanka Adhikari on +44 (20) 337 730453. Or email [email protected] for a FREE sample copy
focus: CANE SHREDDERS, CANE CULTIVARS FOR DIFFUSERS, HARVESTING
April 2014 Volume CXVI Issue No. 1384
sugar processing and refining > power and cogeneration > biorenewables > agricultural production
Join ISJ in our Global Sugar Networksugar
JOURNAL
INTERNATIONAL
www.internationalsugarjournal.com
focus: SUGAR REFINING, COGENERATION AND FALLING FILM EVAPORATOR
August 2014 Volume CXVI Issue No. 1388
Join ISJ in our Global Sugar Networksugar
JOURNAL
INTERNATIONAL
www.internationalsugarjournal.com
Sugar PlantSugar Refinery
Bioethanol PlantCogeneration PlantBio-based Industry
FROM BASIC ENGINEERING TO FULL TURNKEY PROJECT
Contact in Argentina: [email protected] www.dscontractors.com.ar
Contact in Brazil: [email protected] www.dsempral.com.br
Single Point Responsibility through EPC or EPCM+® with guaranteed:
Process Performances
Time Schedule
Budget
sugar processing and refining > power and cogeneration > biorenewables > agricultural production
focus: SUGAR BEET AND BEET SUGAR PRODUCTION, DRIP IRRIGATION AND CANE ESTABLISHMENT
June 2014 Volume CXVI Issue No. 1386
sugar processing and refining > power and cogeneration > biorenewables > agricultural production
Join ISJ in our Global Sugar Networksugar
JOURNAL
INTERNATIONAL
www.internationalsugarjournal.com
focus: Biofuels, Boilers and diffusers
March2014 Volume CXVI Issue No. 1383
sugar processing and refining > power and cogeneration > biorenewables > agricultural production
Join ISJ in our Global Sugar Networksugar
JOURNAL
INTERNATIONAL
www.internationalsugarjournal.com
focus: STRECKER DEGRADATION, EXPLOITING KNOWLEDGE, CANE PAYMENT MODELS
November 2014 Volume CXVI Issue No. 1391
Join ISJ in our Global Sugar Networksugar
JOURNAL
INTERNATIONAL
www.internationalsugarjournal.com
sugar processing and refining > power and cogeneration > biorenewables > agricultural production
NEW WEBSITE: COMING SOON
News. Papers. Snapshots. Your complete insight into theSugar industry
To enquire about advertising in ISJ, please [email protected] or call +44 (20) 701 77559
One year subUK £620 Europe €750 Rest of WorldUS $955

2015 EVENTS CALENDARTHE BEST FORUM FOR INTELLIGENCE AND NEW BUSINESS CONNECTIONS
14-16 September 2015
10-12 February 2015 Bangkok, Thailand
23-25 March 2015 São Paulo, Brazil
21-22 May 2015 Seville, Spain
2-5 November 2015 1-3 December 2015
For more information, please contact Sarah Harding at [email protected] or +44 (0)207 017 7566