world population ageing 2015 highlights - united nations · world population ageing 2015 highlights...
TRANSCRIPT

2015
highlights[ ]
World Population Ageing
United Nations

[blank inside cover]

ST/ESA/SER.A/368
Department of Economic and Social Affairs
World Population Ageing
2015
Highlights
asdfUnited Nations New York, 2015

The Department of Economic and Social Affairs of the United Nations Secretariat is a vital interface between global policies in the economic, social and environmental spheres and national action. The Department works in three main interlinked areas: (i) it com-piles, generates and analyses a wide range of economic, social and environmental data and information on which States Members of the United Nations draw to review common problems and take stock of policy options; (ii) it facilitates the negotiations of Member States in many intergovernmental bodies on joint courses of action to address ongoing or emerging global challenges; and (iii) it advises interested Governments on the ways and means of translating policy frameworks developed in United Nations conferences and summits into programmes at the country level and, through technical assistance, helps build national capacities.
The Population Division of the Department of Economic and Social Affairs provides the international community with timely and accessible population data and analysis of pop-ulation trends and development outcomes for all countries and areas of the world. To this end, the Division undertakes regular studies of population size and characteristics and of all three components of population change (fertility, mortality and migration). Founded in 1946, the Population Division provides substantive support on population and develop-ment issues to the United Nations General Assembly, the Economic and Social Council and the Commission on Population and Development. It also leads or participates in various interagency coordination mechanisms of the United Nations system. The work of the Division also contributes to strengthening the capacity of Member States to monitor population trends and to address current and emerging population issues.
NotesThe designations employed in this report and the material presented in it do not imply the expression of any opinions whatsoever on the part of the Secretariat of the United Nations concerning the legal status of any country, territory, city or area or of its authorities, or concerning the delimitation of its frontiers or boundaries.
This report is available in electronic format on the Division’s website at www.unpopula-tion.org. For further information about this report, please contact the Office of the Direc-tor, Population Division, Department of Economic and Social Affairs, United Nations, New York, 10017, USA, by Fax: 1 212 963 2147 or by e mail at [email protected].
Suggested citation:United Nations, Department of Economic and Social Affairs, Population Division (2015). World Population Ageing 2015 - Highlights (ST/ESA/SER.A/368).
Official symbols of United Nations documents are composed of capital letters combined with numbers, as illustrated in the above citation.
Cover photo: “Streets of Dhaka: Taming the Future” by Inkiad Hasin, 2011(https://flickr.com/photos/ragefeast/6117446784/), used under CC BY 2.0, cropped from original
Published by the United NationsSales No. E.16.XIII.5ISBN 978-92-1-151538-1Copyright © United Nations, 2015All rights reserved

1
Key trends in population ageing for the 2030 Agenda for Sustainable Development
• Between 2015 and 2030, the number of older persons — those aged 60 years or over — in the world is projected to grow by 56 per cent, from 901 million to more than 1.4 billion.
• By 2030, older persons will outnumber children aged 0-9 years (1.4 billion vs. 1.3 billion); by 2050, there will be more people aged 60 or over than adolescents and youth aged 10-24 years (2.1 bil-lion vs. 2.0 billion).
• The number of people at very advanced ages is increasing too: the global population aged 80 years or over is projected to grow from 125 mil-lion in 2015 to 202 million in 2030 and to 434 mil-lion in 2050.
• Virtually all countries are expected to see sub-stantial growth in the number of older persons between 2015 and 2030, and that growth will be faster in the developing regions than in the devel-oped regions.
• Over the next 15 years, the number of older per-sons is expected to grow fastest in Latin America and the Caribbean, with a projected 71 per cent increase in the population aged 60 or over, fol-lowed by Asia (66 per cent), Africa (64 per cent), Oceania (47 per cent), Northern America (41 per cent) and Europe (23 per cent).
• In 2015, one in eight people worldwide was aged 60 or over. By 2030, older persons are projected to account for one in six people globally.
• The ageing process is especially advanced in Eu-rope and in Northern America, where more than one in five people was aged 60 or over in 2015, but it is growing rapidly in the other regions as well. By 2030, older persons are expected to account
for more than 25 per cent of the populations in Europe and Northern America, 20 per cent in Oce-ania, 17 per cent in Asia and in Latin America and the Caribbean, and 6 per cent in Africa.
• In 2050, 44 per cent of the world’s population will live in relatively aged countries, with at least 20 per cent of the population aged 60 or over, and one in four people will live in a country where more than 30 per cent of people are above age 60.
• The immediate cause of population ageing is fertility decline. However, improved longevity contributes as well, first by eliminating the demo-graphic necessity of high fertility, and second by increasing the number of survivors to older ages. By 2050, life expectancy at birth is projected to surpass 80 years in Europe, Latin America and the Caribbean, Northern America and Oceania; and it will approach 80 years in Asia and 70 years in Africa.
• Among today’s young people, survival to age 80 is expected to be the norm everywhere but in Af-rica. Worldwide, 60 per cent of women and 52 per cent of men born in 2000-2005 are expected to survive to their 80th birthdays, compared to less than 40 per cent of the women and men born in 1950-1955.
• As populations continue to age during the post-2015 era, it is imperative that Governments design innovative policies specifically targeted to the needs of older persons, including those address-ing housing, employment, health care, social pro-tection, and other forms of intergenerational sup-port. By anticipating these demographic shifts, countries can enact policies proactively to adapt to an ageing population.

World Population Ageing 2015: Highlights2
Introduction
The world’s population is ageing: virtually all countries are experiencing growth in the num-ber and proportion of older persons in their populations. The ageing process began more than a century ago in many developed countries and, over the late-twentieth and into the twenty-first century, it emerged in most of the developing countries as well. Population age-ing is poised to become one of the most significant social transformations of the twenty-first century, with implications for nearly all sectors of society, including labour and financial markets, the demand for goods and services, such as housing, transportation and social pro-tection, as well as family structures and inter-generational ties. Preparing for the economic and social shifts associated with an ageing population is thus essential to ensure progress in development, including towards the achievement of the Sustainable Development Goals (SDGs), in particular those related to poverty eradication, the promotion of health, gender equality, employment, and sustainable human settlements, as well as reducing inequality within and across countries.
Population ageing is in many ways a demographic success story, driven by changes in fertility and mortality that are associated with economic and social development. Progress in reducing child mortality, improving access to education and employment opportunities, advancing gender equality, and promoting reproductive health and access to family planning have all contributed to reductions in birth rates. Moreover, advancements in public health and medical technologies, along with improvements in living conditions, mean that people are living longer and, in many cases, healthier lives than ever before, particularly at advanced ages. Together, these declines in fertility and increases in longevity are producing very sub-stantial shifts in the population age structure, such that the share of children is shrinking while that of older persons continues to grow.
Growth in the numbers and proportions of older persons can be expected to have far reaching economic, social, and political implications. In many countries the number of older persons is growing faster than the number of people in the traditional working ages, leading many Governments to consider increasing the statutory ages at retirement in an effort to prolong the labour force participation of older persons and improve the financial sustain-ability of pension systems. At the same time, population ageing and growth in the number of persons at very advanced ages, in particular, puts pressure on health systems, increasing the demand for care, services and technologies to prevent and treat non-communicable diseases and chronic conditions associated with old age. Countries can address these and other chal-lenges by anticipating the coming demographic shifts and enacting policies proactively to adapt to an ageing population.
This publication presents the highlights of the World Population Ageing 2015 report. It summarizes the trends in population ageing drawn from the latest estimates and projec-tions of population by age and sex of 233 countries or areas, as published in World Population Prospects: the 2015 Revision. The present Highlights focuses mostly on the period from 2015 to 2030, the implementation period identified for the SDGs, and discusses the implications of trends in the number and share of older persons for development planning. The annex table

3
provides data on the estimated and projected number and share of older persons and what they imply for future potential support ratios, as well as the indicators of fertility and longev-ity that drive population ageing. This information is presented for the world, for geographical regions, and for the 201 countries or areas with 90,000 inhabitants or more in 2015.

World Population Ageing 2015: Highlights4
Trends in population ageing
Worldwide, there were 901 million people aged 60 years or over in 2015. Their number is projected to grow to 1.4 billion in 2030, the target date for the SDGs, and to 2.1 billion by 2050. Growth in the number of older persons is a global phenomenon: virtually every country in the world will experience a substantial increase in the size of the population aged 60 years or over between 2015 and 2030. The increase is projected to be especially significant in the less developed regions. Latin America and the Caribbean, for example, is projected to see a more than 70 per cent increase in the number of older persons over the next 15 years. The growth of the older population is expected to be similarly rapid in
Table INumber and distribution of persons aged 60 years or over by region, 2015 and 2030
Persons aged 60 years or
older in 2015 (millions)
Persons aged 60 years or
over in 2030 (millions)
Percentage change
between 2015 and 2030
Distribution of older per-sons in 2015
(per cent)
Distribution of older per-sons in 2030
(per cent)World 900.9 1402.4 55.7 100.0 100.0
Africa 64.4 105.4 63.5 7.2 7.5
Asia 508.0 844.5 66.3 56.4 60.2
Europe 176.5 217.2 23.1 19.6 15.5
Northern America 74.6 104.8 40.5 8.3 7.5
Latin America and the Caribbean 70.9 121.0 70.6 7.9 8.6
Oceania 6.5 9.6 47.4 0.7 0.7
Africa and Asia, with increases of more than 60 per cent projected between 2015 and 2030, compared to a 23 per cent increase in Europe, where the population is already much older (table 1).
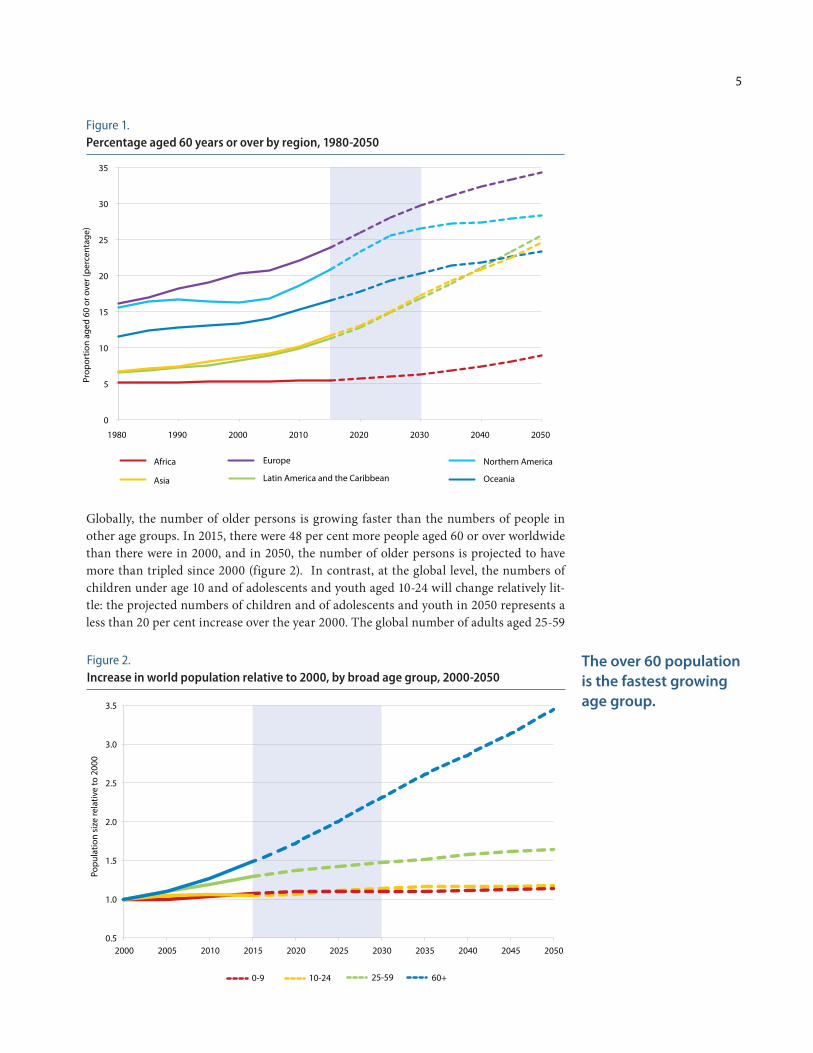
In most countries, the growth in the absolute number of older persons will occur in a context of low or declining fertility, so that the share of older persons in the population also can be expected to grow. In 2015, one in eight people worldwide was aged 60 or over. By 2030, older persons are projected to account for one in six people globally. The ageing process is especially advanced in Europe and in Northern America, where more than one in five people was aged 60 or over in 2015, but it is advancing rapidly in Latin America and the Caribbean, Asia and Oceania as well. By 2030, older persons are expected to account for more than 25 per cent of the populations in Europe and in Northern America, 20 per cent in Oceania, 17 per cent in Asia and in Latin America and the Caribbean, and 6 per cent in Africa (figure 1).
5
Globally, the number of older persons is growing faster than the numbers of people in other age groups. In 2015, there were 48 per cent more people aged 60 or over worldwide than there were in 2000, and in 2050, the number of older persons is projected to have more than tripled since 2000 (figure 2). In contrast, at the global level, the numbers of children under age 10 and of adolescents and youth aged 10-24 will change relatively lit-tle: the projected numbers of children and of adolescents and youth in 2050 represents a less than 20 per cent increase over the year 2000. The global number of adults aged 25-59
0
5
10
15
20
25
30
35
1980 1990 2000 2010 2020 2030 2040 2050
Prop
ortio
n ag
ed 6
0 or
ove
r (pe
rcen
tage
)
Europe Northern America
Latin America and the Caribbean Asia Oceania
Africa
Figure 1.Percentage aged 60 years or over by region, 1980-2050
0.5
1.0
1.5
2.0
2.5
3.0
3.5
2000 2005 2010 2015 2020 2025 2030 2035 2040 2045 2050
Popu
latio
n si
ze re
lativ
e to
200
0
60+ 25-59 10-24 0-9
Figure 2.Increase in world population relative to 2000, by broad age group, 2000-2050
The over 60 population is the fastest growing age group.

World Population Ageing 2015: Highlights6
is growing faster than the number of children, but not as fast as the population aged 60 or over. In 2015, there were 29 per cent more people aged 25-59 than there were in 2000, and projections indicate that by 2050 there will be 63 per cent more of them than in 2000.By 2030, older persons will outnumber children aged 0-9 years (1.4 billion vs. 1.3 billion); by 2050, there will be more older persons aged 60 or over than adolescents and youth aged 10-24 years (2.1 billion vs. 2.0 billion) (figure 3). The number of people at very advanced ages is increasing too: the global population aged 80 years or over is projected to grow from 125 million in 2015 to 202 million in 2030 and to 434 million in 2050.
1.2 1.3 1.3 1.4 1.7 1.8
2.0 2.0
2.6
3.3
3.8
4.2
0.6 0.9
1.4
2.1
0.0
0.5
1.0
1.5
2.0
2.5
3.0
3.5
4.0
4.5
2000 2015 2030 2050
Popu
latio
n (b
illio
ns)
0-9 10-24 25-59 60+ 80+
Figure 3.Global population by broad age group, 2000-2050
Two-thirds of the world’s older persons live in the developing regions and their numbers are growing faster there than in the developed regions. Asia, with 508 million people aged 60 or over in 2015, was home to 56 per cent of the global older population, a share pro-jected to increase to 60 per cent in 2030 (figure 4; table 1). The 71 million older persons in Latin America and the Caribbean in 2015 accounted for 7.9 per cent of the global total in that year; this share is expected to reach 8.6 per cent in 2030, when projections indicate that there will be 121 million people aged 60 or over in that region. Africa was home to a

7
0
500
1000
1500
2000
1980 1990 2000 2010 2020 2030 2040 2050
Popu
latio
n ag
ed 6
0 or
ove
r (m
illio
ns)
Africa Asia Latin America & the Caribbean Oceania Europe Northern America
Figure 4.Population aged 60 years or over by region, 1980-2050
relatively small number of people aged 60 years or over, with 64 million in 2015, represent-ing 7.2 per cent of the global total. In 2030, Africa’s projected 105 million older persons could account for 7.5 per cent of the older population worldwide.
Europe and Northern America are projected to see significant but slower growth in the number of older persons compared to other regions. Consequently, the share of the world’s older persons residing in Europe and in Northern America is expected to decline. In 2015, Europe’s 177 million people aged 60 or over accounted for close to 20 per cent of older persons globally, and while its number of older persons is projected to grow to 217 million in 2030, its share of the world’s older population is projected to fall to 15.5 per cent. Similarly, the number of people aged 60 years or over in Northern America is projected to rise from 75 million in 2015 to 105 million in 2030, while the region’s share of the world’s older population is expected to decline from 8.3 per cent to 7.5 per cent.
The older population is growing fastest in the less developed regions.

World Population Ageing 2015: Highlights8
In 2050, nearly half of the world’s population will live in countries with at least 20 per cent of the population aged 60 or over, and one in four people will live in countries where older persons account for more than 30 per cent of the population (figure 5). The number of countries or areas where at least 20 per cent of people are aged 60 years or over is pro-jected to grow from 53 in 2015 to 145 in 2050, and the share of the world’s people living in such countries is projected to increase from 17 per cent to 44 per cent. In 74 countries or areas, older persons are projected to make up at least 30 per cent of the population in 2050, up from just 3 countries or areas in 2015. Conversely, the number of countries with very young population age structures is shrinking over time. While in 2015 there were 37 countries or areas where less than 5 per cent of people were aged 60 or over, by 2050 the share of older persons is projected to be above 5 per cent in almost all countries.
Figure 5.Percentage of the population aged 60 years or over, 2015 and 2050
Data source: World Population Prospects: The 2015 RevisionThe boundaries and names shown and the designations used on this map do not imply o�cial endorsement or acceptanceby the United Nations. Dotted line represents approximately the Line of Control in Jammu and Kashmir agreed upon by Indiaand Pakistan. The �nal status of Jammu and Kashmir has not yet been agreed upon by the parties. Final boundary betweenthe Republic of Sudan and the Republic of South Sudan has not yet been determined.
Percentage 60+30 or over25 to 3020 to 2515 to 2010 to 155 to 10Less than 5No data
2015
2050
The percentage of older persons in the population will increase in virtually all countries.

9
World Population Ageing 2015: Highlights10
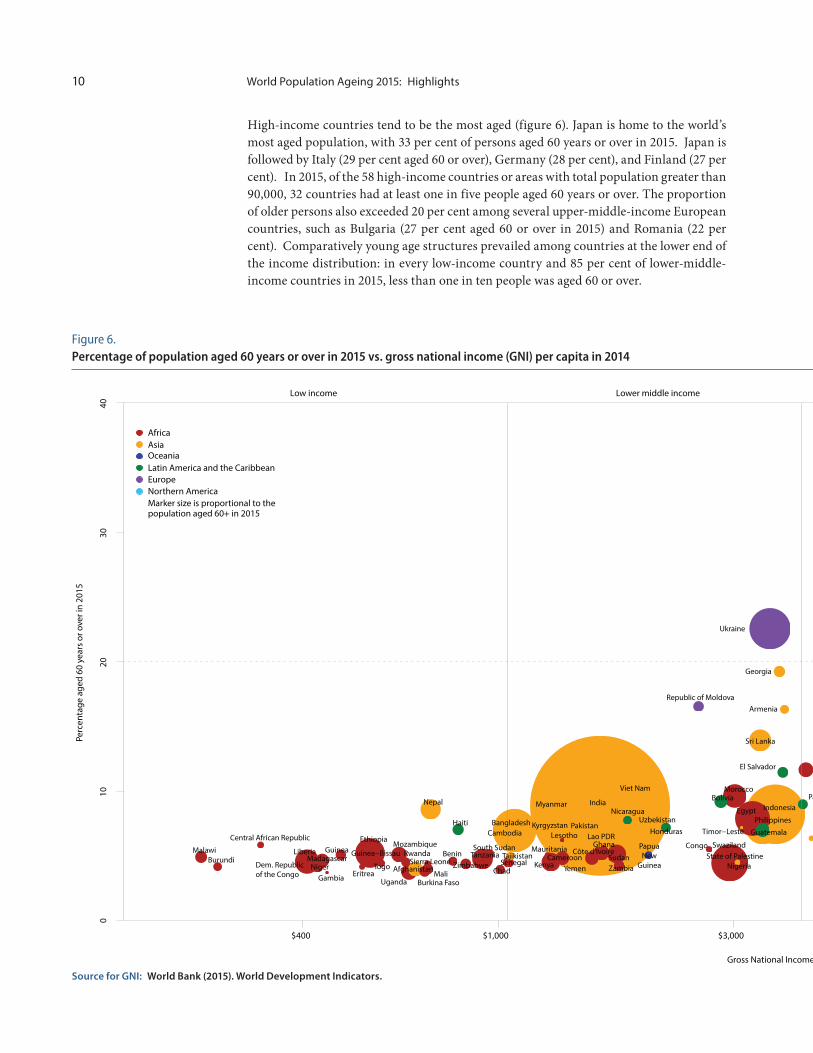
High-income countries tend to be the most aged (figure 6). Japan is home to the world’s most aged population, with 33 per cent of persons aged 60 years or over in 2015. Japan is followed by Italy (29 per cent aged 60 or over), Germany (28 per cent), and Finland (27 per cent). In 2015, of the 58 high-income countries or areas with total population greater than 90,000, 32 countries had at least one in five people aged 60 years or over. The proportion of older persons also exceeded 20 per cent among several upper-middle-income European countries, such as Bulgaria (27 per cent aged 60 or over in 2015) and Romania (22 per cent). Comparatively young age structures prevailed among countries at the lower end of the income distribution: in every low-income country and 85 per cent of lower-middle-income countries in 2015, less than one in ten people was aged 60 or over.
Figure 6.Percentage of population aged 60 years or over in 2015 vs. gross national income (GNI) per capita in 2014
Source for GNI: World Bank (2015). World Development Indicators.
010
2030
40
Gross National Income per capita (logarithmic scale)
Perc
enta
ge a
ged
60 y
ears
or o
ver i
n 20
15
$400 $1,000 $3,000 $8,000 $20,000 $60,000
China
India
United States of America
Japan
Russian Federation
Brazil
Germany
Indonesia
Italy
France
United Kingdom
Pakistan
Mexico
Spain
Bangladesh
Thailand
Ukraine
Viet Nam
Republic of Korea
Turkey
Poland
Nigeria
Canada
PhilippinesEgypt
Argentina
Iran
Colombia
Ethiopia
Australia
Myanmar
Romania
South Africa
Netherlands
Algeria
Dem. Republicof the Congo
Morocco Peru
Greece
Venezuela
Sri Lanka
Chile
Portugal
Malaysia
BelgiumCzech Republic
Tanzania
Sweden
Nepal
Hungary
Uzbekistan
Cuba
Serbia
KenyaSudan
Austria Switzerland
Belarus
Bulgaria
Kazakhstan
Iraq
Ecuador
Saudi Arabia
China, Hong Kong SAR
Finland
Uganda
GhanaMozambique
Denmark
Tunisia
Afghanistan
Israel
Yemen
Guatemala
Norway
CameroonMadagascar
Slovakia
Côte d'Ivoire
Croatia
Cambodia
Dominican Republic
Singapore
Bolivia
Azerbaijan
Angola
New Zealand
Ireland
Bosnia and Herzegovina
Malawi
Niger
Georgia
Haiti
Puerto Rico
Lithuania
Mali
El Salvador
Burkina Faso
ZambiaZimbabwe Senegal
Republic of Moldova
Lebanon
Uruguay
Guinea South Sudan
Costa Rica
Paraguay
Honduras
Chad
Rwanda
Slovenia
Albania
Latvia
Benin
Armenia
Nicaragua
Burundi
Libya
Panama
Tajikistan
Kyrgyzstan
JordanLao PDR
PapuaNew
Guinea
TFYR Macedonia
Turkmenistan
Jamaica
Estonia
Togo
Central African Republic
Sierra Leone
Congo
Eritrea
Liberia
United Arab Emirates
State of Palestine
Cyprus
MauritaniaOman
Trinidad and Tobago
Mongolia
Mauritius
Namibia
Kuwait
Lesotho
Botswana
Gabon
Guinea−Bissau
Timor−Leste
Gambia
Swaziland
Bahrain
Qatar
Low income Lower middle income Upper middle income High income
AfricaAsiaOceaniaLatin America and the CaribbeanEuropeNorthern AmericaMarker size is proportional to thepopulation aged 60+ in 2015

11
Figure 6.Percentage of population aged 60 years or over in 2015 vs. gross national income (GNI) per capita in 2014
010
2030
40
Gross National Income per capita (logarithmic scale)
Perc
enta
ge a
ged
60 y
ears
or o
ver i
n 20
15
$400 $1,000 $3,000 $8,000 $20,000 $60,000
China
India
United States of America
Japan
Russian Federation
Brazil
Germany
Indonesia
Italy
France
United Kingdom
Pakistan
Mexico
Spain
Bangladesh
Thailand
Ukraine
Viet Nam
Republic of Korea
Turkey
Poland
Nigeria
Canada
PhilippinesEgypt
Argentina
Iran
Colombia
Ethiopia
Australia
Myanmar
Romania
South Africa
Netherlands
Algeria
Dem. Republicof the Congo
Morocco Peru
Greece
Venezuela
Sri Lanka
Chile
Portugal
Malaysia
BelgiumCzech Republic
Tanzania
Sweden
Nepal
Hungary
Uzbekistan
Cuba
Serbia
KenyaSudan
Austria Switzerland
Belarus
Bulgaria
Kazakhstan
Iraq
Ecuador
Saudi Arabia
China, Hong Kong SAR
Finland
Uganda
GhanaMozambique
Denmark
Tunisia
Afghanistan
Israel
Yemen
Guatemala
Norway
CameroonMadagascar
Slovakia
Côte d'Ivoire
Croatia
Cambodia
Dominican Republic
Singapore
Bolivia
Azerbaijan
Angola
New Zealand
Ireland
Bosnia and Herzegovina
Malawi
Niger
Georgia
Haiti
Puerto Rico
Lithuania
Mali
El Salvador
Burkina Faso
ZambiaZimbabwe Senegal
Republic of Moldova
Lebanon
Uruguay
Guinea South Sudan
Costa Rica
Paraguay
Honduras
Chad
Rwanda
Slovenia
Albania
Latvia
Benin
Armenia
Nicaragua
Burundi
Libya
Panama
Tajikistan
Kyrgyzstan
JordanLao PDR
PapuaNew
Guinea
TFYR Macedonia
Turkmenistan
Jamaica
Estonia
Togo
Central African Republic
Sierra Leone
Congo
Eritrea
Liberia
United Arab Emirates
State of Palestine
Cyprus
MauritaniaOman
Trinidad and Tobago
Mongolia
Mauritius
Namibia
Kuwait
Lesotho
Botswana
Gabon
Guinea−Bissau
Timor−Leste
Gambia
Swaziland
Bahrain
Qatar
Low income Lower middle income Upper middle income High income
AfricaAsiaOceaniaLatin America and the CaribbeanEuropeNorthern AmericaMarker size is proportional to thepopulation aged 60+ in 2015
By 2030 many middle-income countries will have aged considerably. Within the next 15 years, several upper-middle-income countries are projected to become as aged as many of today’s high-income countries. For example, between 2015 and 2030 the share of people aged 60 years or over is projected to increase from 15 to 25 per cent in China, from 16 to 27 per cent in Thailand and from 19 to 32 per cent in Cuba (see annex table). Some lower-middle-income countries are projected to age rapidly as well. For example, between 2015 and 2030 the proportion aged 60 or over is projected to increase from 14 to 21 per cent in Sri Lanka, from 10 to 18 per cent in Viet Nam, and from 10 to 15 per cent in Morocco. The population ageing process is much slower in low-income countries: in 93 per cent of low-income countries and 54 per cent of lower-middle-income countries, the share of older persons is projected to remain below 10 per cent through 2030.

World Population Ageing 2015: Highlights12
The demography of population ageing
Population ageing is driven by the reductions in fertility and improvements in longev-ity that occur during the demographic transition. The transition began first in Europe and Northern America, where fertility reductions took place over the past two centuries, contributing to their relatively aged population age structures today. In Germany, for example, the total fertility rate in 1950 was 2.1 children per woman, and the proportion of the population aged 60 or over was just under 15 per cent. Fertility continued to fall in Germany to 1.4 children per woman in 2015, while the proportion of older persons nearly doubled, to 28 per cent. While fertility rates in Germany are expected to increase somewhat in the coming decades, they are likely to remain below the replacement level of 2.1 children per woman, and, by 2050, the percentage aged 60 years or over is projected to reach 39 per cent.
The demographic transition began later in most of Asia and Latin America and the Carib-bean, and thus their populations are youthful compared to Europe and Northern Amer-ica. In Brazil in 1950 fertility stood at 6.2 children per woman, on average, and just 5 per cent of the population was aged 60 or over. But starting around 1960, fertility declined rapidly in Brazil, to 1.8 children per woman in 2015, and it is projected to remain below replacement at least through 2050. Fertility decline has occurred much faster in Asia and in Latin America and the Caribbean than in the more developed regions, and thus the populations of Asia and of Latin America and the Caribbean are ageing more rapidly. The share of Brazil’s population aged 60 years or over, for example, is projected to increase from 12 per cent in 2015 to 29 per cent in 2050.
Many countries in Africa remain in the early stages of the demographic transition: some have begun to see reductions in fertility only recently, while others have yet to see a signifi-cant decline in fertility. As a result, while the numbers of older people have grown, their share of the overall population has remained fairly small. In the United Republic of Tanza-nia, for example, total fertility in 2015, at 5.1 children per woman, was still comparatively high, although it had fallen from 6.7 children per woman in 1950. Consequently, there has been little change in the proportion of older people in Tanzania: it increased only slightly, from 4 per cent in 1950 to 5 per cent in 2015. Fertility in Tanzania is projected to continue a relatively slow decline towards 3.3 children per woman in 2050, and the percentage of the population aged 60 or over is projected to rise gradually, reaching 7 per cent by the mid-century.
Population ageing is an inevitable conse-quence of the demo-graphic transition.

13
Figure 7.Population age structure in Germany, Brazil and the United Republic of Tanzania
0-4 5-9
10-14 15-19 20-24 25-29 30-34 35-39 40-44 45-49 50-54 55-59 60-64 65-69 70-74 75-79 80-85 85-89 90-94 95-99 100+
Age
1950
Males Females
Total pop = 70 million
2015
Total pop =81 million
2050
Total pop = 75 million
10 8 6 4 2 0 2 4 6 8 10 10 8 6 4 2 0 2 4 6 8 10 10 8 6 4 2 0 2 4 6 8 10
0-4 5-9
10-14 15-19 20-24 25-29 30-34 35-39 40-44 45-49 50-54 55-59 60-64 65-69 70-74 75-79 80-85 85-89 90-94 95-99 100+
Age
Males Females
Total pop = 54million
Total pop =208 million
Total pop = 238 million
10 8 6 4 2 0 2 4 6 8 10 10 8 6 4 2 0 2 4 6 8 10 10 8 6 4 2 0 2 4 6 8 10
0-4 5-9
10-14 15-19 20-24 25-29 30-34 35-39 40-44 45-49 50-54 55-59 60-64 65-69 70-74 75-79 80-85 85-89 90-94 95-99 100+
Age
Males Females
Total pop = 8 million
Total pop =53 million
Total pop = 137 million
10 8 6 4 2 0 2 4 6 8 10
Population (millions)
10 8 6 4 2 0 2 4 6 8 10
Population (millions)
10 8 6 4 2 0 2 4 6 8 10
Population (millions)
Germany
Brazil
United Republic of Tanzania
1950 2015 2050
1950 2015 2050

World Population Ageing 2015: Highlights14
Box 1Population ageing and international migration
While declining fertility and increasing longevity are the key drivers of popula-tion ageing globally, international migration has also contributed to changing population age structures in some countries and regions. In countries that are experiencing large immigration flows, international migration can slow the age-ing process, at least temporarily, since migrants tend to be concentrated in the working ages. However, over the long term, levels of immigration would need to be much higher than have been observed in the past in order for international migration to offset the changes in population age structure that result from fer-tility and mortality trends. Thus migration alone is unlikely to be an effective policy response to population ageing in a vast majority of countries (United Na-tions, 2001).
However, there is some evidence that countries are increasingly turning to inter-national migration in the context of an ageing population. The number of coun-tries with policies to increase rates of immigration rose from 8 in 1996 to 22 in 2013 and 20 of those 22 countries (91 per cent) identified population ageing as a “major concern” in 2013. By comparison, just 47 per cent of countries that had not enacted policies to promote immigration identified population ageing as a “major concern” (United Nations, 2014).
Conversely, the emigration of young workers has accelerated population age-ing in some countries, particularly in Eastern Europe where increasing access to European Union labour markets as well as the economic crisis that began in 2008 have contributed to large emigration flows (OECD, 2013). In response, some of these countries have enacted policies to slow rates of emigration or to encour-age the return of their citizens from abroad (United Nations, 2014).
15
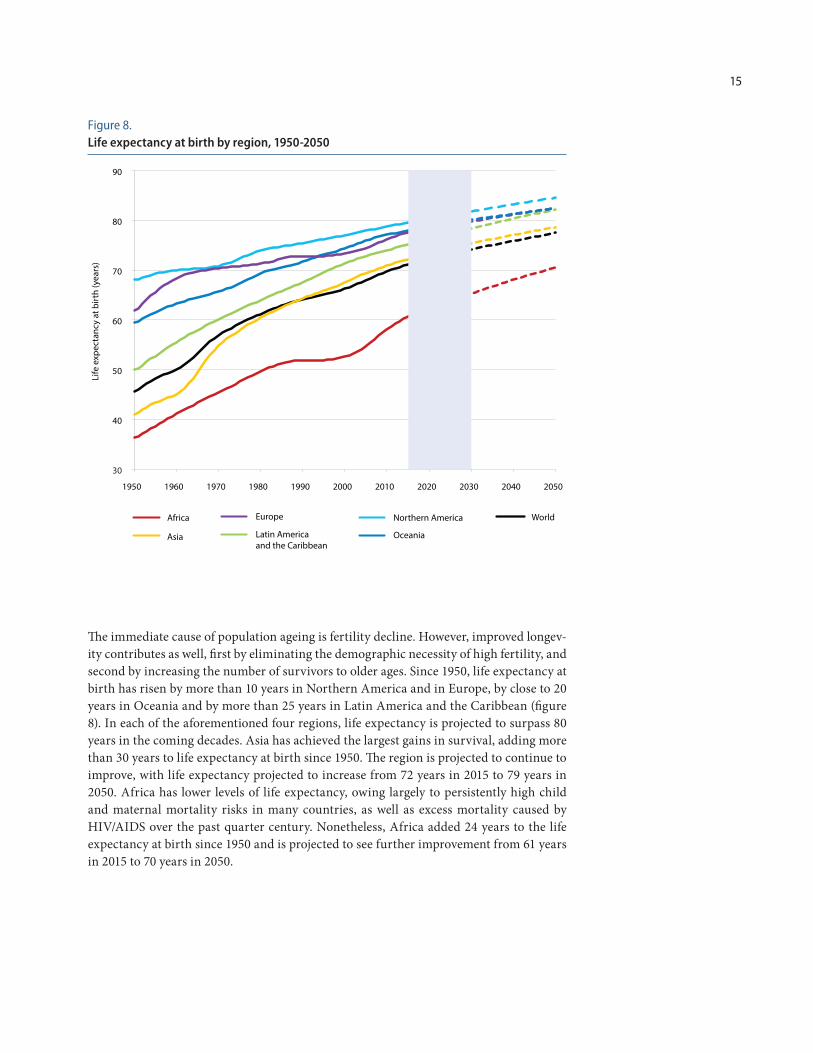
The immediate cause of population ageing is fertility decline. However, improved longev-ity contributes as well, first by eliminating the demographic necessity of high fertility, and second by increasing the number of survivors to older ages. Since 1950, life expectancy at birth has risen by more than 10 years in Northern America and in Europe, by close to 20 years in Oceania and by more than 25 years in Latin America and the Caribbean (figure 8). In each of the aforementioned four regions, life expectancy is projected to surpass 80 years in the coming decades. Asia has achieved the largest gains in survival, adding more than 30 years to life expectancy at birth since 1950. The region is projected to continue to improve, with life expectancy projected to increase from 72 years in 2015 to 79 years in 2050. Africa has lower levels of life expectancy, owing largely to persistently high child and maternal mortality risks in many countries, as well as excess mortality caused by HIV/AIDS over the past quarter century. Nonetheless, Africa added 24 years to the life expectancy at birth since 1950 and is projected to see further improvement from 61 years in 2015 to 70 years in 2050.
Figure 8.Life expectancy at birth by region, 1950-2050
30
40
50
60
70
80
90
1950 1960 1970 1980 1990 2000 2010 2020 2030 2040 2050
Life
exp
ecta
ncy
at b
irth
(yea
rs)
World Europe Northern America
Latin Americaand the Caribbean
Asia Oceania
Africa

World Population Ageing 2015: Highlights16
More people are projected to survive to advanced older ages than ever before. Mortality estimates and projections suggest that less than one-half of the people born in the world during 1950-1955 will survive to celebrate their 80th birthdays (figure 9). Among this cohort, only women and men born in Northern America and in Oceania and women born in Europe are more likely than not to reach age 80. Among those born more recently, how-ever, in 2000-2005, survival to age 80 is expected to be the norm everywhere but Africa. Around eight in ten women born in Northern America and in Europe in 2000-2005 are projected to survive to age 80. Projected probabilities of survival to age 80 among the 2000-2005 birth cohort also exceed 70 per cent among women in Oceania and in Latin America and the Caribbean and among men in Northern America. Those born in Africa are least likely to survive to advanced older ages: 43 per cent of women and 33 per cent of men born in Africa during 2000-2005 are projected to live to their 80th birthdays.
Most children born today will live to their 80th birthdays.
Because women tend to live longer than men, they comprise a larger share of the older population, especially at advanced ages (figure 10). In 2015, women accounted for 54 per cent of the global population aged 60 years or over and 61 per cent of those aged 80 years or over. Moreover, improvements in survival at advanced ages mean that the older popu-lation is itself ageing. The share of the older population that is aged 80 years or over is projected to grow from 14 per cent in 2015 to 21 per cent in 2050.
Figure 9.Probability of survival to age 80 by sex and region, birth cohorts of 1950-1955 and 2000-2005
14%
19%
27%
35%
50%
61%
34%
47%
38%
59%
51%
65%
29%
39%
33%
43%
54%
62%
63%
73%
65%
74%
65%
79%
74%
80%
52%
60%
0% 10% 20% 30% 40% 50% 60% 70% 80% 90% 100%
Male
Female
Male
Female
Male
Female
Male
Female
Male
Female
Male
Female
Male
Female
Africa
Asia
Oceania
Latin America and the Caribbean
Europe
Northern America
World
Percentage surviving to age 80
Cohort born in 1950-1955 Cohort born in 2000-2005

17
Men 60-79
Women 60-79
Women 80+
Men 80+
2015
Men 60-79
Women 60-79
Women 80+
Men 80+
2050
Figure 10.Global share of the older population by age and sex, 2015 and 2050
With increasing longevity and declining fertility, each successive cohort of older persons can expect to live longer and have fewer adult children as potential sources of support in old age. Indeed, the potential support ratio—the number of people aged 20 to 64 years per person aged 65 years or over—declines as a population ages. In 2015, there were 7 work-ing-aged people for each older person in the world. By 2050, the global potential support ratio is projected to have fallen to 3.5 and all major regions except Africa are expected to have potential support ratios of 3.2 or lower (figure 11). In 2050, there are expected to be 2.4 working-aged people for every older person aged 65 or over in Northern America, 1.9 in Europe, and the potential support ratio is projected to have fallen below 2 in 46 coun-tries or areas, such as Japan (1.3), Portugal (1.4), Cuba (1.5) and Austria (1.7).
Figure 11.Potential support ratios by region, 2015, 2030 and 2050
3.5
1.9
2.4
3.0
2.9
3.2
8.9
4.9
2.4
2.6
3.5
5.0
5.1
11.7
7.0
3.5
4.0
4.8
7.6
8.0
12.9
0 2 4 6 8 10 12 14
World
Europe
Northern America
Oceania
Latin America andthe Caribbean
Asia
Africa
Persons aged 20-64 years per person aged 65 years or over
2015
2030
2050
The older population is itself ageing.
World Population Ageing 2015: Highlights18
Policy implications of population ageing
Preparing for an ageing population is integral to the achievement of many of the sustain-able development goals and targets, including poverty eradication, ensuring healthy lives and promoting well-being at all ages, gender equality, and full and productive employ-ment and decent work for all, reducing inequalities between and within countries, and making cities and human settlements inclusive, safe, resilient and sustainable. The 2002 Madrid International Plan of Action on Ageing (MIPAA), adopted during the Second World Assembly on Ageing, highlighted the need to consider older persons in develop-ment planning, emphasizing that older persons should be able to participate in and benefit equitably from the fruits of development to advance their health and well-being, and that societies should provide enabling environments for them to do so. As populations grow increasingly aged, it is more important than ever that Governments design innovative policies and public services specifically targeted to older persons, including those address-ing, inter alia, housing, employment, health care, infrastructure and social protection. Such policies will be essential to the success of efforts to achieve the goals and targets laid out in the 2030 Agenda for Sustainable Development.
Planning for growing numbers and proportions of older people is essential to ensure the sustainability of pension systems. In some countries, large majorities of older people are covered by existing pay-as-you go or unfunded pension programmes, but declining old-age support ratios imply that such programmes may struggle to maintain adequate income support into the future. In response, some countries are pursuing pension system reforms, such as increasing the statutory ages at retirement and encouraging private sav-ings. In many developing countries, existing pension systems cover only a minority of older persons. There, Governments should prioritize enhancing system coverage and tak-ing other measures to properly finance the pensions of the ever-expanding population of retirees. Countries, where appropriate, should expand their pension systems to guarantee basic income security in old age for all, at the same time ensuring the sustainability and solvency of pension schemes.
Health care systems must adapt to meet the needs of growing numbers of older persons. In countries where health systems are already well-equipped to diagnose and treat condi-tions associated with old age, public policies are needed to mitigate the upward pressure on national health care budgets exerted by the rising costs of health care services, and the longer lifespans and increasing numbers of older persons. In places where existing health systems are weak or ill-equipped to address the needs of an ageing population, countries should work to expand and evolve those systems in preparation for a growing burden of non-communicable diseases. As life expectancies increase, it is more important than ever to enact policies that promote lifelong health and emphasize preventive care—such as those that support good nutrition and physical activity, and discourage tobacco use and the harmful use of alcohol and drugs—to prevent or postpone the onset of age-related

19
disability. In addition, countries should prepare for a growing need for long-term care, both home-based and facility-based, to ensure the well-being of those at advanced ages.Population ageing underscores the urgency of eliminating age-related discrimination, promoting and protecting the rights and dignity of older persons, and facilitating their full participation in society. Ensuring that older persons who want to work have access to employment opportunities is a key policy priority. Policies are needed to eliminate age barriers in the formal labour market and promote the recruitment of and flexible employ-ment opportunities for older workers, as well as facilitate access to microcredit and, where applicable, provide subsidies and other incentives for self-employment. In addition, coun-tries should ensure that older persons are included in public policy and decision-making processes, including by utilising information and communications technologies to facili-tate their engagement in public governance processes.Governments should act to improve older persons’ access to public services in both urban and rural settings, including by ensuring that infrastructure and services are accessible to persons with limited mobility, or visual, hearing and other impairments for which preva-lence tends to increase with age. The proliferation of technologies, such as mobile devices, offers a variety of new channels for reaching older persons, for example by delivering mes-sages related to health, security or environmental hazards via SMS. Governments should help to bridge the digital divide by addressing differences in educational background and Information and Communications Technology (ICT) skills of older persons through tech-nology training courses, programmes and learning hubs tailored to their needs. Recent population trends guarantee that virtually every country should anticipate sig-nificant growth in the number of older persons over the coming decades, necessitating multisectoral policy reforms to ensure that older persons are able to participate actively in the economic, social, cultural and political life of their societies. By understanding their specific population trends, Governments may assess present needs and anticipate future needs with respect to their older population. In doing so, they can proactively implement the policies and programmes that ensure the well-being and full socio-economic integra-tion of older persons while maintaining the fiscal solvency of pension and health care systems and promoting economic growth.

World Population Ageing 2015: Highlights20
References
Organization for Economic Cooperation and Development (2013). Coping with Emigra-tion in Baltic and East European Countries, OECD Publishing, http://dx.doi.org/10.1787/9789264204928-en
United Nations (2001). Replacement Migration: Is it a Solution to Declining and Ageing Populations? (United Nations publication, Sales No. E.01.XIII.19).
United Nations (2013) World Population Ageing 2013, http://www.un.org/en/development/desa/population/publications/pdf/ageing/World-PopulationAgeing2013.pdf
United Nations (2014). World Population Policies Database, 2013. Available online at: http://esa.un.org/PopPolicy/about_database.aspx
United Nations (2015). World Population Prospects: The 2015 Revision, DVD Edition.
United Nations Population Fund and HelpAge International (2012). Ageing in the twenty-first century: A challenge and a celebration, ISBN 978-0-89714-091-5, http://www.unfpa.org/publications/ageing-twenty-first-century
Photo credits
Page 3: “Grandparents” by Jill M, 2007
(https://www.flickr.com/photos/jm_photos/2057240437/), used under CC BY 2.0, cropped from original
Pages 6-7: “commercianti by fedewild, 2007
(https://www.flickr.com/photos/fedewild/1569731156/), used under CC BY-SA 2.0, cropped from original
Page 9: “Grandmother, Wollaita, Ethiopia” by Rod Waddington, 2014
(https://www.flickr.com/photos/rod_waddington/15037783739/), used under CC BY-SA 2.0
Page 21: “Elderly Japanese women” by Teo Romera (Mr Hicks46), 2013
(https://www.flickr.com/photos/teosaurio/10137846884/), used under CC BY-SA 2.0, cropped from original
Back cover: “Just me and you” by Matteo Paciotti, 2011
(https://www.flickr.com/photos/matte4president/6418163643/), used under CC BY 2.0, cropped from original

21

World Population Ageing 2015: Highlights22
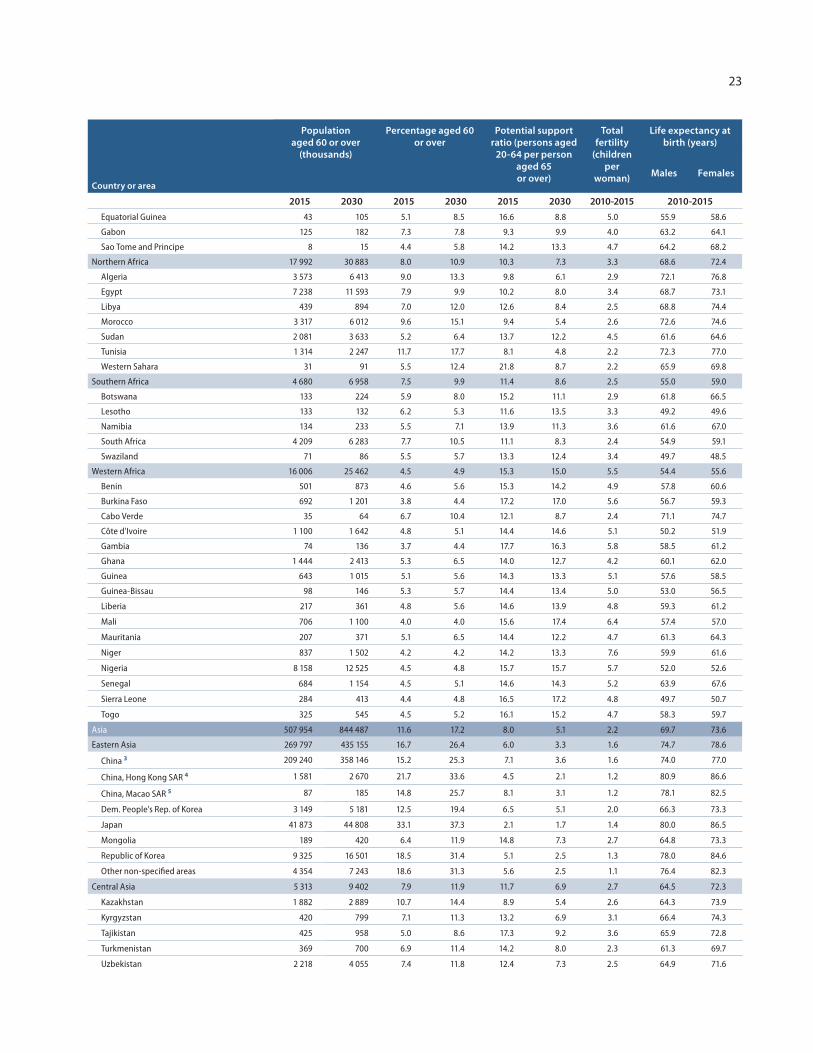
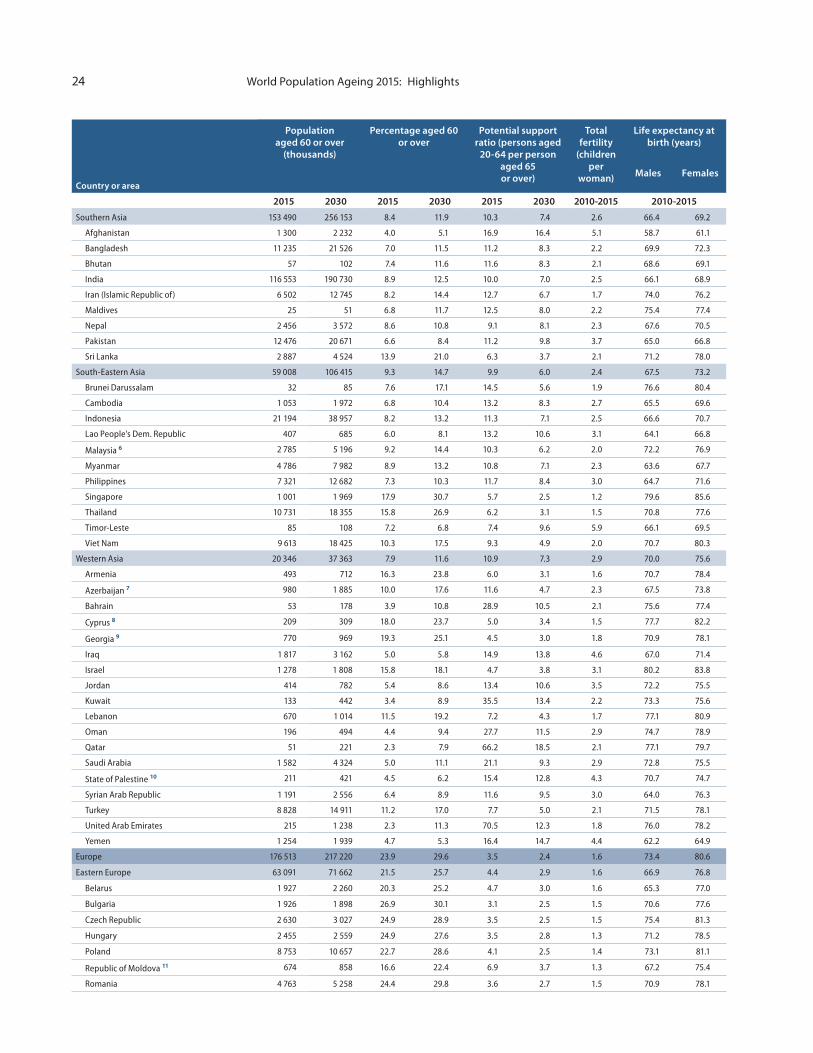
Annex table
Country or area
Population aged 60 or over
(thousands)
Percentage aged 60 or over
Potential support ratio (persons aged
20-64 per person aged 65 or over)
Total fertility
(children per
woman)
Life expectancy at birth (years)
Males Females
2015 2030 2015 2030 2015 2030 2010-2015 2010-2015
World 900 906 1 402 405 12.3 16.5 7.0 4.9 2.5 68.3 72.7
More developed regions 298 783 375 219 23.9 29.2 3.4 2.4 1.7 75.1 81.5
Less developed regions 602 123 1 027 187 9.9 14.2 9.0 5.9 2.6 66.9 70.7
Least developed countries 52 066 88 531 5.5 6.7 12.8 11.5 4.3 60.7 63.6
Other less developed countries 550 057 938 655 10.7 15.9 8.6 5.4 2.4 68.3 72.1
Less developed regions, excluding China 386 862 658 943 8.2 11.4 10.0 7.2 3.0 65.1 69.1
High-income countries 309 662 408 853 22.1 27.7 3.7 2.6 1.7 75.7 81.9
Middle-income countries 557 662 938 759 10.5 15.4 8.7 5.6 2.4 67.7 71.5
Upper-middle-income countries 320 158 544 856 13.4 21.2 7.4 4.2 1.9 71.8 76.0
Lower-middle-income countries 237 504 393 903 8.1 11.2 10.4 7.6 2.9 64.6 68.1
Low-income countries 33 161 54 040 5.2 5.8 12.7 12.5 4.9 58.7 61.9
Sub-Saharan Africa 46 455 74 504 4.8 5.3 14.0 13.6 5.1 55.9 58.4
Africa 64 447 105 387 5.4 6.3 12.9 11.7 4.7 58.2 60.9
Eastern Africa 18 868 30 818 4.8 5.3 13.6 13.4 4.9 58.9 62.2
Burundi 468 844 4.2 4.9 17.3 13.6 6.1 54.2 58.0
Comoros 36 65 4.6 6.0 16.6 13.2 4.6 61.2 64.5
Djibouti 56 97 6.3 9.2 12.7 9.5 3.3 60.0 63.2
Eritrea 218 339 4.2 4.6 16.9 16.9 4.4 60.9 65.2
Ethiopia 5 205 8 464 5.2 6.1 12.4 12.7 4.6 61.3 65.0
Kenya 2 090 3 628 4.5 5.5 16.1 13.4 4.4 59.1 62.2
Madagascar 1 128 2 091 4.7 5.8 15.6 12.9 4.5 63.0 66.0
Malawi 849 1 218 4.9 4.6 11.7 14.4 5.3 59.9 62.0
Mauritius 1 188 305 14.7 23.3 6.6 3.6 1.5 70.7 77.7
Mayotte 13 28 5.6 8.0 11.8 9.4 4.1 76.0 82.9
Mozambique 1 432 2 138 5.1 5.2 12.1 12.5 5.5 52.9 56.2
Réunion 130 241 15.1 25.5 5.7 3.0 2.2 76.0 82.9
Rwanda 527 989 4.5 6.3 16.3 12.0 4.1 59.7 66.3
Seychelles 11 19 10.9 19.1 9.1 4.4 2.3 68.7 77.9
Somalia 482 736 4.5 4.5 13.9 14.8 6.6 53.3 56.5
South Sudan 634 1 007 5.1 5.7 12.5 13.2 5.2 54.1 56.0
Uganda 1 474 2 297 3.8 3.7 15.4 18.4 5.9 55.7 58.8
United Republic of Tanzania 2 2 552 4 292 4.8 5.2 12.9 12.8 5.2 62.6 65.6
Zambia 690 1 047 4.3 4.1 13.9 16.6 5.5 57.2 60.3
Zimbabwe 686 973 4.4 4.6 15.1 16.3 4.0 53.6 56.0
Middle Africa 6 901 11 267 4.5 4.9 14.0 14.2 5.8 54.3 57.0
Angola 959 1 652 3.8 4.2 17.0 15.8 6.2 50.2 53.2
Cameroon 1 131 1 728 4.8 5.2 13.6 14.1 4.8 53.7 56.0
Central African Republic 287 404 5.9 6.2 12.0 12.3 4.4 47.8 51.3
Chad 555 867 4.0 4.0 15.8 16.8 6.3 50.1 52.2
Congo 255 414 5.5 6.1 11.9 11.5 5.0 60.0 62.9
Dem. Republic of the Congo 3 537 5 900 4.6 4.9 13.6 13.9 6.2 56.7 59.5
23
Country or area
Population aged 60 or over
(thousands)
Percentage aged 60 or over
Potential support ratio (persons aged
20-64 per person aged 65 or over)
Total fertility
(children per
woman)
Life expectancy at birth (years)
Males Females
2015 2030 2015 2030 2015 2030 2010-2015 2010-2015Equatorial Guinea 43 105 5.1 8.5 16.6 8.8 5.0 55.9 58.6
Gabon 125 182 7.3 7.8 9.3 9.9 4.0 63.2 64.1
Sao Tome and Principe 8 15 4.4 5.8 14.2 13.3 4.7 64.2 68.2
Northern Africa 17 992 30 883 8.0 10.9 10.3 7.3 3.3 68.6 72.4
Algeria 3 573 6 413 9.0 13.3 9.8 6.1 2.9 72.1 76.8
Egypt 7 238 11 593 7.9 9.9 10.2 8.0 3.4 68.7 73.1
Libya 439 894 7.0 12.0 12.6 8.4 2.5 68.8 74.4
Morocco 3 317 6 012 9.6 15.1 9.4 5.4 2.6 72.6 74.6
Sudan 2 081 3 633 5.2 6.4 13.7 12.2 4.5 61.6 64.6
Tunisia 1 314 2 247 11.7 17.7 8.1 4.8 2.2 72.3 77.0
Western Sahara 31 91 5.5 12.4 21.8 8.7 2.2 65.9 69.8
Southern Africa 4 680 6 958 7.5 9.9 11.4 8.6 2.5 55.0 59.0
Botswana 133 224 5.9 8.0 15.2 11.1 2.9 61.8 66.5
Lesotho 133 132 6.2 5.3 11.6 13.5 3.3 49.2 49.6
Namibia 134 233 5.5 7.1 13.9 11.3 3.6 61.6 67.0
South Africa 4 209 6 283 7.7 10.5 11.1 8.3 2.4 54.9 59.1
Swaziland 71 86 5.5 5.7 13.3 12.4 3.4 49.7 48.5
Western Africa 16 006 25 462 4.5 4.9 15.3 15.0 5.5 54.4 55.6
Benin 501 873 4.6 5.6 15.3 14.2 4.9 57.8 60.6
Burkina Faso 692 1 201 3.8 4.4 17.2 17.0 5.6 56.7 59.3
Cabo Verde 35 64 6.7 10.4 12.1 8.7 2.4 71.1 74.7
Côte d'Ivoire 1 100 1 642 4.8 5.1 14.4 14.6 5.1 50.2 51.9
Gambia 74 136 3.7 4.4 17.7 16.3 5.8 58.5 61.2
Ghana 1 444 2 413 5.3 6.5 14.0 12.7 4.2 60.1 62.0
Guinea 643 1 015 5.1 5.6 14.3 13.3 5.1 57.6 58.5
Guinea-Bissau 98 146 5.3 5.7 14.4 13.4 5.0 53.0 56.5
Liberia 217 361 4.8 5.6 14.6 13.9 4.8 59.3 61.2
Mali 706 1 100 4.0 4.0 15.6 17.4 6.4 57.4 57.0
Mauritania 207 371 5.1 6.5 14.4 12.2 4.7 61.3 64.3
Niger 837 1 502 4.2 4.2 14.2 13.3 7.6 59.9 61.6
Nigeria 8 158 12 525 4.5 4.8 15.7 15.7 5.7 52.0 52.6
Senegal 684 1 154 4.5 5.1 14.6 14.3 5.2 63.9 67.6
Sierra Leone 284 413 4.4 4.8 16.5 17.2 4.8 49.7 50.7
Togo 325 545 4.5 5.2 16.1 15.2 4.7 58.3 59.7
Asia 507 954 844 487 11.6 17.2 8.0 5.1 2.2 69.7 73.6
Eastern Asia 269 797 435 155 16.7 26.4 6.0 3.3 1.6 74.7 78.6
China 3 209 240 358 146 15.2 25.3 7.1 3.6 1.6 74.0 77.0
China, Hong Kong SAR 4 1 581 2 670 21.7 33.6 4.5 2.1 1.2 80.9 86.6
China, Macao SAR 5 87 185 14.8 25.7 8.1 3.1 1.2 78.1 82.5
Dem. People's Rep. of Korea 3 149 5 181 12.5 19.4 6.5 5.1 2.0 66.3 73.3
Japan 41 873 44 808 33.1 37.3 2.1 1.7 1.4 80.0 86.5
Mongolia 189 420 6.4 11.9 14.8 7.3 2.7 64.8 73.3
Republic of Korea 9 325 16 501 18.5 31.4 5.1 2.5 1.3 78.0 84.6
Other non-specified areas 4 354 7 243 18.6 31.3 5.6 2.5 1.1 76.4 82.3
Central Asia 5 313 9 402 7.9 11.9 11.7 6.9 2.7 64.5 72.3
Kazakhstan 1 882 2 889 10.7 14.4 8.9 5.4 2.6 64.3 73.9
Kyrgyzstan 420 799 7.1 11.3 13.2 6.9 3.1 66.4 74.3
Tajikistan 425 958 5.0 8.6 17.3 9.2 3.6 65.9 72.8
Turkmenistan 369 700 6.9 11.4 14.2 8.0 2.3 61.3 69.7
Uzbekistan 2 218 4 055 7.4 11.8 12.4 7.3 2.5 64.9 71.6
World Population Ageing 2015: Highlights24
Country or area
Population aged 60 or over
(thousands)
Percentage aged 60 or over
Potential support ratio (persons aged
20-64 per person aged 65 or over)
Total fertility
(children per
woman)
Life expectancy at birth (years)
Males Females
2015 2030 2015 2030 2015 2030 2010-2015 2010-2015
Southern Asia 153 490 256 153 8.4 11.9 10.3 7.4 2.6 66.4 69.2
Afghanistan 1 300 2 232 4.0 5.1 16.9 16.4 5.1 58.7 61.1
Bangladesh 11 235 21 526 7.0 11.5 11.2 8.3 2.2 69.9 72.3
Bhutan 57 102 7.4 11.6 11.6 8.3 2.1 68.6 69.1
India 116 553 190 730 8.9 12.5 10.0 7.0 2.5 66.1 68.9
Iran (Islamic Republic of) 6 502 12 745 8.2 14.4 12.7 6.7 1.7 74.0 76.2
Maldives 25 51 6.8 11.7 12.5 8.0 2.2 75.4 77.4
Nepal 2 456 3 572 8.6 10.8 9.1 8.1 2.3 67.6 70.5
Pakistan 12 476 20 671 6.6 8.4 11.2 9.8 3.7 65.0 66.8
Sri Lanka 2 887 4 524 13.9 21.0 6.3 3.7 2.1 71.2 78.0
South-Eastern Asia 59 008 106 415 9.3 14.7 9.9 6.0 2.4 67.5 73.2
Brunei Darussalam 32 85 7.6 17.1 14.5 5.6 1.9 76.6 80.4
Cambodia 1 053 1 972 6.8 10.4 13.2 8.3 2.7 65.5 69.6
Indonesia 21 194 38 957 8.2 13.2 11.3 7.1 2.5 66.6 70.7
Lao People's Dem. Republic 407 685 6.0 8.1 13.2 10.6 3.1 64.1 66.8
Malaysia 6 2 785 5 196 9.2 14.4 10.3 6.2 2.0 72.2 76.9
Myanmar 4 786 7 982 8.9 13.2 10.8 7.1 2.3 63.6 67.7
Philippines 7 321 12 682 7.3 10.3 11.7 8.4 3.0 64.7 71.6
Singapore 1 001 1 969 17.9 30.7 5.7 2.5 1.2 79.6 85.6
Thailand 10 731 18 355 15.8 26.9 6.2 3.1 1.5 70.8 77.6
Timor-Leste 85 108 7.2 6.8 7.4 9.6 5.9 66.1 69.5
Viet Nam 9 613 18 425 10.3 17.5 9.3 4.9 2.0 70.7 80.3
Western Asia 20 346 37 363 7.9 11.6 10.9 7.3 2.9 70.0 75.6
Armenia 493 712 16.3 23.8 6.0 3.1 1.6 70.7 78.4
Azerbaijan 7 980 1 885 10.0 17.6 11.6 4.7 2.3 67.5 73.8
Bahrain 53 178 3.9 10.8 28.9 10.5 2.1 75.6 77.4
Cyprus 8 209 309 18.0 23.7 5.0 3.4 1.5 77.7 82.2
Georgia 9 770 969 19.3 25.1 4.5 3.0 1.8 70.9 78.1
Iraq 1 817 3 162 5.0 5.8 14.9 13.8 4.6 67.0 71.4
Israel 1 278 1 808 15.8 18.1 4.7 3.8 3.1 80.2 83.8
Jordan 414 782 5.4 8.6 13.4 10.6 3.5 72.2 75.5
Kuwait 133 442 3.4 8.9 35.5 13.4 2.2 73.3 75.6
Lebanon 670 1 014 11.5 19.2 7.2 4.3 1.7 77.1 80.9
Oman 196 494 4.4 9.4 27.7 11.5 2.9 74.7 78.9
Qatar 51 221 2.3 7.9 66.2 18.5 2.1 77.1 79.7
Saudi Arabia 1 582 4 324 5.0 11.1 21.1 9.3 2.9 72.8 75.5
State of Palestine 10 211 421 4.5 6.2 15.4 12.8 4.3 70.7 74.7
Syrian Arab Republic 1 191 2 556 6.4 8.9 11.6 9.5 3.0 64.0 76.3
Turkey 8 828 14 911 11.2 17.0 7.7 5.0 2.1 71.5 78.1
United Arab Emirates 215 1 238 2.3 11.3 70.5 12.3 1.8 76.0 78.2
Yemen 1 254 1 939 4.7 5.3 16.4 14.7 4.4 62.2 64.9
Europe 176 513 217 220 23.9 29.6 3.5 2.4 1.6 73.4 80.6
Eastern Europe 63 091 71 662 21.5 25.7 4.4 2.9 1.6 66.9 76.8
Belarus 1 927 2 260 20.3 25.2 4.7 3.0 1.6 65.3 77.0
Bulgaria 1 926 1 898 26.9 30.1 3.1 2.5 1.5 70.6 77.6
Czech Republic 2 630 3 027 24.9 28.9 3.5 2.5 1.5 75.4 81.3
Hungary 2 455 2 559 24.9 27.6 3.5 2.8 1.3 71.2 78.5
Poland 8 753 10 657 22.7 28.6 4.1 2.5 1.4 73.1 81.1
Republic of Moldova 11 674 858 16.6 22.4 6.9 3.7 1.3 67.2 75.4
Romania 4 763 5 258 24.4 29.8 3.6 2.7 1.5 70.9 78.1

25
Country or area
Population aged 60 or over
(thousands)
Percentage aged 60 or over
Potential support ratio (persons aged
20-64 per person aged 65 or over)
Total fertility
(children per
woman)
Life expectancy at birth (years)
Males Females
2015 2030 2015 2030 2015 2030 2010-2015 2010-2015
Russian Federation 28 730 33 233 20.0 24.0 4.9 3.0 1.7 64.2 75.6
Slovakia 1 114 1 411 20.5 26.4 4.8 2.9 1.4 72.2 79.7
Ukraine 12 10 118 10 501 22.6 25.7 4.2 2.9 1.5 65.7 75.7
Northern Europe 23 968 30 820 23.4 28.0 3.3 2.6 1.9 77.8 82.3
Channel Islands 13 39 54 23.6 31.0 3.6 2.4 1.5 78.5 82.4
Denmark 1 401 1 764 24.7 29.4 3.1 2.5 1.7 78.0 81.9
Estonia 331 361 25.2 29.1 3.2 2.4 1.6 71.6 81.1
Finland 14 1 496 1 797 27.2 31.5 2.8 2.1 1.7 77.6 83.4
Iceland 63 94 19.2 25.8 4.3 2.8 2.0 80.7 83.8
Ireland 861 1 267 18.4 24.4 4.5 3.1 2.0 78.4 82.7
Latvia 506 524 25.7 29.0 3.2 2.5 1.5 68.9 78.7
Lithuania 719 761 25.0 28.7 3.2 2.5 1.6 67.4 78.8
Norway 15 1 134 1 559 21.8 26.2 3.6 2.8 1.8 79.2 83.4
Sweden 2 497 3 074 25.5 28.6 2.9 2.4 1.9 80.1 83.7
United Kingdom 16 14 889 19 521 23.0 27.8 3.3 2.6 1.9 78.5 82.4
Southern Europe 39 914 50 712 26.2 33.9 3.0 2.1 1.4 78.4 83.9
Albania 515 752 17.8 25.5 4.9 2.8 1.8 75.0 80.2
Bosnia and Herzegovina 853 1 097 22.4 30.6 4.2 2.5 1.3 73.7 78.8
Croatia 1 100 1 233 25.9 31.0 3.2 2.3 1.5 73.6 80.4
Greece 2 961 3 480 27.0 33.2 2.8 2.2 1.3 77.6 83.6
Italy 17 108 21 605 28.6 36.6 2.6 1.9 1.4 80.3 85.2
Malta 107 130 25.6 30.4 3.1 2.3 1.4 78.6 82.0
Montenegro 127 156 20.3 25.2 4.5 3.0 1.7 73.8 78.2
Portugal 2 801 3 413 27.1 34.7 2.9 2.1 1.3 77.4 83.5
Serbia 17 2 163 2 254 24.4 27.2 3.5 2.8 1.6 71.8 77.5
Slovenia 521 672 25.2 32.7 3.5 2.1 1.6 76.9 83.1
Spain 18 11 246 15 361 24.4 33.5 3.3 2.2 1.3 79.4 85.1
TFYR Macedonia 19 385 515 18.5 24.8 5.2 3.3 1.5 72.9 77.5
Western Europe 49 540 64 026 26.0 32.7 3.0 2.1 1.7 78.5 83.7
Austria 2 064 2 864 24.2 32.4 3.3 2.3 1.5 78.5 83.6
Belgium 2 725 3 544 24.1 29.5 3.3 2.4 1.8 78.0 83.0
France 16 249 20 321 25.2 29.9 3.0 2.2 2.0 78.8 84.9
Germany 22 269 28 644 27.6 36.1 2.9 1.9 1.4 78.2 83.1
Luxembourg 108 168 19.1 24.7 4.5 3.2 1.6 78.9 83.7
Netherlands 4 148 5 633 24.5 32.0 3.3 2.2 1.8 79.4 83.1
Switzerland 1 955 2 825 23.6 30.6 3.4 2.4 1.5 80.4 84.7
Latin America and the Caribbean 70 922 120 959 11.2 16.8 7.6 5.0 2.2 71.2 77.9
Caribbean 5 745 8 946 13.3 19.2 6.1 4.1 2.3 69.7 75.2
Antigua and Barbuda 10 21 10.8 19.7 8.4 4.7 2.1 73.3 78.2
Aruba 19 30 18.5 28.4 5.1 2.7 1.7 72.9 77.8
Bahamas 49 90 12.5 20.1 7.6 4.0 1.9 72.0 78.1
Barbados 56 81 19.8 27.7 4.2 2.5 1.8 72.9 77.7
Cuba 2 215 3 552 19.4 31.6 4.6 2.5 1.6 77.1 81.3
Curaçao 33 50 21.1 28.4 4.0 2.4 2.1 74.5 80.7
Dominican Republic 1 023 1 722 9.7 14.2 8.1 5.6 2.5 70.2 76.5
Grenada 11 16 10.2 14.3 8.0 5.4 2.2 70.8 75.6
Guadeloupe 20 95 150 20.2 30.5 3.9 2.3 2.2 76.8 84.0
Haiti 755 1 168 7.1 9.3 11.0 9.0 3.1 60.2 64.4
Jamaica 357 537 12.8 18.7 6.3 4.3 2.1 73.1 77.9
Martinique 104 151 26.2 38.5 3.0 1.6 2.0 77.8 84.4

World Population Ageing 2015: Highlights26
Country or area
Population aged 60 or over
(thousands)
Percentage aged 60 or over
Potential support ratio (persons aged
20-64 per person aged 65 or over)
Total fertility
(children per
woman)
Life expectancy at birth (years)
Males Females
2015 2030 2015 2030 2015 2030 2010-2015 2010-2015
Puerto Rico 723 927 19.6 25.5 4.1 3.0 1.6 75.2 83.2
Saint Lucia 23 39 12.5 19.1 6.6 4.5 1.9 72.2 77.6
St. Vincent and the Grenadines 12 21 10.9 18.3 8.1 4.5 2.0 70.7 74.9
Trinidad and Tobago 193 277 14.2 20.2 6.7 4.1 1.8 66.9 73.8
United States Virgin Islands 26 34 24.1 32.2 3.2 1.9 2.3 77.2 82.9
Central America 16 144 28 786 9.3 14.2 8.7 6.0 2.4 73.1 78.4
Belize 21 42 5.9 8.9 14.1 10.5 2.6 67.2 72.7
Costa Rica 613 1 111 12.8 20.5 6.8 4.0 1.9 76.7 81.7
El Salvador 703 1 010 11.5 15.8 6.7 5.1 2.0 67.9 77.1
Guatemala 1 145 1 834 7.0 8.6 9.8 9.0 3.3 67.9 75.0
Honduras 581 1 044 7.2 10.7 10.8 8.0 2.5 70.4 75.4
Mexico 12 177 22 094 9.6 14.9 8.7 5.8 2.3 74.0 78.9
Nicaragua 473 878 7.8 12.5 10.8 6.7 2.3 71.4 77.5
Panama 430 773 10.9 16.2 7.4 5.0 2.5 74.3 80.5
South America 49 033 83 227 11.7 17.7 7.4 4.7 2.0 70.7 78.0
Argentina 6 559 8 634 15.1 17.5 5.1 4.3 2.3 72.2 79.8
Bolivia (Plurinational State of) 988 1 499 9.2 11.4 7.9 6.8 3.0 65.3 70.2
Brazil 24 392 42 879 11.7 18.8 7.7 4.5 1.8 70.3 77.9
Chile 2 818 4 800 15.7 23.7 5.6 3.4 1.8 78.1 84.1
Colombia 5 226 9 721 10.8 18.3 8.6 4.8 1.9 70.2 77.4
Ecuador 1 602 2 840 9.9 14.5 8.2 5.5 2.6 72.8 78.4
French Guiana 21 48 7.8 12.7 10.9 6.2 3.5 75.8 82.6
Guyana 64 122 8.3 14.9 10.7 5.9 2.6 64.0 68.6
Paraguay 598 942 9.0 12.0 8.9 6.6 2.6 70.7 74.9
Peru 3 127 5 409 10.0 14.7 8.3 5.7 2.5 71.5 76.8
Suriname 56 94 10.2 15.7 8.4 5.4 2.4 67.8 74.2
Uruguay 657 796 19.1 22.1 3.9 3.4 2.0 73.3 80.4
Venezuela (Bolivarian Republic of) 2 925 5 442 9.4 14.8 9.0 5.6 2.4 69.9 78.2
Northern America 74 589 104 799 20.8 26.4 4.0 2.6 1.9 76.8 81.5
Canada 8 021 11 858 22.3 29.4 3.8 2.4 1.6 79.7 83.8
United States of America 66 545 92 906 20.7 26.1 4.0 2.7 1.9 76.5 81.3
Oceania 6 481 9 553 16.5 20.2 4.8 3.5 2.4 75.3 79.7
Australia/New Zealand 5 808 8 391 20.4 25.0 4.0 2.8 1.9 79.9 84.1
Australia 21 4 887 7 014 20.4 24.6 4.0 2.9 1.9 79.9 84.3
New Zealand 921 1 378 20.3 27.0 3.9 2.6 2.1 79.7 83.4
Melanesia 555 950 5.8 7.7 14.2 11.1 3.7 61.9 66.3
Fiji 83 134 9.3 14.3 9.7 5.6 2.6 66.9 72.9
New Caledonia 38 61 14.5 19.6 5.9 4.2 2.1 73.6 79.3
Papua New Guinea 387 671 5.1 6.7 16.3 13.2 3.8 60.3 64.5
Solomon Islands 30 52 5.2 6.9 13.7 12.0 4.1 66.2 69.0
Vanuatu 17 32 6.5 9.1 11.8 8.6 3.4 69.6 73.6
Micronesia 51 95 9.7 15.6 9.0 5.1 2.8 70.5 75.3
Guam 22 40 13.0 19.9 6.5 3.8 2.4 76.1 81.5
Kiribati 7 13 6.1 9.3 13.7 8.8 3.8 62.6 68.9
Micronesia (Fed. States of) 8 11 7.5 9.1 11.3 7.9 3.3 68.0 69.9
Polynesia 67 117 9.8 15.6 8.3 5.1 3.0 71.7 77.1
French Polynesia 33 62 11.6 19.7 8.2 4.4 2.1 74.0 78.6
Samoa 15 25 7.9 12.1 8.9 6.0 4.2 70.0 76.4
Tonga 9 13 8.2 10.5 7.9 7.1 3.8 69.7 75.6

27
Notes 1 Including Agalega, Rodrigues, and Saint Brandon. 2 Including Zanzibar. 3 For statistical purposes, the data for China do not include Hong Kong and Macao, Special
Administrative Regions (SAR) of China, and Taiwan Province of China. 4 As of 1 July 1997, Hong Kong became a Special Administrative Region (SAR) of China. 5 As of 20 December 1999, Macao became a Special Administrative Region (SAR) of China. 6 Including Sabah and Sarawak. 7 Including Nagorno-Karabakh. 8 Refers to the whole country. 9 Including Abkhazia and South Ossetia. 10 Including East Jerusalem. 11 Including Transnistria. 12 Including Crimea. 13 Refers to Guernsey and Jersey. 14 Including Åland Islands. 15 Including Svalbard and Jan Mayen Islands. 16 Refers to the United Kingdom of Great Britain and Northern Ireland. 17 Including Kosovo. 18 Including Canary Islands, Ceuta and Melilla. 19 The Former Yugoslav Republic of Macedonia. 20 Including Saint-Barthélemy and Saint-Martin (French part). 21 Including Christmas Island, Cocos (Keeling) Islands, and Norfolk Island.
15-1
3635
ISBN 978-92-1-151538-1
Accurate, consistent and timely data on global trends in population age structure are critical for assessing current and future needs with respect to population ageing and for setting policy priorities to promote the well-being of the growing number and share of older persons in the population. This publication presents the highlights of the World Population Ageing 2015 report, which summarizes the trends in population ageing drawn from the latest United Nations estimates and projections of population by age and sex for 233 countries or areas, as published in World Population Prospects: the 2015 Revision. The present Highlights focuses in particular on the period from 2015 to 2030, the implementation period identified for the 2030 Agenda for Sustainable Development, and discusses some implications of trends in the number and share of older persons for development planning.