world investment report2017 -...
TRANSCRIPT
New York and Geneva, 2017
WORLD INVESTMENT
REPORT2017
U N I T E D N AT I O N S C O N F E R E N C E O N T R A D E A N D D E V E L O P M E N T
KEY MESSAGES AND OVERVIEW
INVESTMENT AND THE DIGITAL ECONOMY
NOTE
Copyright © United Nations, 2017All rights reserved
Printed at United Nations, Geneva
The Division on Investment and Enterprise of UNCTAD serves as the focal point for all matters related to foreign direct investment and multinational enterprises in the United Nations System. It builds on more than four decades of experience and international expertise in research and policy analysis on investment and enterprise development, fosters intergovernmental consensus-building, and provides technical assistance to over 150 countries.
The copyright of the material in this publication rests with UNCTAD. It may be freely quoted or reprinted, but acknowledgement is requested, together with a reference to UNCTAD and this Report. A copy of the publication containing the quotation or reprint should be sent to the UNCTAD Secretariat (e-mail: [email protected]).
The Overview is prepared based on the in-depth analysis contained in World Investment Report 2017. Investment and the Digital Economy (United Nations publication, Sales No. E.17.II.D.3).
UNCTAD/WIR/2017 (Overview)
ii World Investment Report 2017 Investment and the Digital Economy
António Guterres Secretary-General of the United Nations
In 2016, global flows of foreign direct investment fell by about 2 per cent, to $1.75 trillion. Investment in developing countries declined even more, by 14 per cent, and flows to LDCs and structurally weak economies remain volatile and low. Although UNCTAD predicts a modest recovery of FDI flows in 2017–2018, they are expected to remain well below their 2007 peak.
These developments are troublesome, especially considering the enormous investment needs associated with the Sustainable Development Goals, detailed in UNCTAD’s Action Plan for Investment in the SDGs. Progress on sustainable development – and lasting peace – requires more investment in basic infrastructure, energy, water and sanitation, climate change mitigation, health and education, as well as investment in productive capacity to generate jobs and income growth.
Now more than ever it is important to ensure that the global policy environment remains conducive to investment in sustainable development. UNCTAD plays an important role in this, by providing guidance on national and international investment policy regimes. Its Investment Policy Framework and Roadmap for Reform of International Investment Agreements have been used by more than 130 countries in formulating a new generation of investment policies. This year’s World Investment Report builds on that track record and presents policy advice on how to deal with close to 3,000 old-generation investment treaties.
A key challenge for policymakers in today’s global economy is digital development. The theme chapter of the Report this year shows that the digital economy is having a major impact on global patterns of investment. It provides important insights on the implications of the digital economy for investment policies designed for the analogue era, and suggests how investment policy can support digital development.
I commend this Report as an important tool for the international investment and development community.
PREFACE
iiiPreface
The digital economy is becoming an ever more important part of the global economy. It offers many new opportunities for inclusive and sustainable development. It also comes with serious policy challenges – starting with the need to bridge the digital divide. Both the opportunities and challenges are top policy priorities for developing countries.
The digital economy is fundamentally changing the way firms produce and market goods and services across borders. Digital multinationals can communicate with and sell to customers overseas without the need for much physical investment in foreign markets. Their economic impact on host countries is thus more ethereal and less directly visible in productive capacity generation and job creation. And, today, the digital economy is no longer just about the technology sector and digital firms, it is increasingly about the digitalization of supply chains across all sectors of the global economy.
The digital transformation of international production has important implications for investment promotion and facilitation, and for regulations governing investor behaviour. Rules designed for the physical economy may need to be reviewed in light of new digital business models. Some countries have already taken steps to modernize policies; others face the risk of letting rules become obsolete or of unintentionally slowing down digital development.
Because it is not just about digital multinationals. It is also about developing domestic digital capacities. Many countries around the world have development strategies for the digital economy. Yet most of these strategies fail to adequately address investment issues. And those that do tend to focus exclusively on investment in telecommunication infrastructure. The investment policy dimension of digital development strategies should be broadened to enabling domestic firms to reap the benefits of digitalization and easier access to global markets.
The World Investment Report 2017 makes a cogent argument for a comprehensive investment policy framework for the digital economy. It demonstrates how aligning investment policies with digital development strategies will play a pivotal role in the gainful integration of developing countries into the global economy and in a more inclusive and sustainable globalization in the years to come. This is an indelible contribution to the discourse on how to narrow the digital divide and meet the enormous investment challenges of the 2030 agenda on sustainable development. I commend this report to the SDG policy community.
FOREWORD
Mukhisa Kituyi
Secretary-General of UNCTAD
iv World Investment Report 2017 Investment and the Digital Economy
The World Investment Report 2017 (WIR17) was prepared by a team led by James X. Zhan. The team members included Richard Bolwijn, Bruno Casella, Hamed El-Kady, Kumi Endo, Thomas van Giffen, Michael Hanni, Kálmán Kalotay, Joachim Karl, Hee Jae Kim, Ventzislav Kotetzov, Isya Kresnadi, Guoyong Liang, Hafiz Mirza, Shin Ohinata, Diana Rosert, Astrit Sulstarova, Claudia Trentini, Elisabeth Tuerk, Joerg Weber and Kee Hwee Wee.
Research support and inputs were provided by Jorun Baumgartner, Lorenzo Formenti, Mark Huber, Malvika Monga and Linli Yu. Contributions were also made by Dafina Atanasova, Charalampos Giannakopoulos, Natalia Guerra, Mathabo Le Roux, Anthony Miller, Abraham Negash, Moritz Obst, Sergey Ripinsky, Jacqueline Salguero Huaman, Ilan Strauss as well as interns Anastasia Bessonova, Mohamed Mrad Namji and Armando Pascale.
Statistical assistance was provided by Bradley Boicourt, Mohamed Chiraz Baly and Lizanne Martinez.
The manuscript was edited with the assistance of Caroline Lambert and copy-edited by Lise Lingo. Pablo Cortizo was responsible for the design of charts, maps and infographics; he and Laurence Duchemin typeset the report. Production of WIR17 was supported by Elisabeth Anodeau-Mareschal, Anne Bouchet, Nathalie Eulaerts, Rosalina Goyena, Peter Navarrette, Sivanla Sikounnavong and Katia Vieu.
WIR17 benefited from the advice of Michael Kende. At various stages of preparation, in particular during the expert meetings organized to discuss drafts, the team received comments and inputs from these experts: Azar Aliyev, Robert Atkinson, Nathalie Bernasconi, Philippa Biggs, Lisa Borgatti, Jansen Calamita, Patrice Chazerand, Silvia Constain, Christopher Foster, Torbjörn Fredriksson, Xiaolan Fu, Masataka Fujita, Ambika Khurana, Markus Krajewski, Simon Lacey, James Lockett, Fernando Loureiro, Erik van der Marel, Makane Moïse Mbengue, Teresa Moreira, Jan Mischke, Ghislain Nkeramugaba, Davide Rigo, Cristián Rodríguez Chiffelle, Stephan Schill, Jagjit Singh Srai, Leonard Stiegeler, Alykhan Vira and Eric White.
Also acknowledged are comments received from other UNCTAD divisions as part of the internal peer review process, as well as comments from the Office of the Secretary-General. The United Nations Cartographic Section provided advice for the regional maps.
Numerous officials of central banks, government agencies, international organizations and non-governmental organizations also contributed to WIR17. In addition, UNCTAD appreciates the support of all the MNE and IPA executives who responded to its 2017 World Investment Prospects and Investment Promotion Agencies surveys. The financial support of the Government of Sweden is gratefully acknowledged.
ACKNOWLEDGEMENTS
vAcknowledgements
TABLE OF CONTENTS
PREFACE . . . . . . . . . . . . . . . . . . . . . . . . . . . . . . . . . . . . . . . . . . . . iii
FOREWORD . . . . . . . . . . . . . . . . . . . . . . . . . . . . . . . . . . . . . . . . . . iv
ACKNOWLEDGEMENTS . . . . . . . . . . . . . . . . . . . . . . . . . . . . . . . . v
KEY MESSAGES . . . . . . . . . . . . . . . . . . . . . . . . . . . . . . . . . . . . . vii
OVERVIEW . . . . . . . . . . . . . . . . . . . . . . . . . . . . . . . . . . . . . . . . . . 1
INVESTMENT PROSPECTS . . . . . . . . . . . . . . . . . . . . . . . . . . . 1
GLOBAL INVESTMENT TRENDS . . . . . . . . . . . . . . . . . . . . . . . 6
REGIONAL INVESTMENT TRENDS . . . . . . . . . . . . . . . . . . . . 15
INVESTMENT POLICY TRENDS . . . . . . . . . . . . . . . . . . . . . . . 20
INVESTMENT AND THE DIGITAL ECONOMY . . . . . . . . . . . . . 30
vi World Investment Report 2017 Investment and the Digital Economy
KEY MESSAGES
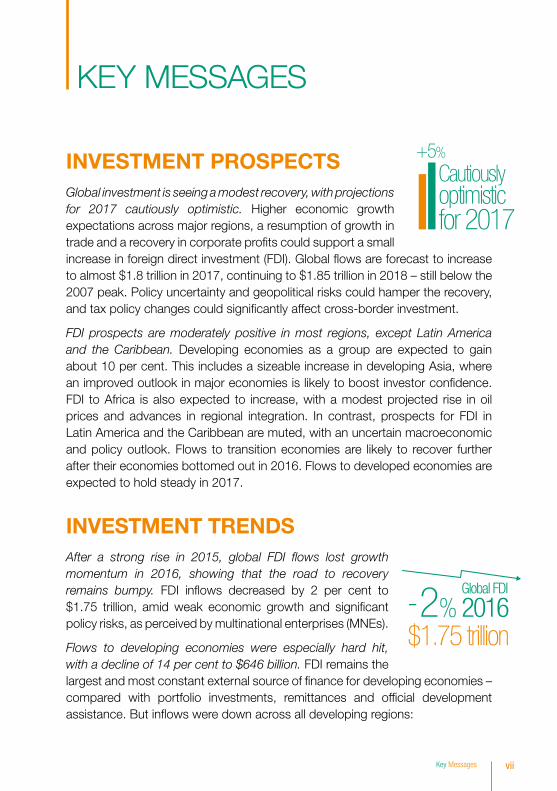
INVESTMENT PROSPECTSGlobal investment is seeing a modest recovery, with projections for 2017 cautiously optimistic. Higher economic growth expectations across major regions, a resumption of growth in trade and a recovery in corporate profits could support a small increase in foreign direct investment (FDI). Global flows are forecast to increase to almost $1.8 trillion in 2017, continuing to $1.85 trillion in 2018 – still below the 2007 peak. Policy uncertainty and geopolitical risks could hamper the recovery, and tax policy changes could significantly affect cross-border investment.
FDI prospects are moderately positive in most regions, except Latin America and the Caribbean. Developing economies as a group are expected to gain about 10 per cent. This includes a sizeable increase in developing Asia, where an improved outlook in major economies is likely to boost investor confidence. FDI to Africa is also expected to increase, with a modest projected rise in oil prices and advances in regional integration. In contrast, prospects for FDI in Latin America and the Caribbean are muted, with an uncertain macroeconomic and policy outlook. Flows to transition economies are likely to recover further after their economies bottomed out in 2016. Flows to developed economies are expected to hold steady in 2017.
INVESTMENT TRENDSAfter a strong rise in 2015, global FDI flows lost growth momentum in 2016, showing that the road to recovery remains bumpy. FDI inflows decreased by 2 per cent to $1.75 trillion, amid weak economic growth and significant policy risks, as perceived by multinational enterprises (MNEs).
Flows to developing economies were especially hard hit, with a decline of 14 per cent to $646 billion. FDI remains the largest and most constant external source of finance for developing economies – compared with portfolio investments, remittances and official development assistance. But inflows were down across all developing regions:
79%
21%
Restr
iction
/Reg
ulatio
n
Liber
aliza
tion/
Prom
otion
National investment policy measures
Total IIAs3,324
37in 2016
+
ISDS cases62New
$1.75 trillion
chaper 1-2
chaper 3
chaper 4
Global FDI
2016
Global FDI �ows
Developed $1 032 bn
Developing$646 bn
Transition$68 bn
2005–2016
Cautiouslyoptimisticfor 2017
+5%
2%-
A growing role of SO-MNEsin the global economy
1 500 State-owned MNEs
foreign86 000 af�liates
Phase 2
IIA reformoptions10
1
2
3
4
5
6
7
8
9
10
lost growth momentum
UNCTAD'sNEW Top 100Digital MNEs
Less than
of25 Strategies
DigitalDevelopment
%
Asset light:
70%sales
abroad
40%assetsabroad
Investmentcost estimates:
More stock exchangesintroducing sustainabilityreporting guidance
2004–20171
32
viiKey Messages
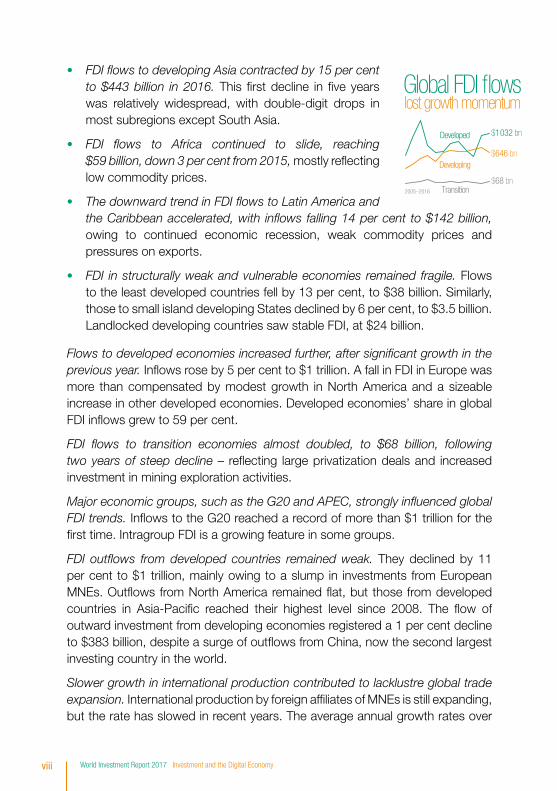
• FDI flows to developing Asia contracted by 15 per cent to $443 billion in 2016. This first decline in five years was relatively widespread, with double-digit drops in most subregions except South Asia.
• FDI flows to Africa continued to slide, reaching $59 billion, down 3 per cent from 2015, mostly reflecting low commodity prices.
• The downward trend in FDI flows to Latin America and the Caribbean accelerated, with inflows falling 14 per cent to $142 billion, owing to continued economic recession, weak commodity prices and pressures on exports.
• FDI in structurally weak and vulnerable economies remained fragile. Flows to the least developed countries fell by 13 per cent, to $38 billion. Similarly, those to small island developing States declined by 6 per cent, to $3.5 billion. Landlocked developing countries saw stable FDI, at $24 billion.
Flows to developed economies increased further, after significant growth in the previous year. Inflows rose by 5 per cent to $1 trillion. A fall in FDI in Europe was more than compensated by modest growth in North America and a sizeable increase in other developed economies. Developed economies’ share in global FDI inflows grew to 59 per cent.
FDI flows to transition economies almost doubled, to $68 billion, following two years of steep decline – reflecting large privatization deals and increased investment in mining exploration activities.
Major economic groups, such as the G20 and APEC, strongly influenced global FDI trends. Inflows to the G20 reached a record of more than $1 trillion for the first time. Intragroup FDI is a growing feature in some groups.
FDI outflows from developed countries remained weak. They declined by 11 per cent to $1 trillion, mainly owing to a slump in investments from European MNEs. Outflows from North America remained flat, but those from developed countries in Asia-Pacific reached their highest level since 2008. The flow of outward investment from developing economies registered a 1 per cent decline to $383 billion, despite a surge of outflows from China, now the second largest investing country in the world.
Slower growth in international production contributed to lacklustre global trade expansion. International production by foreign affiliates of MNEs is still expanding, but the rate has slowed in recent years. The average annual growth rates over
79%
21%
Restr
iction
/Reg
ulatio
n
Liber
aliza
tion/
Prom
otion
National investment policy measures
Total IIAs3,324
37in 2016
+
ISDS cases62New
$1.75 trillion
chaper 1-2
chaper 3
chaper 4
Global FDI
2016
Global FDI �ows
Developed $1 032 bn
Developing$646 bn
Transition$68 bn
2005–2016
Cautiouslyoptimisticfor 2017
+5%
2%-
A growing role of SO-MNEsin the global economy
1 500 State-owned MNEs
foreign86 000 af�liates
Phase 2
IIA reformoptions10
1
2
3
4
5
6
7
8
9
10
lost growth momentum
UNCTAD'sNEW Top 100Digital MNEs
Less than
of25 Strategies
DigitalDevelopment
%
Asset light:
70%sales
abroad
40%assetsabroad
Investmentcost estimates:
More stock exchangesintroducing sustainabilityreporting guidance
2004–20171
32
viii World Investment Report 2017 Investment and the Digital Economy
the last five years of foreign affiliate sales (7.3 per cent), value added (4.9 per cent) and employment (4.9 per cent) were all lower than in the equivalent period before 2010 (at 9.7 per cent, 10.7 per cent and 7.6 per cent, respectively).
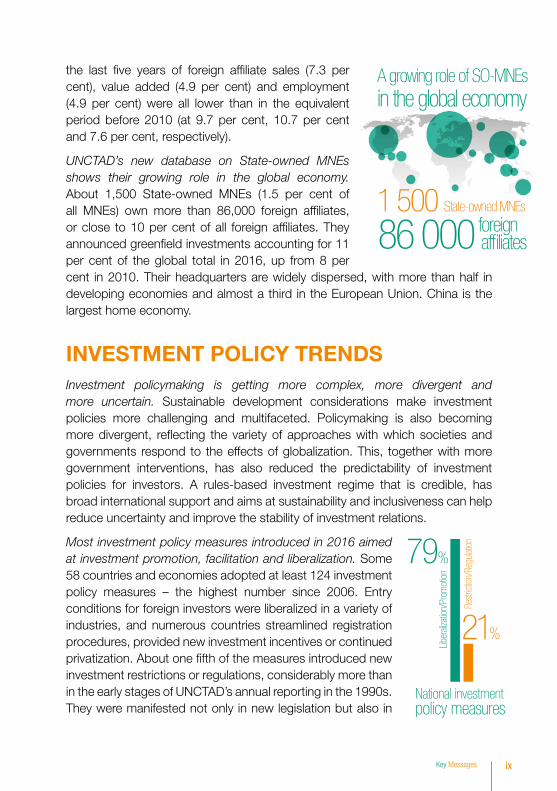
UNCTAD’s new database on State-owned MNEs shows their growing role in the global economy. About 1,500 State-owned MNEs (1.5 per cent of all MNEs) own more than 86,000 foreign affiliates, or close to 10 per cent of all foreign affiliates. They announced greenfield investments accounting for 11 per cent of the global total in 2016, up from 8 per cent in 2010. Their headquarters are widely dispersed, with more than half in developing economies and almost a third in the European Union. China is the largest home economy.
INVESTMENT POLICY TRENDSInvestment policymaking is getting more complex, more divergent and more uncertain. Sustainable development considerations make investment policies more challenging and multifaceted. Policymaking is also becoming more divergent, reflecting the variety of approaches with which societies and governments respond to the effects of globalization. This, together with more government interventions, has also reduced the predictability of investment policies for investors. A rules-based investment regime that is credible, has broad international support and aims at sustainability and inclusiveness can help reduce uncertainty and improve the stability of investment relations.
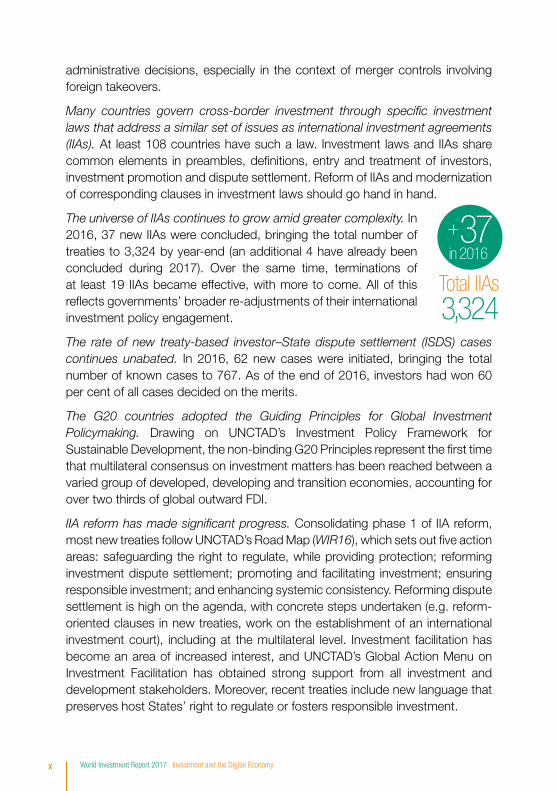
Most investment policy measures introduced in 2016 aimed at investment promotion, facilitation and liberalization. Some 58 countries and economies adopted at least 124 investment policy measures – the highest number since 2006. Entry conditions for foreign investors were liberalized in a variety of industries, and numerous countries streamlined registration procedures, provided new investment incentives or continued privatization. About one fifth of the measures introduced new investment restrictions or regulations, considerably more than in the early stages of UNCTAD’s annual reporting in the 1990s. They were manifested not only in new legislation but also in
79%
21%Re
strict
ion/R
egula
tion
Liber
aliza
tion/
Prom
otion
National investment policy measures
Total IIAs3,324
37in 2016
+
ISDS cases62New
$1.75 trillion
chaper 1-2
chaper 3
chaper 4
Global FDI
2016
Global FDI �ows
Developed $1 032 bn
Developing$646 bn
Transition$68 bn
2005–2016
Cautiouslyoptimisticfor 2017
+5%
2%-
A growing role of SO-MNEsin the global economy
1 500 State-owned MNEs
foreign86 000 af�liates
Phase 2
IIA reformoptions10
1
2
3
4
5
6
7
8
9
10
lost growth momentum
UNCTAD'sNEW Top 100Digital MNEs
Less than
of25 Strategies
DigitalDevelopment
%
Asset light:
70%sales
abroad
40%assetsabroad
Investmentcost estimates:
More stock exchangesintroducing sustainabilityreporting guidance
2004–20171
32
79%
21%
Restr
iction
/Reg
ulatio
n
Liber
aliza
tion/
Prom
otion
National investment policy measures
Total IIAs3,324
37in 2016
+
ISDS cases62New
$1.75 trillion
chaper 1-2
chaper 3
chaper 4
Global FDI
2016
Global FDI �ows
Developed $1 032 bn
Developing$646 bn
Transition$68 bn
2005–2016
Cautiouslyoptimisticfor 2017
+5%
2%-
A growing role of SO-MNEsin the global economy
1 500 State-owned MNEs
foreign86 000 af�liates
Phase 2
IIA reformoptions10
1
2
3
4
5
6
7
8
9
10
lost growth momentum
UNCTAD'sNEW Top 100Digital MNEs
Less than
of25 Strategies
DigitalDevelopment
%
Asset light:
70%sales
abroad
40%assetsabroad
Investmentcost estimates:
More stock exchangesintroducing sustainabilityreporting guidance
2004–20171
32
ixKey Messages
administrative decisions, especially in the context of merger controls involving foreign takeovers.
Many countries govern cross-border investment through specific investment laws that address a similar set of issues as international investment agreements (IIAs). At least 108 countries have such a law. Investment laws and IIAs share common elements in preambles, definitions, entry and treatment of investors, investment promotion and dispute settlement. Reform of IIAs and modernization of corresponding clauses in investment laws should go hand in hand.
The universe of IIAs continues to grow amid greater complexity. In 2016, 37 new IIAs were concluded, bringing the total number of treaties to 3,324 by year-end (an additional 4 have already been concluded during 2017). Over the same time, terminations of at least 19 IIAs became effective, with more to come. All of this reflects governments’ broader re-adjustments of their international investment policy engagement.
The rate of new treaty-based investor–State dispute settlement (ISDS) cases continues unabated. In 2016, 62 new cases were initiated, bringing the total number of known cases to 767. As of the end of 2016, investors had won 60 per cent of all cases decided on the merits.
The G20 countries adopted the Guiding Principles for Global Investment Policymaking. Drawing on UNCTAD’s Investment Policy Framework for Sustainable Development, the non-binding G20 Principles represent the first time that multilateral consensus on investment matters has been reached between a varied group of developed, developing and transition economies, accounting for over two thirds of global outward FDI.
IIA reform has made significant progress. Consolidating phase 1 of IIA reform, most new treaties follow UNCTAD’s Road Map (WIR16), which sets out five action areas: safeguarding the right to regulate, while providing protection; reforming investment dispute settlement; promoting and facilitating investment; ensuring responsible investment; and enhancing systemic consistency. Reforming dispute settlement is high on the agenda, with concrete steps undertaken (e.g. reform-oriented clauses in new treaties, work on the establishment of an international investment court), including at the multilateral level. Investment facilitation has become an area of increased interest, and UNCTAD’s Global Action Menu on Investment Facilitation has obtained strong support from all investment and development stakeholders. Moreover, recent treaties include new language that preserves host States’ right to regulate or fosters responsible investment.
79%
21%
Restr
iction
/Reg
ulatio
n
Liber
aliza
tion/
Prom
otion
National investment policy measures
Total IIAs3,324
37in 2016
+
ISDS cases62New
$1.75 trillion
chaper 1-2
chaper 3
chaper 4
Global FDI
2016
Global FDI �ows
Developed $1 032 bn
Developing$646 bn
Transition$68 bn
2005–2016
Cautiouslyoptimisticfor 2017
+5%
2%-
A growing role of SO-MNEsin the global economy
1 500 State-owned MNEs
foreign86 000 af�liates
Phase 2
IIA reformoptions10
1
2
3
4
5
6
7
8
9
10
lost growth momentum
UNCTAD'sNEW Top 100Digital MNEs
Less than
of25 Strategies
DigitalDevelopment
%
Asset light:
70%sales
abroad
40%assetsabroad
Investmentcost estimates:
More stock exchangesintroducing sustainabilityreporting guidance
2004–20171
32
x World Investment Report 2017 Investment and the Digital Economy
It is time to move to phase 2 of IIA reform: modernizing the existing stock of old-generation treaties. Old treaties abound: more than 2,500 IIAs in force today (95 per cent of all treaties in force) were concluded before 2010. Old treaties “bite”: as of end-2016, virtually all known ISDS cases were based on those treaties. And old treaties perpetuate inconsistencies: their continued existence creates overlaps and fragmentation in treaty relationships and poses interaction challenges.
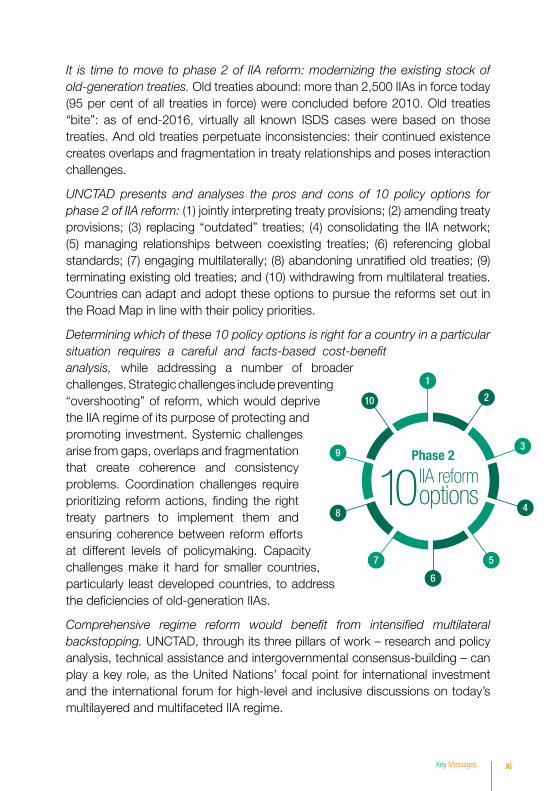
UNCTAD presents and analyses the pros and cons of 10 policy options for phase 2 of IIA reform: (1) jointly interpreting treaty provisions; (2) amending treaty provisions; (3) replacing “outdated” treaties; (4) consolidating the IIA network; (5) managing relationships between coexisting treaties; (6) referencing global standards; (7) engaging multilaterally; (8) abandoning unratified old treaties; (9) terminating existing old treaties; and (10) withdrawing from multilateral treaties. Countries can adapt and adopt these options to pursue the reforms set out in the Road Map in line with their policy priorities.
Determining which of these 10 policy options is right for a country in a particular situation requires a careful and facts-based cost-benefit analysis, while addressing a number of broader challenges. Strategic challenges include preventing “overshooting” of reform, which would deprive the IIA regime of its purpose of protecting and promoting investment. Systemic challenges arise from gaps, overlaps and fragmentation that create coherence and consistency problems. Coordination challenges require prioritizing reform actions, finding the right treaty partners to implement them and ensuring coherence between reform efforts at different levels of policymaking. Capacity challenges make it hard for smaller countries, particularly least developed countries, to address the deficiencies of old-generation IIAs.
Comprehensive regime reform would benefit from intensified multilateral backstopping. UNCTAD, through its three pillars of work – research and policy analysis, technical assistance and intergovernmental consensus-building – can play a key role, as the United Nations’ focal point for international investment and the international forum for high-level and inclusive discussions on today’s multilayered and multifaceted IIA regime.
79%
21%
Restr
iction
/Reg
ulatio
n
Liber
aliza
tion/
Prom
otion
National investment policy measures
Total IIAs3,324
37in 2016
+
ISDS cases62New
$1.75 trillion
chaper 1-2
chaper 3
chaper 4
Global FDI
2016
Global FDI �ows
Developed $1 032 bn
Developing$646 bn
Transition$68 bn
2005–2016
Cautiouslyoptimisticfor 2017
+5%
2%-
A growing role of SO-MNEsin the global economy
1 500 State-owned MNEs
foreign86 000 af�liates
Phase 2
IIA reformoptions10
1
2
3
4
5
6
7
8
9
10
lost growth momentum
UNCTAD'sNEW Top 100Digital MNEs
Less than
of25 Strategies
DigitalDevelopment
%
Asset light:
70%sales
abroad
40%assetsabroad
Investmentcost estimates:
More stock exchangesintroducing sustainabilityreporting guidance
2004–20171
32
xiKey Messages
The world is seeing rapid growth of capital-market-related policies and instruments designed to promote investment in sustainable businesses and to support the achievement of the Sustainable Development Goals (SDGs). These policies and instruments are emanating primarily from stock exchanges and their regulators, but with strong involvement from other capital market stakeholders such as institutional investors. Stock exchanges are positioned to influence investors and companies in a way few other actors can – through new products and services, as well as through support for regulators in promoting the adoption of market standards.
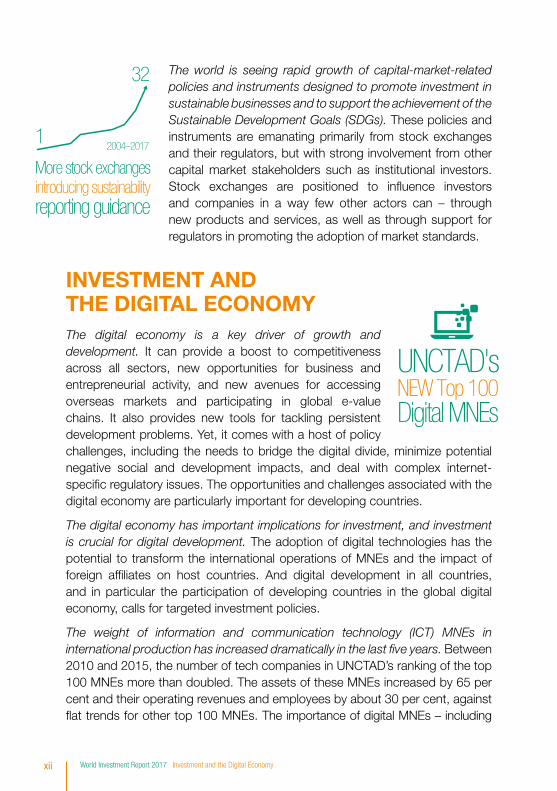
INVESTMENT AND THE DIGITAL ECONOMYThe digital economy is a key driver of growth and development. It can provide a boost to competitiveness across all sectors, new opportunities for business and entrepreneurial activity, and new avenues for accessing overseas markets and participating in global e-value chains. It also provides new tools for tackling persistent development problems. Yet, it comes with a host of policy challenges, including the needs to bridge the digital divide, minimize potential negative social and development impacts, and deal with complex internet-specific regulatory issues. The opportunities and challenges associated with the digital economy are particularly important for developing countries.
The digital economy has important implications for investment, and investment is crucial for digital development. The adoption of digital technologies has the potential to transform the international operations of MNEs and the impact of foreign affiliates on host countries. And digital development in all countries, and in particular the participation of developing countries in the global digital economy, calls for targeted investment policies.
The weight of information and communication technology (ICT) MNEs in international production has increased dramatically in the last five years. Between 2010 and 2015, the number of tech companies in UNCTAD’s ranking of the top 100 MNEs more than doubled. The assets of these MNEs increased by 65 per cent and their operating revenues and employees by about 30 per cent, against flat trends for other top 100 MNEs. The importance of digital MNEs – including
79%
21%
Restr
iction
/Reg
ulatio
n
Liber
aliza
tion/
Prom
otion
National investment policy measures
Total IIAs3,324
37in 2016
+
ISDS cases62New
$1.75 trillion
chaper 1-2
chaper 3
chaper 4
Global FDI
2016
Global FDI �ows
Developed $1 032 bn
Developing$646 bn
Transition$68 bn
2005–2016
Cautiouslyoptimisticfor 2017
+5%
2%-
A growing role of SO-MNEsin the global economy
1 500 State-owned MNEs
foreign86 000 af�liates
Phase 2
IIA reformoptions10
1
2
3
4
5
6
7
8
9
10
lost growth momentum
UNCTAD'sNEW Top 100Digital MNEs
Less than
of25 Strategies
DigitalDevelopment
%
Asset light:
70%sales
abroad
40%assetsabroad
Investmentcost estimates:
More stock exchangesintroducing sustainabilityreporting guidance
2004–20171
32
xii World Investment Report 2017 Investment and the Digital Economy
internet platforms, e-commerce and digital content firms – is also growing rapidly. WIR17 presents a new top 100, ranking digital MNEs and their international production footprint.
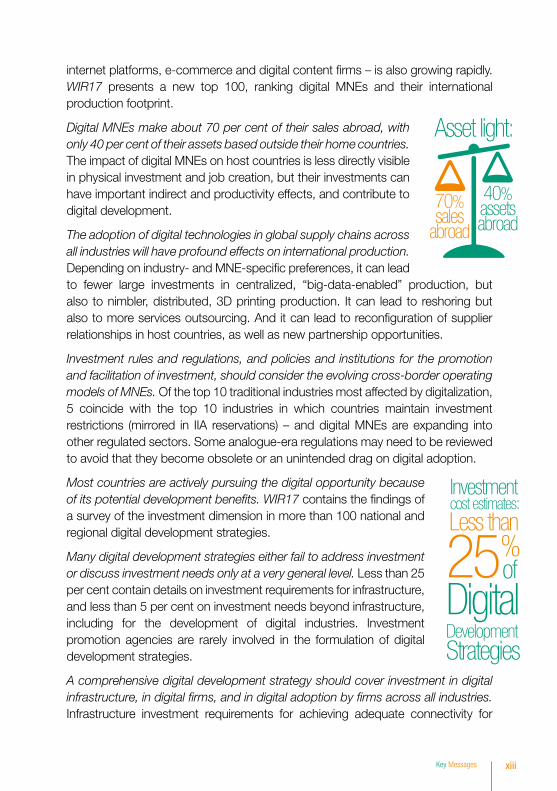
Digital MNEs make about 70 per cent of their sales abroad, with only 40 per cent of their assets based outside their home countries. The impact of digital MNEs on host countries is less directly visible in physical investment and job creation, but their investments can have important indirect and productivity effects, and contribute to digital development.
The adoption of digital technologies in global supply chains across all industries will have profound effects on international production. Depending on industry- and MNE-specific preferences, it can lead to fewer large investments in centralized, “big-data-enabled” production, but also to nimbler, distributed, 3D printing production. It can lead to reshoring but also to more services outsourcing. And it can lead to reconfiguration of supplier relationships in host countries, as well as new partnership opportunities.
Investment rules and regulations, and policies and institutions for the promotion and facilitation of investment, should consider the evolving cross-border operating models of MNEs. Of the top 10 traditional industries most affected by digitalization, 5 coincide with the top 10 industries in which countries maintain investment restrictions (mirrored in IIA reservations) – and digital MNEs are expanding into other regulated sectors. Some analogue-era regulations may need to be reviewed to avoid that they become obsolete or an unintended drag on digital adoption.
Most countries are actively pursuing the digital opportunity because of its potential development benefits. WIR17 contains the findings of a survey of the investment dimension in more than 100 national and regional digital development strategies.
Many digital development strategies either fail to address investment or discuss investment needs only at a very general level. Less than 25 per cent contain details on investment requirements for infrastructure, and less than 5 per cent on investment needs beyond infrastructure, including for the development of digital industries. Investment promotion agencies are rarely involved in the formulation of digital development strategies.
A comprehensive digital development strategy should cover investment in digital infrastructure, in digital firms, and in digital adoption by firms across all industries. Infrastructure investment requirements for achieving adequate connectivity for
79%
21%
Restr
iction
/Reg
ulatio
n
Liber
aliza
tion/
Prom
otion
National investment policy measures
Total IIAs3,324
37in 2016
+
ISDS cases62New
$1.75 trillion
chaper 1-2
chaper 3
chaper 4
Global FDI
2016
Global FDI �ows
Developed $1 032 bn
Developing$646 bn
Transition$68 bn
2005–2016
Cautiouslyoptimisticfor 2017
+5%
2%-
A growing role of SO-MNEsin the global economy
1 500 State-owned MNEs
foreign86 000 af�liates
Phase 2
IIA reformoptions10
1
2
3
4
5
6
7
8
9
10
lost growth momentum
UNCTAD'sNEW Top 100Digital MNEs
Less than
of25 Strategies
DigitalDevelopment
%
Asset light:
70%sales
abroad
40%assetsabroad
Investmentcost estimates:
More stock exchangesintroducing sustainabilityreporting guidance
2004–20171
32
xiiiKey Messages
most developing countries could be less daunting than often supposed; UNCTAD estimates the investment costs associated with near universal basic 3G coverage in those countries (a prerequisite for the SDG universal access target) at less than $100 billion. Regional cooperation for investment in internet infrastructure can make infrastructure projects more attractive for international investors.
Promoting investment in local digital content and services is crucial to speed up digital development. This means creating and maintaining a conducive regulatory framework for digital firms, as well as active support measures, which may include technology or innovation hubs and incubators; building or improving e-government services; and supporting venture capital funding and other innovative financing approaches. Linkages with global firms can help, but developing the digital sector mostly means supporting local enterprise development, rather than promoting investment by digital MNEs.
Promoting investment in ICTs across all firms, as well as business linkages and participation in global value chains, should be an important part of digital development policies. Tariffs and taxes on devices, and taxes on internet usage, also influence the effective costs of ICT adoption for firms. Facilitating access to cloud services can lower such costs. Skills development – potentially in partnership with global digital MNEs – is also important to allow local firms to interact digitally with MNEs and access e-value chains.
While promoting investment in digital development, policymakers need to address public concerns. This requires up-to-date regulations in such areas as data security, privacy, intellectual property protection, consumer protection and the safeguarding of cultural values. Where digital transformation causes disruption in other sectors or generates negative social or economic impacts, they need to put in place policies to mitigate these effects. Governments need to find a balanced approach that accommodates both public concerns and the interests of private investors.
Investment policymakers should take a more proactive approach in the formulation of digital development strategies. Not only should they prepare for critical changes in their own policy arena, but they can also make an important contribution to the design and implementation of digital industrial policies. Digital development should be embedded in investment policies, and investment policy should be embedded in digital development strategies.
xiv World Investment Report 2017 Investment and the Digital Economy
INVESTMENT PROSPECTS
Cautious optimism
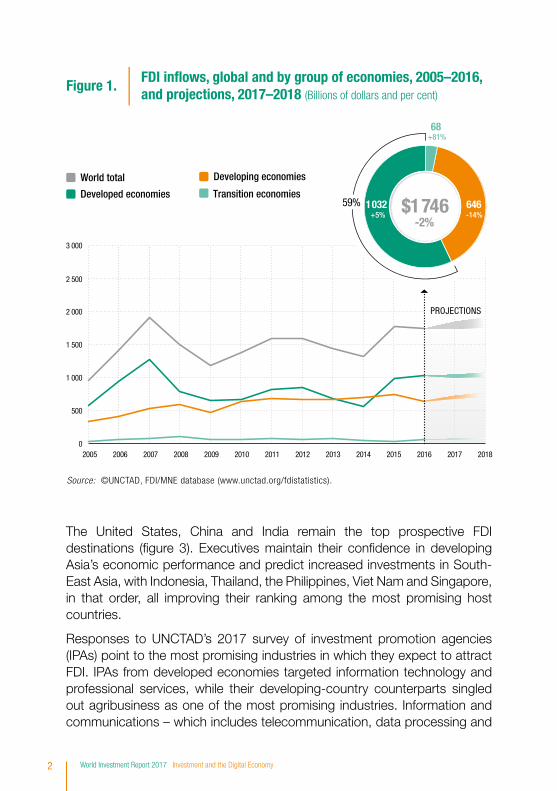
A modest recovery in global FDI flows is forecast for 2017, although flows are expected to remain well below their 2007 peak. A synchronized upturn in economic growth in major regions and improved corporate profits will boost business confidence and MNEs’ appetite to invest. A cyclical recovery in the manufacturing sector and in international trade is expected to result in faster growth in developed countries, while a likely strengthening of commodity prices should underpin a recovery in developing economies in 2017. As a result, global FDI flows are expected to increase by about 5 per cent in 2017 to almost $1.8 trillion (figure 1). The moderate rise in FDI flows is expected to continue in 2018, to $1.85 trillion.
Elevated geopolitical risks and policy uncertainty for investors could have an impact on the scale and contours of the FDI recovery in 2017. Political developments – such as the United Kingdom’s exit from the European Union, moves by the administration in the United States to abandon the Trans-Pacific Partnership and to renegotiate key trade agreements such as the North American Free Trade Agreement (NAFTA), and elections in Europe – have all heightened uncertainty. A potential tax reform in the United States could also significantly affect FDI flows, if United States MNEs reduce retained earnings held in their overseas affiliates.
The 2017 UNCTAD business survey results indicate renewed optimism about FDI prospects. Unlike in 2016, a majority of the executives polled, particularly in developed economies, are confident that the economic upturn will strengthen, prompting increased investment in the coming years (figure 2). A significant change in sentiment from last year is evident among corporations active in the primary sector. Having endured a hard downturn in the past two years, natural-resource-based MNEs, especially in the oil industry, seem to have turned the corner, and most executives now expect increased investment over the next two years.
OVERVIEW
1Overview
The United States, China and India remain the top prospective FDI destinations (figure 3). Executives maintain their confidence in developing Asia’s economic performance and predict increased investments in South-East Asia, with Indonesia, Thailand, the Philippines, Viet Nam and Singapore, in that order, all improving their ranking among the most promising host countries.
Responses to UNCTAD’s 2017 survey of investment promotion agencies (IPAs) point to the most promising industries in which they expect to attract FDI. IPAs from developed economies targeted information technology and professional services, while their developing-country counterparts singled out agribusiness as one of the most promising industries. Information and communications – which includes telecommunication, data processing and
Developed economies
World total
Transition economies
Developing economies
FDI in�ows, global and by group of economies, 2005–2016, and projections, 2017–2018 (Billions of dollars and per cent)
Figure 1.
0
500
1 000
1 500
2 000
2 500
3 000
2005 20102006 2007 2008 2009 2011 2012 2013 2014 2015 2016 2017 2018
PROJECTIONS
68
1 032+5%
+81%
646-14%
59% $1746-2%
Source: ©UNCTAD, FDI/MNE database (www.unctad.org/fdistatistics).
2 World Investment Report 2017 Investment and the Digital Economy
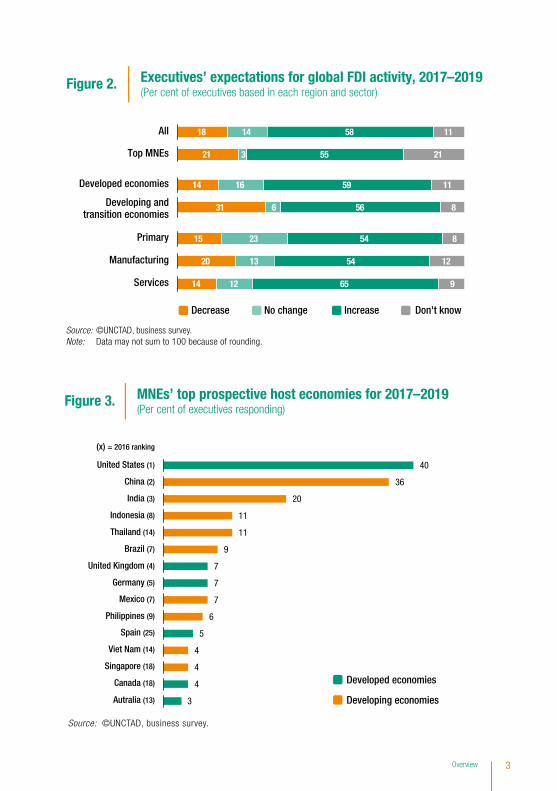
Don't knowDecrease No change Increase
Figure 2. Executives’ expectations for global FDI activity, 2017–2019 (Per cent of executives based in each region and sector)
18 14 58 11
21 3 55 21
14 16 59 11
31 6 56 8
15 23 54 8
20 13 54 12
14 12 65 9
All
Primary
Manufacturing
Services
Developed economies
Developing andtransition economies
Top MNEs
Source: ©UNCTAD, business survey.
(x) = 2016 ranking
Figure 3. MNEs’ top prospective host economies for 2017–2019 (Per cent of executives responding)
United States (1)
China (2)
India (3)
Indonesia (8)
Thailand (14)
Brazil (7)
United Kingdom (4)
Germany (5)
Mexico (7)
Philippines (9)
Spain (25)
Viet Nam (14)
Singapore (18)
Canada (18)
Autralia (13)
40
36
20
11
11
9
7
7
7
6
5
4
4
4
3 Developing economies
Developed economies
Source: ©UNCTAD, business survey.Note: Data may not sum to 100 because of rounding.
3Overview
software programming – is also emerging as a target industry in selected developing countries. The 2017 list of top prospective investor countries, as indicated by IPAs, follows the trend of recent years: China remains the most promising source of FDI, closely followed by the United States, Germany and the United Kingdom.
Increased FDI expected in most regions
Developing economies are likely to see a 10 per cent increase of inflows in 2017, not yet fully returning to the 2015 level, while flows to developed economies are expected to hold steady. There will be significant variation among regions (table 1).
FDI inflows to Africa are expected to increase slightly in 2017, to about $65 billion, in view of modest oil price rises and a potential increase in non-oil FDI. Announced greenfield FDI projects in 2016 were high in real estate, followed by natural gas, infrastructure, renewable energy, chemicals and automotives. Advances in regional and interregional cooperation, through the signing of economic partnership agreements with the European Union (EU) by regional economic communities and the negotiations towards the Tripartite Free Trade Agreement should encourage stronger FDI. However, a slump in economic growth could harm investment prospects in 2017.
FDI inflows to developing Asia are expected to increase by 15 per cent in 2017, to $515 billion, as an improved economic outlook in major Asian economies is likely to boost investor confidence. In major recipients such as China, India and Indonesia, renewed policy efforts to attract FDI could contribute to an increase of inflows in 2017. In South and South-East Asia, several countries are expected to further strengthen their position in regional production networks. In West Asia, FDI is expected to remain flat, with the positive effect of gradually recovering oil prices offset by political and geopolitical uncertainty.
Prospects for FDI in Latin America and the Caribbean in 2017 remain subdued, as macroeconomic and policy uncertainties persist. Flows are expected to fall by about 10 per cent, to some $130 billion. Investment in the region’s extractive industries will likely be modest as operators continue to hold back on making capital expenditures. Investment in the region, especially in Central America, is also likely to be affected by uncertainties about economic policymaking in the United States.
4 World Investment Report 2017 Investment and the Digital Economy
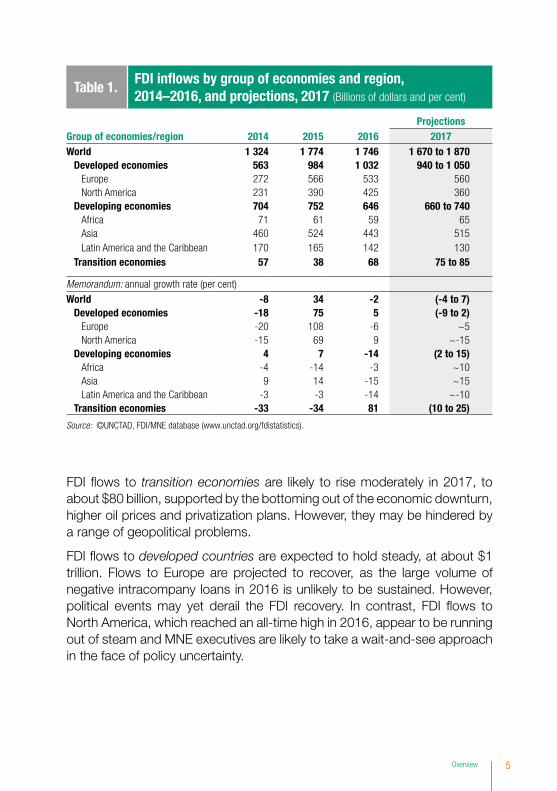
FDI flows to transition economies are likely to rise moderately in 2017, to about $80 billion, supported by the bottoming out of the economic downturn, higher oil prices and privatization plans. However, they may be hindered by a range of geopolitical problems.
FDI flows to developed countries are expected to hold steady, at about $1 trillion. Flows to Europe are projected to recover, as the large volume of negative intracompany loans in 2016 is unlikely to be sustained. However, political events may yet derail the FDI recovery. In contrast, FDI flows to North America, which reached an all-time high in 2016, appear to be running out of steam and MNE executives are likely to take a wait-and-see approach in the face of policy uncertainty.
Group of economies/regionProjections
2014 2015 2016 2017World 1 324 1 774 1 746 1 670 to 1 870
Developed economies 563 984 1 032 940 to 1 050Europe 272 566 533 560North America 231 390 425 360
Developing economies 704 752 646 660 to 740Africa 71 61 59 65Asia 460 524 443 515Latin America and the Caribbean 170 165 142 130
Transition economies 57 38 68 75 to 85
Memorandum: annual growth rate (per cent)
World -8 34 -2 (-4 to 7)Developed economies -18 75 5 (-9 to 2)
Europe -20 108 -6 ~5North America -15 69 9 ~-15
Developing economies 4 7 -14 (2 to 15)Africa -4 -14 -3 ~10Asia 9 14 -15 ~15Latin America and the Caribbean -3 -3 -14 ~-10
Transition economies -33 -34 81 (10 to 25)
Source: ©UNCTAD, FDI/MNE database (www.unctad.org/fdistatistics).
Table 1.FDI infl ows by group of economies and region, 2014–2016, and projections, 2017 (Billions of dollars and per cent)
5Overview
GLOBAL INVESTMENT TRENDS
Global FDI flows lost growth momentum in 2016
In 2016, global FDI flows decreased by 2 per cent to $1.75 trillion, showing that the road to full FDI recovery remains bumpy. Intracompany loans recorded a sizable drop; equity investments were boosted by an 18 per cent increase in the value of cross-border mergers and acquisitions (M&As). A fall in inflows to developing economies was partly offset by modest growth in developed countries and a significant increase in transition economies. As a result, the share of developed economies in global FDI inflows grew to 59 per cent.
Flows to developed economies increased by 5 per cent to $1,032 billion. The decline of FDI flows to Europe was more than compensated by modest growth in flows to North America and a significant increase in investment in other developed economies. Developing economies, as a group, lost ground in 2016. Weak commodity prices and slowing economic growth weighed on foreign investment inflows, which fell by 14 per cent to $646 billion. In contrast, FDI to transition economies jumped to $68 billion, reversing the decline of the past two years.
Developing economies continued to account for half of the top 10 host economies (figure 4). The United States remained the largest recipient of FDI, attracting $391 billion in inflows, followed by the United Kingdom with $254 billion, vaulting from its 14th position in 2015 on the back of large cross-border M&A deals. China was in third position with inflows of $134 billion – a 1 per cent decrease from the previous year.
FDI remains a key source of finance for developing economies
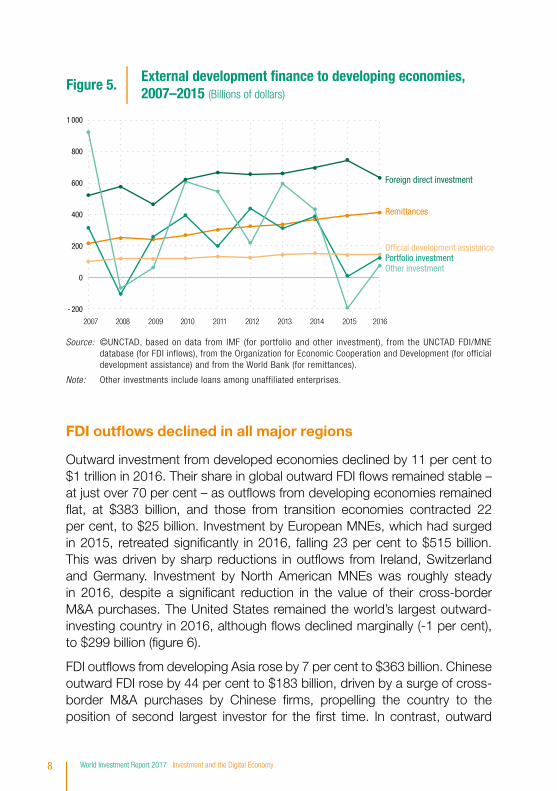
Global external financial flows to developing economies were estimated at $1.4 trillion in 2016, down from more than $2 trillion in 2010. FDI remains the largest, and one of the least volatile, of all external financial flows to developing countries (figure 5). Overall, these flows sit well below the level of annual investment required in order to achieve the Sustainable Development Goals (SDGs) by 2030 (WIR14).
6 World Investment Report 2017 Investment and the Digital Economy
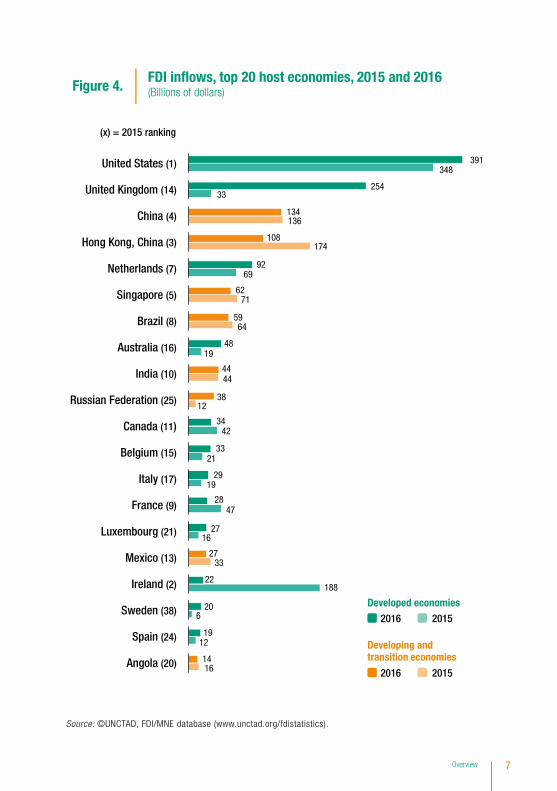
FDI in�ows, top 20 host economies, 2015 and 2016(Billions of dollars)Figure 4.
Developed economies
Developing and transition economies
20152016
20152016
(x) = 2015 ranking
391
254
134
108
92
62
59
48
44
38
34
33
29
28
27
27
22
20
19
14
348
33
136
174
69
71
64
19
44
12
42
21
19
47
16
33
188
6
12
16
United States (1)
United Kingdom (14)
China (4)
Hong Kong, China (3)
Netherlands (7)
Singapore (5)
Brazil (8)
Australia (16)
India (10)
Russian Federation (25)
Canada (11)
Belgium (15)
Italy (17)
France (9)
Luxembourg (21)
Mexico (13)
Ireland (2)
Sweden (38)
Spain (24)
Angola (20)
Source: ©UNCTAD, FDI/MNE database (www.unctad.org/fdistatistics).
7Overview
FDI outflows declined in all major regions
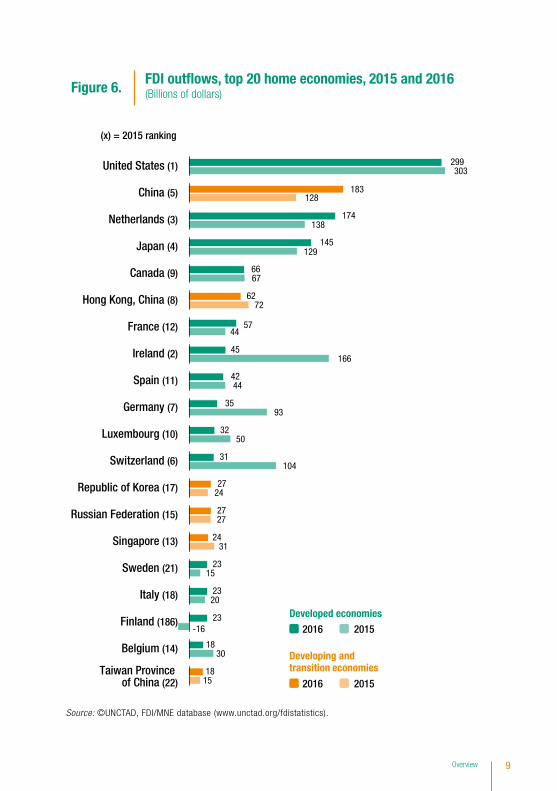
Outward investment from developed economies declined by 11 per cent to $1 trillion in 2016. Their share in global outward FDI flows remained stable – at just over 70 per cent – as outflows from developing economies remained flat, at $383 billion, and those from transition economies contracted 22 per cent, to $25 billion. Investment by European MNEs, which had surged in 2015, retreated significantly in 2016, falling 23 per cent to $515 billion. This was driven by sharp reductions in outflows from Ireland, Switzerland and Germany. Investment by North American MNEs was roughly steady in 2016, despite a significant reduction in the value of their cross-border M&A purchases. The United States remained the world’s largest outward-investing country in 2016, although flows declined marginally (-1 per cent), to $299 billion (figure 6).
FDI outflows from developing Asia rose by 7 per cent to $363 billion. Chinese outward FDI rose by 44 per cent to $183 billion, driven by a surge of cross-border M&A purchases by Chinese firms, propelling the country to the position of second largest investor for the first time. In contrast, outward
- 200
0
200
400
600
800
1 000
Foreign direct investment
Remittances
Other investment
Of�cial development assistancePortfolio investment
Figure 5. External development �nance to developing economies, 2007–2015 (Billions of dollars)
20102007 2008 2009 2011 2012 2013 2014 2015 2016
Source: ©UNCTAD, based on data from IMF (for portfolio and other investment), from the UNCTAD FDI/MNE database (for FDI inflows), from the Organization for Economic Cooperation and Development (for official development assistance) and from the World Bank (for remittances).
Note: Other investments include loans among unaffiliated enterprises.
8 World Investment Report 2017 Investment and the Digital Economy
Source: ©UNCTAD, FDI/MNE database (www.unctad.org/fdistatistics).
FDI out�ows, top 20 home economies, 2015 and 2016 (Billions of dollars)Figure 6.
Developed economies
Developing and transition economies
20152016
20152016
(x) = 2015 ranking
299
183
174
145
66
62
57
45
42
35
32
31
27
27
24
23
23
23
18
18
303
128
138
129
67
72
44
166
44
93
50
104
24
27
31
15
20
-16
30
15
United States (1)
China (5)
Netherlands (3)
Japan (4)
Canada (9)
Hong Kong, China (8)
France (12)
Ireland (2)
Spain (11)
Germany (7)
Luxembourg (10)
Switzerland (6)
Republic of Korea (17)
Russian Federation (15)
Singapore (13)
Sweden (21)
Italy (18)
Finland (186)
Belgium (14)
Taiwan Province of China (22)
9Overview
FDI from members of the Association of Southeast Asian Nations declined. Outflows from Latin America and the Caribbean also shrunk. The top 20 investing economies include 6 developing and transition economies.
Large economic groups drive global FDI trends
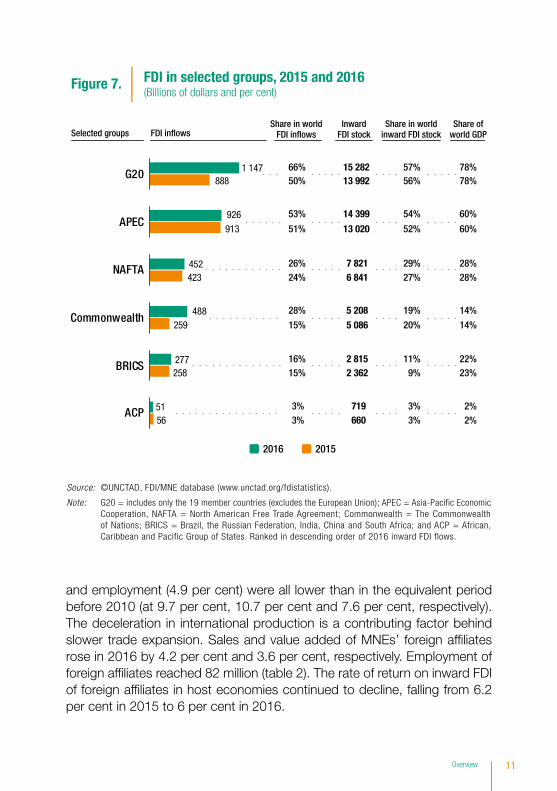
FDI flows to and from large economic groups such as the G20 and Asia-Pacific Economic Cooperation (APEC) continued to shape the global FDI landscape in 2016 (figure 7). Inflows to the G20 reached a record level of more than $1 trillion for the first time.
Some groups – the Commonwealth of Nations; the BRICS (Brazil, the Russian Federation, India, China and South Africa), the African, Caribbean and Pacific Group of States (ACP) – are, on average, net recipients of FDI flows, while others (the G20, APEC, NAFTA) are net exporters of FDI. Except for NAFTA, outward FDI from most large groups rose in 2016. Intragroup connectivity through FDI is high in the G20 and APEC and growing in BRICS and the ACP. In addition to these megagroups, interregional schemes such as the One Belt One Road initiative are poised to stimulate FDI among a broader range of countries.
A closer look at the high share of FDI in services
In 2015, the manufacturing and primary sectors accounted for 26 per cent and 6 per cent of global FDI stock, respectively. The services sector accounted for 65 per cent. A detailed look at what is in services FDI shows that its two-thirds share provides an inflated impression of the importance of the tertiary sector in cross-border investment. A large part of FDI in services relates to affiliates of primary sector and manufacturing MNEs that perform services-like activities, including headquarters or back-office functions, financial holdings, procurement or logistics hubs, distribution services, and research and development. In sectoral FDI data, such activities are allocated to services as the default category. FDI in services could thus be overstated by more than a third.
Slower growth in international production affects global trade
International production by foreign affiliates of MNEs is still expanding, but the rate has slowed in recent years. The average annual growth rates over the last five years of foreign affiliate sales (7.3 per cent), value added (4.9 per cent)
10 World Investment Report 2017 Investment and the Digital Economy
50% 13 992
51% 13 020
24% 6 841
15% 5 086
15% 2 362
3% 660
56%
52%
27%
20%
9%
3%
888
913
423
259
258
56
78%
60%
28%
14%
23%
2%
66% 15 282
53% 14 399
26% 7 821
28% 5 208
16% 2 815
3% 719
57%
54%
29%
19%
11%
3%
1 147
926
452
488
277
51
78%
60%
28%
14%
22%
2%
FDI in selected groups, 2015 and 2016 (Billions of dollars and per cent)
Figure 7.
2016 2015
FDI in�owsInward
FDI stockShare in world
FDI in�owsShare in world
inward FDI stock
G20
APEC
NAFTA
Commonwealth
BRICS
ACP
Selected groupsShare of
world GDP
Source: ©UNCTAD, FDI/MNE database (www.unctad.org/fdistatistics).
Note: G20 = includes only the 19 member countries (excludes the European Union); APEC = Asia-Pacific Economic Cooperation, NAFTA = North American Free Trade Agreement; Commonwealth = The Commonwealth of Nations; BRICS = Brazil, the Russian Federation, India, China and South Africa; and ACP = African, Caribbean and Pacific Group of States. Ranked in descending order of 2016 inward FDI flows.
and employment (4.9 per cent) were all lower than in the equivalent period before 2010 (at 9.7 per cent, 10.7 per cent and 7.6 per cent, respectively). The deceleration in international production is a contributing factor behind slower trade expansion. Sales and value added of MNEs’ foreign affiliates rose in 2016 by 4.2 per cent and 3.6 per cent, respectively. Employment of foreign affiliates reached 82 million (table 2). The rate of return on inward FDI of foreign affiliates in host economies continued to decline, falling from 6.2 per cent in 2015 to 6 per cent in 2016.
11Overview
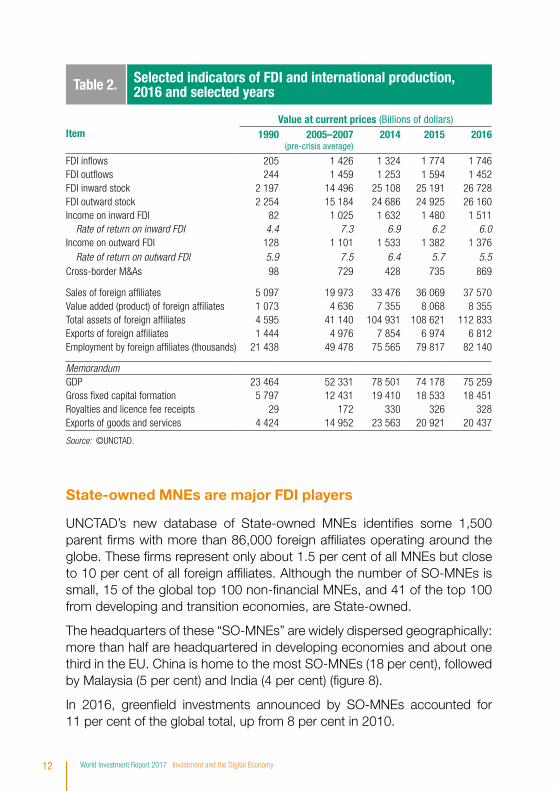
State-owned MNEs are major FDI players
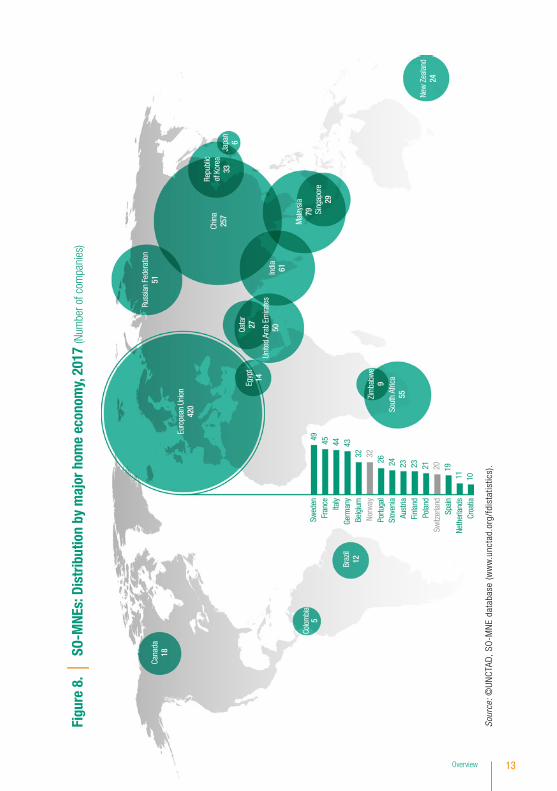
UNCTAD’s new database of State-owned MNEs identifies some 1,500 parent firms with more than 86,000 foreign affiliates operating around the globe. These firms represent only about 1.5 per cent of all MNEs but close to 10 per cent of all foreign affiliates. Although the number of SO-MNEs is small, 15 of the global top 100 non-financial MNEs, and 41 of the top 100 from developing and transition economies, are State-owned.
The headquarters of these “SO-MNEs” are widely dispersed geographically: more than half are headquartered in developing economies and about one third in the EU. China is home to the most SO-MNEs (18 per cent), followed by Malaysia (5 per cent) and India (4 per cent) (figure 8).
In 2016, greenfield investments announced by SO-MNEs accounted for 11 per cent of the global total, up from 8 per cent in 2010.
Table 2. Selected indicators of FDI and international production, 2016 and selected years
ItemValue at current prices (Billions of dollars)
1990 2005–2007(pre-crisis average)
2014 2015 2016
FDI infl ows 205 1 426 1 324 1 774 1 746FDI outfl ows 244 1 459 1 253 1 594 1 452FDI inward stock 2 197 14 496 25 108 25 191 26 728FDI outward stock 2 254 15 184 24 686 24 925 26 160Income on inward FDI 82 1 025 1 632 1 480 1 511
Rate of return on inward FDI 4.4 7.3 6.9 6.2 6.0Income on outward FDI 128 1 101 1 533 1 382 1 376
Rate of return on outward FDI 5.9 7.5 6.4 5.7 5.5Cross-border M&As 98 729 428 735 869
Sales of foreign affi liates 5 097 19 973 33 476 36 069 37 570Value added (product) of foreign affi liates 1 073 4 636 7 355 8 068 8 355Total assets of foreign affi liates 4 595 41 140 104 931 108 621 112 833Exports of foreign affi liates 1 444 4 976 7 854 6 974 6 812Employment by foreign affi liates (thousands) 21 438 49 478 75 565 79 817 82 140
MemorandumGDP 23 464 52 331 78 501 74 178 75 259Gross fi xed capital formation 5 797 12 431 19 410 18 533 18 451Royalties and licence fee receipts 29 172 330 326 328Exports of goods and services 4 424 14 952 23 563 20 921 20 437
Source: ©UNCTAD.
12 World Investment Report 2017 Investment and the Digital Economy
Sour
ce: ©
UNC
TAD
, SO
-MN
E da
taba
se (
ww
w.u
ncta
d.or
g/fd
ista
tistic
s).
Figu
re 8
.SO
-MNE
s: D
istr
ibut
ion
by m
ajor
hom
e ec
onom
y, 20
17 (N
umbe
r of c
ompa
nies
)
Mal
aysia
79
Chin
a25
7
Russ
ian
Fede
ratio
n51
Sing
apor
e29
Sout
h Af
rica
55
Indi
a61
Cana
da18
Repu
blic
of K
orea
33Ja
pan
6
Braz
il12
Colo
mbi
a5
Zim
babw
e9
New
Zea
land
24
Euro
pean
Uni
on42
0
49 45 44 4332 32
26 24 23 23 21 20 1911 10
Swed
enFr
ance
Italy
Germ
any
Belg
ium
Norw
ayPo
rtuga
lSl
oven
iaAu
stria
Finl
and
Pola
ndSw
itzer
land
Spai
nNe
ther
land
sCr
oatia
Qata
r27
Egyp
t14
Unite
d Ar
ab E
mira
tes
50
13Overview
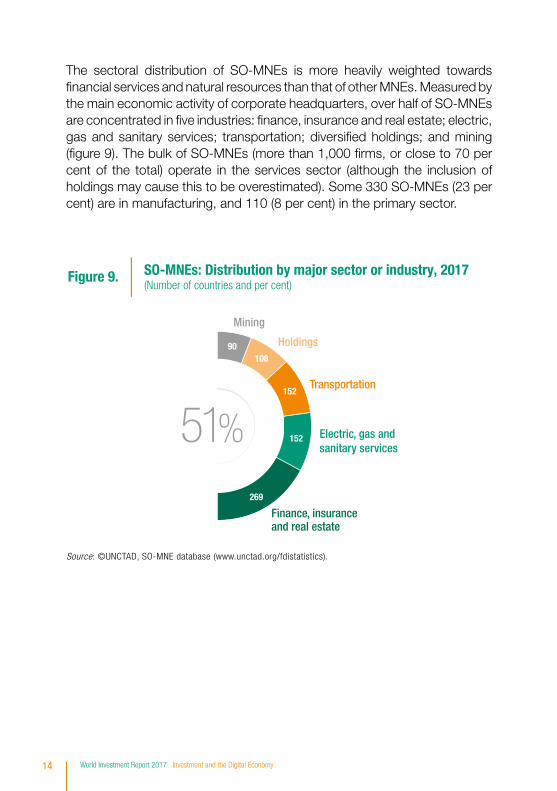
The sectoral distribution of SO-MNEs is more heavily weighted towards financial services and natural resources than that of other MNEs. Measured by the main economic activity of corporate headquarters, over half of SO-MNEs are concentrated in five industries: finance, insurance and real estate; electric, gas and sanitary services; transportation; diversified holdings; and mining (figure 9). The bulk of SO-MNEs (more than 1,000 firms, or close to 70 per cent of the total) operate in the services sector (although the inclusion of holdings may cause this to be overestimated). Some 330 SO-MNEs (23 per cent) are in manufacturing, and 110 (8 per cent) in the primary sector.
Figure 9. SO-MNEs: Distribution by major sector or industry, 2017(Number of countries and per cent)
Mining
Holdings
Transportation
Electric, gas andsanitary services
Finance, insuranceand real estate
269
108
152
152
18%
7%
10%
10%
90
6%
51%
Source: ©UNCTAD, SO-MNE database (www.unctad.org/fdistatistics).
14 World Investment Report 2017 Investment and the Digital Economy
REGIONAL INVESTMENT TRENDS
Low commodity prices depress FDI in Africa
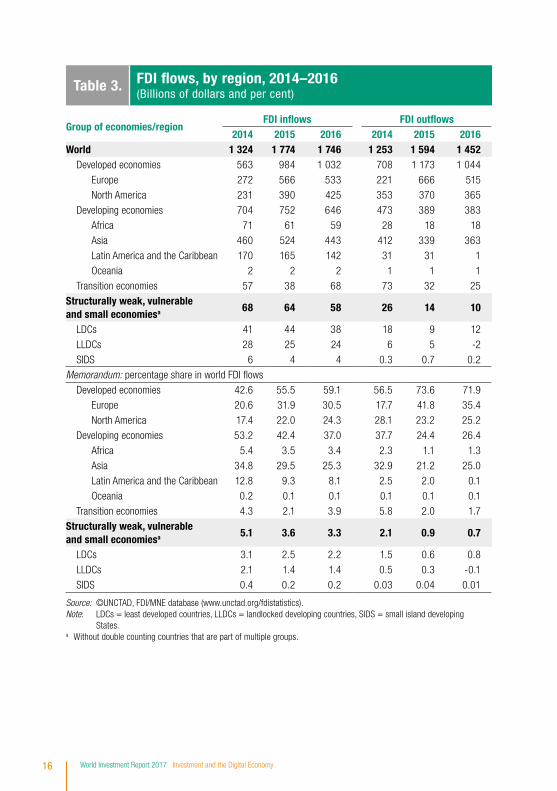
FDI flows to Africa continued to fall in 2016, to $59 billion, a decrease of 3 per cent (table 3). The resurgence of FDI into Egypt – the largest recipient of regional FDI – boosted inflows to North Africa. In contrast, low commodity prices hurt economic prospects in Sub-Saharan Africa and tempered investor interest. Flows dropped again in Angola, and they remained at relatively low levels in Nigeria and South Africa. East Africa registered relatively strong FDI inflows in 2016, with Ethiopia attracting more FDI than ever before. MNEs from developing economies are increasingly active on the continent, but those from developed countries are still the most important investors.
Outward investment by African MNEs rose slightly (1 per cent to $18 billion), largely reflecting a rise in outflows from Angola (35 per cent to $11 billion), which offset a sharp reduction in flows from South Africa (-41 per cent to $3 billion).
FDI flows to developing Asia down in almost all subregions
Combined FDI flows to developing Asia decreased by 15 per cent to $443 billion in 2016. The decline – the first since 2012 – was relatively widespread, with every major subregion, except South Asia, registering drops. The bulk of the overall decrease was caused by a return to prior levels of flows to Hong Kong (China), after the spike in 2015. Depressed values of cross-border M&As, which decreased from $50 billion in 2015 to $42 billion in 2016, also contributed. In East Asia, China’s relatively stable performance in inflows limited the overall fall in the subregion. In South-East Asia, inflows dropped, due mainly to decreases in Indonesia, Singapore and Thailand. In South Asia, FDI inflows were flat, increasing in India by only 1 per cent. In West Asia, the continued fall in FDI reflected regional conflict and the prolonged negative impact of low commodity prices.
FDI outflows from developing Asia rose by 7 per cent to $363 billion. China’s continued surge drove up outflows from East Asia while sluggish outward FDI from Indonesia and Singapore dragged down outflows from South-East Asia. Outflows continued to slide in South Asia but bottomed out in West Asia.
15Overview
Group of economies/regionFDI infl ows FDI outfl ows
2014 2015 2016 2014 2015 2016World 1 324 1 774 1 746 1 253 1 594 1 452
Developed economies 563 984 1 032 708 1 173 1 044
Europe 272 566 533 221 666 515
North America 231 390 425 353 370 365
Developing economies 704 752 646 473 389 383
Africa 71 61 59 28 18 18
Asia 460 524 443 412 339 363
Latin America and the Caribbean 170 165 142 31 31 1
Oceania 2 2 2 1 1 1
Transition economies 57 38 68 73 32 25
Structurally weak, vulnerable and small economiesa 68 64 58 26 14 10
LDCs 41 44 38 18 9 12
LLDCs 28 25 24 6 5 -2
SIDS 6 4 4 0.3 0.7 0.2
Memorandum: percentage share in world FDI fl ows
Developed economies 42.6 55.5 59.1 56.5 73.6 71.9
Europe 20.6 31.9 30.5 17.7 41.8 35.4
North America 17.4 22.0 24.3 28.1 23.2 25.2
Developing economies 53.2 42.4 37.0 37.7 24.4 26.4
Africa 5.4 3.5 3.4 2.3 1.1 1.3
Asia 34.8 29.5 25.3 32.9 21.2 25.0
Latin America and the Caribbean 12.8 9.3 8.1 2.5 2.0 0.1
Oceania 0.2 0.1 0.1 0.1 0.1 0.1
Transition economies 4.3 2.1 3.9 5.8 2.0 1.7
Structurally weak, vulnerable and small economiesa 5.1 3.6 3.3 2.1 0.9 0.7
LDCs 3.1 2.5 2.2 1.5 0.6 0.8
LLDCs 2.1 1.4 1.4 0.5 0.3 -0.1
SIDS 0.4 0.2 0.2 0.03 0.04 0.01
Source: ©UNCTAD, FDI/MNE database (www.unctad.org/fdistatistics).Note: LDCs = least developed countries, LLDCs = landlocked developing countries, SIDS = small island developing
States. a Without double counting countries that are part of multiple groups.
Table 3. FDI fl ows, by region, 2014–2016 (Billions of dollars and per cent)
16 World Investment Report 2017 Investment and the Digital Economy
FDI flows to Latin America and the Caribbean slide further
The downward trend in FDI flows to Latin America and the Caribbean accelerated in 2016, with inflows falling by 14 per cent to $142 billion, as investment slowed throughout the region. Economic recession, coupled with weak commodity prices and higher currency volatility, weighed heavily on flows to South America, which declined by 14 per cent to $101 billion. In Central America inflows also declined, by 14 per cent to $38 billion, adding to decelerations in gross fixed capital formation and export volumes. FDI inflows in the Caribbean, excluding financial centres, declined (-9 per cent to $3 billion), but with significant variations at the country level.
Outward investment by Latin American MNEs plunged in 2016, as their foreign affiliates funnelled significant volumes of finance back to their parents. It fell by 98 per cent to $1 billion, reaching its lowest level since 2001.
FDI flows to transition economies bounce back
In 2016, FDI flows to transition economies jumped to $68 billion, after a steep decline in the preceding two years. The two main subregions experienced divergent trends. In the Commonwealth of Independent States and Georgia, FDI inflows almost doubled, owing to an exceptional rise in flows to Kazakhstan as well as a strong rise in flows to the Russian Federation. In South-East Europe inflows declined by 5 per cent, owing to fewer investments in the manufacturing sector. The list of main investor home economies shows a gradual shift in favour of new countries, especially China.
Outward FDI from transition economies fell further in 2016, by 22 per cent to $25 billion, mainly due to negative outflows from Kazakhstan (-$5 billion). Flows from the Russian Federation, which account for the bulk of the region’s total, increased marginally to $27 billion, despite reduced access to international capital markets.
Mega–M&As help sustain FDI flows to developed countries
At $1 trillion, FDI flows to developed economies rose 5 per cent. In Europe, record cross-border M&A sales were offset by a slump in intracompany loans, resulting in a 6 per cent contraction of inflows. Despite the Brexit vote, inflows to the United Kingdom rose to an unprecedented level, owing to the completion of several M&A megadeals. In contrast, inflows to developed countries in North America and the Asia-Pacific expanded, except in
17Overview
Canada. Inflows to the United States were at an all-time high, boosted by the completion of M&As, especially in the pharmaceutical industry. Australia reversed the decline seen over 2013–2015, while flows to Japan showed signs of sustained revival.
FDI outflows from developed countries declined by 11 per cent to $1 trillion. Outflows from European countries fell by 23 per cent overall, mainly driven by sharp reductions in outflows from Ireland (down 73 per cent to $45 billion), Switzerland (down 71 per cent to $31 billion) and Germany (down 63 per cent to $35 billion). Outflows from North America were stable but, as in previous years, a large part of those flows was accounted for by retained overseas earnings. Japanese MNEs expanded their FDI through cross-border M&As, particularly in Europe.
FDI to structurally weak and vulnerable economies remains fragile
After hitting a high of $44 billion in 2015, FDI inflows to the least developed countries (LDCs) were reduced by more than 13 per cent to $38 billion, representing 2 per cent of global FDI flows and 6 per cent of flows to all developing economies. Nonetheless, more than 20 LDCs attracted more FDI than in the previous year, led by relatively diversified major FDI host economies such as Cambodia and Ethiopia. China remained the largest investor economy in LDCs, far ahead of France and the United States. Although the sectoral distribution of announced greenfield FDI projects in LDCs underscores the potential for attracting more investment into the manufacturing and services sectors, oil and gas investments will continue to drive overall FDI flows into LDCs for the foreseeable future.
After a major decline in 2015, FDI flows to the 32 landlocked developing countries (LLDCs) stabilized at $24 billion in 2016. LLDCs continue to play a marginal role on the global FDI scene, accounting for less than 2 per cent of world inflows. The dynamics of FDI inflows diverged across regions and host economies. FDI was up in transition economies, especially in Kazakhstan, and inflows rose for a fourth consecutive year in Ethiopia, whereas flows to Mongolia turned negative. Although FDI to LLDCs continues to focus on natural resources, investment is shifting towards other economic activities, such as infrastructure and manufacturing, helping to mitigate these countries’ geographical disadvantage. Investors from developing countries, particularly China, account for an increasing share of FDI to LLDCs. FDI prospects
18 World Investment Report 2017 Investment and the Digital Economy
warrant cautious optimism. Continued recovery still hinges on the evolution of commodity prices and political issues that could weigh on future FDI.
The fragile FDI flows to the small island developing States (SIDS) decreased by 6 per cent $3.5 billion. The share of SIDS in global FDI flows has stagnated at less than 0.5 per cent in most years since 2009. Recoveries in Maldives and Mauritius were offset by reduced flows to a dozen other economies. Jamaica leads the SIDS in terms of attracting more diversified FDI. Among external sources of finance, the volatility of FDI flows into SIDS has become more pronounced since 2008, while remittances and official development assistance remain steady. Developing economies constitute 7 of the top 10 investors in SIDS, although the developed economies of Canada and United States lead in volume by a wide margin.
19Overview
INVESTMENT POLICY TRENDS
Investment policies become more complex, more divergent and more uncertain
Sustainable development considerations make investment policies more challenging and multifaceted. Policymaking is becoming more divergent, reflecting the variety of approaches with which societies and governments respond to the effects of globalization. This, together with more frequent government interventions, has also reduced predictability of investment policies for investors.
While many countries continue to promote foreign investment, some are also taking a more critical stance towards foreign takeovers and individual investment decisions of companies. At the international level, IIA reform is in full steam, resulting in the modernization of treaties, but also in the withdrawal from the regime by some countries. Megaregional agreements are increasingly difficult to negotiate and implement.
These developments may be temporary turbulences in a rapidly changing world as governments reposition themselves, or they may announce policy changes of a more lasting nature. A rules-based investment regime that is credible, has broad international support and aims at sustainability and inclusiveness can help reduce uncertainty and improve the stability of investment relations.
Countries remain keen to attract investment, but the share of regulatory and restrictive measures is up
UNCTAD data show that, in 2016, some 58 countries and economies adopted at least 124 policy measures affecting foreign investment – the highest number since 2006. Of these measures, 84 related to the liberalization and promotion of investment, while 22 introduced new restrictions or regulations (the remaining 18 measures were neutral). The share of investment liberalization and promotion measures stood at 79 per cent, considerably lower than in the early stages of UNCTAD’s annual reporting in the 1990s (94 per cent) (figure 10).
Entry conditions for foreign investors were liberalized in a variety of industries, especially in financial services, extractive industries and real estate. Numerous countries streamlined registration procedures, provided new investment
20 World Investment Report 2017 Investment and the Digital Economy
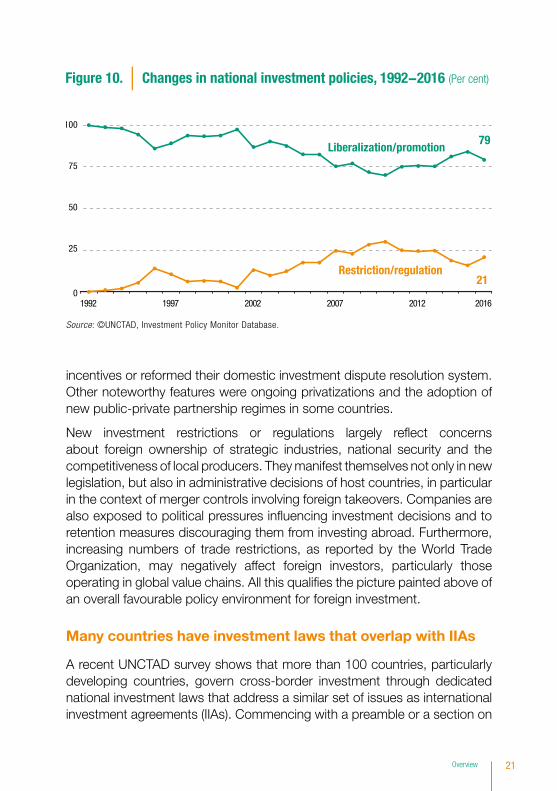
incentives or reformed their domestic investment dispute resolution system. Other noteworthy features were ongoing privatizations and the adoption of new public-private partnership regimes in some countries.
New investment restrictions or regulations largely reflect concerns about foreign ownership of strategic industries, national security and the competitiveness of local producers. They manifest themselves not only in new legislation, but also in administrative decisions of host countries, in particular in the context of merger controls involving foreign takeovers. Companies are also exposed to political pressures influencing investment decisions and to retention measures discouraging them from investing abroad. Furthermore, increasing numbers of trade restrictions, as reported by the World Trade Organization, may negatively affect foreign investors, particularly those operating in global value chains. All this qualifies the picture painted above of an overall favourable policy environment for foreign investment.
Many countries have investment laws that overlap with IIAs
A recent UNCTAD survey shows that more than 100 countries, particularly developing countries, govern cross-border investment through dedicated national investment laws that address a similar set of issues as international investment agreements (IIAs). Commencing with a preamble or a section on
Source: ©UNCTAD, Investment Policy Monitor Database.
1992 1997 2002 2007 2012 2016
Liberalization/promotion
Restriction/regulation
Figure 10. Changes in national investment policies, 1992−2016 (Per cent)
0
25
50
75
100
79
21
21Overview
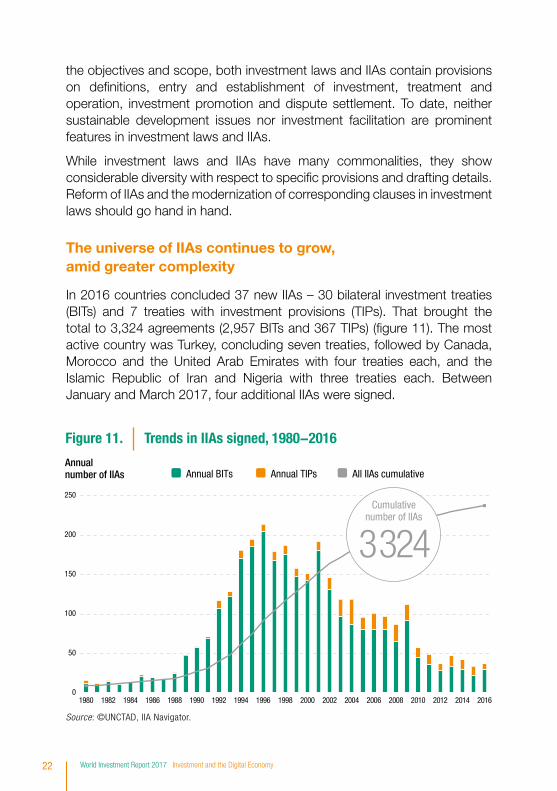
the objectives and scope, both investment laws and IIAs contain provisions on definitions, entry and establishment of investment, treatment and operation, investment promotion and dispute settlement. To date, neither sustainable development issues nor investment facilitation are prominent features in investment laws and IIAs.
While investment laws and IIAs have many commonalities, they show considerable diversity with respect to specific provisions and drafting details. Reform of IIAs and the modernization of corresponding clauses in investment laws should go hand in hand.
The universe of IIAs continues to grow, amid greater complexity
In 2016 countries concluded 37 new IIAs – 30 bilateral investment treaties (BITs) and 7 treaties with investment provisions (TIPs). That brought the total to 3,324 agreements (2,957 BITs and 367 TIPs) (figure 11). The most active country was Turkey, concluding seven treaties, followed by Canada, Morocco and the United Arab Emirates with four treaties each, and the Islamic Republic of Iran and Nigeria with three treaties each. Between January and March 2017, four additional IIAs were signed.
Source: ©UNCTAD, IIA Navigator.
Annual TIPs All IIAs cumulativeAnnual BITsAnnual number of IIAs
Figure 11. Trends in IIAs signed, 1980−2016
0
50
100
150
200
250
1980 1982 1984 1986 1988 1990 1992 1994 1996 1998 2000 2002 2004 2006 2008 2010 2012 2014 2016
Cumulativenumber of IIAs
3324
22 World Investment Report 2017 Investment and the Digital Economy
Governments also re-adjusted their engagement in international investment policy. Terminations of at least 19 IIAs became effective, with more to come. Countries particularly active in terminating treaties were Indonesia (with 11) and India (7). For megaregional treaties with substantive investment rules, such as the Trans-Pacific Partnership (TPP) or the Transatlantic Trade and Investment Partnership (TTIP), prospects remain uncertain.
The rate of new treaty-based ISDS cases continued unabated, above the 10-year average
In 2016, 62 known investor–State dispute settlement (ISDS) cases were initiated (figure 12). This number is lower than in the preceding year but higher than the 10-year average of 49 cases per year (2006–2015). As of 1 January 2017, the total number of publicly known claims had reached 767. So far, 109 countries have been respondents to one or more known ISDS claims. As arbitrations can be kept confidential under certain circumstances, the actual number of disputes filed for this and previous years is likely to be higher.
Forty-one arbitral decisions were made public in 2016. Of these decisions, States prevailed at the jurisdictional stage in approximately half, while investors won more of the cases that reached the merits stage. Of the total number of known cases decided on the merits, investors won 60 per cent.
G20 countries adopted the Guiding Principles for Global Investment Policymaking
The non-binding Guiding Principles for Global Investment Policymaking were endorsed by G20 leaders, constituting the first time that multilateral consensus on investment matters has been reached between such a varied group of developed, developing and transition economies, accounting for over two thirds of global outward FDI (including the EU). Drawing upon UNCTAD’s Investment Policy Framework for Sustainable Development, the G20 Principles have the following main features:
• New generation: The Guiding Principles contain key new-generation investment policy elements, such as sustainable development and inclusive growth, the right to regulate for public policy purposes and responsible business practices.
23Overview
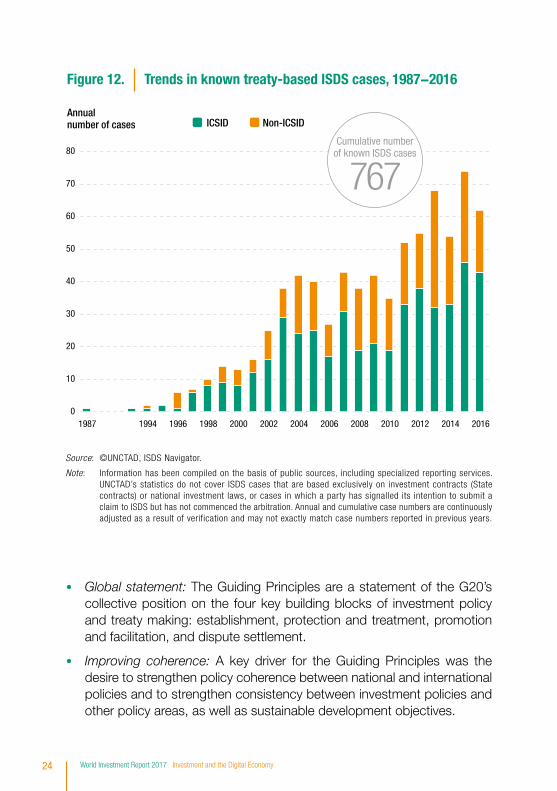
• Global statement: The Guiding Principles are a statement of the G20’s collective position on the four key building blocks of investment policy and treaty making: establishment, protection and treatment, promotion and facilitation, and dispute settlement.
• Improving coherence: A key driver for the Guiding Principles was the desire to strengthen policy coherence between national and international policies and to strengthen consistency between investment policies and other policy areas, as well as sustainable development objectives.
Figure 12. Trends in known treaty-based ISDS cases, 1987−2016
Annual number of cases ICSID Non-ICSID
0
10
20
30
40
50
60
70
80
1987 1994 1996 1998 2000 2002 2004 2006 2008 2010 2012 2014 2016
767Cumulative number
of known ISDS cases
Source: ©UNCTAD, ISDS Navigator.
Note: Information has been compiled on the basis of public sources, including specialized reporting services. UNCTAD’s statistics do not cover ISDS cases that are based exclusively on investment contracts (State contracts) or national investment laws, or cases in which a party has signalled its intention to submit a claim to ISDS but has not commenced the arbitration. Annual and cumulative case numbers are continuously adjusted as a result of verification and may not exactly match case numbers reported in previous years.
24 World Investment Report 2017 Investment and the Digital Economy
• Delicate balance: The Guiding Principles try to strike a delicate balance between the rights and obligations of firms and States, between liberalization and regulation, and between the strategic interests of host and home countries.
• Non-binding instrument: The Guiding Principles are non-binding. They are intended to serve as a guiding instrument for reviewing and formulating national investment policies and strategies. They are also intended to serve as an important reference for drafting and negotiating international investment treaties.
IIA reform has made significant progress
Sustainable development-oriented IIA reform has entered the mainstream of international investment policymaking. Consolidating phase 1 of IIA reform, most new treaties follow UNCTAD’s Road Map (WIR16), which sets out five action areas: safeguarding the right to regulate, while providing protection; reforming investment dispute settlement; promoting and facilitating investment; ensuring responsible investment; and enhancing systemic consistency.
Some provisions that were considered innovative in IIAs concluded through 2010 now appear almost regularly in IIAs. Almost all of the recently concluded IIAs contain at least one or two reform features, typically new language that preserves host States’ right to regulate, improves dispute settlement or fosters responsible investment. Moreover, a few recent IIAs pursue the five action areas in novel ways that have not been used in earlier IIAs. However, some countries are holding back from modern treaty drafting practices. In addition, substantial differences in the IIAs concluded by a given country at about the same time raise concerns about an increase in inconsistencies in and fragmentation of the IIA regime, rather than a decrease.
Reforming dispute settlement is high on the agenda, with concrete steps undertaken (e.g. reform-oriented clauses in new treaties, work on the establishment of an international investment court), including at the multilateral level. Investment facilitation has also become an area of greater interest in investment treaty making. UNCTAD’s Global Action Menu for Investment Facilitation, launched in WIR16 to fill a systemic gap in national and international investment policymaking with a view to mobilizing investment for sustainable development, has obtained strong support from all investment and development stakeholders.
25Overview
It is time to move to phase 2 of IIA reform: modernizing the existing stock of old-generation treaties
Several factors make a strong case for reform of the existing treaty network. Old treaties abound: more than 2,500 IIAs in force today (95 per cent of all in force) were concluded before 2010. Old treaties “bite”: as of end-2016, virtually all known ISDS cases were based on those treaties. Old treaties perpetuate inconsistencies: their continued existence creates overlaps and fragmentation in treaty relationships and poses interaction challenges.
For phase 2 of IIA reform, modernizing old-generation treaties, UNCTAD presents and analyses the pros and cons of 10 policy options (figure 13):
1. Jointly interpreting treaty provisions: IIAs with broadly worded provisions can give rise to unintended and contradictory interpretations in ISDS proceedings. Joint interpretations, aimed at clarifying the meaning of treaty obligations, can help reduce uncertainty and enhance predictability for investors, contracting parties and tribunals.
2. Amending treaty provisions: The expansively formulated obligations common to old IIAs may sometimes be difficult to “fix” through a joint interpretation. By amending treaty provisions, the parties can achieve a greater degree of change and thereby ensure that the amended treaty reflects their evolving policy preferences.
3. Replacing “outdated” treaties: Treaty replacements offer an opportunity to undertake a comprehensive revision of the treaty instead of selectively amending individual clauses.
4. Consolidating the IIA network: Abrogating multiple “old” BITs and replacing them with a new plurilateral IIA can help to modernize treaty content and reduce fragmentation of the IIA network at the same time.
5. Managing relationships between coexisting treaties: Where countries opt for maintaining “old” and “new” treaties in parallel, IIA reform objectives will be achieved only if – in the event of conflict or inconsistency – the new, more modern IIA prevails.
6. Referencing global standards: In their IIA reform efforts, countries can refer to multilaterally recognized standards and instruments, which reflect broad consensus on relevant issues. Referencing them can clarify a treaty’s object and purpose, while helping overcome fragmentation between IIAs and other bodies of international law and policymaking.
26 World Investment Report 2017 Investment and the Digital Economy
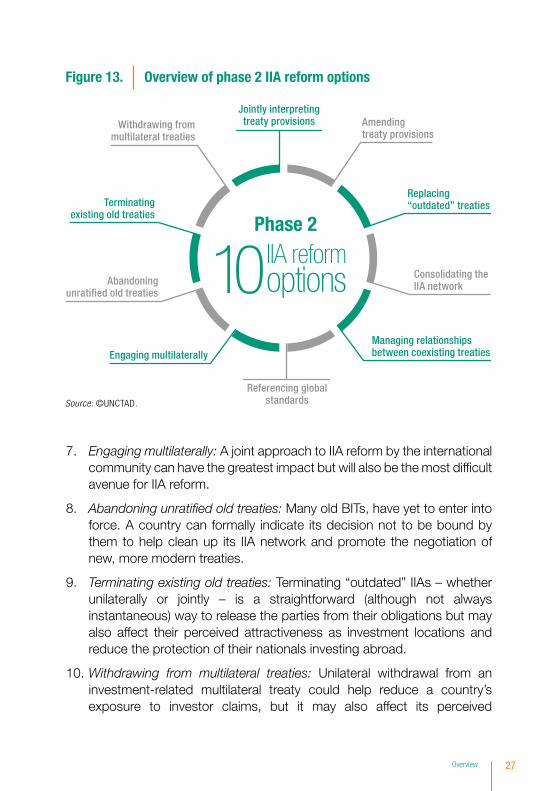
7. Engaging multilaterally: A joint approach to IIA reform by the international community can have the greatest impact but will also be the most difficult avenue for IIA reform.
8. Abandoning unratified old treaties: Many old BITs, have yet to enter into force. A country can formally indicate its decision not to be bound by them to help clean up its IIA network and promote the negotiation of new, more modern treaties.
9. Terminating existing old treaties: Terminating “outdated” IIAs – whether unilaterally or jointly – is a straightforward (although not always instantaneous) way to release the parties from their obligations but may also affect their perceived attractiveness as investment locations and reduce the protection of their nationals investing abroad.
10. Withdrawing from multilateral treaties: Unilateral withdrawal from an investment-related multilateral treaty could help reduce a country’s exposure to investor claims, but it may also affect its perceived
Figure 13. Overview of phase 2 IIA reform options
Jointly interpretingtreaty provisions Amending
treaty provisions
Replacing “outdated” treaties
Consolidating the IIA network
Managing relationshipsbetween coexisting treaties
Referencing globalstandards
Engaging multilaterally
Terminatingexisting old treaties
Withdrawing frommultilateral treaties
Abandoningunrati�ed old treaties
Phase 2
IIA reformoptions10
Source: ©UNCTAD.
27Overview
attractiveness as an investment location and reduce the protection of its nationals investing abroad. It could also create challenges for future multilateral cooperation on investment.
These 10 options can help address the 5 key areas set out in UNCTAD’s Road Map for IIA Reform. They vary in nature and outcome, ranging from more technical to more political, from a focus on procedure to one also addressing substance, and from continuous engagement with the IIA regime to an exit from the regime. Countries can adapt and adopt these options to pursue their desired reform objectives.
Determining which of these 10 policy options is right for a country in any situation requires conducting a careful and facts-based cost-benefit analysis, as well as addressing several broader challenges. Strategic challenges include preventing “overshooting” of reform, which would deprive the IIA regime of its purpose of protecting and promoting investment. Reform efforts, particularly comprehensive ones, should harness the benefits that can be obtained from the rule of law and respond to investors’ expectations of predictability, stability and transparency in policymaking.
Systemic challenges arise from gaps, overlaps, inconsistencies and fragmen-tation in a regime that consists of thousands of agreements that differ in content and type. Reform should work towards improving the coherence of the IIA regime, consolidating and streamlining the IIA network and managing the interaction between IIAs and other bodies of international law.
Coordination challenges require prioritizing reform actions and properly sequencing their implementation with treaty partners, as well as aligning reform efforts at different levels of policymaking. Capacity challenges make it hard for smaller countries, particularly LDCs and smaller developing countries, to be effective in addressing the deficiencies of old-generation IIAs.
Comprehensive regime reform would benefit from intensified multilateral backstopping. UNCTAD, through its three pillars of work – research and policy analysis, technical assistance and intergovernmental consensus building – can play a key role, as the focal point in the United Nations for international investment and the international forum for high-level and inclusive discussions on today’s multilayered and multifaceted IIA regime.
28 World Investment Report 2017 Investment and the Digital Economy
Capital market policies to promote investment in sustainable development are increasing
The world is seeing rapid growth of capital market-related policies and instruments designed to promote investment in sustainable businesses and to support the achievement of the SDGs. These policies and instruments are emanating primarily from stock exchanges and their regulators, but with strong involvement from other capital market stakeholders, including institutional investors.
The United Nations Sustainable Stock Exchanges (SSE) initiative has seen its membership more than triple in the last two years. It now includes 63 partner exchanges from five continents, listing over 30,000 companies and representing a market capitalization of over $55 trillion. This rapid growth can be seen as a proxy for the increasing attention exchanges are paying to sustainability in their markets.
Stock exchanges promote investment in sustainable development through a number of instruments, including environmental, social and governance (ESG) indices, sustainability reporting guidance documents and special-purpose investment vehicles such as green bonds. ESG indices remain the most popular sustainability instrument among exchanges; there are more than a hundred ESG themed indices around the world, with 38 of 82 exchanges providing them. Some 32 stock exchanges provide formal guidance to issuers on reporting ESG information, including 17 exchanges that introduced guidance for the first time in 2016 and early 2017. Moving beyond voluntary guidance, ESG information is incorporated into the listing rules on 12 exchanges. Mandatory ESG disclosure rules are emanating from stock exchanges as well as securities regulators.
29Overview
INVESTMENT AND THE DIGITAL ECONOMYThe digital economy – the application of internet-based digital technologies to the production and trade of goods and services – is becoming an ever more important part of the global economy. The transition to a digital economy can provide a boost to competitiveness across all sectors, new opportunities for business and entrepreneurial activity, and new avenues to access overseas markets and to participate in global e-value chains. It also provides new tools to tackle persistent development and social problems. However, it comes with a host of challenges — from the global digital divide, to potential negative social and development impacts, and complex, internet-specific regulatory issues — which policymakers need to address. The opportunities and challenges associated with the digital economy are particularly important for developing countries.
The digital economy has important implications for investment, and investment is crucial for digital development. First, the digital economy has the potential to transform the international operations of MNEs and the impact of foreign affiliates on host countries, and therefore affects investment policies. Second, digital development in all countries, and particularly the participation of developing countries in the global digital economy, calls for targeted investment policies to build connectivity infrastructure, promote digital firms and support digitalization of the wider economy. WIR17 looks at both perspectives in turn.
Digitalization transforms international production and MNEs
Information and communication technologies (ICTs) have been a fundamental enabler of the growth of international production. The rise of the digital economy represents at the same time both an intensification and a disruption in the symbiotic relationship between ICTs and international production. An intensification in that it provides MNEs with more far-reaching opportunities to redesign processes and routes to market, and to redefine governance modalities in global production networks. A disruption in that it gives rise to entirely new multinational business models, from “born globals” to virtual MNEs, with fundamentally different international footprints.
ICT MNEs (i.e. telecom MNEs and tech MNEs) are the enablers of the global digital economy: they provide the infrastructure and the tools
30 World Investment Report 2017 Investment and the Digital Economy
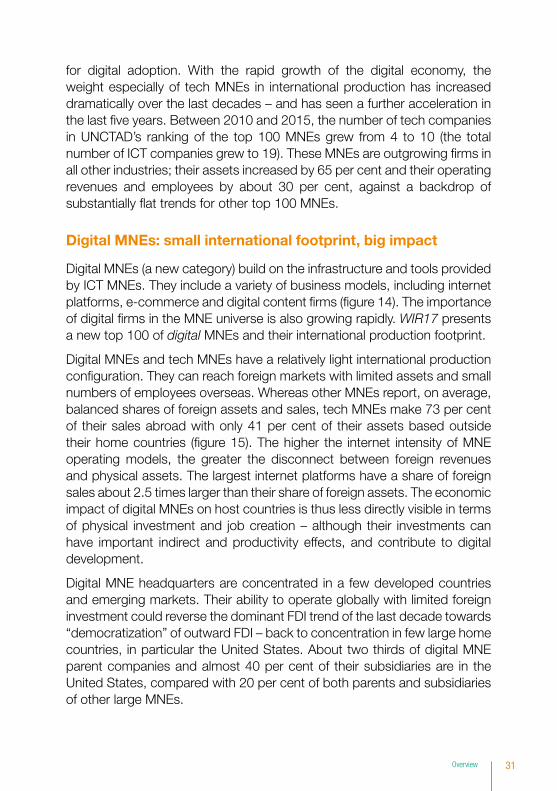
for digital adoption. With the rapid growth of the digital economy, the weight especially of tech MNEs in international production has increased dramatically over the last decades – and has seen a further acceleration in the last five years. Between 2010 and 2015, the number of tech companies in UNCTAD’s ranking of the top 100 MNEs grew from 4 to 10 (the total number of ICT companies grew to 19). These MNEs are outgrowing firms in all other industries; their assets increased by 65 per cent and their operating revenues and employees by about 30 per cent, against a backdrop of substantially flat trends for other top 100 MNEs.
Digital MNEs: small international footprint, big impact
Digital MNEs (a new category) build on the infrastructure and tools provided by ICT MNEs. They include a variety of business models, including internet platforms, e-commerce and digital content firms (figure 14). The importance of digital firms in the MNE universe is also growing rapidly. WIR17 presents a new top 100 of digital MNEs and their international production footprint.
Digital MNEs and tech MNEs have a relatively light international production configuration. They can reach foreign markets with limited assets and small numbers of employees overseas. Whereas other MNEs report, on average, balanced shares of foreign assets and sales, tech MNEs make 73 per cent of their sales abroad with only 41 per cent of their assets based outside their home countries (figure 15). The higher the internet intensity of MNE operating models, the greater the disconnect between foreign revenues and physical assets. The largest internet platforms have a share of foreign sales about 2.5 times larger than their share of foreign assets. The economic impact of digital MNEs on host countries is thus less directly visible in terms of physical investment and job creation – although their investments can have important indirect and productivity effects, and contribute to digital development.
Digital MNE headquarters are concentrated in a few developed countries and emerging markets. Their ability to operate globally with limited foreign investment could reverse the dominant FDI trend of the last decade towards “democratization” of outward FDI – back to concentration in few large home countries, in particular the United States. About two thirds of digital MNE parent companies and almost 40 per cent of their subsidiaries are in the United States, compared with 20 per cent of both parents and subsidiaries of other large MNEs.
31Overview
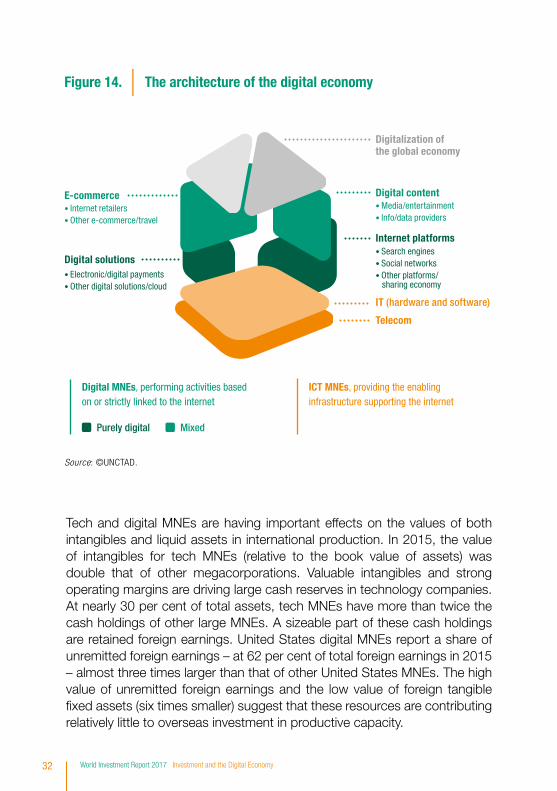
Figure 14. The architecture of the digital economy
Mixed
Digitalization of the global economy
Digital contentE-commerce
Internet platforms
IT (hardware and software)
Telecom
Digital solutions
Purely digital
Digital MNEs, performing activities based on or strictly linked to the internet
ICT MNEs, providing the enabling infrastructure supporting the internet
• Search engines• Social networks• Other platforms/ sharing economy
• Electronic/digital payments• Other digital solutions/cloud
• Internet retailers• Other e-commerce/travel
• Media/entertainment• Info/data providers
Source: ©UNCTAD.
Tech and digital MNEs are having important effects on the values of both intangibles and liquid assets in international production. In 2015, the value of intangibles for tech MNEs (relative to the book value of assets) was double that of other megacorporations. Valuable intangibles and strong operating margins are driving large cash reserves in technology companies. At nearly 30 per cent of total assets, tech MNEs have more than twice the cash holdings of other large MNEs. A sizeable part of these cash holdings are retained foreign earnings. United States digital MNEs report a share of unremitted foreign earnings – at 62 per cent of total foreign earnings in 2015 – almost three times larger than that of other United States MNEs. The high value of unremitted foreign earnings and the low value of foreign tangible fixed assets (six times smaller) suggest that these resources are contributing relatively little to overseas investment in productive capacity.
32 World Investment Report 2017 Investment and the Digital Economy
Source: ©UNCTAD.
Figure 15.
Share of foreign assets
Share of foreign sales
Other MNEsTech MNEs
Ratio share of foreign sales/share of foreign assets
Average shares of foreign assets and foreign sales inUNCTAD’s top 100 MNEs, 2015
1.0
64%
65%
73%
41%
1.8
Digital adoption will ultimately affect all MNEs
The digital economy is not limited to the ICT sector and to digital firms. Arguably the biggest economic impact comes from the digitalization of processes and supply chains across all sectors of the global economy. Digitalization can affect any process in the supply chain, including procurement, production, coordination across networks of operating units, outbound logistics and customer relations. The international production profiles seen in digital firms could be a harbinger of the future for many industries. They may represent the extreme end of a transformation process that could affect all MNEs, to varying degrees. To date, the impact of digitalization on the international footprint (foreign assets, sales and employees) of non-digital MNEs is limited, but a trend towards more asset-light forms of international production and alternative modes of governance has begun.
Digital adoption in MNEs outside the digital sector can change international production in a number of ways. Different scenarios are possible, affecting the direction of international production trends (towards either more centralized or more distributed production), the nature of international production (the types of activities involved) and the impact of international production. For example, digital-twin production sites and 3D printing might lead to smaller investments in more countries. Conversely, big data and mass customization
33Overview
technologies might lead to fewer and larger production sites. Digital technologies are accelerating “servicification”, potentially increasing foreign affiliate activity in services, as well as in contracting activities and non-equity relationships. At the same time, the greater importance of technology and intellectual property in value creation can lead to the reshoring of some overseas contracting activity. Finally, disintermediation trends brought on by digitalization can lead to some sectors in host countries – for example, retailers and distributors – losing out. At the same time, new distribution partnerships are being created, with scope for new value added services.
Strategic implications for investment policymakers
For investment policymakers, new actors on the international production scene and the evolving nature of MNE international operations have implications for strategic investment targeting. Their economy’s competitive advantages for the attraction of international investment may be different in a digital economy that relies less on some factors, such as low-cost labour, and more on others, such as skills and low-cost energy. This poses particular challenges for developing countries.
Digital sector investments also have implications for policies and institutions for the promotion and facilitation of investment. For example, IPAs are usually measured on direct physical investment impact: productive assets created and jobs generated – less evident in digital sector investment. Furthermore, digitalization has implications for regulations governing investor behaviour. Investment rules designed for the physical economy may need to be reviewed in light of new digital business models. The same applies to sector-specific regulations. Many of the traditional industries most affected by digitalization – such as retail, media and (consumer) finance – are also those in which numerous countries maintain investment restrictions (figure 16). (As a consequence, there could also be implications for IIAs, because the same industries tend to feature in reservations in IIAs.) Moreover, digital MNEs are crossing industry boundaries and disrupting other highly regulated industries (e.g. transportation). Some analogue-era regulations may become obsolete (such as retail restrictions that risk being bypassed by e-commerce) or could inadvertently slow down digital adoption (such as sector regulations that effectively block new digital entrants); others may need adaptation to the digital age in order to achieve their public policy objectives. Finally, also at the international level, policymakers need to assess how evolving rules in e-commerce and services trade affect investment treaty making.
34 World Investment Report 2017 Investment and the Digital Economy
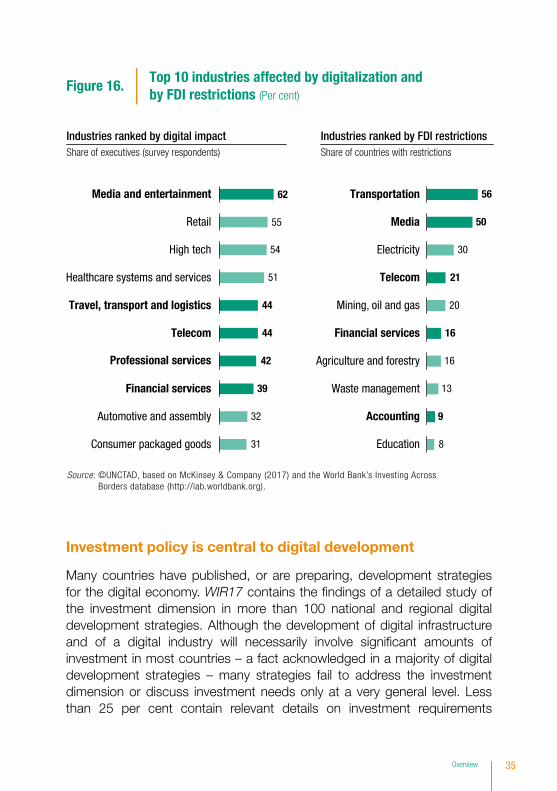
Investment policy is central to digital development
Many countries have published, or are preparing, development strategies for the digital economy. WIR17 contains the findings of a detailed study of the investment dimension in more than 100 national and regional digital development strategies. Although the development of digital infrastructure and of a digital industry will necessarily involve significant amounts of investment in most countries – a fact acknowledged in a majority of digital development strategies – many strategies fail to address the investment dimension or discuss investment needs only at a very general level. Less than 25 per cent contain relevant details on investment requirements
Source: ©UNCTAD, based on McKinsey & Company (2017) and the World Bank’s Investing Across Borders database (http://iab.worldbank.org).
8
9
13
16
16
20
21
30
50
5662
55
54
51
44
44
42
39
32
31
Figure 16.Top 10 industries affected by digitalization and by FDI restrictions (Per cent)
Industries ranked by digital impact Industries ranked by FDI restrictions
Education
Accounting
Waste management
Agriculture and forestry
Financial services
Mining, oil and gas
Telecom
Electricity
Media
Transportation
Consumer packaged goods
Automotive and assembly
Financial services
Professional services
Telecom
Travel, transport and logistics
Healthcare systems and services
High tech
Retail
Media and entertainment
Share of executives (survey respondents) Share of countries with restrictions
35Overview
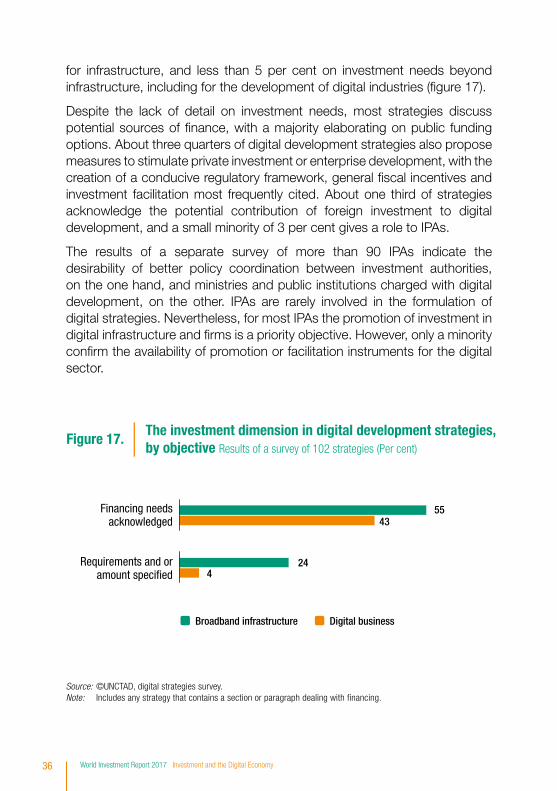
for infrastructure, and less than 5 per cent on investment needs beyond infrastructure, including for the development of digital industries (figure 17).
Despite the lack of detail on investment needs, most strategies discuss potential sources of finance, with a majority elaborating on public funding options. About three quarters of digital development strategies also propose measures to stimulate private investment or enterprise development, with the creation of a conducive regulatory framework, general fiscal incentives and investment facilitation most frequently cited. About one third of strategies acknowledge the potential contribution of foreign investment to digital development, and a small minority of 3 per cent gives a role to IPAs.
The results of a separate survey of more than 90 IPAs indicate the desirability of better policy coordination between investment authorities, on the one hand, and ministries and public institutions charged with digital development, on the other. IPAs are rarely involved in the formulation of digital strategies. Nevertheless, for most IPAs the promotion of investment in digital infrastructure and firms is a priority objective. However, only a minority confirm the availability of promotion or facilitation instruments for the digital sector.
Figure 17.The investment dimension in digital development strategies,by objective Results of a survey of 102 strategies (Per cent)
4
43
24
55
Digital businessBroadband infrastructure
Financing needsacknowledged
Requirements and oramount speci�ed
Source: ©UNCTAD, digital strategies survey.Note: Includes any strategy that contains a section or paragraph dealing with financing.
36 World Investment Report 2017 Investment and the Digital Economy
Digital development strategies that provide details on investment needs often focus exclusively on infrastructure (e.g. broadband coverage). A comprehensive digital development strategy should cover investment in digital infrastructure, in digital firms and in digital adoption by firms across all industries.
Build digital infrastructure
Investment requirements to achieve adequate connectivity for most developing countries could be less daunting than often supposed: infrastructure investments to build universal broadband coverage (a prerequisite for achieving the SDG target of universal access) are achievable with an enabling framework for private investment and policies aimed at generating sufficient demand. To help policymakers fill a gap in digital development strategies, WIR17 presents a simple tool that can help produce an estimate for infrastructure investment needs. On the basis of this tool (which takes into account only basic 3G coverage for all), UNCTAD estimates the total investment costs associated with universal coverage in developing countries at less than $100 billion.
Government support and forms of public-private partnerships will be needed for universal connectivity, including in thinly populated and low-income areas. Although telecommunication firms construct the bulk of networks and internet exchange points, attracting digital MNEs can help complete internet infrastructure (e.g. content distribution networks and data centres). Regional cooperation for investment in internet infrastructure can increase the attractiveness of infrastructure projects for international investors.
Build a digital sector
With connectivity in many developing countries well ahead of usage, speeding up digital development requires a focus on investment in local digital content and services to increase demand. This should include stimulating investment in enterprise development by creating and maintaining a conducive regulatory framework for digital firms, and by undertaking active support measures, which may include establishing technology or innovation hubs and incubators; building or improving e-government services to lead the way, create demand for local developers and lower business costs; supporting venture capital funding and other innovative financing approaches, such as crowdfunding; and instituting skill-building programmes. Linkages with
37Overview
global firms can help, and the involvement of foreign investors in local digital firms can accelerate their growth, but developing the digital sector mostly means supporting domestic enterprise development, rather than promoting investment by digital MNEs.
Speed up digital adoption in the wider economy
The greatest development value may well be in the digitalization of firms in non-digital sectors. Internet usage by businesses in developing countries is significantly behind that in developed countries. Promoting investment in ICT across all firms, as well as business linkages and participation in GVCs, should be an important part of digital development policies.
Digital adoption by firms requires investment in internet access, in devices and computers, and in relevant training. A number of factors will have an impact on investment decisions in this area. First, the policy environment for digital services is relevant for firms across all sectors, as all firms are affected by regulations on, for example, data protection and privacy. Second, tariffs and taxes on devices, and taxes on internet usage, influence the effective costs of ICT adoption. Facilitating access to cloud services can lower such costs. Skills development – potentially in partnership with global digital MNEs and their existing programmes for this purpose – is also important, to provide companies with the ability to efficiently adopt and use internet technology and services, and to enable local firms to interact digitally with MNEs and access e-value chains.
Balancing public policy concerns and investor interests
While promoting investment in digital development, policymakers need to address public concerns. Doing so requires promulgating up-to-date regulations on such matters as data security, privacy, intellectual property protection, consumer protection and the safeguarding of cultural values. Where digital transformation causes disruption in other sectors or generates negative social or economic impacts, policymakers need to put in place policies to mitigate these effects. Overall, governments need to find a balanced approach that accommodates both public concerns and the interests of private investors.
38 World Investment Report 2017 Investment and the Digital Economy
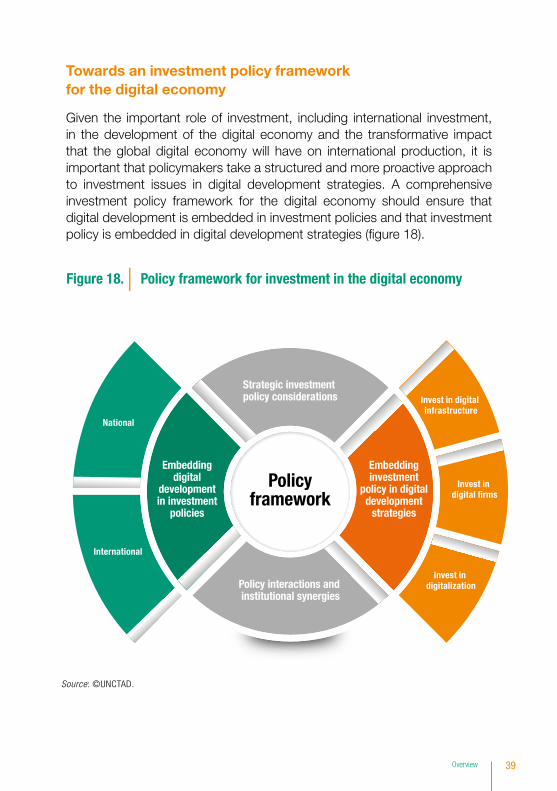
Towards an investment policy framework for the digital economy
Given the important role of investment, including international investment, in the development of the digital economy and the transformative impact that the global digital economy will have on international production, it is important that policymakers take a structured and more proactive approach to investment issues in digital development strategies. A comprehensive investment policy framework for the digital economy should ensure that digital development is embedded in investment policies and that investment policy is embedded in digital development strategies (figure 18).
Figure 18. Policy framework for investment in the digital economy
National
International
Invest in digital infrastructure
Invest in digital �rms
Invest in digitalization
Embeddinginvestment
policy in digitaldevelopment
strategies
Embeddingdigital
developmentin investment
policies
Strategic investment policy considerations
Policy interactions and institutional synergies
Policyframework
Source: ©UNCTAD.
39Overview

40 World Investment Report 2017 Investment and the Digital Economy
WORLD INVESTMENT REPORT PAST ISSUES
WIR 2016: Investor Nationality: Policy Challenges
WIR 2015: Reforming International Investment Governance
WIR 2014: Investing in the SDGs: An Action Plan
WIR 2013: Global Value Chains: Investment and Trade for Development
WIR 2012: Towards a New Generation of Investment Policies
WIR 2011: Non-Equity Modes of International Production and Development
WIR 2010: Investing in a Low-carbon Economy
WIR 2009: Transnational Corporations, Agricultural Production and Development
WIR 2008: Transnational Corporations and the Infrastructure Challenge
WIR 2007: Transnational Corporations, Extractive Industries and Development
WIR 2006: FDI from Developing and Transition Economies: Implications for Development
WIR 2005: Transnational Corporations and the Internationalization of R&D
WIR 2004: The Shift Towards Services
WIR 2003: FDI Policies for Development: National and International Perspectives
WIR 2002: Transnational Corporations and Export Competitiveness
WIR 2001: Promoting Linkages
WIR 2000: Cross-border Mergers and Acquisitions and Development
WIR 1999: Foreign Direct Investment and the Challenge of Development
WIR 1998: Trends and Determinants
WIR 1997: Transnational Corporations, Market Structure and Competition Policy
WIR 1996: Investment, Trade and International Policy Arrangements
WIR 1995: Transnational Corporations and Competitiveness
WIR 1994: Transnational Corporations, Employment and the Workplace
WIR 1993: Transnational Corporations and Integrated International Production
WIR 1992: Transnational Corporations as Engines of Growth
WIR 1991: The Triad in Foreign Direct Investment
41Overview
World Investment Reportworldinvestmentreport.org
World Investment Forumunctad-worldinvestmentforum.org
UNCTAD Investment Policy Framework for Sustainable Development investmentpolicyhub.unctad.org/ipfsd
UNCTAD Entrepreneurship Policy Frameworkunctad.org/en/PublicationsLibrary/diaeed2012d1_en.pdf
Sustainable Stock Exchanges Initiativesseinitiative.org
Business Schools for Impactbusiness-schools-for-impact.org
Investment Policy Hubinvestmentpolicyhub.unctad.org
FDI Statisticsunctad.org/fdistatistics
Investment Trends and Policies Monitorsunctad.org/diae
SELECTED UNCTAD PROGRAMMES ON INVESTMENT AND ENTERPRISE
The sales publications may be purchased from distributors of United Nations publications throughout the world. They may also be obtained by contacting:
United Nations Publications Customer Servicec/o National Book Network15200 NBN WayPO Box 190Blue Ridge Summit, PA 17214email: [email protected]
unp.un.org
HOW TO OBTAIN THE PUBLICATIONS
worldinvestmentreport.org
International Investment Agreementsunctad.org/iia
Investment Policy Reviewsunctad.org/ipr
ISAR Corporate Transparency Accountingunctad.org/isar
Transnational Corporations Journalunctad.org/tnc
For further information on the work on foreign direct investment and multinational enterprises, please address inquiries to:
Division on Investment and EnterpriseUnited Nations Conference on Trade and DevelopmentPalais des Nations, Room E-10052CH-1211 Geneva 10 Switzerland
Telephone: +41 22 917 4533Fax: +41 22 917 0498unctad.org/diae
42 World Investment Report 2017 Investment and the Digital Economy