world employment social outlook · acknowledgements iii acknowledgements the world employment and...
TRANSCRIPT

WORLDEMPLOYMENTSOCIALOUTLOOK
TRENDS FOR WOMEN 2017
International Labour Office • Geneva

Copyright © International Labour Organization 2017
First published 2017
Publications of the International Labour Office enjoy copyright under Protocol 2 of the Universal Copyright Convention. Nevertheless, short excerpts from them may be reproduced without authorization, on condition that the source is indicated. For rights of reproduction or translation, application should be made to ILO Publications (Rights and Licensing), International Labour Office, CH-1211 Geneva 22, Switzerland, or by email: [email protected]. The International Labour Office welcomes such applications.
Libraries, institutions and other users registered with a reproduction rights organization may make copies in accordance with the licences issued to them for this purpose. Visit www.ifrro.org to find the reproduction rights organization in your country.
World Employment and Social Outlook: Trends for women 2017 International Labour Office – Geneva: ILO, 2017
ISBN 978-92-2-130833-1 (print) ISBN 978-92-2-130834-8 (web pdf) ISBN 978-92-2-130458-6 (epub) ISBN 978-92-2-130459-3 (mobi) ISBN 978-92-2-130460-9 (kindle)
employment / unemployment / labour policy / gender / sex discrimination / sexual division of labour
13.01.3
The designations employed in ILO publications, which are in conformity with United Nations practice, and the presentation of material therein do not imply the expression of any opinion whatsoever on the part of the International Labour Office concerning the legal status of any country, area or territory or of its authorities, or concerning the delimitation of its frontiers.
The responsibility for opinions expressed in signed articles, studies and other contributions rests solely with their authors, and publication does not constitute an endorsement by the International Labour Office of the opinions expressed in them.
Reference to names of firms and commercial products and processes does not imply their endorsement by the International Labour Office, and any failure to mention a particular firm, commercial product or process is not a sign of disapproval.
ILO publications and digital products can be obtained through major booksellers and digital distribution platforms, or ordered directly from [email protected]. For more information, visit our website: www.ilo.org/publns or contact [email protected].
ILO Cataloguing in Publication Data
This publication was produced by the Document and Publications Production, Printing and Distribution Branch (PRODOC) of the ILO.
Graphic and typographic design, layout and composition, proofreading, printing, electronic publishing and distribution.
PRODOC endeavours to use paper sourced from forests managed in an environmentally sustainable and socially responsible manner.
Code: DTP-WEI-NOU

Acknowledgements iii
Acknowledgements
The World Employment and Social Outlook: Trends for Women 2017 was prepared by the Labour Market Trends and Policy Evaluation Unit (led by Steven Tobin) of the ILO Research Department. The report was produced by Stefan Kühn, Richard Horne and Sheena Yoon. Judy Rafferty provided valuable research assistance.
The forecast data underlining this report are derived from the ILO’s Trends Econometric Models, managed by Stefan Kühn and Steven Kapsos. The report would not have been possible without the feedback and baseline labour market information provided by the team led by Steven Kapsos, notably David Bescond, Rosina Gammarano, Roger Gomis, Yves Perardel and Marie-Claire Sodergren of the ILO Department of Statistics.
The report benefited from the guidance of Sangheon Lee, Director a.i. of the Research Department and comments by L. Jeff Johnson, Deputy Director of the Research Department. The team wishes to acknowledge the excellent suggestions provided by Deborah Greenfield, Deputy Director-General for Policy and James Howard, Senior Adviser to the Director-General. The authors are also very grateful to the Gender, Equality and Diversity Branch at the ILO and other colleagues for their input and feedback, notably Laura Addati, Antonia Asenjo, Florence Bonnet, Marva Corley-Coulibaly, Fernanda Dutra, Elizabeth Echeverria Manrique, Sara Elder, Ekkehard Ernst, Michela Esposito, Valeria Esquivel, Andre Gama, Carla Henry, Phu Huynh, Steven Kapsos, Takaaki Kizu, Santo Milasi, Guillermo Montt, Louise Nennen, Shauna Olney, Ira Postolachi, Uma Rani, Pelin Sekerler-Richiardi, Claudia Ruiz, Isabel Valarino, Christian Viegelahn and Zheng Wang.

WESO_Women_2017_int.indd ivWESO_Women_2017_int.indd iv 23.06.17 10:1823.06.17 10:18
Table of contents v
Table of contents
Acknowledgements iii
Executive summary 1
1. Gender gaps in the labour market: Trends and impacts of improving outcomes for women 5
Introduction 5
1.1 Labour force participation 5
1.2 Unemployment 8
1.3 Gender gaps in sectoral and occupational opportunities 10
1.4 Status in employment 13
1.5 Gaps in income 16
1.6 Economic benefits of reducing gender gaps 18
2. Assessing the factors driving gender gaps in the labour market 21
Introduction 21
2.1 Understanding the gender gaps: Descriptive evidence and analytical framework 21
2.2 Preferences, gender role conformity and socio-economic constraints: An empirical assessment 25
2.3 Decomposing gender gaps in the workplace 29
2.4 Concluding remarks 31
3. Policy considerations 33
3.1 Reshaping gender role conformity and personal preferences 33
3.2 Addressing socio-economic constraints 36
3.3 Raising equality in labour market conditions 38
3.4 Moving forward 39
Appendices
Appendix A. Regional, country and income groupings 41
Appendix B. Labour market estimates, projections and scenarios 43
Appendix C. Estimating female labour force participation 46
Appendix D. Decomposing gender gaps in employment relationships 50
Appendix E. Gender breakdown of key labour market indicators 51
References 61
vi World Employment and Social Outlook – Trends for women 2017
Boxes
1. Measuring gender segregation in employment distribution 102. Involuntary part-time employment in EU-28 143. Gaps in working time and social protection coverage 154. Gender dimensions of working poverty in developed countries 165. Estimating the economic impact of “25 by 25” 196. The value of invisible work 237. Transforming social norms and personal preferences 358. Relieving socio-economic constraints on women 379. Empowering women to secure improved labour market conditions 39
Figures
1. Composition of total sectoral segregation by region, 1997 and 2017 112. Relative concentration of gender in occupation, by income group, latest year 123. Employment status by gender and region, 2017 134. Average female labour force participation rates and income per capita, 2016 225. Analytical framework of labour market outcomes 246. Estimating cumulative effects of fundamental drivers 287. Decomposition of gender gaps in type of employment relationship 308. Visual framework of policy responses to gender gaps in the labour market 34
Tables
1. Labour force participation rate by sex (per cent) and gender gap (percentage points), 1997–2021 6
2. Unemployment rate by sex (per cent) and gender gap (percentage points), 1997–2021 93. Employment by economic class and sex, 2017 174. Effects of reducing gender gaps in the labour market by 2025 195. Preferences of women and constraints on their participation in the labour market, 2016
(per cent of respondents) 226. Marginal impact of drivers on the probability to participate in the labour market 26

WESO_Women_2017_int.indd viiWESO_Women_2017_int.indd vii 23.06.17 10:1823.06.17 10:18

WESO_Women_2017_int.indd viiiWESO_Women_2017_int.indd viii 23.06.17 10:1823.06.17 10:18

Executive summary 1
Executive summary
Gaps between men and women in the world of work remain widespread and begin with women’s limited access to the labour market…
Gender gaps are one of the most pressing labour market challenges facing the global community. In fact, women are substantially less likely than men to participate in the labour market, i.e. to either be in employment or looking for a job: the current global labour force participation rate for women at just over 49 per cent is nearly 27 percentage points lower than the rate for men (with no improvements anticipated in 2018). Worryingly, underlying this gap is a downward trend in participation rates for both men and women: between 1997 and 2017, the participation rates for both sexes have fallen by roughly 3 percentage points. In some countries, where the gap has narrowed it has been as a result of male rates falling more sharply than those of their female counterparts.
In 2017, the largest gender gap in participation rates, at nearly 31 percentage points, is faced by women in emerging countries, followed by those in developed countries, at just over 16 percentage points, and in developing countries, with a gap of 12 percentage points. In terms of regions, the gaps are widest in the Arab States, Northern Africa and Southern Asia, where they exceed 50 percentage points. These three regions also have the lowest levels of female participation rates (less than 30 per cent, compared to the global average of 49 per cent).
Looking ahead to 2021, out of the 11 subregions with available information, the gap is expected to narrow in only six. In other instances it is anticipated that the gap will widen or remain stable.
In light of the continuing lack of adequate progress in improving the situation of women in the labour market, the ILO Director-General has launched the Women at Work Centenary Initiative. This initiative intends to identify innovative action that could give new impetus to the ILO’s work on gender equality and non-discrimination in the run-up to and following the ILO’s centenary in 2019. The information provided in this report constitutes a key building block in moving that agenda forward.
… and, once in the job market, women have restricted access to quality employment opportunities.
When women do participate in the labour market, they are less likely than their male counterparts to find a job. Globally, the unemployment rate for women stands at 6.2 per cent in 2017, representing a gap of 0.7 percentage points from the male unemployment rate of 5.5 per cent. In 2018, both rates of unemployment are expected to remain relatively unchanged, meaning that the gap will persist at its current level (with no anticipated improvement before 2021, based on current trends). At the global level, this gap has remained relatively unchanged in recent years, albeit with considerable variation according to income group. For instance, in emerging countries the gap has widened: from 0.5 per-centage points in 2007 to 0.7 percentage points in 2017. In contrast, the gaps in both developing and developed countries have narrowed to reach 1.8 and 0.5 percentage points, respectively.
In the Arab States and Northern Africa, unemployment rates among women exceed 20 per cent, more than twice the rate of their male counterparts, and consequently the gap stands at over 10 percentage points in 2017 (in both regions the gap has widened in the past decade).

2 World Employment and Social Outlook – Trends for women 2017
Once in employment, nearly 15 per cent of women are contributing family workers (i.e. self-employed persons working in an establishment operated by a relative) whereas, among men, this status ac-counts for just 5.5 per cent. In developing countries where nearly 36.6 per cent of women, compared to only 17.2 per cent of men, are engaged as contributing family workers, this gap – standing at over 19 percentage points – is the widest. Moreover, the gap has widened by over 2 percentage points in the past decade.
Women are also more likely to undertake a greater number of hours of unpaid work due to time spent on household chores and care provision. Overall, they are more likely to work longer hours than men when both paid and unpaid work are taken into account. Moreover, when in paid employment, on average, women work fewer hours for pay or profit either because they opt to work part time or because part-time work is the only option available to them. In developing countries with available information, time-related underemployment among women, measured as persons working fewer hours than they would like to, can be as high as 40–50 per cent. Similarly, involuntary part-time work, of less than 30 hours per week, as a share of total employment in the EU-28 stood at 8.2 per cent in 2015 for women, compared with 2.6 per cent for men.
In addition, a comparison of the sectoral distribution of employment by sex reveals strong evidence of gender segregation, with education, health and social work being the sector with the highest relative concentration of women, followed by wholesale and retail trade. Moreover, the extent of gender segre-gation along sectoral lines has increased by one-third over the past two decades. There is also occupa-tional segregation in both emerging and developed countries, where women are relatively concentrated in the services and sales sector. Women are also concentrated in clerical support (in developed coun-tries) and as skilled agricultural, forestry and fishery workers (in emerging countries).
Closing these gaps would yield significant economic benefits and improve individual welfare
In 2014, G20 leaders committed to the “25 by 25” target, i.e. to reduce the gap in participation rates between men and women by 25 per cent by the year 2025. Estimates for this report indicate that, under certain assumptions, if such a goal were to be realized across all countries, it has the potential to boost global employment by 189 million, or 5.3 per cent. The vast majority of job gains (162 million) would be in emerging countries due to their relative size, combined with the fact they also have the widest gender gaps. The impact in developing and developed countries would be smaller, both in absolute terms and as a percentage of current employment levels (due primarily to the presence of comparably narrower gender gaps in labour market participation). Nevertheless, in both instances employment would grow, by 2 per cent in developing and by 3.3 per cent in developed countries.
Such an outcome would yield significant economic gains, raising global GDP in 2025 by 3.9 per cent, or US$5.8 trillion (equivalent to raising average global GDP growth over the next eight years by almost half a percentage point). The regions with the largest gender gaps, namely Northern Africa, the Arab States and Southern Asia, would see the greatest benefits. However, even in North America and parts of Europe, average annual GDP growth would be lifted by a quarter of a percentage point, an important contribution during times of weakened economic growth. The achievement of such a goal would also unlock large potential tax revenues, which could be used to finance measures to address the gender gaps in the labour market discussed below. Indeed, global tax revenue could increase by US$1.5 trillion.
While there are clear economic benefits to be gained by engaging more women in the labour force, there are also other significant positive impacts, such as the improvement in the welfare of women and the opportunity that it would afford them to realize their goals. Indeed, irrespective of their employment status, 70 per cent of women prefer to work at paid jobs. Considering that more than half of all women globally are out of the labour force, this suggests that there are significant challenges restricting their capacity and freedom to participate.
Moving forward, closing gender gaps will require concerted efforts across a range of policy dimensions. In this respect, the most immediate concern for policy-makers should be to alleviate the constraints on women’s freedom to choose whether or not to enter the labour market and the barriers they face once they are in the workplace.

Executive summary 3
Women who would like to improve their labour market situation are being held back by social norms and a range of socio-economic constraints
A precondition to entering the labour market is, of course, the preference and desire to do so. However, while aspirations are necessary, they are not sufficient. Indeed, a range of other factors are at play which can deter women from participating. Moreover, a woman’s preference and decision (even the freedom to choose) to participate in the labour market or improve her job quality (e.g. in terms of pay, occupation or status in employment) can be affected by a number of constraints.
In fact, with respect to deciding whether to participate in the first instance, socio-economic constraints have the largest impact on women’s probability of participating across nearly all country groupings (up to 30 percentage points). The most prevalent among these socio-economic constraints are work–life balance, marital status and lack of transportation.
Gender role conformity – the preferences and expectations of both women and men in the labour market – also plays a major role in constraining female labour market participation. This is true across all country groupings, albeit to a lesser degree in emerging countries. The most important factors in this regard, though to varying degrees, are the extent to which family members approve of women undertaking paid work and the degree of acceptance within a given society of women in the workplace.
The analysis of workplace gender gaps, i.e. gaps between men and women with respect to employment type (e.g. contributing family workers, part-time employment, etc.), reveals that the most important driver of these differences is neither the occupation nor the sector in which women are working, but other factors (such as discrimination or education). This is a strong indicator that social norms have a significant direct impact on gender gaps in employment.
A comprehensive suite of measures is needed that, first, reshapes gender role conformity and improves equality in labour market conditions…
Given the importance of social norms and gender role conformity in explaining gender gaps in the world of work, appropriate policy responses must address the root causes of segregation and diversify traditional employment opportunities for women and men. Only then can the constraints on women’s roles in the workplace be broken down. This means combating discrimination both within and outside the workplace. In particular, appropriate policy responses, with a view to achieving the targets of the Sustainable Development Goals (notably Goal 5, Gender Equality), need to principally address the differential treatment and perception of women relating to their place both in the world of work and in society more broadly, including, but not limited to:
• Promoting equal remuneration for work of equal value: The principle of equal remuneration for work of equal value needs to be integrated into law and included in collective bargaining processes. This requirement comes with prerequisites, such as improved wage transparency and gender-neutral job evaluation, and should also leverage existing tools, such as minimum wage setting systems, as well as strengthening collective bargaining. Achieving this aim will also promote equal treatment of an extended range of different types of workers, including informal workers.
• Tackling the root causes of occupational and sectoral segregation: Challenging social norms and placing greater value on skills related to care provision will help to break down gender stereotypes. This process begins in childhood, through education and outreach, e.g. by ensuring equal access to educational opportunities and addressing gender differences in the field of study selected by indi-viduals. Rewarding paid care work with adequate remuneration is also an important step. Supporting women’s representation, participation and leadership in decision-making will also help to challenge occupational and sectoral segregation. This applies to all areas of government and within employers’ and workers’ groups, as well as in firms.
• Transforming institutions to prevent and eliminate discrimination, violence and harassment against both women and men: Legislation to prevent and eliminate discrimination based on gender is an important first step. However, laws alone, even with strict implementation and monitoring, are in-sufficient to prevent and eliminate discrimination, violence and harassment in the world of work. Other measures, such as dissuasive sanctions, specialized equality bodies and public awareness campaigns are important complements in any effort to change attitudes and social norms.

4 World Employment and Social Outlook – Trends for women 2017
…and, second, addresses the socio-economic factors, including care provision, that influence participation
Women make a disproportionate contribution to society and households in providing work that is largely invisible and often undervalued. Work of this nature – which includes, among other things, caring for family members – is necessary for household survival and makes a significant contribution to the multidimensional welfare of societies, the development of communities and the advancement of the capabilities of all human lives. Hence, recognizing and giving value to the disproportionate contributions that women make in these areas, often while also holding a paid job, will play a critical and complemen-tary role in unlocking the potential and value of women’s work. Measures in this regard could include:
• Introducing improved policies to promote work–family balance: Millions of women and men worldwide are without the fundamental right to adequate parental protection and other basic social protection measures. Improved efforts need to be made to lay the groundwork for achieving harmonized work–family balances, and thus providing quality, family-friendly working conditions for women and men. At the same time, atypical hours and low-quality part-time work disproportionately penalize women in the labour force. Further, guaranteeing adequate social protection must include the incorporation of a gender dimension into the design, implementation and evaluation of social protection systems, in a way that is responsive to the characteristics and needs of both men and women, including maternity and women’s unequal share of what is commonly regarded as the female labour market, namely unpaid family care provision and household work, while simultaneously including gender-neutral provisions to avoid perpetuating segregation.
• Creating and protecting quality jobs in the care economy: Women are over-represented in certain areas of work, including the care professions – areas that often have a history of inadequate regu-lation and protection. Accordingly, there is a need to promote decent work for care professionals, including domestic and migrant workers, to address decent work deficits in the care professions. At the same time, recognizing, reducing and redistributing unpaid care work through public care services and changes in social infrastructure is imperative.
• Targeting the macroeconomic environment and informal economy: Macroeconomic policies can be important enablers of gender equality; however, due to their increased likelihood of being engaged in informal employment or other vulnerable categories of employment, women can be dispropor-tionately impacted by downturns and reversals in fiscal commitments to important social provisions. Therefore, the prerequisite of more inclusive macroeconomic policies needs to be complemented by support for gender-responsive policies, including the formalization of jobs in the informal economy.
1. Gender gaps in the labour market: Trends and impacts of improving outcomes 5
1 Gender gaps in the labour marketTrends and impacts of improving outcomes for women
Introduction
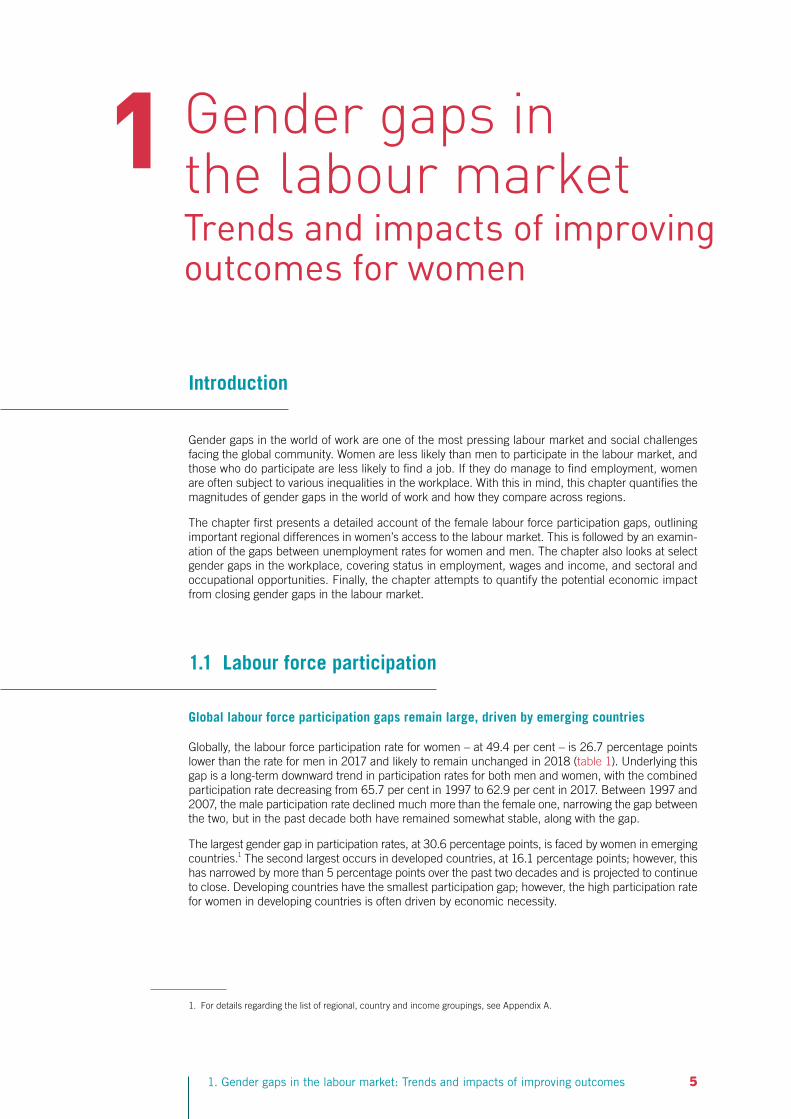
Gender gaps in the world of work are one of the most pressing labour market and social challenges facing the global community. Women are less likely than men to participate in the labour market, and those who do participate are less likely to find a job. If they do manage to find employment, women are often subject to various inequalities in the workplace. With this in mind, this chapter quantifies the magnitudes of gender gaps in the world of work and how they compare across regions.
The chapter first presents a detailed account of the female labour force participation gaps, outlining important regional differences in women’s access to the labour market. This is followed by an examin-ation of the gaps between unemployment rates for women and men. The chapter also looks at select gender gaps in the workplace, covering status in employment, wages and income, and sectoral and occupational opportunities. Finally, the chapter attempts to quantify the potential economic impact from closing gender gaps in the labour market.
1.1 L abour force participation
Global labour force participation gaps remain large, driven by emerging countries
Globally, the labour force participation rate for women – at 49.4 per cent – is 26.7 percentage points lower than the rate for men in 2017 and likely to remain unchanged in 2018 (table 1). Underlying this gap is a long-term downward trend in participation rates for both men and women, with the combined participation rate decreasing from 65.7 per cent in 1997 to 62.9 per cent in 2017. Between 1997 and 2007, the male participation rate declined much more than the female one, narrowing the gap between the two, but in the past decade both have remained somewhat stable, along with the gap.
The largest gender gap in participation rates, at 30.6 percentage points, is faced by women in emerging countries.1 The second largest occurs in developed countries, at 16.1 percentage points; however, this has narrowed by more than 5 percentage points over the past two decades and is projected to continue to close. Developing countries have the smallest participation gap; however, the high participation rate for women in developing countries is often driven by economic necessity.
1. For details regarding the list of regional, country and income groupings, see Appendix A.
6 World Employment and Social Outlook – Trends for women 2017
Table 1
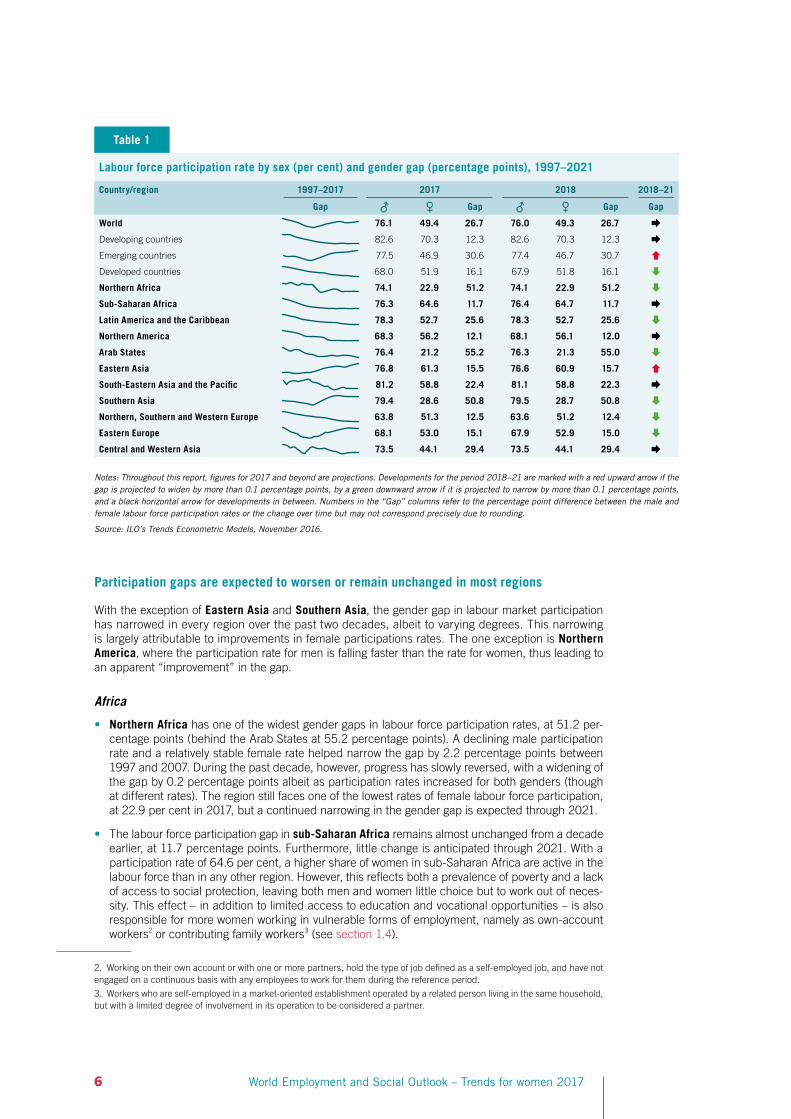
Labour force participation rate by sex (per cent) and gender gap (percentage points), 1997–2021
Country/region 1997–2017 2017 2018 2018–21
Gap Gap Gap Gap
World 76.1 49.4 26.7 76.0 49.3 26.7 ÆDeveloping countries 82.6 70.3 12.3 82.6 70.3 12.3 ÆEmerging countries 77.5 46.9 30.6 77.4 46.7 30.7 ÇDeveloped countries 68.0 51.9 16.1 67.9 51.8 16.1 ÈNorthern Africa 74.1 22.9 51.2 74.1 22.9 51.2 ÈSub-Saharan Africa 76.3 64.6 11.7 76.4 64.7 11.7 ÆLatin America and the Caribbean 78.3 52.7 25.6 78.3 52.7 25.6 ÈNorthern America 68.3 56.2 12.1 68.1 56.1 12.0 ÆArab States 76.4 21.2 55.2 76.3 21.3 55.0 ÈEastern Asia 76.8 61.3 15.5 76.6 60.9 15.7 ÇSouth-Eastern Asia and the Pacific 81.2 58.8 22.4 81.1 58.8 22.3 ÆSouthern Asia 79.4 28.6 50.8 79.5 28.7 50.8 ÈNorthern, Southern and Western Europe 63.8 51.3 12.5 63.6 51.2 12.4 ÈEastern Europe 68.1 53.0 15.1 67.9 52.9 15.0 ÈCentral and Western Asia 73.5 44.1 29.4 73.5 44.1 29.4 Æ
Notes: Throughout this report, figures for 2017 and beyond are projections. Developments for the period 2018–21 are marked with a red upward arrow if the gap is projected to widen by more than 0.1 percentage points, by a green downward arrow if it is projected to narrow by more than 0.1 percentage points, and a black horizontal arrow for developments in between. Numbers in the “Gap” columns refer to the percentage point difference between the male and female labour force participation rates or the change over time but may not correspond precisely due to rounding.
Source: ILO’s Trends Econometric Models, November 2016.
Participation gaps are expected to worsen or remain unchanged in most regions
With the exception of Eastern Asia and Southern Asia, the gender gap in labour market participation has narrowed in every region over the past two decades, albeit to varying degrees. This narrowing is largely attributable to improvements in female participations rates. The one exception is Northern America, where the participation rate for men is falling faster than the rate for women, thus leading to an apparent “improvement” in the gap.
Africa
• Northern Africa has one of the widest gender gaps in labour force participation rates, at 51.2 per-centage points (behind the Arab States at 55.2 percentage points). A declining male participation rate and a relatively stable female rate helped narrow the gap by 2.2 percentage points between 1997 and 2007. During the past decade, however, progress has slowly reversed, with a widening of the gap by 0.2 percentage points albeit as participation rates increased for both genders (though at different rates). The region still faces one of the lowest rates of female labour force participation, at 22.9 per cent in 2017, but a continued narrowing in the gender gap is expected through 2021.
• The labour force participation gap in sub-Saharan Africa remains almost unchanged from a decade earlier, at 11.7 percentage points. Furthermore, little change is anticipated through 2021. With a participation rate of 64.6 per cent, a higher share of women in sub-Saharan Africa are active in the labour force than in any other region. However, this reflects both a prevalence of poverty and a lack of access to social protection, leaving both men and women little choice but to work out of neces-sity. This effect – in addition to limited access to education and vocational opportunities – is also responsible for more women working in vulnerable forms of employment, namely as own-account workers2 or contributing family workers3 (see section 1.4).
2. Working on their own account or with one or more partners, hold the type of job defined as a self-employed job, and have not engaged on a continuous basis with any employees to work for them during the reference period.
3. Workers who are self-employed in a market-oriented establishment operated by a related person living in the same household, but with a limited degree of involvement in its operation to be considered a partner.

1. Gender gaps in the labour market: Trends and impacts of improving outcomes 7
The Americas
• Over the past two decades, Latin America and the Caribbean has recorded the largest percent-age-point reduction in the labour participation gap of all regions. The gap narrowed by 9.5 per-centage points over the period, to 25.6 percentage points in 2017, most of which took place between 1997 and 2007 (7 percentage points). The overall trend was driven by a steady decline in the male participation rate combined with an increase in the share of women entering the labour force. Between 1997 and 2007, the female participation rate rose by 5.3 percentage points, but since then it has increased by a more modest 0.8 percentage points, reaching 52.7 per cent in 2017. A further modest narrowing in the gap is anticipated from 2018 to 2021.
• In Northern America, the participation gender gap has narrowed by 3.4 percentage points over the past 20 years, to reach 12.1 per cent in 2017. Since 2007, the participation rate for men has de-clined by 3.8 percentage points and that for women by 2.5 percentage points, bringing the female rate to 56.2 per cent in 2017. Both the female and male rates are anticipated to decrease marginally in 2018, but at similar paces, and so the gap should remain unchanged through 2021.
Arab States
• The widest gender gap in labour force participation – at 55.2 percentage points – continues to per-sist in the Arab States. The participation rate for women is still the lowest globally, but it has been rising steadily – reaching 21.2 per cent in 2017. However, progress has been too slow to bridge the gap and catch up with the male counterpart rate of 76.4 per cent. Moreover, progress has slowed over the past 20 years, as the gap has narrowed by only 0.2 percentage points since 2007, following a reduction of 2.6 percentage points between 1997 and 2007. The gender gap is expected to con-tinue to close through 2021.
Asia and the Pacific
• Eastern Asia is one of only two regions (with Southern Asia) where the female labour force partici-pation rate has declined markedly since 1997. For Eastern Asia, this has resulted in a widening of the labour force participation gap to 15.5 percentage points in 2017. In fact, the participation rates for both men and women declined significantly between 1997 and 2007, but over the past decade the male participation rate has declined by 1.3 percentage points, while the female rate has de-clined by 2 percentage points, resulting in a widening of the gap. Despite this, the participation rate for women in the region remains the second highest globally at 61.3 per cent. A further decline in female participation through 2021 is expected to widen the gap further.
• In South-Eastern Asia and the Pacific, the gender gap in participation rates has narrowed slightly – by 1.6 percentage points – over the past two decades, to bring the gap to 22.4 percentage points in 2017. The narrowing of the gap has primarily been driven by a slight increase in the female labour force participation rate, while the male rate declined. The region has a relatively high rate of female participation, at 58.8 per cent, while the rate for men, at 81.2 per cent, is the highest globally. These high participation rates for both women and men reflect the limited access to social protection in the region, particularly given that incomes are relatively low. The gap in participation is expected to remain unchanged from 2018 to 2021.
• Over the past decade, Southern Asia has experienced the largest widening of the gap of all re-gions. The gap increased by around 2.1 percentage points from 2007 to 2017, resulting in a gap of 50.8 percentage points in 2017. From 2007, the rising participation rate of women observed during 1997–2007 began to reverse, resulting in a decline of 4.5 percentage points in the rate of female participation, to 28.6 per cent in 2017. A slight increase in the female rate and narrowing in the participation gap are anticipated from 2018 to 2021.
Europe and Central Asia
• In Northern, Southern and Western Europe, the gap in the labour force participation rate has nar-rowed by 8.3 percentage points in the past 20 years, to reach 12.5 percentage points in 2017. This trend has been driven by a declining male participation rate, while the rate for women has increased, reaching 51.3 per cent in 2017. This trend was amplified in the wake of the global financial crisis. A modest narrowing in the gap is anticipated between 2018 and 2021, as participation rates are expected to decrease for both women and men.

8 World Employment and Social Outlook – Trends for women 2017
• Eastern Europe experienced the strongest trend reversal in the labour force participation rate gap between 1997–2007 and 2007 –17. Declining participation rates for both women and men between 1997 and 2007 caused the regional gender gap to narrow by 1.5 percentage points over this period. The gap then widened between 2007 and 2017, by 1.5 percentage points, to 15.1 percentage points in 2017. The female rate, at 53.0 per cent in 2017, and the male rate, at 68.1 per cent, are both expected to decrease slightly in 2018, helping to narrow the gap further by 2021.
• In Central and Western Asia, the labour participation gender gap has declined steadily over the past 20 years, by 2.3 percentage points, as more women than men have entered the labour force. As a result, the labour force participation rates in 2017 stand at around 44.1 per cent for women and 73.5 per cent for men, giving a gender gap of 29.4 percentage points. Little change in the partici-pation rates for women and men, and thus the gap, is expected through 2021.
1.2 Unemployment
Women in the labour force are less likely than men to find jobs…
While women are less likely to participate in the labour force, when they do participate, they are more likely than their male counterparts to be unemployed. Globally, the unemployment rate for women stands at 6.2 per cent in 2017, representing a gap of 0.7 percentage points from the male unemployment rate of 5.5 per cent (table 2). This is projected to remain relatively unchanged going into 2018 and through 2021.
Since 1997, the global gender gap in unemployment has stayed around 0.8 percentage points. In emerging countries, however, the gap has widened in the past decade: from 0.5 percentage points in 2007 to 0.7 percentage points in 2017. In contrast, since 1997 the gaps in both developing and developed countries have narrowed, by 0.2 and 0.8 percentage points respectively. Accordingly, as of 2017, developed countries have the least difference between male and female unemployment rates, with a gap of 0.5 percentage points.
…a challenge that is particularly marked in certain regions
Africa
• In Northern Africa, women who participate in the labour force face the second highest un-employment rate globally, at 20 per cent, more than twice the rate for men. Significant narrowing in the unemployment gap was achieved between 1997 and 2007, with the gap being reduced by 2.5 percentage points. However, progress has since reversed; the gap widened by 0.7 percentage points between 2007 and 2017 and is expected to continue to widen, albeit marginally, through 2021. This reversal is largely attributed to an increase in the female unemployment rate, which far outstrips increases in the rate for men.
• Over the past decade, Sub-Saharan Africa has experienced declining unemployment rates for both men and women, although there has been little change in the gender gap. At 2.1 percentage points, this is the fourth largest gap in unemployment rates across all regions. Modest increases in both male and female rates are expected in 2018, but the percentage point gap is projected to remain the same.
The Americas
• The gender gap in unemployment in Latin America and the Caribbean has improved substantially since 1997, narrowing by 1.1 percentage points to 2017. Nevertheless, at 3.4 percentage points in 2017, it remains sizeable, behind only the Arab States and Northern Africa. During 1997–2007, progress was driven by the decline in the unemployment rate for women being bigger than that for men. In contrast, over the past decade, unemployment rates have increased, with the male rate in-creasing faster than the female rate. A modest increase in both female and male rates is anticipated in 2018, maintaining the same gap.

1. Gender gaps in the labour market: Trends and impacts of improving outcomes 9
Table 2
Unemployment rate by sex (per cent) and gender gap (percentage points), 1997–2021
Country/region 1997–2017 2017 2018 2018–21
Gap Gap Gap Gap
World 5.5 6.2 0.7 5.5 6.2 0.7 ÆDeveloping countries 4.7 6.5 1.8 4.7 6.5 1.8 ÆEmerging countries 5.4 6.1 0.7 5.5 6.1 0.6 ÆDeveloped countries 5.9 6.4 0.5 5.9 6.4 0.5 ÆNorthern Africa 9.5 20.0 10.5 9.3 20.0 10.7 ÇSub-Saharan Africa 6.2 8.3 2.1 6.3 8.4 2.1 ÆLatin America and the Caribbean 7.0 10.4 3.4 7.1 10.5 3.4 ÆNorthern America 5.3 4.9 –0.4 5.4 5.1 –0.3 ÆArab States 8.3 21.2 12.9 8.2 20.7 12.5 ÈEastern Asia 5.1 3.7 –1.4 5.2 3.7 –1.5 ÆSouth-Eastern Asia and the Pacific 3.8 3.9 0.1 3.8 3.9 0.1 ÆSouthern Asia 3.8 5.0 1.2 3.8 4.9 1.1 ÆNorthern, Southern and Western Europe 8.8 9.3 0.5 8.7 9.2 0.5 ÇEastern Europe 6.4 5.8 –0.6 6.2 5.7 –0.5 ÆCentral and Western Asia 8.9 9.6 0.7 9.1 9.6 0.5 È
Notes: Developments for the period 2017 –21 are marked with a red upward arrow if the gap is projected to widen by more than 0.1 percentage points, by a green downward arrow if it is projected to narrow by more than 0.1 percentage points, and a black horizontal arrow for developments in between. Numbers in the “Gap” columns refer to percentage point differences and may not correspond precisely to calculations using the female and male columns due to rounding.
Source: ILO’s Trends Econometric Models, November 2016.
• Northern America is one of three regions in the world where women in the labour force have a higher likelihood of being employed than men. The unemployment rate for women, at 4.9 per cent in 2017, is 0.4 percentage points lower than the rate for men, at 5.3 per cent. Over the past decade the gap has widened, partly as a result of the financial crisis having a disproportional impact on male-dominated sectors, thus leading to an increase in the male unemployment rate in excess of that experienced by women. In 2017, however, both female and male rates are below their pre-crisis levels of 5.0 and 5.4 per cent, respectively. A small increase in both rates is expected in 2018.
Arab States
• Women in the Arab States experience the highest rate of unemployment across all regions, at 21.2 per cent in 2017. This is more than twice the rate for their male counterparts, at 8.3 per cent, resulting in the largest regional unemployment gender gap, at 12.9 percentage points. Since 2007, the region has experienced a substantial widening of the gap, by 1.8 percentage points, mostly due to an increase in the unemployment rate for women. The gap is expected to narrow somewhat between 2018 and 2021.
Asia and the Pacific
• In Eastern Asia, the unemployment rate for women, at 3.7 per cent in 2017, is 1.4 percentage points lower than the rate for men, at 5.1 per cent. Since 1997, the unemployment rate for women has remained around 3.7 per cent, the lowest rate among women globally, while the unemployment rate for men has steadily risen. As a result, the unemployment gender gap has been widening since 1997, when the male rate was 0.9 percentage points higher than the female rate.
• In South-Eastern Asia and the Pacific, the narrow gender gap in unemployment rates – at 0.1 per-centage points – is driven by low unemployment rates for both men and women, at 3.8 and 3.9 per cent, respectively. The gap has remained relatively narrow over the past two decades, with the male rate occasionally surpassing the female rate. Little change from the 2017 rates is anticipated through 2021.
• In Southern Asia, unemployment rates are relatively low, below the world average, at 5.0 per cent for women and 3.8 per cent for men in 2017, resulting in a gap of 1.2 percentage points. Between 1997 and 2007, the regional gap narrowed by 0.5 percentage points; however, the trend has since reversed, driven by increases in the female unemployment rate and reductions in the male rate. Little change is expected through 2021.
10 World Employment and Social Outlook – Trends for women 2017
Europe and Central Asia
• In Northern, Southern and Western Europe, the female unemployment rate of 9.3 per cent in 2017 is 0.5 percentage points higher than the male rate, at 8.8 per cent. This represents a narrowing of the gender gap from 1.3 percentage points in 2007, largely because the male unemployment rate has increased at a faster pace than the female rate. Since 2010, however, the gap has been widening again, and this trend is anticipated to continue through 2021.
• In Eastern Europe, over the past two decades, unemployment rates for women have consistently been lower than those for men. In 2017, the rates are 5.8 per cent for women and 6.4 per cent for men, representing a gap of 0.6 percentage points. Despite modest decreases in both female and male rates being anticipated in 2018, little change in the gender gap is expected.
• In Central and Western Asia, the unemployment rate for women, at 9.6 per cent in 2017, is 0.7 per-centage points higher than the rate for men, at 8.9 per cent. The gap narrowed significantly between 1997 and 2007, when it closed from 1.8 percentage points to 0.2 percentage points. Over the past decade, however, the unemployment rate for women has increased steadily, while the rate for men has remained unchanged. Little change in the 2018 rates and gap is anticipated through 2021.
1.3 G ender gaps in sectoral and occupational opportunities
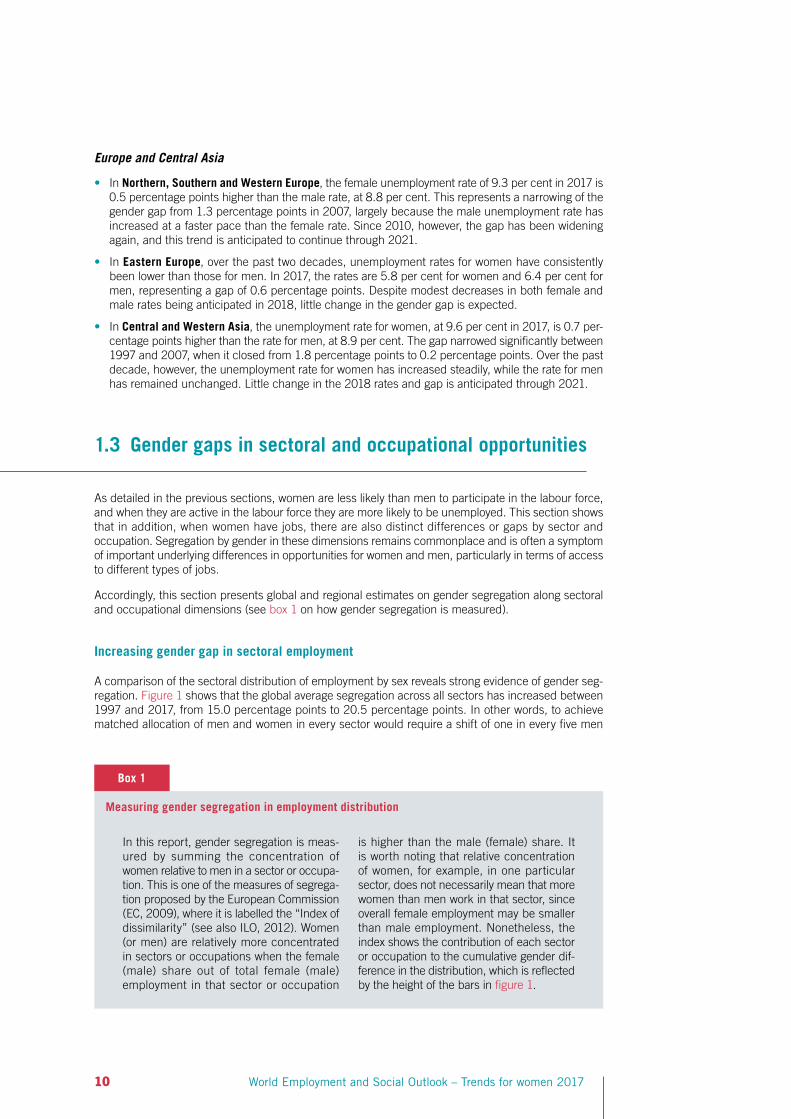
As detailed in the previous sections, women are less likely than men to participate in the labour force, and when they are active in the labour force they are more likely to be unemployed. This section shows that in addition, when women have jobs, there are also distinct differences or gaps by sector and occupation. Segregation by gender in these dimensions remains commonplace and is often a symptom of important underlying differences in opportunities for women and men, particularly in terms of access to different types of jobs.
Accordingly, this section presents global and regional estimates on gender segregation along sectoral and occupational dimensions (see box 1 on how gender segregation is measured).
Increasing gender gap in sectoral employment
A comparison of the sectoral distribution of employment by sex reveals strong evidence of gender seg-regation. Figure 1 shows that the global average segregation across all sectors has increased between 1997 and 2017, from 15.0 percentage points to 20.5 percentage points. In other words, to achieve matched allocation of men and women in every sector would require a shift of one in every five men
Box 1
Measuring gender segregation in employment distribution
In this report, gender segregation is meas-ured by summing the concentration of women relative to men in a sector or occupa-tion. This is one of the measures of segrega-tion proposed by the European Commission (EC, 2009), where it is labelled the “Index of dissimilarity” (see also ILO, 2012). Women (or men) are relatively more concentrated in sectors or occupations when the female (male) share out of total female (male) employment in that sector or occupation
is higher than the male (female) share. It is worth noting that relative concentration of women, for example, in one particular sector, does not necessarily mean that more women than men work in that sector, since overall female employment may be smaller than male employment. Nonetheless, the index shows the contribution of each sector or occupation to the cumulative gender dif-ference in the distribution, which is reflected by the height of the bars in figure 1.

1. Gender gaps in the labour market: Trends and impacts of improving outcomes 11
Figure 1
Composition of total sectoral segregation by region, 1997 and 2017
20
40
60
60
40
20
Rel
ativ
e co
ncen
trat
ion
of g
ende
rby
sec
tor
(per
cent
age
poin
ts)
belo
w a
xis
= m
en;
abov
e ax
is =
wom
en53.4
49.6
29.235.4 33.0 35.1
23.1
31.2 30.4 30.1 28.625.2 23.6 22.3 20.5
14.3
28.8 27.223.6 24.8
16.7 16.1 15.011.5
Agriculture, forestry, hunting and fishing
Manufacturing
Construction
Wholesale and retail trade, repair
Transport, storage and communication
Public administration and defence
Education, health and social work
Other over-represented sectors
Other under-represented sectors
1997 1997 1997 1997 1997 1997 1997 1997 1997 1997 1997 19972017 2017 2017 2017 2017 2017 2017 2017 2017 2017 2017 2017
Sectors with relatively higher concentration of women
Sectors with relatively higher concentration of men
ArabStates
NorthernAfrica
LatinAmericaand the
Caribbean
EasternEurope
Northern,Southern
and WesternEurope
NorthernAmerica
SouthernAsia
Centraland Western
Asia
EasternAsia
South-EasternAsia and
the Pacific
World Sub-SaharanAfrica
0
Notes: See Appendix E for details regarding sectoral employment data. The figure shows the difference between women and men with respect to the share of employment in a sector relative to total employment for the respective gender. Hence, it shows in which sectors women are relatively over-represented compared with men. Positives and negatives need to be of equal height because for any over-represented sector there needs to be an under-represented sector. The total height of a bar indicates the overall sectoral gender segregation. The world aggregate is lower than most regional aggregates since opposing over-representations across regions offset one another. The computation is based on 14 sectors.
Source: ILO Trends Econometric Models, November 2016.
or women to different sectors. At the global level, education, health and social work is the sector with the highest relative concentration of women, followed by wholesale and retail trade. In contrast, the sectors of construction and transport, storage and communication tend to have the highest relative concentration of male workers.
The high relative concentration of women in wholesale and retail trade in the global average is driven largely by Eastern Asia and South-Eastern Asia and the Pacific (and, to a lesser extent, sub-Saharan Africa). Similarly, these two Asian regions, alongside Northern Africa, also tend to have over-representa-tion of women in manufacturing, which is reflective of female-dominated sectors such as apparel manufacturing. The high relative concentration of women in agriculture is a prominent feature in Southern Asia, and to a lesser extent in the Arab States, Central and Western Asia, Eastern Asia and sub-Saharan Africa. This is reflective of the traditional gender roles held by lower-income households in rural areas. In all regions, construction, transport, storage and communication, and public adminis-tration and defence have relatively high concentrations of men (this last sector is driven by the inclusion of armed forces in the classification).
In terms of total sectoral segregation (as denoted by the cumulative heights of the columns in figure 1), in 2017 the Arab States region has the largest sectoral segregation, at 49.6 percentage points. This is a slight reduction from the 53.4 percentage points recorded in 1997, driven by a reduction of female over-representation in agriculture. Northern Africa has the second highest total sectoral segregation, at 35.4 percentage points, up from 29.2 percentage points in 1997, in part driven by increased over-representation in education, health and social work. In Latin America and the Caribbean, total sectoral segregation is at 35.1 percentage points, up slightly from 33.0 percentage points in 1997.
Sub-Saharan Africa, on the other hand, has the lowest aggregate sectoral segregation, at 14.3 per-centage points, although this has increased slightly from 11.5 percentage points in 1997. The increase occurred despite a reduction in relative female concentration in agriculture, as this was offset by an increase in relative female concentration in wholesale and retail trade. Northern America and Northern, Southern and Western Europe have fairly similar sectors and levels of segregation per sector, specifically predominant female concentration in education, health and social work, and relative male concentration in manufacturing, construction and transport, storage and communication.

12 World Employment and Social Outlook – Trends for women 2017
Figure 2
Relative concentration of gender in occupation, by income group, latest year
555 5 1020 15
Craft and related trades workers
Plant and machine operators and assemblers
Managers
Elementary occupations
Not elsewhere classified
Technicians and associate professionals
Clerical support workers
Professionals
Skilled agricultural, forestry and fishery workers
Services and sales workers
Emerging countries
Developed countries
0
Rel
ativ
ely
high
con
cent
rati
on o
f w
omen
Rel
ativ
ely
high
con
cent
rati
on o
f m
en
Relative concentration of gender in occupation (percentage points)left of axis = men; right of axis = women
Notes: The figure shows the difference between women and men with respect to the share of employment in an occupational group relative to total employment for the respective gender. Hence, it shows in which occupational groups women are relatively over-represented compared with men. The sample includes 68 emerging countries and 54 developed countries. Latest year is at least 2004, with 67 per cent of observations being 2014 or later. The computation is based on nine occupations.
Source: ILO calculations based on ILOSTAT.
Significant occupational segregation
In addition to gender segregation by sector, there is also gender segregation by occupational group. In 2017, total occupational segregation in developed countries is, at 30.4 percentage points, almost twice as large as in emerging countries, at 17.0 percentage points.
As shown in figure 2, segregation patterns are relatively similar between emerging countries and de-veloped countries, albeit to different magnitudes. In both country income groups, men are more highly concentrated in the following occupational groups: craft and related trades workers, plant and machine operators and assemblers, and managers. In contrast, in both country groups, women are more highly concentrated in the services and sales workers and professionals groups.
In developed countries, women are also relatively more concentrated among clerical support workers and, to some degree, in elementary occupations. While men tend to be relatively more concentrated among skilled agricultural, forestry and fishery workers in developed countries, women are relatively concentrated in these occupations in emerging countries.4
Segregation is a symptom, as well as a cause, of further gender gaps on the labour market
Labour market segregation at the sectoral and occupational levels is potentially self-reinforcing because some occupations are more common in some sectors than in others. Furthermore, such segregation also affects gender gaps related to incomes and working conditions, and could even affect gaps in labour force participation and unemployment. In other words, if women are segregated into certain occupations and those occupations are not growing, this phenomenon can have a severe impact on labour market outcomes.5
4. According to the ISCO 08 classification, the skilled agricultural occupations category includes subsistence farming, which has a high female share.
5. For instance, Kapsos, Silberman and Bourmpoula (2014) find that severe occupational segregation resulted in 20.7 million fewer women employed in India over the period from 1994 to 2010.

1. Gender gaps in the labour market: Trends and impacts of improving outcomes 13
Figure 3
Employment status by gender and region, 2017
60
80
20
40
%
ArabStates
NorthernAfrica
LatinAmericaand the
Caribbean
EasternEurope
Northern,Southern
and WesternEurope
NorthernAmerica
SouthernAsia
Centraland Western
Asia
EasternAsia
South-EasternAsia and
the Pacific
World Sub-Saharan
Africa
Wage and salaried workersEmployersOwn-account workersContributing family workers
100
0
Source: ILO’s Trends Econometric Models, November 2016.
1.4 S tatus in employment
This section shows that while women are more likely to work in certain occupations and sectors, they are also less likely to be in wage and salaried employment than their male counterparts and are more likely to be in vulnerable forms of employment.
With economic development, more women than men transition to wage and salaried employment
Globally, the share of wage and salaried employment in total employment has increased from 48.4 per cent in 1997 to 54.8 per cent in 2017 (figure 3). Over this period, the share for women increased by 8.9 percentage points, from 46.5 to 55.4 per cent, while for men the share increased by 6 percentage points, from 48.4 to 54.4 per cent. As a result, the gender gap was reversed, so that in 2017 the share of workers in wage and salaried employment is higher for women than for men.
The share of women in wage and salaried employment tends to increase with a country’s level of eco-nomic development.6 In developing countries, for example, only 13.6 per cent of women enjoy wage and salaried employment, compared with 24.3 per cent of men. At the other end of the spectrum, the share of women in wage and salaried employment in developed countries is 89.1 per cent, compared with 83.7 per cent of men. The difference is marginal for emerging countries (around 51 per cent for both).
Looking only at the past decade, the share of workers in wage and salaried employment has been increasing for both sexes worldwide: by 3 percentage points for males and 3.7 percentage points for females, between 2007 and 2017. The most marked improvement for both men and women is observed in emerging countries, where the share increased by 4.3 percentage points for males and 5.7 percentage points for females, which corresponds to a reduction in the gender gap of 1.4 per-centage points over the period. Developing countries also experienced a notable overall improvement in the share for both genders – 3.6 percentage points for men and 2.6 percentage points for women – but this resulted in a widened percentage point gap.
6. The gap between the male and female shares of wage and salaried employment in total employment decreases by 0.6 per-centage points for each 10 per cent increase in GDP per capita. At the global average, the gap is zero at around US$20,700 (in PPP).
14 World Employment and Social Outlook – Trends for women 2017
Box 2
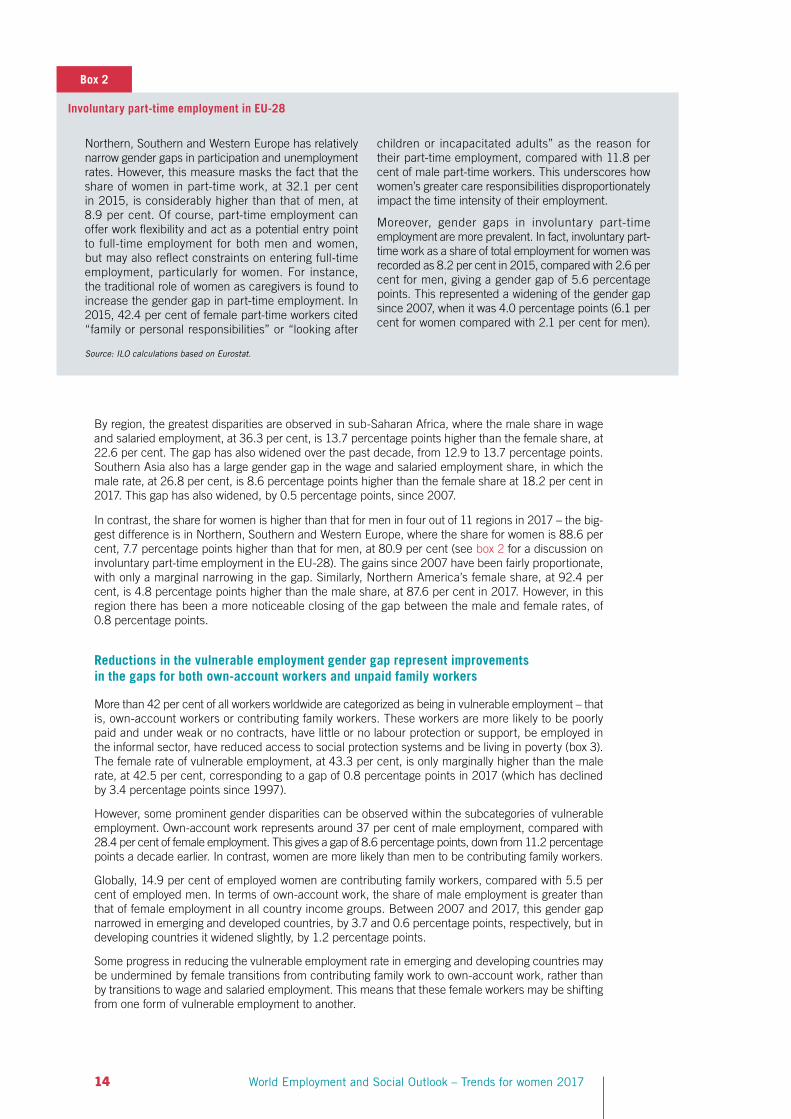
Involuntary part-time employment in EU-28
Northern, Southern and Western Europe has relatively narrow gender gaps in participation and unemployment rates. However, this measure masks the fact that the share of women in part-time work, at 32.1 per cent in 2015, is considerably higher than that of men, at 8.9 per cent. Of course, part-time employment can offer work flexibility and act as a potential entry point to full-time employment for both men and women, but may also reflect constraints on entering full-time employment, particularly for women. For instance, the traditional role of women as caregivers is found to increase the gender gap in part-time employment. In 2015, 42.4 per cent of female part-time workers cited “family or personal responsibilities” or “looking after
children or incapacitated adults” as the reason for their part-time employment, compared with 11.8 per cent of male part-time workers. This underscores how women’s greater care responsibilities disproportionately impact the time intensity of their employment.
Moreover, gender gaps in involuntary part-time employment are more prevalent. In fact, involuntary part-time work as a share of total employment for women was recorded as 8.2 per cent in 2015, compared with 2.6 per cent for men, giving a gender gap of 5.6 percentage points. This represented a widening of the gender gap since 2007, when it was 4.0 percentage points (6.1 per cent for women compared with 2.1 per cent for men).
Source: ILO calculations based on Eurostat.
By region, the greatest disparities are observed in sub-Saharan Africa, where the male share in wage and salaried employment, at 36.3 per cent, is 13.7 percentage points higher than the female share, at 22.6 per cent. The gap has also widened over the past decade, from 12.9 to 13.7 percentage points. Southern Asia also has a large gender gap in the wage and salaried employment share, in which the male rate, at 26.8 per cent, is 8.6 percentage points higher than the female share at 18.2 per cent in 2017. This gap has also widened, by 0.5 percentage points, since 2007.
In contrast, the share for women is higher than that for men in four out of 11 regions in 2017 – the big-gest difference is in Northern, Southern and Western Europe, where the share for women is 88.6 per cent, 7.7 percentage points higher than that for men, at 80.9 per cent (see box 2 for a discussion on involuntary part-time employment in the EU-28). The gains since 2007 have been fairly proportionate, with only a marginal narrowing in the gap. Similarly, Northern America’s female share, at 92.4 per cent, is 4.8 percentage points higher than the male share, at 87.6 per cent in 2017. However, in this region there has been a more noticeable closing of the gap between the male and female rates, of 0.8 percentage points.
Reductions in the vulnerable employment gender gap represent improvements in the gaps for both own-account workers and unpaid family workers
More than 42 per cent of all workers worldwide are categorized as being in vulnerable employment – that is, own-account workers or contributing family workers. These workers are more likely to be poorly paid and under weak or no contracts, have little or no labour protection or support, be employed in the informal sector, have reduced access to social protection systems and be living in poverty (box 3). The female rate of vulnerable employment, at 43.3 per cent, is only marginally higher than the male rate, at 42.5 per cent, corresponding to a gap of 0.8 percentage points in 2017 (which has declined by 3.4 percentage points since 1997).
However, some prominent gender disparities can be observed within the subcategories of vulnerable employment. Own-account work represents around 37 per cent of male employment, compared with 28.4 per cent of female employment. This gives a gap of 8.6 percentage points, down from 11.2 percentage points a decade earlier. In contrast, women are more likely than men to be contributing family workers.
Globally, 14.9 per cent of employed women are contributing family workers, compared with 5.5 per cent of employed men. In terms of own-account work, the share of male employment is greater than that of female employment in all country income groups. Between 2007 and 2017, this gender gap narrowed in emerging and developed countries, by 3.7 and 0.6 percentage points, respectively, but in developing countries it widened slightly, by 1.2 percentage points.
Some progress in reducing the vulnerable employment rate in emerging and developing countries may be undermined by female transitions from contributing family work to own-account work, rather than by transitions to wage and salaried employment. This means that these female workers may be shifting from one form of vulnerable employment to another.

1. Gender gaps in the labour market: Trends and impacts of improving outcomes 15
e n t h e s
Box 3
Gaps in working time and social protection coverage
In general, women are more likely to work shorter hours for pay or profit, and longer hours for unpaid work. Time dimensions of employment reflect a range of additional gender gaps beneath the surface that correspond to factors such as time-related underemployment (working hours below a country specific threshold for workers willing and available to work additional hours), and hours spent doing household and care work.
• Time-related underemployment: Women are morlikely to be working fewer hours than men, but iaddition women are also more likely to work shorhours against their choice. In fact, for countries witavailable data, time-related underemployment can bas high as 40–50 per cent in developing countrie(see also box 2).
• Hours of unpaid work: On average, women tend to spend around 2.5 times more time on unpaid house-hold and care work than men. Women are, however, spending less time in such work as a result of more women entering the labour market, shrinking family sizes as well as improvements in time-saving technol-ogies and infrastructures.
Part of the reduction in hours spent by women in unpaid family work has been due to improvements in access to social protection, particularly maternity pro-tection. Nonetheless, women are still less likely to have access to social protection and when they do, they are often only entitled to lower benefits, partly as a reflec-tion of lower pay and a shorter contribution period.
• Informal employment: With respect to informal employment as a share of total employment, the di-rection of the gap depends very much on the income group considered. For instance, among 107 countries with available information, women are under-repre-sented in informal employment in emerging coun-tries (regardless of whether agriculture is included). In contrast, among developing countries women are over-represented by 4.9 percentage points and 8.7 percentage points (depending on whether agri-culture is included or excluded, respectively).
• Access to pensions: Women tend to be less well-cov-ered by pensions as a result of lower contributions attributed in part to lower pay, as well as a greater incidence of informal and non-standard forms of work. The proportion of women above retirement age receiving a pension is on average 10.6 percentage points lower than that of men.
• Maternity coverage: While most countries provide some maternity protection for employed women, nearly 60 per cent of women do not have a statutory right to maternity leave and 65.9 per cent do not benefit from mandatory coverage by law for income replacement during maternity leave. Even when women are covered, there is often a lack of awareness, problems with implementation as well as insufficient contributory capacity.
Source: ILO, 2016a.
Progress in reducing the gap in contributing family work may be undermined by transitions to own-account work
Globally, the proportion of women workers engaged as contributing family workers declined from 20.6 per cent in 2007 to 14.9 per cent in 2017. In relative terms, the global gender gap for contrib-uting family work narrowed from 13 percentage points in 1997 to 9.4 percentage points in 2017. As mentioned, it is likely that this has, in part, been due to women transitioning to own-account work, who thus often do not obtain any of the rights and protections more commonly offered to wage and salaried workers.
The gender gap for contributing family work is widest in developing countries, where 36.6 per cent of women and 17.2 per cent of men are engaged as contributing family workers. This equates to a gap of 19.4 percentage points, which represents a deterioration relative to the 17.0 percentage point gap recorded in 2007. In emerging countries, 15.6 per cent of employed women are in this category, compared with 5.4 per cent of men, which represents a narrowing of the gap of 5.4 percentage points since 2007. For developed countries, where the female share of contributing family work is 1.6 per cent, compared with 0.4 per cent for males, there has also been a marginal narrowing of the gap, by 0.7 percentage points.
Since 2007, gender gaps in contributing family work have decreased most significantly (by almost twice the global reduction of 5.6 percentage points) in Eastern Asia (10.8 percentage points), South-Eastern Asia and the Pacific (9.4 percentage points) and Southern Asia (9.2 percentage points). In contrast, Northern Africa and sub-Saharan Africa have both experienced a widening of the gender gap over the past decade, due to reductions in the female rates of employment as contributing family workers being smaller than the reductions in the male rates. As a result, the gender gaps for both regions in 2017 are at their widest since 1997.

16 World Employment and Social Outlook – Trends for women 2017
1.5 Gaps in income
Unequal remuneration between women and men persists virtually everywhere
As outlined in the ILO Global Wage Report 2016/17 (ILO, 2016b), gender wage gaps vary widely by country, but they tend to persist virtually everywhere. Estimates from the report reveal that gender gaps in hourly wage rates can reach 40 per cent in some countries. That is, female hourly earnings can be as little as 60 per cent of male hourly earnings. Part of this is explained by occupational and sectoral segregation between men and women (see section 1.3).
Differences in the remuneration of men and women can be partially explained by individual character-istics, such as education, skill and experience. Others argue that the gap is a result of the non-linearity of hours worked, i.e. shorter hours worked by women (preferring a more flexible schedule), which yields a disproportionate reduction in earnings, especially in certain sectors (e.g. legal and financial) (see for instance Goldin, 2014). In other cases, however, a recent study analysing micro-data for 2010 from the United States shows that after controlling for observable factors, such as education, job experience and occupation, 38 per cent of the gender wage gap remained unexplained (Blau and Kahn, 2016). In fact, various studies, decomposing the gender wage gap into determinable structural components and the unexplained gap, have attributed the unexplained gap to discrimination (Weichselbaumer and Winter-Ebmer, 2003).
In developed countries, the gender gap widens at higher wage levels
Overall for developed countries, the higher the average wage, the wider the gap in wages. In these countries, the gender wage gap is particularly magnified among the highest paid occupations, such as managers and CEOs: this is known as vertical segregation, or the “glass ceiling”. For instance, in Europe, the overall gender pay gap reaches close to 20 per cent; however, among CEOs the gap is twice as large, at nearly 40 per cent, and it continues to widen to 50 per cent among top 1 per cent of earners (ILO, 2016b).
Box 4
Gender dimensions of working poverty in developed countries
In-work poverty in developed countries is related to a host of factors, including age group, education, household size, household type, working time and type of contract (ILO, 2016a), all of which have underlying gender elements. For instance, persons with dependent children are more likely to be working and below the risk-of-poverty threshold – defined in the EU-28 as those living on less than 60 per cent of median income after social trans-fers – than those without. When this is
narrowed down to single parents with de-pendent children – who are more likely to be women – the risk-of-poverty rate for the EU-28, at 19.8 per cent is nearly double the rate for two or more adults with dependent children, at 10.5 per cent in 2015 (Eurostat, 2017). In the US (where the definition is an absolute measure of income below the offi-cial poverty threshold), working women are still more likely than working men to be in poverty, at 6.3 per cent and 5 per cent, re-spectively in 2015 (BLS, 2017).

1. Gender gaps in the labour market: Trends and impacts of improving outcomes 17
Similarly, horizontal segregation, or “glass walls”, driven by social norms, also contributes to the wage gap by segregating occupations by female or male characteristics (e.g. nursing vs engineering). As a result, the preferences and choices of women and men in the labour market are shaped by pre-vailing societal norms, which confine women and men to certain occupations. In consequence, women are often concentrated in lower-paid occupations and sectors, further driving the gap in wages (see figure 1, in section 1.3). Moreover, women also face the motherhood wage penalty when they re-enter employment after having a child. This penalty is driven by one or a combination of the following: lower wages arising from working shorter hours, forgone job experience, the exchange of higher-wage jobs for more flexible but lower-wage jobs, and discrimination by employers (Budig and England, 2001).
In emerging and developing countries households with working women experience less poverty
Almost one-third of working women and men in emerging and developing countries do not earn enough to lift themselves and their households out of poverty (ILO, 2017a). However, a higher share of working men, at 29.1 per cent, live below the poverty threshold than working women, at 27 per cent (table 3).7 This does not necessarily mean that women earn higher labour incomes; instead, it is rooted in the fact that working women are more likely to live in households with multiple earners. Sub-Saharan Africa and Southern Asia represent exceptions to this point, as working women face higher rates of poverty than men. In both these regions, women face exceptionally high rates of contributing family work; as a result, they are unlikely to be engaged in quality forms of employment. Furthermore, labour force participation in these regions may be driven by necessity, so that women in poor households are very likely to work.
Conversely, working women in emerging and developing countries are more likely than working men to live in a household with a per capita income of above US$13 per day, at 19.7 per cent for women compared with 16.3 per cent for men. This gap is especially pronounced in the Arab States and Latin America and the Caribbean, at more than 5 percentage points. This shows the importance of female labour force participation in reducing poverty, although it does rely on women having access to decent jobs.
For a brief discussion of gender dimension and working poverty in developed countries, see box 4.
7. Defined here as being in households living on less than US$3.10 per day per capita, also known as the moderate poverty threshold.
Table 3
Employment by economic class and sex, 2017
Country grouping Share of employment (%)
Working poverty Developing middle class Developed middle class (<US$ PPP 3.10/day) (US$ PPP 5–13/day) (> US$ PPP 13/day)
Emerging and developing countries 29.1 27.0 35.7 36.9 16.3 19.7
Developing countries 67.1 68.8 10.3 9.3 2.2 1.7
Emerging countries 26.0 21.5 38.5 41.0 16.4 21.3
Source: ILO’s Trends Econometric Models, November 2016.

18 World Employment and Social Outlook – Trends for women 2017
1.6 E conomic benefits of reducing gender gaps
Despite being only one dimension of welfare, the possibility of quantifying the economic gains gener-ated by pursuing equality between men and women in the labour market merits further discussion. The complete eradication of the gap in labour market participation (equivalent to adding 742 million women to the labour force) is a desirable goal over the long term, whereas the G20 target “25 by 25”, which aims to reduce the gap in participation rates between men and women by 25 per cent by the year 2025, is a more attainable benchmark over the medium term (G20, 2014).
Applying this target to all countries, rather than just G20 nations, reveals that reducing gender gaps in the labour market could increase the global labour force by 204 million by 2025 (an increase of 5.4 per cent) (table 4). Holding unemployment rates and male participation rates constant, this would boost global employment by 189 million (or 5.3 per cent), which could in turn increase global GDP by 3.9 per cent or US$5.8 trillion (equivalent to raising average global GDP growth over the next eight years by almost half a percentage point) (box 5).
The bulk of the additional employment, i.e. 162.4 million (6.2 per cent), would be generated in emerging countries (due to their relative size, combined with the fact they also have the widest gender gaps). The impact in developing and developed countries in terms of the anticipated percentage increase in employment is comparatively small (due to the fact that their gender gaps are narrower). Thus, the analysis suggests that while much larger efforts in all policy dimensions will be required in developing countries to reduce poverty, closing gender gaps can contribute significantly to reducing poverty in emerging countries.
Perhaps not surprisingly, the regions with the largest gender gaps, namely Northern Africa, the Arab States and Southern Asia, would see the greatest benefits in terms of growth. Nevertheless, even Northern America and Northern, Southern and Western Europe could increase their average annual GDP growth by a quarter of a percentage point, an important contribution during times of near-zero economic growth.
The achievement of such a goal unlocks large potential tax revenues. For example, global tax revenue could increase by US$1.5 trillion given currently projected government revenue shares in GDP, most of it in emerging (US$990 billion) and developed countries (US$530 billion). Consequently, policies pro-moting gender equality could be self-financing (see Chapter 3). Of course, larger female participation might shift some home production, which is unaccounted for in GDP, to market production, so that the actual increase in global output will be smaller.
Closing gender gaps in the workplace could unlock additional economic benefits. For instance, the fact that the largest part of the gender wage gap is explainable by observable factors, notably sectoral and occupational segregation (see above), suggests that women tend to be employed in lower productivity sectors and occupations.8 Consequently, facilitating women’s access to higher productivity sectors and occupations once in the labour market, as well as valuing female-dominated sectors and occupations, would provide an additional boost to global growth.
There are also other significant positive impacts, notably those that affect a woman’s freedom to choose and, in turn, her welfare (Kabeer, 2005).9 In particular, the discussion of closing gaps must be extended towards achieving the objective of substantive equality that allows women the substantial freedom to choose and act (Sen, 1990 and Nussbaum, 2011).10 Moreover, substantive equality aims to reach not “sameness” but the equality of results, outcomes, and human dignity that lie at the heart of the notion of decent work by recognizing the different constraints that men and women face in the world of work (Hepple, 2001).
8. The underlying assumption is that wage levels and productivity are related.
9. The term “agency” refers to a person’s ability to realize the goals and values that they have reason to pursue (Sen, 1995).
10. Substantive equality considers the specific needs of both women and men to achieve true equality. For instance, despite the fact that a policy is non-discriminatory, it may be still be indirectly discriminatory by not acknowledging the different needs of women (e.g. maternity health). Substantive freedoms extend beyond agency to “[e]xpanding the freedoms we have reason to value” enabling “fuller social persons, exercising our own volitions and interacting with – and influencing – the world in which we live” (Sen, 2001).

1. Gender gaps in the labour market: Trends and impacts of improving outcomes 19
Table 4
Effects of reducing gender gaps in the labour market by 2025
Country/region Labour force Employment GDP
Millions Per cent Millions Per cent Per cent
World 203.9 5.4 188.6 5.3 3.9
Developing countries 7.8 2.1 7.1 2.0 2.0
Emerging countries 175.5 6.3 162.4 6.2 4.8
Developed countries 20.6 3.3 19.0 3.3 2.6
Northern Africa 11.4 13.0 9.1 11.8 9.5
Sub-Saharan Africa 11.1 2.2 10.1 2.1 2.2
Latin America and the Caribbean 17.4 5.0 15.8 4.9 4.0
Northern America 4.8 2.5 4.5 2.5 2.0
Arab States 7.8 11.8 6.0 10.2 7.1
Eastern Asia 27.3 3.0 26.2 3.0 2.5
South-Eastern Asia and the Pacific 15.9 4.1 15.0 4.0 3.5
Southern Asia 92.7 11.1 87.7 11.0 9.2
Northern, Southern and Western Europe 5.7 2.6 5.1 2.6 2.0
Eastern Europe 4.5 3.3 4.2 3.3 2.6
Central and Western Asia 5.3 6.6 4.8 6.5 5.7
Note: The assumptions of the scenario are described in box 5. GDP shows the percentage difference in projected additional GDP in 2025, using PPP exchange rates.
Source: ILO estimations based on ILO’s Trends Econometric Models, November 2016.
Estimating the economic impact of “25 by 25”
Box 5
In order to estimate the economic impact of the “25 by 25” scenario, a number of assumptions were necessary. The first is obviously that the female participation rate increases such that the gap between the male and the female participation rate, by country, decreases by 25 per cent by 2025. The second is that each additional woman in the labour market succeeds in finding a job at the same rate as those currently
in the labour market, i.e. the female un-employment rate remains unchanged. Finally, it is assumed that these additional women attain 80 per cent of the average labour productivity in the respective year and country so as to take into consideration prevailing sectoral and occupational segre-gation, i.e. the fact that women are currently employed in lower productivity sectors and occupations.
In light of this, and given the potential economic, social and individual benefits to be gained by closing gender gaps in the labour market, it is important to understand their underlying drivers. The following chapter will therefore investigate the root causes of gender gaps in the world of work by focusing on labour force participation, in an effort to understand why so many women are outside the labour force despite expressing a preference to work. Of course, increasing labour supply also requires a corres-ponding rise in labour demand, both in absolute quantity and for women in particular.11 Chapter 3 of this report specifically details, among others, policies to address gender discrimination in both the supply of and demand for labour.
11. ILO (2017a) outlines a comprehensive set of policies necessary to raise overall labour demand, which includes well-designed and coordinated fiscal loosening against a backdrop of measures that ensure an equitable distribution of gains.

WESO_Women_2017_int.indd 20WESO_Women_2017_int.indd 20 23.06.17 10:1823.06.17 10:18

2. Assessing the factors driving gender gaps in the labour market 21
2 Assessing the factors driving gender gaps in the labour market
Introduction
The previous chapter showed that large gender gaps exist across a range of labour market dimensions. Women are less likely to participate, tend to face higher unemployment rates and suffer segregation in terms of job quality and access to certain occupations and sectors. This situation generates far-reaching consequences for the multidimensional welfare of people, extending well beyond the obvious economic loss, due to the underutilization of human capabilities and development potential.12 These gender gaps are present despite the preference of many women to participate in the labour market, underscoring the fact that women’s choices are constrained by a number of factors. Tackling gender gaps therefore requires a deeper understanding of their underlying drivers, which this chapter aims to provide.
This chapter is structured as follows: section 2.1 discusses the descriptive findings from the Gallup–ILO 2017 study and develops a framework for analysing the drivers and mechanisms underlying gender gaps in the labour market. Section 2.2 then applies this framework so as to gain a better under-standing of the Gallup–ILO descriptive findings and quantify the drivers of lower female labour force participation. This is followed by an assessment of gender gaps in the workplace, i.e. once a female participates (section 2.3), and the final section summarizes the findings stemming from this analysis.
2.1 Understanding the gender gaps: Descriptive evidence and analytical framework
Factors underlying gender gaps in the labour market
As detailed in Chapter 1, the gap in labour market participation rates is connected to the level of economic development, i.e. total participation rate levels were highest on average in developing coun-tries, followed by emerging and developed, respectively. A closer examination at the country level, however, shows that the female labour force participation rate is higher in developing and developed countries than in emerging countries, a phenomenon labelled the “feminization U” (figure 4) (see also Goldin, 1995; Mammen and Paxon, 2000; Tansel, 2001; Attanasio, Low and Sánchez-Marcos, 2005; Bhalotra and Umaña-Aponte, 2012). It is probable that the participation rates of women in developing countries are higher due to the economic necessity to work. Yet, the transition from emerging to de-veloped country does not automatically lead to a higher female participation rate. Instead, the wide spread of female participation rates across countries at all income levels suggests the presence of factors beyond economic growth at work.
12. The term “multidimensional” defines welfare in a sense that it accounts for a plurality of conditions beyond income and basic health but additionally the central capabilities related to longevity, knowledge and education, social relations, access to representation, subjective feelings and more that are central to the dignity of human lives (Nussbaum, 2001).

22 World Employment and Social Outlook – Trends for women 2017
Figure 4
Average female labour force participation rates and income per capita, 2016
25
50
75
100
6.5 7.5 8.5 9.5 10.5 11.5 12.5
Log GDP per capita, PPP(2011 constant US$)
Fem
ale
labo
ur f
orce
par
tici
pati
on r
ate
(%)
0
J
J
J
J
JJ
J
JJ
JJ
J
JJ
JJ
JJJ
J
JJ
J
J
JJ
J
JJ
J
J
J
J
J
J
J
JJ
JJ
J
J
J
J
J
JJ
J
J
JJ
J
JJ
J
J
JJ
J
J
J
J
J
JJ
J
J
J
J
J
JJJJ
JJ
JJJ
J
J
J
JJ
JJJ
J
JJ
J
J
J
JJ
J
J
J
J
JJ
J
JJ
J
J
J
JJJ
J
J
J
J
J
J
J
J
J
JJJ
J
JJ
J
J
J
J
J
JJJJJJJJJ
J
JJ
J
JJJJJJJ
J
J
JJ
JJJ
J
J
J
JJJJJ
JJJJJ
J
J
J
J
J
JJ
J
J
J
JJJ
J
J
J J
Developing countries Emerging countries Developed countries
Source: ILO calculations based on ILOSTAT and World Bank.
Table 5
Preferences of women and constraints on their participation in the labour market, 2016 (per cent of respondents)
Prefer Challenges reported in the labour market
to work
Work and Lack of Family Abuse/ Lack of Unequal family affordable members harassment/ good-paying pay
balance care don’t approve discrimination jobs
World 79.2 24.6 9.6 4.3 10.3 9.5 6.5
Northern Africa 69.9 30.5 6.5 5.6 24.5 7.9 3.1
Sub-Saharan Africa 85.4 19.2 11.9 5.8 14.9 7.9 3.4
Latin America and the Caribbean 74.9 22.5 14.2 3.6 9.6 7.7 6.1
Northern America 79.1 23.0 7.5 0.8 10.0 2.6 31.8
Arab States 70.5 29.4 4.5 7.5 9.8 9.1 3.8
Eastern Asia 79.8 21.7 22.4 1.2 6.7 7.4 3.6
South-Eastern Asia and the Pacific 81.2 26.6 7.3 1.2 8.8 6.6 5.8
Southern Asia 55.1 20.0 8.3 11.3 11.3 4.5 2.3
Northern, Southern and Western Europe 84.8 33.9 5.1 1.4 8.0 6.5 14.0
Eastern Europe 75.4 25.0 4.4 0.7 6.1 23.8 7.0
Central and Western Asia 79.8 23.2 8.7 8.6 6.9 16.7 3.5
Notes: This table accounts for the survey sample of a total of 70,561 observations representing the survey responses of women in 127 countries. Population weights are applied accordingly to achieve equal country representation. Results may vary slightly to those published in Gallup–ILO, 2017 due to country coverage. Darker shading indicates the top two challenges in the region. See Appendix C on weighting methods.
Source: ILO calculations based on Gallup World Poll 2016.
In fact, the 2016 Gallup World Poll, covering 142 countries, illustrates that the constraints women face are a function of a range of factors which extend beyond economic development (table 5). And while there is considerable scope in recognizing the value of work beyond the labour market (see box 6), the survey results demonstrate that globally a majority of women (just over 79 per cent) prefer to work at paid jobs despite their employment status (table 5) (70 per cent among full sample). Considering that approximately half of women globally are out of the labour force, this suggests that there are significant challenges restricting their capabilities and freedom to participate.13 At the global level, the most important constraint reported by women is the struggle to balance work and family,
13. Capabilities in the context of this report adopts Sen’s (1990) and Nussbaum’s (2001) approach that recognizes that the full empowerment of women requires the ability and agency to realize their goals in all areas of life including financial, economic, political, social, cultural, and in and outside the home.

2. Assessing the factors driving gender gaps in the labour market 23
Box 6
The value of invisible work
Efforts to close gender gaps in the labour market and the resulting individual and eco-nomic benefit that would be derived from such efforts must be put in the broader context. Notably, these efforts should not undermine or fail to recognize valuable contributions to society made outside of the labour market. Instead, they reveal that women are disproportionately contributing to society and households with work that is largely invisible and often undervalued. Work of this nature, including for example caring for children and the elderly, as well as cleaning, cooking, fetching water and firewood is necessary for the household’s survival. While often invisible, this work is
also necessary for the multidimensional welfare of societies and advancing the cap-abilities of all human lives.
Consequently recognizing and giving value to invisible work is central to the future of societal welfare and human development and must play a critical and complemen-tary role in unlocking the potential and value of women’s work. The revised classi-fication of employment and work stemming from the 2013 International Conference of Labour Statisticians should go a long way in helping to better capture some of the many elements of invisible work.
Source: See, for instance, England and Folbre, 1999.
followed by the presence of abuse, harassment or discrimination. This is broadly consistent across regions, although there are some important regional variations. For instance, in Northern America, the most important challenge to accessing the labour market is equal pay, in Eastern Asia it is access to affordable childcare, while in parts of Europe and Central Asia the absence of well-paying jobs is an important consideration. These findings underline the importance of investigating the nature and scope of the drivers that cause gender gaps in labour force participation as many of these factors are interrelated. For example, the expectation that a woman is the principal caregiver may explain, in part, women’s perceptions regarding work–family balance.
As table 5 suggests, a woman’s decision whether to participate or not in the labour market involves a complex set of fundamental drivers in conjunction with life-cycle circumstances, which can be broadly classified as (i) personal preferences, (ii) socio-economic constraints, and (iii) gender role conformity (figure 5). These three fundamental drivers are determined by the prevailing social norms in the society that a woman inhabits.
• Personal preferences are an important driver of an individual’s labour market outcome, within the constraints set by prevailing social norms and socio-economic factors (in conjunction with life-cycle circumstances) (figure 5). Indeed, a woman’s preference for engaging in work is an expression of both what is perceived to be legitimate in her personal circumstances and her socialized identity (Sen, 1990). In fact, many women who prefer to work are able to choose to do so and, as a result, derive pleasure and economic and social well-being from decent work opportunities. On the other hand, some women may prefer to stay at home due to a lack of jobs that are “socially acceptable” for women, because childcare costs may exceed their potential incomes or because their role within the household may be perceived as more valuable (economically and socially).
• Socio-economic constraints represent the institutional, economic and physical constraints faced by both men and women. As discussed above, economic conditions can dictate the availability and quality of jobs, both within and across countries. For instance, a downturn in the business cycle can temporarily provoke economic necessity within a household, in which case women often move into paid employment, so that, in effect, their labour supply acts as an insurance mech-anism (Attanasio, Low and Sánchez-Marcos, 2005; Bhalotra and Umaña-Aponte, 2010). Among institutional constraints, the legal and policy framework of tax systems can often impose high mar-ginal tax rates on secondary earners with lower income, who are more likely to be women, hence disincentivizing their participation in the labour force (Stotsky, 1996; Jaumotte, 2003; EC, 2015). Alternatively, the lack of care facilities poses a problem for the entire household, but in reality its effect is disproportionally felt by women due to their assigned gender role as caregivers (Badgett and Folbre, 1999). In addition, discrimination directly creates gender gaps through the disadvantageous treatment of women in terms of payment, hiring or promotion. Finally, since policies are influenced by social norms, they can shape socio-economic constraints while simultaneously reinforcing pre-vailing norms (Sjöberg, 2004).

24 World Employment and Social Outlook – Trends for women 2017
Figure 5
Analytical framework of labour market outcomes
Educational and vocational
training
Labour market outcomes
Life-cycle circumstances Gender Family status Age Disability Ethnicity/Race Citizenship HIV status
Sexual orientation Gender identity
Social norms
Individual fundamental drivers
Socio-economic
constraints Legal and policy framework
Macroeconomic Care facilities Poverty
Transportation
Gender roles Family Society
Community Unequal care and household
responsibilities
Personal preferences
Self-identity Individuality Agency Choice
Freedom
Shape
Determine
Influence
Affect
Influence Affect
• Gender role conformity: Class, patriarchy and social hierarchy, often determined by caste, locality, ethnicity and religion, interact with one another to shape society’s norms around gender roles (Bardhan, 1984; Klasen and Pieters, 2012). As a result, women are often compelled to conform to the gender roles deemed to be acceptable by their family, community or society in order to avoid the consequences of social exclusion, insecurity or other conflicts. These attitudes towards gender roles construct a social hierarchy that not only defines women’s roles in the labour market, but also adds to the disproportionate burden of household responsibilities that they must bear (Badgett and Folbre, 1999).
2. Assessing the factors driving gender gaps in the labour market 25
Gender gaps in the labour market can reinforce one another and affect even the decision to participate
The three fundamental drivers as described above help determine the various labour market outcomes that were detailed in Chapter 1, notably (i) labour market participation, (ii) occupation or sector of employment, (iii) type of employment relationship, and (iv) income.
This relationship, however, is recursive. The labour market outcomes themselves can influence the decision to participate in the labour market in the first instance. Put simply, unequal labour market outcomes (e.g. if women are paid less or have limited occupational opportunities) can shape the de-cision to participate.
In addition, these labour market outcomes are interdependent. For example, if as a result of social norms women can only find employment in certain types of occupations that are characterized by part-time employment relationships, it may lead, in turn, to a wage penalty. In this context, occupation, employment type and income reinforce one another.
Education also plays an important role. Educational opportunities (including access and quality) are affected by social norms. Indeed, gender differences in most developed countries can manifest them-selves in the choice of study, and in developing and emerging countries in the level of education that is achievable (EC, 2009). In this respect, education, including vocational training, is a primary deter-minant of labour market outcomes. Moreover, educational attainment and the field of study determine not only labour market entry but also career trajectories (which then affect other aspects of the labour market such as occupational choice and income).
As evidenced by the discussion, there is considerable interconnectivity and interdependence among the drivers of labour market outcomes and the outcomes themselves. With this in mind, the next section identifies and isolates – to the extent possible – the impact of these individual drivers on female labour force participation rates. The approach therefore links to the “capabilities approach” discussed earlier (see section 1.6) by capturing the voices of women expressing the challenges they face within the labour market, their preferences in terms of work, their perception of their own futures and the normative con-straints on their ability to make decisions about work, both within the home and in the labour market.
2.2 P references, gender role conformity and socio-economic constraints: An empirical assessment
Using micro data from the Gallup World Poll, this section examines in more detail the relationships among the fundamental drivers of female labour force participation and attempts to quantify their impact, including assessing the role of education. The analysis is conducted separately according to the level of economic development, as this indicator captures potentially significant differences in how drivers interact and influence labour force participation rates. The region of the Arab States and Northern Africa (ASNA) is treated separately, given that – as highlighted in Chapter 1 – these two regions have the lowest levels of female participation rates.
Personal preferences
Estimates indicate that a woman’s preference to work, all other factors being equal, positively affects her probability of participating in the labour market. On average, the marginal effect of preferring to work on participation rates is relatively consistent across country-income groups (table 6), ranging from 12 percentage points in developing countries to 15 percentage points in emerging countries and to over 18 percentage points in developed countries. However, at just over 23 percentage points, the largest effect is found in the ASNA region. These findings provide strong evidence that a woman’s preference to work has a significant positive effect on participation. However, preferences are a function of a range of factors, as discussed above, including women’s life-cycle circumstances, their socio-economic con-ditions, their gender roles and the conditions of the local labour market.

26 World Employment and Social Outlook – Trends for women 2017
Table 6
Marginal impact of drivers on the probability to participate in the labour market
Developing Emerging Developed ASNA countries countries countries countries
Personal preference
Prefer paid work 12.0 14.4 18.4 23.7
Socio-economic constraints
Mild poverty 5.0 4.1 0.4 6.7
Severe poverty 7.8 6.4 1.3 12.9
Married/partner 3.1 –2.2 –3.6 –6.6
Children 0.7 –1.1 –0.9 –0.3
Challenge: Work and family balance –2.6 –3.8 –0.3 –2.8
Challenge: Lack of affordable childcare –4.8 –2.1 –4.0 –6.2
Challenge: Abuse, harassment or discrimination –4.2 –2.0 –1.9 –2.6
Challenge: Lack of transportation –16.5 –5.7 4.3 –1.5
Gender role conformity
Urban 0.1 –2.9 1.3 1.2
Acceptability 2.7 3.2 7.1 3.3
Challenge: Family non-approval –5.1 –7.3 –2.9 –1.2
Religion –10.9 –2.3 0.3 not available
Education
Secondary education –5.2 3.1 7.6 6.8
Tertiary education 10.5 15.3 15.1 27.8
Notes: The table shows the unconditional marginal impact of fundamental drivers on the probability of women to participate in the labour market. The unconditional marginal impact shows the impact of a marginal change of only the indicator, holding all other characteristics at their actual value. Estimates are based on a probability model of individual female labour force participation, see Appendix C for details. The “Challenge”-related indicators assess the marginal impact of that challenge mentioned as the main challenge as opposed to “lack of flexible hours” mentioned as the main challenge. Religion indicates the marginal impact of a religion with respect to non-re-ligion. The sample of non-religious women in the ASNA region is too small to allow an estimation of the impact of religion. “Children” presents the marginal effect of the first child. Green (red) indicates positive (negative) estimates. Bold indicates significance at the 10 per cent level.
Source: ILO estimates based on Gallup World Poll.
Socio-economic constraints
The labour supply status of a woman has inevitable economic consequences. Non-participation implies forgone earnings, while participation may incur costs in terms of forgone home production (including provision of care), transportation and other factors. In fact, severe poverty – i.e. a shortage of money for food and shelter – is a very strong driver of labour force participation, independent of preferences and gender roles. Table 6 indicates that among women suffering from severe poverty in developing and emerging countries, the probability to participate in the labour market increases by 7.8 and 6.4 per-centage points, respectively. For ASNA countries, the effect of severe poverty on the probability of labour force participation is nearly double in comparison, emphasizing the strength of economic ne-cessity as a driver of women’s labour market participation in this region, irrespective of social norms.14 Living in mild poverty yields similar results, albeit to lesser degrees.
Having a spouse or domestic partner reduces the probability of women participating in the labour market in emerging, developed and ASNA countries by between 2.6 and 6.5 percentage points (relative to single women). For developing countries, however, the effect is reversed, with partnerships having a positive effect on participation, by 3.3 percentage points.
14. This does not imply that women face fewer social norm constraints in developing countries, but that they are manifested in other dimensions of the labour market, such as employment quality, as outlined in Chapter 1.

2. Assessing the factors driving gender gaps in the labour market 27
In general, lower probabilities of participating among partnered women are likely due to two main reasons. The first is the economic stability that arises from a partner’s income, reinforced by the “male breadwinner” bias: the fact that the (male) “breadwinner” is providing the household income reduces the economic imperative for a woman’s labour market participation (in the case of developing countries, this effect is outweighed by economic necessity). The second and related reason is that economic stability enables social norms to confine women to more traditional roles within the house-hold, i.e. shouldering a disproportionate burden of household responsibilities, which limits their choice and availability for paid work.
The presence of children as a factor by itself does not make a significant difference to the probability of a woman’s labour market participation. The effect in developing countries is positive, albeit small (0.7 percentage points). In emerging and developed countries, in contrast, the presence of children marginally reduces participation probabilities. This suggests that other factors, such as socio-economic constraints related to childcare, rather than the presence of children per se, are weighing down women’s participation rates. Indeed, table 6 shows that women facing the challenge of “lack of affordable care for children or family members” have a lower probability to participate in the labour market, with a slightly larger effect observable in developing countries. Even in developed countries, this challenge is an important constraint (a 4 percentage point lower probability to participate). More generally, the relatively small impact of children on female participation rates suggests a significant double burden of both paid and unpaid work that many women are conditioned to bear. In fact, in emerging countries, the challenge of achieving “balance between work and family or home/no time to spend with family” negatively affects participation probability by 3.8 percentage points.
Limited access to and safety of transportation is estimated to be the greatest obstacle to women’s participation in the labour market in developing countries, reducing their participation probability by 16.5 percentage points. This challenge also has a noticeable negative effect in emerging countries. Unfair treatment at work due to “Abuse, harassment or discrimination” discourages participation by 4.2 percentage points in developing countries, indicating the inequitable weight of social norms which prevail in these countries despite the comparably high levels of labour market participation of women.
Gender role conformity
The previous section showed that a woman’s participation is, among other things, very much a function of her ability to balance her role as a caregiver in the household with the demands of the workplace. A woman’s role in the household and thus her preference and decision (even the freedom to choose) to participate in the labour market, are determined by social norms. The gender roles that arise from social norms vary across regions, but also vary according to the different traditional values held within different localities (urban vs rural), religions and even individual households.
Table 6 shows that living in an urban environment has only a limited impact in most instances on the probability of women participating in the labour market. It does, however, lower the probability for women in emerging countries to participate by 2.9 percentage points. Women living in households whose members accept female engagement in paid work are more likely to participate in the labour market (the effect is positive regardless of country grouping), and for developed countries it increases the probability to participate by as much as 7.1 percentage points).
Religions embody a complex system of values that extends to gender roles. Consequently, table 6 shows the average results of religion across groups. For example, in developing countries, the prob-ability to participate is substantially reduced due to religion (although not always significant). In de-veloped and emerging countries, the results are mixed: in some cases the effect is positive, in others negative (Pastore and Tenaglia, 2013).
Education
The effect of education on the probability to participate in the labour market is a function of the dif-ferent weights given to the income and substitution effects. The substitution effect reflects the larger opportunity cost of staying at home as potential labour income rises with higher education, thereby encouraging participation. The income effect, in contrast, occurs when the economic needs of the family can be met with a lower rate of participation, so that more of a woman’s time can be devoted to fulfilling traditional gender roles.

28 World Employment and Social Outlook – Trends for women 2017
Figure 6
Estimating cumulative effects of fundamental drivers
60
20
40
Mar
gina
l im
pact
on
prob
abili
ty t
o pa
rtic
ipat
e
80
0Developing countries Emerging countries Developed countries ASNA countries
Preferring to work
Less restrictivesocio-economicconstraints
Less restrictivegender roles
Tertiary education
Notes: The figure shows the cumulative marginal change in a hypothetical woman’s probability to participate in the labour market from changing identified fundamental drivers from most constraining to least constraining. First, the marginal impact of a non-poor woman preferring to work as opposed to staying at home is shown, keeping all other drivers constrained. Next, socio-economic constraints are relaxed. Third, gender role constraints are relaxed. Finally, the woman’s education level is as-sumed to be tertiary instead of primary.
Source: ILO calculations based on Gallup World Poll.
In general, higher levels of education, specifically tertiary education, increase the probability of labour market participation (substitution effect dominates). Secondary education has a similar but smaller effect across the regions, with the exception of developing countries, where secondary education de-creases participation by 5.2 percentage points (only in this exception does the income effect dominate).
In addition, the impact of education on participation might capture more than just the balance between the income and substitution effects. Indeed, the level of education a woman can attain is, to a certain degree, influenced by other factors. A higher level of education could actually be an indicator that a woman’s gender role and socio-economic conditions are generally more conducive to participation. In that case, the direct impact of higher education is likely to be overestimated. This indicates that policies aimed at raising female education levels also need to address gender role and socio-economic constraints.
Taking into consideration the interaction of drivers, the desire to participate is outweighed by socio-economic and gender role factors
The analysis of unconditional marginal effects of fundamental drivers revealed – to varying degrees and depending on the level of economic development – how each one affects the probability of women participating in the labour market. However, the framework introduced above (figure 5) shows that drivers are inter-related and interdependent. With that in mind, this subsection analyses the marginal change of a woman’s15 probability of participating in the labour market, with the constraints of each of the fundamental drivers relaxed one at a time (figure 6).
The main result is that a change in a woman’s preference has a comparably lower effect – ranging from approximately 3 to 10 percentage points – on her probability to participate when socio-economic factors and gender role conformity are taken into consideration. This demonstrates that personal preferences are a necessary, but not sufficient condition to raising female labour force participation. In fact, the con-secutive loosening of some socio-economic constraints16 has a more sizeable impact on women’s prob-ability of labour force participation in developed, emerging and developing countries (up to 30 percentage points). However, in ASNA countries the impact is considerably smaller (at 13.1 percentage points).
15. Each driver (with the exception of age, poverty, number of household members and marital status) are changed to their opposite (e.g. from not preferring to work to preferring to work) in order to obtain the difference in the predicted probability to participate.
16. This includes women having access to phone and internet, an optimistic rather than pessimistic attitude about their general future, believing that they have a good chance compared to men in the labour market, believing that they would not be constrained by children, and assuming that they only face the least constraining challenge instead of the most constraining one.

2. Assessing the factors driving gender gaps in the labour market 29
Addressing gender role conformity also has an important effect across all regions, albeit less so in emerging countries. More conducive gender roles17 would, in fact, make the largest contribution to raising a woman’s probability of participating in ASNA countries, with 28.0 percentage points, but would also make a sizeable contribution in developing and developed countries (at around 20 per-centage points (figure 6). Finally, the impact of tertiary education in each region, unconstrained by socio- economic conditions and gender roles, is fairly similar to the unconditional marginal effect of education presented in table 6. In sum, the personal preference to pursue paid work is a very im-portant driver of female labour force participation. However, unless accompanied by improvements to socio-economic conditions and less gender role conformity, the impact will be limited.
2.3 Decomposing gender gaps in the workplace
The analysis so far in this chapter has focused on the factors underlying participation in the labour market. However, Chapter 1 also identified existing gender gaps in the type of employment rela-tionship, showing for instance that a larger share of women than men are employed as contributing family workers.
A report by the European Commission’s expert group on gender and employment (EC, 2009) lists a number of key factors identified by the literature as causing gender segregation in the workplace. These include comparative biological advantages, differences in human capital investment, differential roles within the household, preferences and prejudices, socialization and stereotypes, entry barriers and organizational practices. ILO (2016a) emphasizes the fact that these factors are self-reinforcing. Women and men are, respectively, more likely to pursue careers in sectors and occupations identified as “feminine” or “masculine” and are discouraged to do otherwise.
Knowledge of the underlying reason for gender gaps within the workplace is relevant for policy-making. For instance, knowing that women are more affected by a particular type of employment relationship (e.g. part-time) because they are more likely to have a certain occupation (e.g. health care) could focus policy-makers’ investigations on why women are found in that occupation, and why that type of employment relationship is so prevalent within that occupation. Similarly, as section 1.6 revealed, closing gender gaps in the workplace could yield substantial economic benefits. Consequently, this section decomposes gender gaps in the workplace into three specific components: sectoral segrega-tion, occupational segregation and residual factors. The latter category contains all remaining factors, such as education, experience and discrimination.
Segregation only partially explains gender gaps
Figure 7 presents the decomposition of selected gender gaps into these three components. Each component contributes, positively or negatively, to the over-representation of men or women by type of employment relationship (e.g. contributing family worker, informal employment, in household employment). The sum of the three components determines the overall gender gap in employment shares by type of employment (see Appendix D for details of the methodology used for the decomposition). The results vary considerably by group of countries.
In emerging and developing countries, residual factors play a significant role in all types of employment where women are over-represented (i.e. as in contributing family workers, in house-hold employment, part-time employment and time-related underemployment), with the exception of household employment, where sectoral segregation is driving female over-representation (although the residual component is still reinforcing the over-representation of women).
17. This assumes that a woman is living in an urban instead of rural location, that her family accepts that a woman should have the ability to pursue paid work, that the woman holds the belief that society respects women, and that the woman is non-religious.

30 World Employment and Social Outlook – Trends for women 2017
Figure 7
Decomposition of gender gaps in type of employment relationshipO
ver-
repr
esen
tati
on o
f
men
wom
enO
ver-
repr
esen
tati
on o
f
men
wom
en
Contributingfamily worker
Informalemployment
Householdemployment
Part-timeemployment
Time-relatedunderemployment
Multiple jobholder
Panel A. Emerging and developing countries
Wage and salariedemployment
Part-timeemployment
Temporarycontract
Time-relatedunderemployment
Multiple jobholder
Panel B. European countries
Residual component Sectoral segregation Occupational segregation Total
Notes: The figure decomposes the gender gap in types of employment relationship into three components. Based on labour force surveys for 29 emerging and developing countries: Argentina, Armenia, Bangladesh, Plurinational State of Bolivia, Brazil, Brunei Darussalam, Cambodia, Chile, Dominican Republic, Ecuador, The Gambia, Guatemala, India, Indonesia, Lao People’s Democratic Republic, Liberia, Madagascar, Malawi, Mexico, Myanmar, Namibia, Nepal, Peru, Samoa, South Africa, United Republic of Tanzania, Thailand, Uganda, Viet Nam, where available years differ by country, with earliest available 2002 and latest 2015. Eurostat labour force surveys for EU-28 countries, except Bulgaria and Germany, but including Iceland, Norway and Switzerland, for the years 2009–2013. Appendix B details the methodology.
Source: ILO calculations based on ILOSTAT and EUROSTAT.
For a selection of European countries with available data, where women are over-represented (all cases with the exception of multiple job holders), the residual factor is once again an important determinant in the case of wage and salaried employment and part-time employment. However, in the case of temporary employment and time-related underemployment, occupation segregation is driving the gap between men and women.
The analysis highlights the fact that the residual component is the largest driver of the majority of the workplace gender gaps assessed. This indicates that social norms – a key component of the residual factors – can have a large direct impact on gender differences in types of employment relationships. In addition, occupational segregation is a strong explanatory factor for gender gaps in European countries.18 Moreover, the indirect influence of segregation is significant, and potentially underestimated due to the partial lack of sufficiently detailed information; it therefore merits further investigation.
18. The available European labour force surveys contain sectoral information at the one-digit level, but occupational information at the two-digit level, which a priori allows occupational segregation to explain more of the gender gap than sectoral segregation.

2. Assessing the factors driving gender gaps in the labour market 31
2.4 Concluding remarks
The findings of this chapter highlight the driving forces of women’s labour market participation and, hence, the most significant barriers that women face in the labour market today. Most notable is that the preference to participate is necessary but insufficient, and encouraging female labour market en-gagement will need to be accompanied by measures and efforts to alleviate the socio-economic and gender role constraints so as to enable their agency to freely participate and overcome gender gaps in their employment endeavours.
Moving forward, policy-making should be centred on expanding legitimate opportunities for women in the labour market, both in terms of quantity and in terms of quality, allowing them broad access to the occupation and employment type they want, unconstrained by gender stereotypes. The next chapter details how these measures can be specifically targeted and achieved through recommendations for policy initiatives.

WESO_Women_2017_int.indd 32WESO_Women_2017_int.indd 32 23.06.17 10:1823.06.17 10:18

3. Policy considerations 33
3 Policy considerations
Chapter 1 of this report looked at trends with respect to women’s engagement with the world of work. These can be categorized into broad gender gaps, namely those in: (i) labour force participation, (ii) unemployment, (iii) sectoral and occupational opportunities, (iv) status in employment and (v) income. Addressing these gaps will be vital to improving women’s access to the labour market, promoting female economic empowerment and ensuring improved conditions at work for both men and women. Narrowing the various gender gaps will also bring about improvements in individual welfare and economic growth. Yet, as set out in Chapter 2, a number of overlapping and inter-connected drivers exist that are shaping these gender gaps.
Accordingly, a multifaceted and comprehensive framework is required to address the root causes of gender gaps that are in line with international labour standards (ILO, 2016a). With this in mind, this chapter outlines a series of policy recommendations in an effort to improve labour market outcomes among women (figure 8).
3.1 R eshaping gender role conformity and personal preferences
As discussed in Chapters 1 and 2, while more women are in work than ever before, their labour market participation is consistently lower than that of men and they are often segregated in sectors and occupa-tions which reflect gender stereotypes at work. And while gender issues should be mainstreamed in the overall policy framework of a given country, a range of appropriate policy actions can nevertheless break down the constraints of gender role conformity and the personal preferences that are often shaped by it.
Increasing labour force participation rates
Advancing flexible working arrangements and reintegration measures: Such initiatives are important and effective means of raising women’s participation in the labour market. Flexible working arrange-ments can help to prevent women from leaving the labour market, either permanently or temporarily, due to leave and childcare restrictions. Such policies also need to address social norms and attitudes to encourage greater male uptake of flexible working arrangements. Equally, reintegration measures can help to overcome the difficulties associated with returning to the labour market and should include vocational training, retraining and skills upgrading for those who have taken a period of leave to, among other things, provide care for relatives or children.
Promoting women’s entrepreneurship: New start-up rates are lower among female entrepreneurs in comparison to their male counterparts and tend to be concentrated in firms with lower productivity and profitability. Accordingly, policies should be put in place to reduce any barriers that prevent more women from starting and developing businesses; these policies include legal frameworks for female business development, entrepreneurship training and skills development, as well as improved access to finance and ownership of capital (see box 7 on ILO’s Women’s Entrepreneurship Development Programme).

34 World Employment and Social Outlook – Trends for women 2017
Figure 8
Visual framework of policy responses to gender gaps in the labour market
Reshaping Increasing labour force Promoting women’s entrepreneurshipgender role conformity
participation ratesAdvancing flexible work arrangements
and personal and reintegration measurespreferences
Tackling root causes of Challenging gender stereotypes through education occupational and sectoral and valuing care-related skillssegregation
Supporting women’s representation, participation and leadership in decision-making
Addressing Introducing improved policies Ensuring sufficient parental protection extended socio-economic for work–family balance to all men and womenconstraints
Guaranteeing adequate social protection
Improving approaches to atypical working hours and part-time work
Creating and protecting Promoting decent work for care professionals, quality jobs in the care including domestic and migrant workerseconomy
Recognizing, reducing and redistributing unpaid care work through public care services and social infrastructure
Targeting the macroeconomic Adopting gender-responsive macroeconomic policies environment and informal economy Supporting the formalization of jobs in the informal
economy
Raising equality Promoting equal conditions Establishing a system of wage transparency in labour market for work of equal value and gender-neutral job evaluationconditions
Supporting adequate and inclusive minimum wages and strengthening collective bargaining
Tackling discrimination, Eliminating unequal treatment of women and men violence and harassment in the labour market and ending violence and harassment against women and men in the world of work
Transforming institutions to prevent and eliminate discrimination, violence and harassment
Source: Based on ILO, 2016a.
Tackling the root causes of occupational and sectoral segregation
Challenging gender stereotypes through education and placing higher value on care-related skills: Breaking gender stereotypes begins in childhood through education (both formal and informal forms) and outreach. Addressing gender differences in the field of study selected by individuals, for instance by shifting the focus to subject-specific participation, is one potential avenue. As demonstrated in the previous chapters, the field of study and, subsequently, choice of occupation are often determined by considerations such as care responsibilities and the anticipated flexibility and family-friendly nature of certain occupations, thus perpetuating occupational segregation. Accordingly, initiatives need to address both issues of study and employment in non-stereotypical fields, through recruitment, training and funding, among other measures, to help young men and women make choices that challenge social norms within education, vocational training and occupational sectors (box 7).

3. Policy considerations 35
Box 7
Transforming social norms and personal preferences
ILO Women’s Entrepreneurship Development Programme: While globally women entrepreneurs lead only a third of all businesses in the formal economy today, a large majority of them in developing and emerging countries run micro- and small enterprises in the informal economy. This reflects the systemic barriers that women face in starting, developing and growing businesses successfully. This includes limited access to networks, difficulties in accessing property/land (due to a lack of property and inheritance rights), lack of access to titled assets which restricts their loan acquisition capacity, lack of access to formal finance, sectoral segregation of entrepreneurial opportunities, limited access to business development services and harassment in the process of registering and operating their enterprises. The ILO’s Women’s Entrepreneurship Development Programme aims to create an enabling environment through an integrated framework for growing women’s enterprises by removing barriers to business start-up and growth, improving access to markets, facilitating access to and
control over resources, enhancing social inclusion and protection and fostering a supportive culture and context.
T ransforming social norms through policy: Policy design and implementation can either shape existing norms or promote new ones, directly or indirectly. However, reshaping social norms requires not only equality and family policies but also policies that dir-ectly address such issues through public awareness initiatives. For instance, public awareness campaigns, such as HeforShe, Programme H, or MenCare, have made significant advances in changing norms regarding masculinity by engaging men in gender equality initiatives. These initiatives range from promoting equal sharing of household tasks and caregiving among men (MenCare) to creating a communal educa-tional space for critical reflection on gender stereotypes among men (Programme H) to engaging male business and political leaders as agents of change to challenge perceptions of social norms in their coun-tries and organizations (HeforShe).
Source: ILO, 2016c; ILO, 2008; UNHLP, 2016.
Supporting women’s representation, participation and leadership in decision-making: In order to chal-lenge occupational and sectoral segregation, women must be in a position to influence and shape workplaces, not least with respect to issues that disproportionately impact women. Means of improving women’s participation and leadership include quotas, targets and goals for participation at different levels, across all areas of government and within employers’ and workers’ groups, as well as in firms. Additional measures may include leadership training and mentorship, as well as financial incentives and fast-tracked career measures. Governments need to play a leading role in implementing such measures in the public sector.

36 World Employment and Social Outlook – Trends for women 2017
3.2 Addressing socio-economic constraints
Introducing improved policies for work–family balance
Millions of women and men worldwide are without the fundamental right to adequate parental protection and other basic social protection measures. In line with the ILO Workers with Family Responsibilities Convention, 1981 (No. 156), improved efforts need to be made to lay the groundwork for achieving harmonized work–family balances, and thus promoting quality and family-friendly working conditions for women and men. At the same time, atypical hours and low-quality part-time work disproportionately penalize women in the labour force.
Ensuring sufficient parental protection extended to all women and men: Maternity protection, pater-nity leave and other protection measures help to encourage women to return to work and facilitate reduced career breaks as well as allowing for a more harmonized work–family balance. The Maternity Protection Convention, 2000 (No. 183), sets out the minimum requirements for maternity leave and other related entitlements. National laws and policies need to be designed to minimize the financial cost to employers, particularly small and medium-sized enterprises, as well as expanding coverage to those categories of workers who are frequently excluded, such as non-standard workers, domestic workers and homeworkers. At the same time, there is a need for more statutory provision of leave entitlement for fathers and measures to encourage uptake of leave (box 8).
Guaranteeing adequate social protection: Gender gaps in the workplace, as well as the greater propensity for employment in areas such as unpaid care work, go hand in hand with inequalities in social protection systems. This includes access, coverage and provision of social security for women. As emphasized in the ILO Social Protection Floors Recommendation, 2012 (No. 202), social security is an important tool for promoting equal opportunities and gender equality. A gender dimension must therefore be incorporated into the design, implementation and evaluation of social protection systems in a way that is sensitive to the characteristics of the female labour market, such as unpaid family and domestic work, while simultaneously including gender-neutral provisions to avoid perpetuating segregation.
Improving approaches to atypical working hours and part-time work: The ILO Workers with Family Responsibilities Recommendation, 1981 (No. 165), encourages the adoption of measures designed to improve both working conditions and the quality of working life, including those which target “the progressive reduction of daily hours of work and the reduction of overtime, and more flexible arrange-ments as regards working schedules, rest periods and holidays”. Such measures should include the strengthening of workers’ rights to request changes to working hours, as well as reducing the wage penalty on part-time workers compared to their full-time counterparts, as detailed in the ILO Part-Time Work Convention, 1994 (No. 175).
Creating and protecting quality jobs in the care economy
Women are over-represented in certain occupations, including the care professions, which often have a history of insufficient regulation and protection.
Promoting decent work for care professionals, including domestic and migrant workers: To address decent work deficits in the care professions, there is a need to adjust policies with regard to labour market opportunities and social protection. This includes promoting male participation in these occupations. Any measures need to be in line with the ILO Workers with Family Responsibilities Convention, 1981 (No. 156), and in the case of domestic care workers also with the ILO Domestic Workers Convention, 2011 (No. 189). For migrants, the Migrant Workers (Supplementary Provisions) Convention, 1975 (No. 143), must be applied, to ensure that policies and practices are non-discriminatory in their efforts to promote decent work.
Recognizing, reducing and redistributing unpaid care work through public care services and social infrastructure: Care is a universal right and an important component of gender equality, yet too often care workers are placed at a disadvantage in their caregiving roles and as informal workers. Consequently, recognizing and attaching appropriate value to unpaid care and domestic work is

3. Policy considerations 37
Box 8
Relieving socio-economic constraints on women
Universal access to quality childcare: Access to quality childcare is essential for enabling women’s labour force participation while advancing the positive development of children. However, such access to quality care needs to be available to all workers regardless of their employment and income status. In India, the Self Employed Women’s Association (SEWA) provides childcare services through a cooperative that accommodates the working hours of parents while taking children of a very young age and ensuring the provision of health services (including nutrition). Such services, also found in Chile (Peñalolen childcare) and Kenya (SOCFINAF’s childcare), not only enable women to work more but also contribute to alleviating food and healthcare costs at home, which is a particularly acute challenge in low-income families. As a result, universal quality childcare not only contributes to achieving gender equality but also promotes greater social equality by contributing to the reversal of intergenerational poverty.
Shaping parental leave policies for women and men: From a gender-equality perspec-tive, encouraging the uptake of well-paid leave by both mothers and fathers is es-sential. For mothers it is a way to secure employment, health and economic security, and for fathers it allows for a more gen-der-equal division of work and helps to shift some of the responsibility for unpaid work from mothers to fathers. However, leave should not be considered in isolation, but in combination with the other existing family and employment policies in the country so as to mitigate any negative effects on par-ticipation (Hook, 2010; Gangl and Ziefle, 2015). The ILO standard on paid maternity leave duration mandates a minimum leave period of 14 weeks, set by Convention
No. 183. At the same time, a number of factors influence men’s leave uptake; for instance, the policy design, in which leave should be an individual entitlement, non-transferable, well-paid and universal (Haas and Rostgaard, 2011), while norms concerning leave uptake, family and indi-vidual cases and circumstances should be taken into account. In addition to leave for parents, paid leave and supportive policies and services for workers who care for sick, disabled and elderly family members should also be promoted.
Achieving substantive equality through gender budgeting: Sound fiscal policies play an important role in influencing the sustainability of growth through their effect on labour supply, human capital growth, in-vestments and inequality. For these reasons, gender-responsive budgeting is a key mech-anism in contributing to closing gender gaps and promoting women’s empowerment and development. It considers and monitors the differential impacts of changes in fiscal pol-icies and budgetary allocations on different groups of the population – especially those that affect women and girls disproportion-ately – and makes a fiscal commitment to address the different needs and circum-stances of women through both public ex-penditure and taxes. For instance, gender budgeting acknowledges the dispropor-tionate contribution that women make in the care economy and integrates this knowledge when assessing the benefits and costs of government programmes. Already, in many countries, gender budgeting has influenced policy changes in education, health and in-frastructure with the consideration of gen-der-oriented goals (e.g. India and Mexico) and has led to greater accountability for more equitable public spending (e.g. Austria and Ecuador).
Source: Cassirer and Addati, 2007; ILO, 2013; UNHLP, 2017; Moussié, 2017; Hook, 2010; Gangl and Ziefle, 2015; Haas and Rostgaard, 2011; ILO, 2014; Stotsky, 2016.
important to remove biases in national income accounting that otherwise fails to include these workers. Further, efforts are required to challenge norms around caregiving, particularly with regard to ensuring that care is an equal right and responsibility of both women and men, and thus redistribu-tion and rebalancing of care responsibilities between women and men is required. In addition, there is a need for enhanced public provision of basic infrastructure and services to alleviate the burden of care work (box 8).

38 World Employment and Social Outlook – Trends for women 2017
Targeting the macroeconomic environment and informal economy
Macroeconomic policies are important enablers of gender equality and should be complemented by the provision of support for factors such as formalization of jobs in the informal economy.
Adopting gender-responsive macroeconomic policies: Economic growth alone is insufficient to facilitate gender equality; instead, a focus on inclusive growth, particularly employment creation and enhancement of livelihoods, is necessary (e.g. by gender budgeting (box 8)). This requires a balanced framework of legislation, regulation and policies. Adequate and appropriate resources need to be safeguarded to make sure these priorities do not give way to others, particularly in times of economic downturn. In low-income and developing countries governments’ priorities may be more concentrated on investment in time-saving infrastructures, such as water, electricity and energy, while in developed countries the focus may be more on improving the status of low-income families through measures such as tax credits and transfers.
Supporting the formalization of jobs in the informal economy: Formalization of jobs in the informal economy entails a range of both top-down and bottom-up approaches. For instance, a policy mix that mainstreams employment promotion can help to generate better quality and more formal job opportunities, while the regulatory environment can be shaped around the process of formalization through legislation, taxation, rights and other means. Meanwhile, bottom-up approaches can include initiatives and measures aimed at increasing access to finance or promoting entrepreneurship, as well as providing incentives to businesses for formalizing employees. At the same time, further efforts to recognize informal worker organizations, such as Self Employed Women’s Association (SEWA) in India, can help collectivize informal workers.
3.3 Raising equality in labour market conditions
Promoting equal conditions for work of equal value
The principle of equal remuneration for work of equal value needs to be integrated into law and included in collective bargaining processes. This requirement comes with prerequisites, such as improved wage transparency, and should also leverage existing tools, such as minimum wage setting systems. It also entails equal treatment of different types of workers, including informal workers.
Establishing a system of wage transparency and gender-neutral job evaluation: According to the Equal Remuneration Convention, 1951 (No. 100), equal pay for work of equal value should be ensured through the application of national laws and regulations. However, with the relative absence of reliable and open data on wages, improved access must be complemented by information on pay and bonuses and promotion structures for governments, employers’ and workers’ organizations (box 9). In addition, gender-neutral job evaluation methods are required to determine the value of work in an objective manner, through neutral assessments of skills, working conditions, responsibilities and effort.
Supporting adequate and inclusive minimum wages and strengthening collective bargaining: Ensuring equal pay for work of equal value must be an objective and feature of minimum wage policies in ac-cordance with ILO Convention No. 100, the Minimum Wage Fixing Convention, 1970 (No. 131), and the Wage Fixing Recommendation, 1970 (No. 135). To this end, minimum wage policies can be used to combat gender-based pay discrimination, particularly given the higher propensity for women to be in lower-paid jobs than men (box 9). Moreover, while minimum wages should be free from gender bias, they can be an effective tool for targeting specific groups of workers, such as domestic workers and those in the care professions, thus indirectly benefiting the more vulnerable groups of women workers. Strengthened collective bargaining for effective social dialogue is imperative in this regard.
Tackling discrimination, violence and harassment against women and men
Direct and indirect gender-based discriminatory practices are evident throughout the world of work and exacerbate the wage gap, reduce female labour force participation and generally place women at a disadvantage in the labour market. Accordingly, measures need to be implemented in line with the ILO fundamental Convention on Discrimination (Employment and Occupation), 1958 (No. 111), as well as the UN Convention on the Elimination of all Forms of Discrimination against Women (CEDAW).

3. Policy considerations 39
Box 9
Empowering women to secure improved labour market conditions
Legal enforcement of equal pay through pay transpar-ency: Despite equal pay policies existing in a number of countries worldwide, there can be structural chal-lenges that result in limited or ineffective enforcement procedures. These stem in part from the financial and other barriers of addressing wage inequality by taking legal action. The extensive time requirements of litiga-tion, arduous processes and insufficient understanding of individual rights or company disclosure obligations also contribute to the difficulties of achieving redress. Legislation can counter these obstacles, particularly if it results in the establishment of specialized bodies to provide technical support for both remedy and en-forcement. To such ends, enforcement would require the publishing of quality data on pay gaps and the drivers of these gaps, thus increasing transparency to facilitate bargaining processes. Iceland and the United Kingdom provide useful examples in this respect, as the first countries in the world to mandate equal pay for women and men through the enforcement of pay trans-parency. Once implemented, the law will be mandatory for both public and private firms (above a certain size), requiring them to be audited and receive certification of their equal pay practices, or face fines.
Engaging women in collective bargaining for decent work: Gender concerns are frequently excluded in collective bargaining, often as a result of the lack of female participation and representation at the deci-sion-making levels in trade unions. However, trade unions can play a significant role in addressing gen-der-related concerns, namely concerns regarding the gender wage gap, flexibility in working time, parental leave, childcare services, gender-based violence in the workplace, freedom of association and the in-clusion of vulnerable categories of workers (informal, domestic, migrant, pregnant and family workers). In order to better integrate women in trade unions, the International Trade Union Confederation (ITUC) has produced specific guidelines for making trade unions gender inclusive and instigated the Labour Rights for Women Campaign to mobilize and engage women workers of all types to participate in trade unions. Including more women in trade unions allows col-lective agreements on gender equality to be achieved more rapidly since the concerns of women are actively recognized, represented and legitimized through the process of social dialogue.
Source: ILO, 2016d; Ministry of Welfare, Iceland (https://www.velferdarraduneyti.is/jafnlaunastadall/), Government of Equalities Office, United Kingdom (https://www.gov.uk/government/news/gender-pay-gap-reporting-goes-live); ITUC, 2007; ITUC, 2016; ILO, 2016e.
Eliminating unequal treatment of women and men in the labour market and ending violence and har-assment in the world of work: The responsibility for eliminating unequal treatment and ending violence and harassment falls on all areas of society. Governments and workers’ and employers’ groups need to establish and strive to implement legislative frameworks that ensure equal access and eligibility for women and men to labour regulation, employment legislation and social protection, without discrimin-ation or harassment. Meanwhile, violence and harassment are an occupational safety and health issue and legislation under this body can be effective at combating the issue; however, it must be sufficiently broad to include all forms of violence and harassment. Moreover, there is an ongoing obligation to imple-ment and monitor laws that prevent and prohibit discrimination, violence and harassment (ILO, 2017b).
Transforming institutions to prevent and eliminate discrimination, violence and harassment: Laws alone are insufficient to prevent and eliminate discrimination, violence and harassment associated with work, and supplementary equal treatment mechanisms still need to be underpinned by effective remedies, dissuasive sanctions as well as effective enforcement through labour inspection, specialized equality bodies and access to courts. Ultimately, attitudes and social norms need to change, including through the agency of public awareness campaigns (see also box 7).
3.4 Moving forward
The world of work is characterized by persistent and widespread gender gaps, driven by a range of fac-tors. Closing these gaps would yield significant economic benefits and improve individual welfare. With that in mind, this chapter has outlined a number of policy recommendations, though in no way mutually exclusive, that can help to narrow the gender gaps in labour market outcomes and guide changes in the attitudes and norms that surround the role of women at work. Importantly, a rights-based approach can serve to underscore, and complement, gender dimensions in policy-making. Indeed, moving forward, success will require efforts across a range of policy dimensions.

WESO_Women_2017_int.indd 40WESO_Women_2017_int.indd 40 23.06.17 10:1823.06.17 10:18
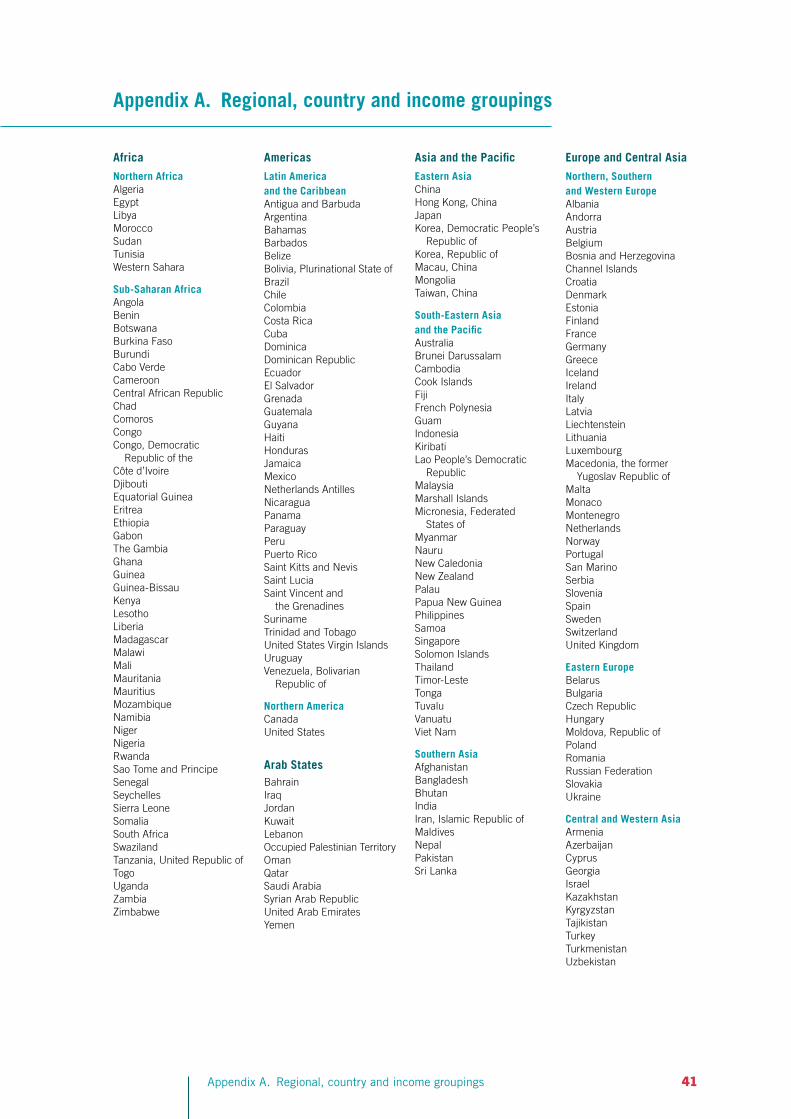
Appendix A. Regional, country and income groupings 41
Africa Americas Asia and the Pacific Europe and Central Asia
Northern Africa Latin America Eastern Asia Northern, Southern AlgeriaEgyptLibyaMorocco
and the CaribbeanAntigua and BarbudaArgentinaBahamas
ChinaHong Kong, ChinaJapanKorea, Democratic People’s
and Western EuropeAlbaniaAndorraAustria
SudanTunisiaWestern Sahara
BarbadosBelizeBolivia, Plurinational State of
Republic ofKorea, Republic ofMacau, China
BelgiumBosnia and HerzegovinaChannel Islands
Sub-Saharan AfricaAngolaBeninBotswanaBurkina FasoBurundiCabo VerdeCameroonCentral African RepublicChadComorosCongoCongo, Democratic
Republic of theCôte d’IvoireDjiboutiEquatorial GuineaEritreaEthiopiaGabonThe GambiaGhanaGuineaGuinea-BissauKenyaLesothoLiberiaMadagascarMalawiMaliMauritaniaMauritiusMozambiqueNamibiaNigerNigeriaRwandaSao Tome and PrincipeSenegalSeychellesSierra Leone
BrazilChileColombiaCosta RicaCubaDominicaDominican RepublicEcuadorEl SalvadorGrenadaGuatemalaGuyanaHaitiHondurasJamaicaMexicoNetherlands AntillesNicaraguaPanamaParaguayPeruPuerto RicoSaint Kitts and NevisSaint LuciaSaint Vincent and
the GrenadinesSurinameTrinidad and TobagoUnited States Virgin IslandsUruguayVenezuela, Bolivarian
Republic of
Northern AmericaCanadaUnited States
Arab StatesBahrainIraqJordan
MongoliaTaiwan, China
South-Eastern Asia and the PacificAustraliaBrunei DarussalamCambodiaCook IslandsFijiFrench PolynesiaGuamIndonesiaKiribatiLao People’s Democratic
RepublicMalaysiaMarshall IslandsMicronesia, Federated
States ofMyanmarNauruNew CaledoniaNew ZealandPalauPapua New GuineaPhilippinesSamoaSingaporeSolomon IslandsThailandTimor-LesteTongaTuvaluVanuatuViet Nam
Southern AsiaAfghanistanBangladeshBhutanIndia
CroatiaDenmarkEstoniaFinlandFranceGermanyGreeceIcelandIrelandItalyLatviaLiechtensteinLithuaniaLuxembourgMacedonia, the former
Yugoslav Republic ofMaltaMonacoMontenegroNetherlandsNorwayPortugalSan MarinoSerbiaSloveniaSpainSwedenSwitzerlandUnited Kingdom
Eastern EuropeBelarusBulgariaCzech RepublicHungaryMoldova, Republic ofPolandRomaniaRussian FederationSlovakiaUkraine
Somalia Kuwait Iran, Islamic Republic of Central and Western AsiaSouth Africa Lebanon Maldives ArmeniaSwazilandTanzania, United Republic ofTogoUgandaZambiaZimbabwe
Occupied Palestinian TerritoryOmanQatarSaudi ArabiaSyrian Arab RepublicUnited Arab Emirates
NepalPakistanSri Lanka
AzerbaijanCyprusGeorgiaIsraelKazakhstanKyrgyzstan
Yemen TajikistanTurkeyTurkmenistanUzbekistan
Appendix A. Regional, country and income groupings

42 World Employment and Social Outlook – Trends for women 2017
Developed countries Taiwan, China Lebanon Developing countries (high income)AndorraAntigua and BarbudaArgentinaAustraliaAustriaBahamasBahrainBarbadosBelgiumBrunei DarussalamCanadaChannel IslandsChileCroatiaCyprusCzech RepublicDenmarkEstoniaFinlandFranceFrench PolynesiaGermanyGreeceGuamHong Kong, ChinaHungaryIceland
Trinidad and TobagoUnited Arab EmiratesUnited KingdomUnited StatesUnited States Virgin IslandsUruguay
Emerging countries (middle income)AlbaniaAlgeriaAngolaArmeniaAzerbaijanBangladeshBelarusBelizeBhutanBolivia, Plurinational State ofBosnia and HerzegovinaBotswanaBrazilBulgariaCabo VerdeCambodiaCameroonChina
LesothoLibyaMacedonia, the former
Yugoslav Republic ofMalaysiaMaldivesMarshall IslandsMauritaniaMauritiusMexicoMicronesia, Federated
States ofMoldova, Republic ofMongoliaMontenegroMoroccoMyanmarNamibiaNauruNicaraguaNigeriaOccupied Palestinian TerritoryPakistanPalauPanamaPapua New GuineaParaguayPeru
(low income)AfghanistanBeninBurkina FasoBurundiCentral African RepublicChadComorosCongo, Democratic
Republic of theEritreaEthiopiaThe GambiaGuineaGuinea-BissauHaitiKorea, Democratic People’s
Republic ofLiberiaMadagascarMalawiMaliMozambiqueNepalNigerRwandaSenegalSierra Leone
Ireland Colombia Philippines SomaliaIsraelItalyJapanKorea, Republic ofKuwait
CongoCook IslandsCosta RicaCôte d’IvoireCuba
RomaniaRussian FederationSaint LuciaSaint Vincent and
the Grenadines
Tanzania, United Republic ofTogoUgandaZimbabwe
Latvia Djibouti Samoa
Liechtenstein Dominica Sao Tome and Principe
Lithuania Dominican Republic Serbia
LuxembourgMacau, China
EcuadorEgypt
Solomon IslandsSouth Africa
Malta El Salvador Sri LankaMonaco Equatorial Guinea SudanNetherlands Fiji SurinameNetherlands Antilles Gabon SwazilandNew Caledonia Georgia Syrian Arab RepublicNew Zealand Ghana TajikistanNorway Grenada ThailandOman Guatemala Timor-LestePoland Guyana TongaPortugal Honduras TunisiaPuerto Rico India TurkeyQatar Indonesia TurkmenistanSaint Kitts and Nevis Iran, Islamic Republic of TuvaluSan Marino Iraq UkraineSaudi Arabia Jamaica UzbekistanSeychelles Jordan VanuatuSingapore Kazakhstan Venezuela, Bolivarian Slovakia Kenya Republic ofSlovenia Kiribati Viet NamSpain Kyrgyzstan Western SaharaSweden Lao People’s YemenSwitzerland Democratic Republic Zambia

Appendix B. Labour market estimates, projections and scenarios 43
Appendix B. Labour market estimates, projections and scenarios
The source of all global and regional labour market estimates in this World Employment and Social Outlook report is ILO, Trends Econometric Models (TEM), November 2016. The ILO has designed and actively maintains econometric models which are used to produce estimates of labour market indica-tors in the countries and years for which country-reported data are unavailable. These allow the ILO to produce and analyse global and regional estimates of key labour market indicators and related trends.
The TEM is used to produce estimates and projections – disaggregated by age and sex as appro-priate – of unemployment, employment and status in employment. The output of the model is a complete matrix of data for 188 countries. The country-level data can then be aggregated to produce regional and global estimates of labour market indicators, such as the unemployment rate, the employ-ment-to-population ratio, status in employment shares and vulnerable employment rate.
Prior to running the TEM, labour market information specialists in the Research Department, in co-operation with ILOSTAT and specialists in ILO field offices, evaluate existing country-reported data and select only those observations deemed sufficiently comparable across countries using criteria including: (1) type of data source; (2) geographic coverage; and (3) age group coverage.
• With regard to the first criterion, in order for data to be included in the model, they must be derived from either a labour force survey or a population census. National labour force surveys are generally similar across countries, and the data derived from these surveys are more readily comparable than data obtained from other sources. A strict preference is therefore given to labour force survey-based data in the selection process. However, many developing countries which lack the resources to carry out a labour force survey do report labour market information based on population censuses. Consequently, due to the need to balance the competing goals of data comparability and data cov-erage, some population census-based data are included in the model.
• The second criterion is that only nationally representative (i.e. not prohibitively geographically limited) labour market indicators are included. Observations corresponding to only urban or only rural areas are not included, as large differences typically exist between rural and urban labour markets, and using only rural or urban data would not be consistent with benchmark data such as GDP.
• The third criterion is that the age groups covered by the observed data must be sufficiently com parable across countries. Countries report labour market information for a variety of age groups and the age group selected can have an influence on the observed value of a given labour market indicator.
Apart from country-reported labour market information, the TEM uses the following benchmark files:
• United Nations World Population Prospects, 2015 revision for population estimates and projections;
• ILO Economically Active Population, Estimates and Projections (EAPEP) for labour force estimates and projections;
• IMF/World Bank data on GDP (PPP, per capita GDP and GDP growth rates) from the World Development Indicators and the World Economic Outlook October 2016 database;
• World Bank poverty estimates from the PovcalNet database.
Estimates of labour market indicators
The TEM produces estimates of unemployment rates to fill in missing values in the countries and years for which country-reported data are unavailable. Multivariate regressions are run separately for different regions in the world in which unemployment rates, broken down by age and sex (youth male, youth female, adult male, adult female), are regressed on GDP growth rates. Weights are used in the regres-sions to correct for biases that may result from the fact that countries which report unemployment rates tend to differ (in statistically important respects) from countries that do not report unemployment rates.1 For 2016, a preliminary estimate is produced, using quarterly and monthly information available up to the time of production of this World Employment and Social Outlook report (November 2016).
The model also estimates employment by status using similar techniques to impute missing values at the country level. In addition to GDP growth rate, the variables used as explanatory variables are the
1. For instance, if simple averages of unemployment rates in reporting countries in a given region were used to estimate the un-employment rate in that region, and the countries that do not report unemployment rates should happen to differ from reporting countries with respect to unemployment rates, without such a correction mechanism the resulting estimated regional unemployment rate would be biased. The “weighted least squares” approach adopted in the TEM corrects for this potential problem.
44 World Employment and Social Outlook – Trends for women 2017
value added shares of the three broad sectors in GDP, per capita GDP and the share of people living in urban areas. Additional econometric models are used to produce global and regional estimates of working poverty and employment by economic class (Kapsos and Bourmpoula, 2013).
Projections of labour market indicators
Unemployment rate projections are obtained using the historical relationship between unemployment rates and GDP growth during the worst crisis/downturn period for each country between 1991 and 2005, and during the corresponding recovery period.2 This was done through the inclusion of inter-action terms of crisis and recovery dummy variables with GDP growth in fixed effects panel regres-sions.3 Specifically, the logistically transformed unemployment rate was regressed on a set of covariates, including the lagged unemployment rate, the GDP growth rate, the lagged GDP growth rate and a set of covariates consisting of the interaction of the crisis dummy and the interaction of the recovery-year dummy with each of the other variables.
Separate panel regressions were run across three different groupings of countries, based on:
(1) geographic proximity and economic/institutional similarities;
(2) income levels;4
(3) level of export dependence (measured as exports as a percentage of GDP).5
The rationale behind these groupings is as follows. Countries within the same geographic area or with similar economic/institutional characteristics are likely to be similarly affected by the crisis and have similar mechanisms to attenuate the impact of the crisis on their labour markets. Furthermore, because countries within given geographic areas often have strong World Trade Organization (WTO) and financial linkages, the crisis is likely to spill over from one economy to its neighbour (e.g. Canada’s economy and labour market developments are intricately linked to developments in the United States). Countries with similar income levels are also likely to have similar labour market institutions (e.g. social protection measures) and similar capacities to implement fiscal stimulus and other policies to counter the impact of the crisis. Finally, as the decline in exports was the primary crisis transmission channel from developed to developing economies, countries were grouped according to their level of exposure to this channel, as measured by their exports as a percentage of GDP. The impact of the crisis on labour markets through the export channel also depends on the type of exports (the affected sectors of the economy) involved, the share of domestic value added in exports and the relative importance of domestic consumption (for instance, countries such as India and Indonesia, with a large domestic market, were less vulnerable than countries such as Singapore and Thailand). These characteristics are controlled for by using fixed effects in the regressions.
In addition to the panel regressions, country-level regressions were run for countries with suffi-cient data. The ordinary least squares country-level regressions included the same variables as the panel regressions.
To take into account the uncertainty surrounding GDP prospects, as well as the complexity of cap-turing the relationship between GDP and unemployment rate for all the countries, a variety of ten (similar) multilevel mixed-effects linear regressions (varying-intercept and varying-coefficient models)
2. The crisis period comprises the span between the year in which a country experienced the largest drop in GDP growth, and the “turning point year” when growth reached its lowest level following the crisis, before starting to climb back to its pre-crisis level. The recovery period comprises the years between the “turning point year” and the year when growth returned to its pre-crisis level.
3. In order to project unemployment during the current recovery period, the crisis-year and recovery-year dummies were adjusted based on the following definition: a country was considered to be “currently in crisis” if the drop in GDP growth after 2007 was larger than 75 per cent of the absolute value of the standard deviation of GDP growth over the 1991–2008 period and/or larger than 3 percentage points.
4. The income groups correspond to the World Bank income group classification of four income categories, based on countries’ 2008 gross national income (GNI) per capita (calculated using the Atlas method): low-income countries, US$1,025 or less; lower middle-income countries, US$1,026–US$4,035; upper middle-income countries, US$4,036–US$12,475; and high-income countries, US$12,476 or more.
5. The export dependence-based groups are: highest exports (exports ≥ 70 per cent of GDP); high exports (exports < 70 per cent but ≥ 50 per cent of GDP); medium exports (exports < 50 per cent but ≥ 20 per cent of GDP); and low exports (exports < 20 per cent of GDP).

Appendix B. Labour market estimates, projections and scenarios 45
are utilized. The main component that changes across these ten versions is the lag structure of the independent variables. The potential superiority of these models lies in the fact that, not only is the panel structure fully exploited (e.g. increased degrees of freedom), but it is also possible to estimate the coefficients specifically for each unit (country), taking into account unobserved heterogeneity at the cluster level and correcting for the random effects approach caveat that the independent variables are not correlated with the random effects term.
Overall, the final projection was generated as a simple average of the estimates obtained from the three group panel regressions and also, for countries with sufficient data, the country-level regressions. For a selection of countries (41 out of 188), an average of another set of forecast combinations was made according to judgemental examination in order to represent more realistically the recent trends observed in each country’s economic forecast.
Short-term projection model
For 41 countries, the preliminary unemployment estimate for 2016 and the projection for 2017 are based on results from a country-specific short-term projection model. The ILO maintains a database on monthly and quarterly unemployment flows that contains information on inflow and outflow rates of unemployment, estimated on the basis of unemployment by duration, following the methodologies pro-posed by Shimer (2012) and Elsby, Hobijn and Sahin (2013). A multitude of models are specified that either project the unemployment rate directly or determine both inflow and outflow rates, using ARIMA, VARX and combined forecast techniques. The short-term projection model relies on several explanatory variables, including hiring uncertainty (Ernst and Viegelahn, 2014), policy uncertainty (Baker, Bloom and Davis, 2013), macroeconomic forecasts by Oxford Economics and the Manpower Employment Survey Outlook. All estimated models are evaluated on an eight-quarter ahead rolling pseudo out-of-sample forecasting evaluation starting in Q1 2009, among which five models are selected using a weighting of the mean and maximum forecast error. The top five model forecasts are then averaged.
Changes to the estimates and projections: Trends Econometric Models (TEM) 2016 vs 2015
As for the previous editions of the TEM, global and regional unemployment levels and rates have been revised to take into account new information on unemployment rates as well as revisions to labour force and economic growth historical data and projections. Sources of discrepancy between the TEM November 2016 and the TEM November 2015 unemployment figures may be summarized as follows:
New unemployment rate data entries reported in national labour force surveys: Overall, the TEM November 2016 shows 260 new reported observations, of which 103 are recent (2014 or 2015), as compared with the TEM November 2015. Three countries have information on unemployment rates that before had none, most prominently Myanmar.
Backward revisions to historical unemployment rates: Some 61.7 per cent (512 observations) of the unemployment rates observed in the TEM November 2016 between 2008 and 2014 have been subject to backward revisions. Yet, the magnitude of these changes is negligible in the large majority of cases. In only 10.7 per cent of cases (89 observations) were revisions larger than 0.1 percentage points, and in only 15 cases were they larger than 1 percentage point. Notably, these include: Costa Rica (2010–2012), Paraguay (2011), Israel (2008–2011) and Mongolia (2011).
Revisions to past and projected GDP growth rates: Between the IMF World Economic Outlook (WEO) October 2015 and the WEO October 2016 updates, the forecast for global real GDP growth rate in 2016 was revised downward by 0.5 percentage points, while it was revised downward by 0.4 per-centage points for 2017. Regarding the historical series, real GDP growth was revised upward by 0.1 percentage points for 2015. These changes to GDP growth past data and projections have led to small revisions in the estimated relationship between unemployment rate and GDP growth rate.
As a result of the changes described above, the baseline projection for the global unemployment rate was revised downward by 0.1 percentage points for the year 2016 and upward by 0.1 percentage points for the years 2017 and 2018.

46 World Employment and Social Outlook – Trends for women 2017
Appendix C. Estimating female labour force participation
This appendix describes the econometric approach used to estimate the determinants of female labour force participation. The underlying database is the 2016 round of the Gallup World Poll, which con-ducts interviews with 500 men and 500 women1 aged 15 and over in 142 countries around the world. Participants are asked a wide range of questions, including questions related to their status in the labour market. The individual status of participation of women – yes or no – is the variable of interest to be explained by the econometric analysis.
The econometric model of choice when dealing with a binary response variable is a probit regression. The probability of women i in country j participating in the labour market (Pr (Pij = 1)) is modelled using the cumulative distribution function of the standard normal distribution (Φ()), taking explanatory variables as an argument. This function is bound between zero and 1 and is solved using maximum likelihood techniques.
Pr (Pij = 1) = Φ(αj + βAij + γBijCij + δDijE ) (1)
Equation (1) represents the functional form chosen for the estimation, where α β γ and δ represent vectors of coefficients and ABCD and E represent vectors of variables. Women from multiple coun-tries j are pooled together to estimate average effects, but also to increase the sample size. Country dummies imply country-specific intercepts αj and capture all country-specific aggregate characteristics that affect all individuals in a country, such as policy, culture or the labour market conditions. Country dummies need to be used since very limited country-specific information is available for many of the countries in the sample.
Explanatory variables are introduced in three different ways into equation (1). First, individual charac-teristics can directly impact participation, represented by βAij. Second, the impact of characteristic B might differ between individuals with different levels of characteristic C, which is captured by the inter-action term γBijCij. Finally, the impact of characteristic D can differ between individuals, depending on whether they are in a country group of characteristic E, captured by the term δDijE .
The model is estimated separately for developing, emerging and developed countries. The explanatory variables of interest are the ones representing either individual preferences, socio-economic constraints or gender roles imposed by society. Furthermore, control variables that are well established in the lit-erature, such as age and education, have also been included. Table C1 lists the variables used in the regression analysis and states the base level in the case of dummy variables.
The estimation takes into account sampling weights, clustering, and stratification of the survey design to most accurately compute the standard errors. The population weights of the survey are applied as the sampling weights to achieve the correct point estimates without bias. Stratification based on the sampling of each country separate from other countries provides smaller standard errors for the overall sample size. Clustering regards each individual as the primary sampling unit.
Table C2 presents the estimated coefficients of the regression of the probit model for the four country groups estimated. The marginal impact on participation of a change in a certain variable needs to be computed by applying the cumulative distribution function of the standard normal distribution to the coefficients, assuming that values for all variables are included. Chapter 2 shows only some selected computed marginal impacts.
1. In some countries a greater number of people were surveyed. See gallup.com for further information.
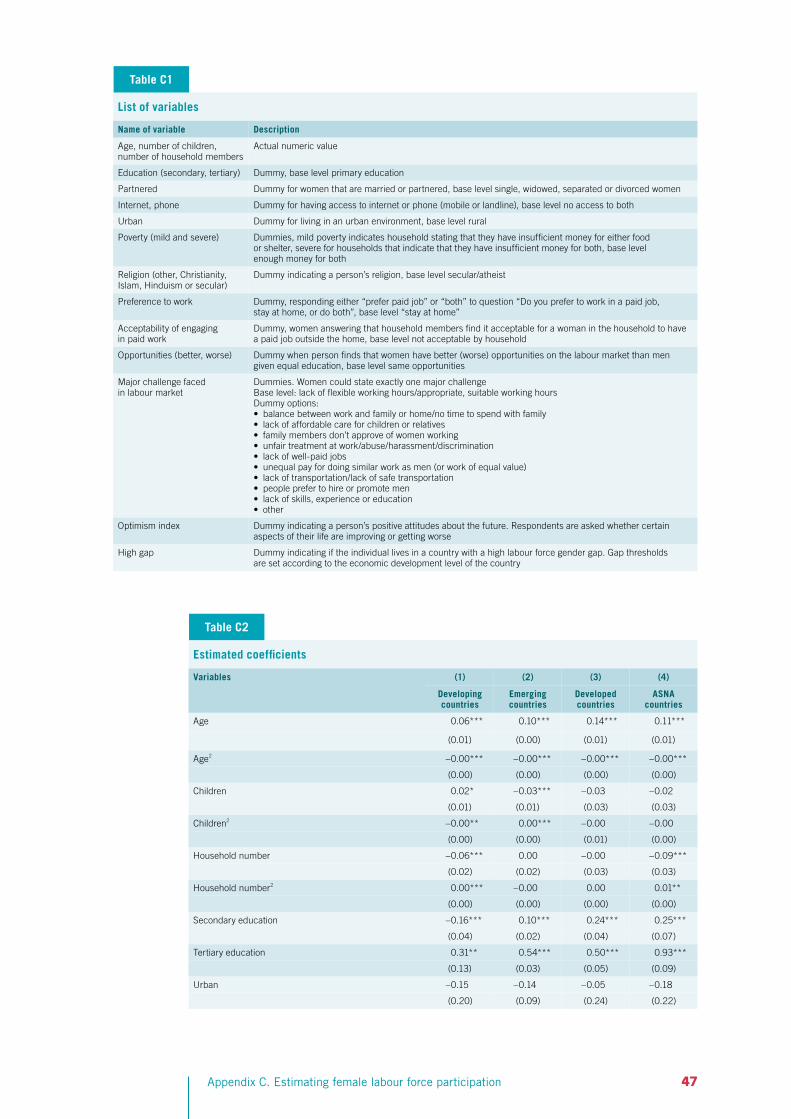
Appendix C. Estimating female labour force participation 47
Table C1
List of variables
Name of variable Description
Age, number of children, number of household members
Actual numeric value
Education (secondary, tertiary) Dummy, base level primary education
Partnered Dummy for women that are married or partnered, base level single, widowed, separated or divorced women
Internet, phone Dummy for having access to internet or phone (mobile or landline), base level no access to both
Urban Dummy for living in an urban environment, base level rural
Poverty (mild and severe) Dummies, mild poverty indicates household stating that they have insufficient money for either food or shelter, severe for households that indicate that they have insufficient money for both, base level enough money for both
Religion (other, Christianity, Islam, Hinduism or secular)
Dummy indicating a person’s religion, base level secular/atheist
Preference to work Dummy, responding either “prefer paid job” or “both” to question “Do you prefer to work in a paid job, stay at home, or do both”, base level “stay at home”
Acceptability of engaging in paid work
Dummy, women answering that household members find it acceptable for a woman in the household to have a paid job outside the home, base level not acceptable by household
Opportunities (better, worse) Dummy when person finds that women have better (worse) opportunities on the labour market than men given equal education, base level same opportunities
Major challenge faced in labour market
Dummies. Women could state exactly one major challengeBase level: lack of flexible working hours/appropriate, suitable working hoursDummy options:• balance between work and family or home/no time to spend with family • lack of affordable care for children or relatives• family members don’t approve of women working• unfair treatment at work/abuse/harassment/discrimination• lack of well-paid jobs• unequal pay for doing similar work as men (or work of equal value)• lack of transportation/lack of safe transportation• people prefer to hire or promote men• lack of skills, experience or education• other
Optimism index Dummy indicating a person’s positive attitudes about the future. Respondents are asked whether certain aspects of their life are improving or getting worse
High gap Dummy indicating if the individual lives in a country with a high labour force gender gap. Gap thresholds are set according to the economic development level of the country
Estimated coefficients
Table C2
Variables (1) (2) (3) (4)
Developing countries
Emerging countries
Developed countries
ASNA countries
Age 0.06*** 0.10*** 0.14*** 0.11***
(0.01) (0.00) (0.01) (0.01)
2Age –0.00*** –0.00*** –0.00*** –0.00***
(0.00) (0.00) (0.00) (0.00)
Children 0.02* –0.03*** –0.03 –0.02
(0.01) (0.01) (0.03) (0.03)2Children –0.00** 0.00*** –0.00 –0.00
(0.00) (0.00) (0.01) (0.00)
Household number –0.06*** 0.00 –0.00 –0.09***
(0.02) (0.02) (0.03) (0.03)2Household number 0.00*** –0.00 0.00 0.01**
(0.00) (0.00) (0.00) (0.00)
Secondary education –0.16*** 0.10*** 0.24*** 0.25***
(0.04) (0.02) (0.04) (0.07)
Tertiary education 0.31** 0.54*** 0.50*** 0.93***
(0.13) (0.03) (0.05) (0.09)
Urban –0.15 –0.14 –0.05 –0.18
(0.20) (0.09) (0.24) (0.22)

48 World Employment and Social Outlook – Trends for women 2017
Table C2
Estimated coefficients
Variables (1) (2) (3) (4)
Developing Emerging Developed ASNA countries countries countries countries
Internet –0.01 0.19*** 0.28*** 0.14**
(0.05) (0.02) (0.05) (0.07)
Phone 0.25*** 0.11*** 0.04 0.28**
(0.04) (0.03) (0.14) (0.11)
Poverty (mild) 0.14*** 0.13*** 0.01 0.25***
(0.04) (0.02) (0.05) (0.06)
Poverty (severe) 0.22*** 0.22*** 0.04 0.47***
(0.04) (0.03) (0.06) (0.09)
Partnered 0.07 –0.12** –0.25*** –0.57***
(0.09) (0.05) (0.09) (0.16)
Household accepting –0.03 –0.03 –0.13 –0.23
(0.09) (0.07) (0.17) (0.22)
Prefer to work, rural, and household not accepting –0.73 –0.18 0.07 0.37
(0.64) (0.17) (0.23) (0.27)
Prefer to work, rural, and household accepting 0.17 0.17** 0.54** 0.32
(0.12) (0.08) (0.21) (0.28)
Prefer to work, urban, and household not accepting 0.33 0.27** 0.39 0.10
(0.24) (0.12) (0.32) (0.29)
Prefer to work, urban, and household accepting 0.35 0.37** 0.69* 0.54
(0.25) (0.15) (0.39) (0.42)
Stay at home, urban, and household accepting –0.23 0.05 0.14 0.24
(0.22) (0.10) (0.25) (0.27)
Prefer to work and partnered 0.02 0.14*** 0.21** 0.38**
(0.09) (0.05) (0.09) (0.15)
High gap (LFPR) –0.50*** –1.51***
(0.18) (0.14)
High gap and prefer to work 0.11 0.23***
(0.13) (0.07)
Opportunities (better) 0.05 0.07*** 0.14*** 0.09
(0.04) (0.02) (0.05) (0.07)
Opportunities (worse) 0.07 –0.02 –0.06* –0.02
(0.04) (0.02) (0.03) (0.06)
Opportunities (don’t know) –0.09 –0.11** 0.03 –0.36**
(0.07) (0.04) (0.10) (0.18)
Optimism index 0.00 0.00** 0.00*** 0.00
(0.00) (0.00) (0.00) (0.00)

Appendix C. Estimating female labour force participation 49
Table C2
Estimated coefficients
Variables (1) (2) (3) (4)
Developing Emerging Developed ASNA countries countries countries countries
Challenges
Work–family balance –0.10 –0.11*** –0.01 –0.11
(0.08) (0.04) (0.06) (0.11)
Lack of affordable childcare –0.17** –0.06 –0.14* –0.24
(0.08) (0.05) (0.08) (0.15)
Family disapproval –0.16* –0.17*** –0.10 –0.05
(0.09) (0.06) (0.14) (0.14)
Abuse/harassment/discrimination at work –0.15** –0.06 –0.07 –0.10
(0.08) (0.04) (0.08) (0.12)
Lack of well–paying jobs –0.07 –0.01 0.05 0.02
(0.09) (0.04) (0.08) (0.13)
Unequal pay –0.08 –0.02 0.01 0.19
(0.11) (0.06) (0.07) (0.16)
Lack of transportation –0.46*** –0.16** 0.15 –0.05
(0.15) (0.07) (0.22) (0.15)
Prefer to hire men –0.11 –0.05 –0.09 0.33
(0.12) (0.07) (0.09) (0.20)
Lack of skills or experience –0.07 0.00 0.03 –0.06
(0.11) (0.07) (0.14) (0.31)
Other challenge –0.27*** 0.01 –0.05 –0.00
(0.09) (0.05) (0.07) (0.14)
Don’t know –0.17** –0.13*** –0.15* –0.11
(0.08) (0.04) (0.08) (0.13)
Religion
Other and stay at home –1.11* –0.10 0.03 0.75**
(0.63) (0.16) (0.14) (0.30)
Other and prefer to work –0.18 0.11 0.09 0.87***
(0.24) (0.08) (0.06) (0.28)
Christianity and stay at home –0.98 –0.20 0.20* 0.25
(0.60) (0.15) (0.10) (0.28)
Christianity and prefer to work –0.15 0.05 –0.03 0.48***
(0.22) (0.08) (0.04) (0.15)
Islam and stay at home –1.18** –0.54*** –0.71***
(0.60) (0.16) (0.24)
Islam and prefer to work –0.39* –0.12 –0.22*
(0.23) (0.09) (0.12)
Hinduism and stay at home –0.57 –0.40** –0.81
(0.64) (0.20) (0.55)
Hinduism and prefer to work –0.17 –0.07 0.45*
(0.31) (0.12) (0.27)
Number of observations 10 620 31 143 16 741 4 777
Countries 22 59 35 11
Note: Standard errors are shown in parentheses. Countries with not enough observations for selected variables are dropped. *** p < 0.01, ** p < 0.05, * p < 0.1.

50 World Employment and Social Outlook – Trends for women 2017
Appendix D. Decomposing gender gaps in employment relationships
This appendix describes the methodology used to decompose gender gaps in types of employment re-lationship, such as status in employment, informality, working time or type of contract. A gender gap in, say, own-account work can be due to the fact that women are more likely than men to be employed in sectors, or to have occupations, that are more or less prone to be characterized by own-account work, or by the fact that there is a gender gap within that sector or occupation. Consequently, the gender gaps of job quality indicators will be decomposed into three components: (1) gaps due to sectoral segregation, (2) gaps due to occupational segregation, and (3) residual gender gaps.
A gender gap in an employment relationship type is determined as male employment in as a share of total male employment, sh jm,tot, minus female employment in j as a share of total female employment, sh jf,tot. The employment share in a certain employment relationship type for each sex, sh jtot, is computed as the sum of employment in j over all sectors and occupations, divided by the sum of employment over all sectors and occupations. This can be expanded to show the share of employment in an employment relationship type within a certain sector s and occupation o (sh jos), multiplied by the share of that sector and occupation in overall sectoral employment (sh so), multiplied by the share of that occupation in total employment (sh o). Mathematically, this means
j j
(1)
where E jos is employment in sector s and occupation o of employment relationship type j. Differences in job quality employment shares between men and women can be decomposed into
(2)
where Δsh reflects the difference in the shares between men and women for that particular share, which is multiplied by the weight of that category in the total employment. The weights are chosen as the average between the male and the female shares in employment. The first component of the decomposition reflects the gender gap due to residual factors, the second component the gap due to sectoral segregation, and the last component the gap due to occupational segregation.
The decomposition is applied to the micro data of labour force surveys available in the ILOSTAT repos-itory. Surveys exist for a total of 29 developing and emerging countries, for recent years but also going back as far as 2003 for some countries. For each survey available for a country and year the most detailed sectoral and occupational decomposition is used, where the level of detail varies from ISIC two-digit level to six-sector aggregates, as well as ISCO two-digit or ISCO one-digit level. The decom-position is also applied to micro data of labour force surveys from 2009 to 2013 provided by Eurostat. These include the 28 EU member countries, with the exception of Bulgaria and Germany, and the additional inclusion of Iceland, Norway and Switzerland. The sector data is available at one-digit level, while occupations have been aggregated to the two-digit level.
In a first step, the decomposition is averaged over all the available survey years for a country, in order to smooth out potential fluctuations due to survey variability, but also to obtain a single value for a country. The second step involves the contributions to the total gap being averaged by taking the simple mean of all available countries. The sum of the average contributions would then represent the average gender gap for the employment relationship type. In a third step, the absolute sum of the contributions is rescaled to 100, greatly improving the readability of a figure when presenting decompositions of multiple variables.

Appendix E. Gender breakdown of key labour market indicators 51
Appendix E. Gender breakdown of key labour market indicators
Table E1
Unemployment developments by gender, 1997, 2007 and 2017
Country/region Rate (per cent)
1997 2007 2017
World 6.0 6.8 5.3 5.9 5.5 6.2
Developing countries 4.6 6.6 5.0 6.7 4.7 6.5
Emerging countries 5.9 6.4 5.3 5.8 5.4 6.1
Developed countries 6.9 8.2 5.4 6.1 5.9 6.4
Northern Africa 12.4 23.6 9.0 18.2 9.5 20.0
Sub-Saharan Africa 6.6 9.0 6.8 8.9 6.2 8.3
Latin America and the Caribbean 7.9 12.4 6.7 10.4 7.0 10.4
Northern America 5.3 5.3 4.9 4.6 5.3 4.9
Arab States 9.7 24.5 8.2 19.3 8.3 21.2
Eastern Asia 4.8 3.9 4.2 3.3 5.1 3.7
South-Eastern Asia and the Pacific 3.8 4.0 5.1 5.4 3.8 3.9
Southern Asia 4.6 5.5 4.0 4.6 3.8 5.0
Northern, Southern and Western Europe 9.9 12.3 6.8 8.1 8.8 9.3
Eastern Europe 10.1 9.8 6.7 6.2 6.4 5.8
Central and Western Asia 8.4 10.2 8.9 9.1 8.9 9.6
Table E2
Unemployment developments by gender, 1997, 2007 and 2017
1997
Number (millions)
2007
2017
Country/region
World 96.3 71.9 98.2 73.7 115.8 85.3
Developing countries 4.0 4.9 5.8 6.8 7.3 8.8
Emerging countries 71.4 48.8 74.7 51.5 87.9 59.1
Developed countries 20.9 18.2 17.8 15.3 20.5 17.4
Northern Africa 4.7 2.5 4.3 2.7 5.5 3.6
Sub-Saharan Africa 8.2 9.1 10.8 12.3 13.5 15.5
Latin America and the Caribbean 10.6 9.9 10.8 11.3 13.1 13.6
Northern America 4.5 3.8 4.6 3.7 5.3 4.2
Arab States 2.1 1.0 2.6 1.3 3.7 2.1
Eastern Asia 22.3 14.6 20.8 13.0 26.9 15.0
South-Eastern Asia and the Pacific 5.5 4.2 9.0 7.0 7.8 5.9
Southern Asia 17.0 7.9 18.6 8.2 20.6 9.2
Northern, Southern and Western Europe 11.1 10.2 8.0 7.7 10.4 9.3
Eastern Europe 7.7 6.7 5.2 4.4 4.9 4.1
Central and Western Asia 2.7 2.1 3.4 2.1 4.1 2.8

52 World Employment and Social Outlook – Trends for women 2017
Table E3
Labour force participation developments by gender, 1997, 2007 and 2017
Country/region Rate (per cent)
1997 2007 2017
World 79.3 52.2 77.1 51.1 76.1 49.4
Developing countries 84.1 69.4 83.5 70.9 82.6 70.3
Emerging countries 81.2 51.6 78.5 49.4 77.5 46.9
Developed countries 71.5 49.9 69.9 51.7 68.0 51.9
Northern Africa 74.7 21.4 73.2 22.1 74.1 22.9
Sub-Saharan Africa 77.9 61.7 75.8 63.9 76.3 64.6
Latin America and Caribbean 81.9 46.6 80.1 51.9 78.3 52.7
Northern America 74.0 58.5 72.1 58.7 68.3 56.2
Arab States 75.5 17.5 74.5 19.2 76.4 21.2
Eastern Asia 83.4 68.9 78.1 63.3 76.8 61.3
South-Eastern Asia and the Pacific 82.0 58.0 81.7 58.6 81.2 58.8
Southern Asia 83.3 34.3 81.9 33.1 79.4 28.6
Northern, Southern and Western Europe 66.9 46.1 66.0 49.9 63.8 51.3
Eastern Europe 66.6 51.5 66.6 53.0 68.1 53.0
Central and Western Asia 74.6 42.9 71.2 40.8 73.5 44.1
Table E4
Labour force participation developments by gender, 1997, 2007 and 2017
Country/region Number (millions)
1997 2007 2017
World 1600.8 1058.7 1865.2 1239.5 2116.8 1374.2
Developing countries 87.3 75.2 115.0 101.4 154.8 135.9
Emerging countries 1210.1 761.1 1421.9 886.5 1616.5 968.2
Developed countries 303.3 222.4 328.3 251.6 345.5 270.1
Northern Africa 37.5 10.8 47.6 14.5 57.9 18.1
Sub-Saharan Africa 124.4 101.5 160.1 138.6 216.7 186.5
Latin America and Caribbean 134.1 79.7 160.1 108.5 185.4 130.4
Northern America 85.8 71.3 94.8 80.2 99.5 84.4
Arab States 21.4 4.3 31.8 6.7 45.2 10.1
Eastern Asia 462.5 371.6 501.4 395.7 526.3 408.4
South-Eastern Asia and the Pacific 143.9 104.8 175.4 129.0 204.2 151.5
Southern Asia 370.0 143.8 461.0 177.2 541.1 185.8
Northern, Southern and Western Europe 112.2 82.7 117.4 94.2 117.5 99.8
Eastern Europe 76.2 67.9 77.7 71.7 76.8 69.6
Central and Western Asia 32.8 20.3 38.0 23.3 46.1 29.5

Appendix D. Decomposing gender gaps in employment relationships 53
Table E5a
Employment status by gender, 1997
Country/region Share of employment (%)
Wage and salaried Employers Own-account Contributing family workers workers workers
World 48.4 46.5 3.9 1.5 38.2 24.5 9.6 27.5
Developing countries 22.2 11.6 2.3 0.7 59.5 57.8 15.9 29.9
Emerging countries 42.3 38.9 3.3 1.2 43.1 26.0 11.2 33.9
Developed countries 80.6 85.2 6.4 2.6 12.0 7.9 1.0 4.3
Northern Africa 56.7 46.1 9.5 2.1 23.6 22.9 10.2 28.9
Sub-Saharan Africa 34.3 18.5 2.4 0.8 50.9 55.9 12.3 24.9
Latin America and the Caribbean 58.5 60.3 5.8 2.6 29.7 25.9 6.0 11.2
Northern America 84.6 90.5 6.1 2.6 9.2 6.7 0.1 0.3
Arab States 71.0 65.7 4.2 1.0 19.8 17.0 5.0 16.3
Eastern Asia 52.6 45.6 3.9 0.9 34.7 19.1 8.7 34.4
South-Eastern Asia and the Pacific 37.2 31.6 3.8 1.2 41.6 22.5 17.4 44.6
Southern Asia 22.0 11.2 1.4 0.5 62.3 43.5 14.3 44.8
Northern, Southern and Western Europe 79.3 86.2 7.5 3.1 11.8 6.9 1.4 3.9
Eastern Europe 84.6 84.6 4.0 3.9 9.8 7.9 1.6 3.6
Central and Western Asia 53.5 49.5 4.9 0.6 34.4 27.8 7.2 22.0
Table E5b
Employment status by gender, 2007
Country/region Share of employment (%)
Wage and salaried Employers Own-account Contributing family workers workers workers
World 51.4 51.7 3.6 1.4 37.5 26.3 7.6 20.6
Developing countries 20.7 11.0 2.6 0.8 56.3 50.7 20.5 37.5
Emerging countries 46.7 46.1 3.2 1.3 42.0 28.9 8.2 23.7
Developed countries 82.3 87.9 5.7 2.3 11.3 7.2 0.6 2.5
Northern Africa 59.5 49.1 9.6 2.1 22.7 18.9 8.2 29.8
Sub-Saharan Africa 32.9 20.0 2.7 0.9 47.6 47.6 16.8 31.5
Latin America and the Caribbean 62.3 64.5 5.9 2.8 27.2 23.9 4.6 8.8
Northern America 86.3 91.8 5.2 2.2 8.4 5.9 0.1 0.1
Arab States 75.7 76.2 4.6 1.4 16.3 12.7 3.4 9.7
Eastern Asia 62.4 57.4 2.9 0.9 30.3 22.8 4.3 18.9
South-Eastern Asia and the Pacific 41.6 36.7 4.1 1.5 41.8 28.6 12.5 33.2
Southern Asia 22.7 14.6 1.6 0.5 63.8 44.6 12.0 40.2
Northern, Southern and Western Europe 80.3 88.0 6.6 2.6 12.2 7.3 0.8 2.2
Eastern Europe 83.3 85.0 4.5 3.7 11.2 9.2 1.0 2.1
Central and Western Asia 63.2 59.5 4.9 1.1 27.4 25.2 4.5 14.1

54 World Employment and Social Outlook – Trends for women 2017
Table E5c
Employment status by gender, 2017
Share of employment (%)Country/region
Wage and salaried Employers Own-account Contributing family workers
workers
workers
World 54.4 55.4 3.2 1.3 37.0 28.4 5.5 14.9
Developing countries 24.3 13.6 2.8 1.0 55.7 48.9 17.2 36.6
Emerging countries 51.0 51.8 2.8 1.1 40.8 31.4 5.4 15.6
Developed countries 83.7 89.1 5.1 2.2 10.7 7.2 0.4 1.6
Northern Africa 62.8 54.0 8.4 1.6 23.5 17.1 5.3 27.3
Sub-Saharan Africa 36.3 22.6 2.8 1.0 46.9 45.8 14.0 30.6
Latin America and the Caribbean 62.6 65.3 5.6 2.6 28.6 25.3 3.1 6.8
Northern America 87.6 92.4 4.9 2.0 7.5 5.5 0.0 0.1
Arab States 79.2 77.2 3.7 1.2 15.2 14.6 1.9 7.0
Eastern Asia 69.3 65.5 2.4 0.9 26.0 25.4 2.2 8.1
South-Eastern Asia and the Pacific 49.0 44.4 3.8 1.5 39.6 30.3 7.7 23.8
Southern Asia 26.8 18.2 1.4 0.6 63.5 50.1 8.2 31.0
Northern, Southern and Western Europe 80.9 88.6 5.9 2.4 12.5 7.7 0.7 1.3
Eastern Europe 85.0 88.7 2.6 1.3 11.5 8.3 0.9 1.7
Central and Western Asia 67.5 65.9 4.8 1.7 23.1 18.4 4.5 13.9
Table E6a
Employment by economic class and gender, 1997
Country/region Share of employment (%)
Working poverty, Developing middle class, Developed middle class, (<US$ PPP 3.10/day) (US$ PPP 5-13/day) (>US$ PPP 14/day)
Emerging and developing countries 60.3 62.3 16.4 15.6 6.4 6.7
Northern Africa 43.6 45.8 25.2 24.1 3.8 6.3
Sub-Saharan Africa 73.9 77.2 10.5 8.9 3.5 2.6
Latin America and the Caribbean 20.1 16.5 37.2 38.3 25.2 29.9
Arab States 26.4 18.2 28.5 27.3 23.8 30.4
Eastern Asia 69.0 70.0 10.4 9.8 1.6 1.6
South-Eastern Asia and the Pacific 64.2 64.3 16.6 16.8 5.2 6.3
Southern Asia 72.8 81.1 9.6 5.6 1.3 1.1
Eastern Europe 5.3 6.8 48.9 52.1 31.9 28.4
Central and Western Asia 27.4 28.6 38.8 34.1 13.5 13.7

Appendix D. Decomposing gender gaps in employment relationships 55
Table E6b
Employment by economic class and gender, 2007
Country/region Share of employment (%)
Working poverty, Developing middle class, Developed middle class, (<US$ PPP 3.10/day) (US$ PPP 5-13/day) (>US$ PPP 14/day)
Emerging and Developing Countries 42.3 40.2 27.4 28.7 9.5 10.8
Northern Africa 30.1 28.1 35.8 36.7 4.9 8.1
Sub-Saharan Africa 69.4 72.8 11.7 9.9 3.9 3.0
Latin America and the Caribbean 12.6 11.4 41.3 40.6 32.8 36.8
Arab States 22.1 17.2 27.7 26.2 30.8 36.2
Eastern Asia 28.5 26.9 39.7 40.1 4.2 4.1
South-Eastern Asia and the Pacific 45.7 45.7 23.8 24.0 8.7 10.1
Southern Asia 64.2 71.0 13.7 9.4 1.7 1.6
Eastern Europe 3.8 3.5 40.4 40.3 51.4 52.8
Central and Western Asia 15.5 14.7 46.1 49.7 22.6 17.7
Table E6c
Employment by economic class and gender, 2017
Country/region Share of employment (%)
Working poverty, Developing middle class, Developed middle class, (<US$ PPP 3.10/day) (US$ PPP 5-13/day) (>US$ PPP 14/day)
Emerging and Developing Countries 29.1 27.0 35.7 36.9 16.3 19.7
Northern Africa 24.2 21.8 42.3 45.0 5.1 7.7
Sub-Saharan Africa 61.2 64.6 13.6 11.6 4.7 3.7
Latin America and the Caribbean 8.0 7.8 40.9 39.0 40.4 44.9
Arab States 21.1 19.6 25.3 23.3 35.9 40.3
Eastern Asia 10.1 9.7 61.0 59.1 19.1 20.4
South-Eastern Asia and the Pacific 24.5 22.0 35.8 36.2 17.6 20.2
Southern Asia 46.8 51.8 21.2 16.4 3.1 2.6
Eastern Europe 3.1 3.1 29.0 29.7 64.4 64.6
Central and Western Asia 6.8 5.5 45.8 51.2 36.9 31.9
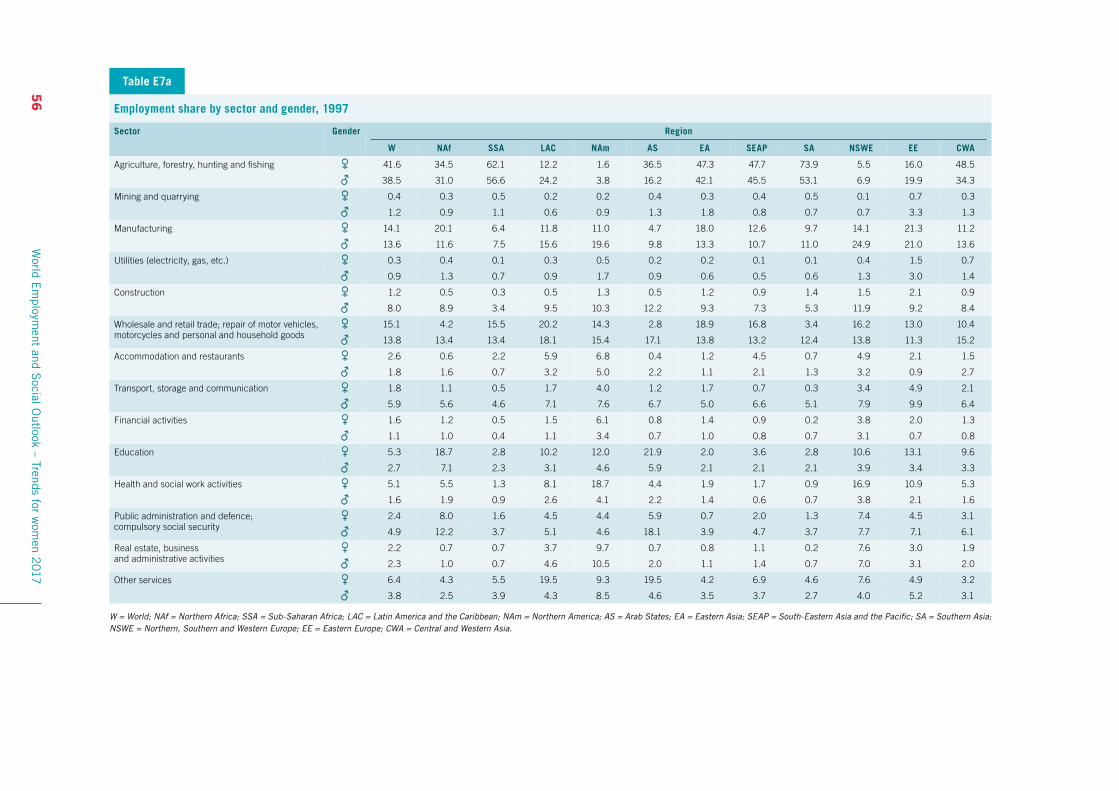
56
W
orld Em
ployment and S
ocial Outlook – Trends for w
omen 2
017
Table E7a
Employment share by sector and gender, 1997
Sector Gender Region
W NAf SSA LAC NAm AS EA SEAP SA NSWE EE CWA
Agriculture, forestry, hunting and fishing 41.6 34.5 62.1 12.2 1.6 36.5 47.3 47.7 73.9 5.5 16.0 48.5
38.5 31.0 56.6 24.2 3.8 16.2 42.1 45.5 53.1 6.9 19.9 34.3
Mining and quarrying 0.4 0.3 0.5 0.2 0.2 0.4 0.3 0.4 0.5 0.1 0.7 0.3
1.2 0.9 1.1 0.6 0.9 1.3 1.8 0.8 0.7 0.7 3.3 1.3
Manufacturing 14.1 20.1 6.4 11.8 11.0 4.7 18.0 12.6 9.7 14.1 21.3 11.2
13.6 11.6 7.5 15.6 19.6 9.8 13.3 10.7 11.0 24.9 21.0 13.6
Utilities (electricity, gas, etc.) 0.3 0.4 0.1 0.3 0.5 0.2 0.2 0.1 0.1 0.4 1.5 0.7
0.9 1.3 0.7 0.9 1.7 0.9 0.6 0.5 0.6 1.3 3.0 1.4
Construction 1.2 0.5 0.3 0.5 1.3 0.5 1.2 0.9 1.4 1.5 2.1 0.9
8.0 8.9 3.4 9.5 10.3 12.2 9.3 7.3 5.3 11.9 9.2 8.4
Wholesale and retail trade; repair of motor vehicles, 15.1 4.2 15.5 20.2 14.3 2.8 18.9 16.8 3.4 16.2 13.0 10.4motorcycles and personal and household goods 13.8 13.4 13.4 18.1 15.4 17.1 13.8 13.2 12.4 13.8 11.3 15.2
Accommodation and restaurants 2.6 0.6 2.2 5.9 6.8 0.4 1.2 4.5 0.7 4.9 2.1 1.5
1.8 1.6 0.7 3.2 5.0 2.2 1.1 2.1 1.3 3.2 0.9 2.7
Transport, storage and communication 1.8 1.1 0.5 1.7 4.0 1.2 1.7 0.7 0.3 3.4 4.9 2.1
5.9 5.6 4.6 7.1 7.6 6.7 5.0 6.6 5.1 7.9 9.9 6.4
Financial activities 1.6 1.2 0.5 1.5 6.1 0.8 1.4 0.9 0.2 3.8 2.0 1.3
1.1 1.0 0.4 1.1 3.4 0.7 1.0 0.8 0.7 3.1 0.7 0.8
Education 5.3 18.7 2.8 10.2 12.0 21.9 2.0 3.6 2.8 10.6 13.1 9.6
2.7 7.1 2.3 3.1 4.6 5.9 2.1 2.1 2.1 3.9 3.4 3.3
Health and social work activities 5.1 5.5 1.3 8.1 18.7 4.4 1.9 1.7 0.9 16.9 10.9 5.3
1.6 1.9 0.9 2.6 4.1 2.2 1.4 0.6 0.7 3.8 2.1 1.6
Public administration and defence; 2.4 8.0 1.6 4.5 4.4 5.9 0.7 2.0 1.3 7.4 4.5 3.1compulsory social security 4.9 12.2 3.7 5.1 4.6 18.1 3.9 4.7 3.7 7.7 7.1 6.1
Real estate, business 2.2 0.7 0.7 3.7 9.7 0.7 0.8 1.1 0.2 7.6 3.0 1.9and administrative activities 2.3 1.0 0.7 4.6 10.5 2.0 1.1 1.4 0.7 7.0 3.1 2.0
Other services 6.4 4.3 5.5 19.5 9.3 19.5 4.2 6.9 4.6 7.6 4.9 3.2
3.8 2.5 3.9 4.3 8.5 4.6 3.5 3.7 2.7 4.0 5.2 3.1
W = World; NAf = Northern Africa; SSA = Sub-Saharan Africa; LAC = Latin America and the Caribbean; NAm = Northern America; AS = Arab States; EA = Eastern Asia; SEAP = South-Eastern Asia and the Pacific; SA = Southern Asia; NSWE = Northern, Southern and Western Europe; EE = Eastern Europe; CWA = Central and Western Asia.

Appendix D
. Decom
posing gender gaps in employm
ent relationships 57
Table E7b
Employment share by sector and gender, 2007
Sector Gender Region
W NAf SSA LAC NAm AS EA SEAP SA NSWE EE CWA
Agriculture, forestry, hunting and fishing 36.5 33.0 61.7 9.3 0.8 19.4 39.3 40.7 67.6 3.4 12.5 36.8
32.5 27.9 57.0 20.2 2.1 10.8 31.3 40.1 45.2 5.1 14.4 25.3
Mining and quarrying 0.3 0.3 0.6 0.1 0.2 0.5 0.3 0.3 0.4 0.1 0.6 0.3
1.0 0.9 1.2 0.7 1.0 1.6 1.3 0.9 0.7 0.5 3.0 1.3
Manufacturing 12.4 16.3 5.0 12.5 7.1 4.8 14.9 13.5 12.7 10.9 17.5 11.5
12.9 10.2 6.4 15.1 14.5 8.9 12.6 10.9 12.2 21.8 19.8 14.5
Utilities (electricity, gas, etc.) 0.4 0.5 0.2 0.2 0.4 0.3 0.4 0.2 0.1 0.4 1.6 0.8
0.8 1.2 0.8 0.8 1.1 1.1 0.7 0.4 0.5 1.1 3.1 1.4
Construction 1.6 0.6 0.4 0.6 1.7 0.8 2.0 0.8 2.5 1.5 2.0 1.5
10.7 12.4 4.3 11.7 13.0 15.1 13.4 8.4 8.7 13.5 11.5 10.2
Wholesale and retail trade; repair of motor vehicles, 17.0 4.5 15.9 21.3 14.0 4.6 22.9 19.6 4.1 15.6 16.6 13.3motorcycles and personal and household goods 15.0 14.1 13.0 18.2 14.7 18.0 16.6 14.4 13.7 13.6 13.2 16.3
Accommodation and restaurants 2.9 0.8 1.8 6.3 7.4 0.8 1.6 3.5 1.1 5.5 3.0 2.5
2.2 2.1 0.7 3.3 5.6 3.0 2.0 1.7 1.7 3.7 1.2 3.5
Transport, storage and communication 2.1 1.3 0.6 2.2 4.1 1.7 2.4 1.1 0.5 3.5 4.7 2.5
7.0 6.7 5.2 8.1 8.4 7.4 6.0 7.8 6.7 8.1 10.9 7.6
Financial activities 1.9 1.4 0.5 1.5 6.2 1.2 2.0 1.2 0.4 3.6 2.5 1.5
1.3 0.9 0.4 1.1 3.7 1.0 1.4 1.2 0.9 2.9 1.1 0.9
Education 6.1 19.6 3.2 9.6 12.5 27.0 3.1 4.4 3.9 10.9 13.2 11.6
2.9 6.2 2.5 3.1 5.0 5.6 2.6 2.1 2.4 3.8 3.4 3.6
Health and social work activities 5.9 6.8 1.6 8.4 20.3 6.8 3.3 2.3 1.3 18.3 11.2 6.2
1.9 1.7 1.1 2.5 4.6 2.3 2.2 0.7 0.8 4.1 2.3 1.6
Public administration and defence; 2.6 8.5 1.5 4.4 4.5 6.8 1.1 2.4 0.9 7.3 5.1 3.8compulsory social security 4.6 11.3 3.4 5.2 4.7 15.0 4.2 4.9 2.6 7.1 7.3 6.6
Real estate, business 3.1 1.2 0.9 5.0 11.8 2.0 1.2 1.8 0.4 10.4 5.3 3.6and administrative activities 3.3 1.7 1.0 5.9 13.3 3.8 1.6 2.3 1.4 10.2 6.3 3.5
Other services 7.2 5.1 6.0 18.7 9.1 23.5 5.5 8.1 4.2 8.6 4.2 4.0
3.8 2.8 3.0 4.1 8.2 6.3 4.1 4.1 2.6 4.4 2.7 3.5
W = World; NAf = Northern Africa; SSA = Sub-Saharan Africa; LAC = Latin America and the Caribbean; NAm = Northern America; AS = Arab States; EA = Eastern Asia; SEAP = South-Eastern Asia and the Pacific; SA = Southern Asia; NSWE = Northern, Southern and Western Europe; EE = Eastern Europe; CWA = Central and Western Asia.
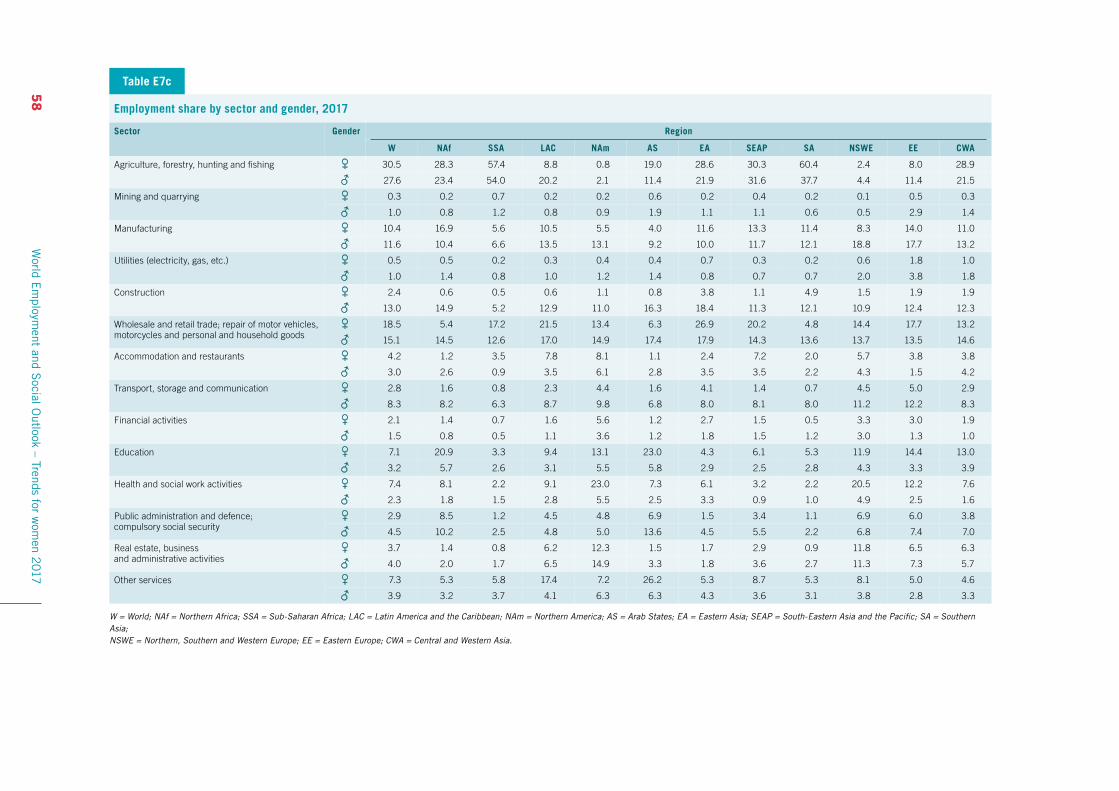
58
W
orld Em
ployment and S
ocial Outlook – Trends for w
omen 2
017
Table E7c
Employment share by sector and gender, 2017
Sector Gender Region
W NAf SSA LAC NAm AS EA SEAP SA NSWE EE CWA
Agriculture, forestry, hunting and fishing 30.5 28.3 57.4 8.8 0.8 19.0 28.6 30.3 60.4 2.4 8.0 28.9
27.6 23.4 54.0 20.2 2.1 11.4 21.9 31.6 37.7 4.4 11.4 21.5
Mining and quarrying 0.3 0.2 0.7 0.2 0.2 0.6 0.2 0.4 0.2 0.1 0.5 0.3
1.0 0.8 1.2 0.8 0.9 1.9 1.1 1.1 0.6 0.5 2.9 1.4
Manufacturing 10.4 16.9 5.6 10.5 5.5 4.0 11.6 13.3 11.4 8.3 14.0 11.0
11.6 10.4 6.6 13.5 13.1 9.2 10.0 11.7 12.1 18.8 17.7 13.2
Utilities (electricity, gas, etc.) 0.5 0.5 0.2 0.3 0.4 0.4 0.7 0.3 0.2 0.6 1.8 1.0
1.0 1.4 0.8 1.0 1.2 1.4 0.8 0.7 0.7 2.0 3.8 1.8
Construction 2.4 0.6 0.5 0.6 1.1 0.8 3.8 1.1 4.9 1.5 1.9 1.9
13.0 14.9 5.2 12.9 11.0 16.3 18.4 11.3 12.1 10.9 12.4 12.3
Wholesale and retail trade; repair of motor vehicles, 18.5 5.4 17.2 21.5 13.4 6.3 26.9 20.2 4.8 14.4 17.7 13.2motorcycles and personal and household goods 15.1 14.5 12.6 17.0 14.9 17.4 17.9 14.3 13.6 13.7 13.5 14.6
Accommodation and restaurants 4.2 1.2 3.5 7.8 8.1 1.1 2.4 7.2 2.0 5.7 3.8 3.8
3.0 2.6 0.9 3.5 6.1 2.8 3.5 3.5 2.2 4.3 1.5 4.2
Transport, storage and communication 2.8 1.6 0.8 2.3 4.4 1.6 4.1 1.4 0.7 4.5 5.0 2.9
8.3 8.2 6.3 8.7 9.8 6.8 8.0 8.1 8.0 11.2 12.2 8.3
Financial activities 2.1 1.4 0.7 1.6 5.6 1.2 2.7 1.5 0.5 3.3 3.0 1.9
1.5 0.8 0.5 1.1 3.6 1.2 1.8 1.5 1.2 3.0 1.3 1.0
Education 7.1 20.9 3.3 9.4 13.1 23.0 4.3 6.1 5.3 11.9 14.4 13.0
3.2 5.7 2.6 3.1 5.5 5.8 2.9 2.5 2.8 4.3 3.3 3.9
Health and social work activities 7.4 8.1 2.2 9.1 23.0 7.3 6.1 3.2 2.2 20.5 12.2 7.6
2.3 1.8 1.5 2.8 5.5 2.5 3.3 0.9 1.0 4.9 2.5 1.6
Public administration and defence; 2.9 8.5 1.2 4.5 4.8 6.9 1.5 3.4 1.1 6.9 6.0 3.8compulsory social security 4.5 10.2 2.5 4.8 5.0 13.6 4.5 5.5 2.2 6.8 7.4 7.0
Real estate, business 3.7 1.4 0.8 6.2 12.3 1.5 1.7 2.9 0.9 11.8 6.5 6.3and administrative activities 4.0 2.0 1.7 6.5 14.9 3.3 1.8 3.6 2.7 11.3 7.3 5.7
Other services 7.3 5.3 5.8 17.4 7.2 26.2 5.3 8.7 5.3 8.1 5.0 4.6
3.9 3.2 3.7 4.1 6.3 6.3 4.3 3.6 3.1 3.8 2.8 3.3
W = World; NAf = Northern Africa; SSA = Sub-Saharan Africa; LAC = Latin America and the Caribbean; NAm = Northern America; AS = Arab States; EA = Eastern Asia; SEAP = South-Eastern Asia and the Pacific; SA = Southern Asia; NSWE = Northern, Southern and Western Europe; EE = Eastern Europe; CWA = Central and Western Asia.

Appendix D. Decomposing gender gaps in employment relationships 59
Table E8
Occupation share by gender, 2015
Occupations Emerging countries Developed countries
Armed forces occupations 0.3 0.0 0.4 0.1
Managers 5.0 2.4 9.5 7.1
Professionals 5.7 9.5 14.1 19.7
Technicians and associate professionals 3.1 4.0 11.2 12.8
Clerical support workers 3.7 4.8 7.1 17.6
Services and sales workers 10.5 16.3 16.4 27.1
Skilled agricultural, forestry and fishery workers 36.3 41.9 3.0 1.4
Craft and related trades workers 17.5 9.1 20.3 3.1
Plant and machine operators and assemblers 6.7 1.9 11.4 2.8
Elementary occupations 10.4 9.7 6.1 8.2
Not elsewhere classified 0.7 0.4 0.4 0.3

WESO_Women_2017_int.indd 60WESO_Women_2017_int.indd 60 23.06.17 10:1823.06.17 10:18

References 61
References
Attanasio, O; Low, H.; Sánchez-Marcos, V. 2005. “Female labour supply as insurance against idiosyncratic risk”, in Journal of the European Economic Association, Vol. 3, No. 2/3, pp. 755–764.
Badgett, M.V.L; Folbre, N. 1999. “Assigning care: Gender norms and economic outcomes”, in International Labour Review, Vol. 138, No. 3, pp. 311–326.
Bardhan, P.K. 1984. Land, labor, and rural poverty: Essays in development economics (New Delhi and New York, Oxford University Press).
Bhalotra, S.; Umaña-Aponte, M. 2010. The dynamics of women’s labour supply in developing countries, IZA Discussion Paper No. 4879 (Bonn, Institute for the Study of Labor (IZA)).
—; —. 2012. Women’s labour supply and household insurance in Africa, WIDER Working Paper, No. 66 (Helsinki, United Nations University, World Institute for Development Economics Research (UNU-WIDER)).
Blau, F.D.; Kahn, L.M. 2016. The gender wage gap: Extent, trends, and explanations, IZA Discussion Paper No. 9656 (Bonn, Institute for the Study of Labor (IZA)).
Budig, M.J.; England, P. 2001. “The wage penalty for motherhood”, in American Sociological Review, Vol. 66, No. 2, pp. 204–225.
Cassirer, N.; Addati, L. 2007. Expanding women’s employment opportunities: Informal economy workers and the need for childcare, paper presented at the Interregional Symposium on the Informal Economy – Enabling transition to formalization, ILO, Geneva, 27–29 Nov.
England P.; Folbre, N. 1999. “The cost of caring”, in Annals of the American Academy of Political and Social Science, Vol. 561, pp. 39–51.
European Commission (EC). 2009. Gender segregation in the labour market: Root causes, implications and policy responses in the EU (Luxembourg).
—. 2015. Secondary earners and fiscal policies in Europe (Luxembourg).
Eurostat. 2017. In-work at-risk-of-poverty rate by household type – EU-SILC survey, European Union Statistics on Income and Living Conditions (EU-SILC). Available at: http://appsso.eurostat.ec.europa.eu/nui/show.do?dataset=ilc_iw02&lang=en [Apr. 2017].
Gallup; International Labour Office (ILO). 2017. Towards a better future for women and work: Voices of women and men (Geneva and Washington).
Gangl, M.; Ziefle, A. 2015. “The making of a good woman: Extended parental leave entitlements and mothers’ work commitment in Germany”, in American Journal of Sociology, Vol. 121, No. 2, pp. 511–563.
Goldin, C. 1995. “The U-shaped female labor force function in economic development and economic history,” in T.P. Schultz (ed.): Investment in women’s human capital and economic development (Chicago, University of Chicago Press), pp. 61–90.
—. 2014. “A grand gender convergence: Its last chapter”, in American Economic Review, Vol. 104, No. 4, pp. 1091–1119.
Group of Twenty (G20). 2014. G20 Leaders’ Communiqué, 2014 Brisbane Summit, Brisbane 15–16 Nov.

62 World Employment and Social Outlook – Trends for women 2017
Haas, L.; Rostgaard, T. 2011. “Fathers’ rights to paid parental leave in the Nordic countries: Consequences for the gendered division of leave”, in Community, Work and Family, Vol. 14, No. 2, pp. 177–195.
Hepple, B. 2001. “Equality and empowerment for decent work”, in International Labour Review, Vol. 140, No. 1, pp. 5–18.
Hook, J.L. 2010. “Gender inequality in the welfare state: Sex segregation in housework, 1965–2003”, in American Journal of Sociology, Vol. 115, No. 5, pp. 1480–1523.
Iceland, Government of. 2016. Jafnlaunastaðall [Equal pay standard] (Reykjavik, Ministry of Welfare). Available at: https://www.velferdarraduneyti.is/jafnlaunastadall/ [May 2017].
International Labour Office (ILO). 2008. ILO strategy on promoting women’s entrepreneurship development, Governing Body, Committee on Employment and Social Policy, GB.301/ESP/4, 301st Session, Mar., Geneva, 2008 (Geneva).
—. 2012. Global Employment Trends for Women 2012 (Geneva).
—. 2013. The informal economy and decent work: A policy resource guide. Supporting transitions to formality (Geneva).
—. 2014. Maternity and paternity at work: Law and practice across the world (Geneva).
—. 2015. Assessment of labour provisions in trade and investment arrangements (Geneva).
—. 2016a. Women at Work: Trends 2016 (Geneva).
—. 2016b. Global Wage Report 2016/17: Wage inequality in the workplace (Geneva).
—. 2016c. Encouraging women entrepreneurs for jobs and development, Women’s Entrepreneurship Development Programme (Geneva).
—. 2016d. Closing the gender pay gap: A review of the issues, policy mechanisms and international evidence (Geneva).
—. 2016e. Labour relations and collective bargaining: Negotiating for gender equality, Issue Brief No. 4 (Geneva)
—. 2017a. World Employment and Social Outlook: Trends 2017 (Geneva).
—. 2017b. Ending violence and harassment against women and men in the world of work, Report V(1), International Labour Conference, 107th Session, Geneva, 2018 (Geneva).
International Trade Union Confederation (ITUC). 2007. Action programme on achieving gender equality in trade unions (Brussels).
—. 2016. Labour Rights for Women campaign: Global evaluation report (Brussels).
Jaumotte, F. 2003. Female labour force participation: past trends and main determinants in OECD Countries, OECD Economics Department Working Paper No. 376 (Paris, OECD).
Kabeer, N. 2005. “Gender equality and women’s empowerment: A critical analysis of the third millennium development goal”, in Gender and Development, Vol. 13, No. 1, pp. 13–24.
Kapsos, S.; Silberman, A.; Bourmpoula, E. 2014. Why is female labour force participation declining so sharply in India?, ILO Research Paper No. 10 (Geneva, ILO).
Klasen, S.; Pieters, J. 2012. Push or pull? Drivers of female labor force participation during India’s economic boom, IZA Discussion Paper No. 6395 (Bonn, Institute for the Study of Labor (IZA)).
Mammen, K.; Paxson, C. 2000. “Women’s work and economic development”, in Journal of Economic Perspectives, Vol. 14, No. 4, pp. 141–164.
Moussié, R. 2017. Women informal workers mobilizing for child care (Women in Informal Employment: Globalizing and Organizing (WIEGO)).
Nussbaum, M.C. 2011. Creating capabilities: The human development approach (Cambridge, MA, and London, Harvard University Press).
Pastore, F.; Tenaglia, S. 2013. Ora et non labora? A test of the impact of religion on female labour supply, IZA Discussion Paper No. 7356 (Bonn, Institute for the Study of Labor (IZA)).
Sen, A.K. 1990. “Gender and cooperative conflict”, in I. Tinker (ed.): Persistent Inequalities (New York, Oxford University Press), pp. 123–149.

References 63
—. 1995. “Agency and well-being: The development agenda”, in N. Heyzer, S. Kapoor and J. Sandler (eds): A commitment to the world’s women: Perspectives on development for Beijing and beyond (New York, United Nations Development Fund for Women (UNIFEM)).
—. 2001. Development as freedom (New York, Oxford University Press).
Sjöberg, O. 2004. “The role of family policy institutions in explaining gender-role attitudes: A comparative multilevel analysis of thirteen industrialized countries”, in Journal of European Social Policy, Vol. 14, No. 2, pp. 107–123.
Stotsky, J.G. 1996. Gender bias in tax systems, IMF Working Paper No. 99 (Washington, DC, International Monetary Fund (IMF)).
—. 2016. Gender budgeting: Fiscal context and current outcomes, IMF Working Paper No. 149 (Washington, DC, IMF).
Tansel, A. 2001. Economic development and female labor force participation in Turkey: Time-series evidence and cross-province estimates, ERC Working Papers in Economics No. 5, Economic Research Centre (ERC) (Ankara, Middle East Technical University).
United Kingdom, Government of. 2017. Gender pay gap reporting goes live (Manchester, Government Equalities Office). Available at: https://www.gov.uk/government/news/gender-pay-gap-reporting-goes-live [May 2017].
United Nations Secretary-General’s High-Level Panel on Women’s Economic Empowerment (UNHLP). 2016. Leave no one behind: A call to action for gender equality and women’s economic empowerment (New York).
—. 2017. Recognizing, reducing and redistributing unpaid work and care, Driver 3 Working Group Paper (New York).
U.S. Bureau of Labor Statistics (BLS). 2017. A profile of the working poor, 2015, BLS Report No. 1068 (Washington, DC, United States Department of Labor).
Weichselbaumer, D.; Winter-Ebmer, R. 2003. A meta-analysis of the international gender wage gap, Economics Working Paper No. 11, Department of Economics (Linz-Auhof, Johannes Kepler University).

WESO_Women_2017_int.indd 64WESO_Women_2017_int.indd 64 23.06.17 10:1823.06.17 10:18