world cultures. satellite view of china china’s provinces
TRANSCRIPT

World Cultures World Cultures World Cultures World Cultures

Satellite View of ChinaSatellite View of ChinaSatellite View of ChinaSatellite View of China

China’s ProvincesChina’s ProvincesChina’s ProvincesChina’s Provinces

China—Asia’s China—Asia’s SuperpowerSuperpower
China—Asia’s China—Asia’s SuperpowerSuperpower

China vs. the U. S. in China vs. the U. S. in SizeSize
China vs. the U. S. in China vs. the U. S. in SizeSize
0 500 1,000 1,500 2,000250Miles
China
United States
SOURCE: Topic 5: “The Awakening Giant” by Dr. Jean-Paul Rodrigue, Dept. of Economics & Geography, Hofstra University.

Comparing China & Comparing China & the U. S.the U. S.
Comparing China & Comparing China & the U. S.the U. S.
ChinaChina United United StatesStates
SizeSize 3.7 million 3.7 million square milessquare miles
3.6 million 3.6 million square milessquare miles
Main physical Main physical barrierbarrier
HimalayasHimalayas RockiesRockies
Main RiverMain River Yangtze / Yangtze / East - WestEast - West
Mississippi / Mississippi / North – SouthNorth – South
PopulationPopulation East CoastEast Coast East CoastEast Coast
Connectivity Connectivity problemsproblems
North - SouthNorth - South East - WestEast - West

Countries & RegionsCountries & RegionsCountries & RegionsCountries & Regions
Tibet
Mongolia
Southeast Asia
Indian Subcontine
nt
Russia
N. Korea
S> Korea
Taiwan
Philippines

CitiesCitiesCitiesCities
BEIJING
Harbin
Nanjing
Guangzhou
Xi’anShanghai
Taipei
Lhasa
HongKongMaca
o

Completed Political Completed Political MapMap
Completed Political Completed Political MapMap
BEIJING
Harbin
Nanjing
Guangzhou
Xi’anShanghai
Taipei
Lhasa
HongKongMaca
o
Tibet
Mongolia
Southeast Asia
Indian Subcontine
nt
N. Korea
S> Korea
Taiwan
Philippines
JapanJapan

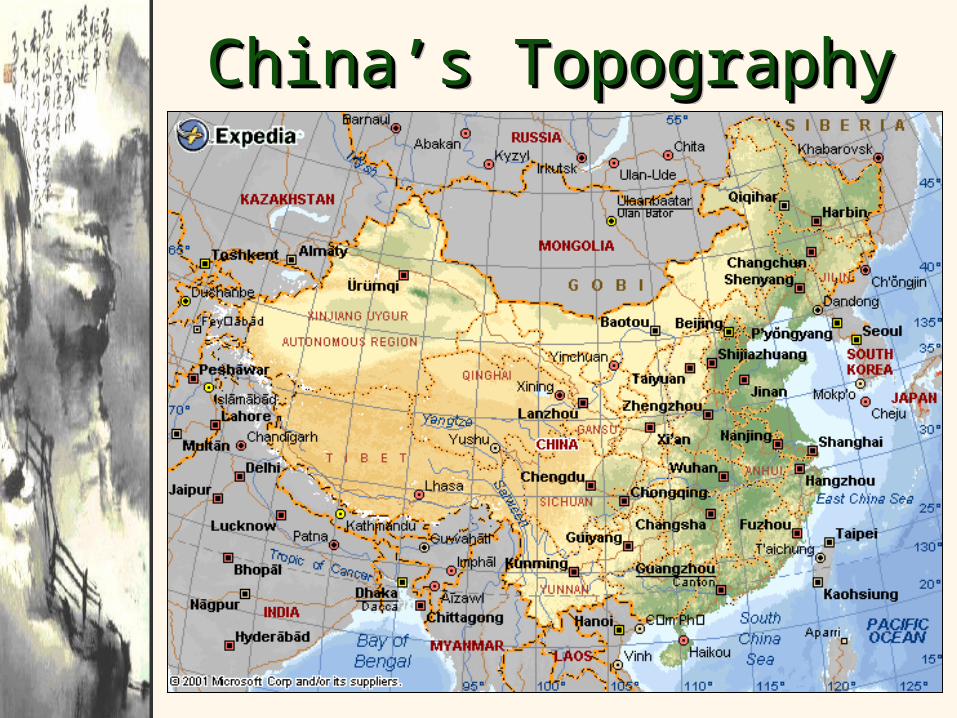
China’s TopographyChina’s TopographyChina’s TopographyChina’s Topography

Percentages of Percentages of Different LandformsDifferent Landforms
Percentages of Percentages of Different LandformsDifferent Landforms

Mountains & PeaksMountains & PeaksMountains & PeaksMountains & Peaks
Tian Shan
Altai Mts. Greater Khingan
Kunlun Mountains
Himalayan Mts.
Qiuling Shandi MtsQiuling Shandi Mts

The Great Wall of The Great Wall of ChinaChina
The Great Wall of The Great Wall of ChinaChina

Deserts & PlateausDeserts & PlateausDeserts & PlateausDeserts & Plateaus
Tibetan Plateau
Taklamakan Desert
Gobi Desert
Mongolian PlateauMongolian Plateau

Valleys / Plains / Valleys / Plains / BasinsBasins
Valleys / Plains / Valleys / Plains / BasinsBasins
Manchurian Plain
North China PlainTarim
Basin
Sichuan Basin

North China PlainNorth China PlainNorth China PlainNorth China Plain

Pacific “Rim of Fire”Pacific “Rim of Fire”Pacific “Rim of Fire”Pacific “Rim of Fire”
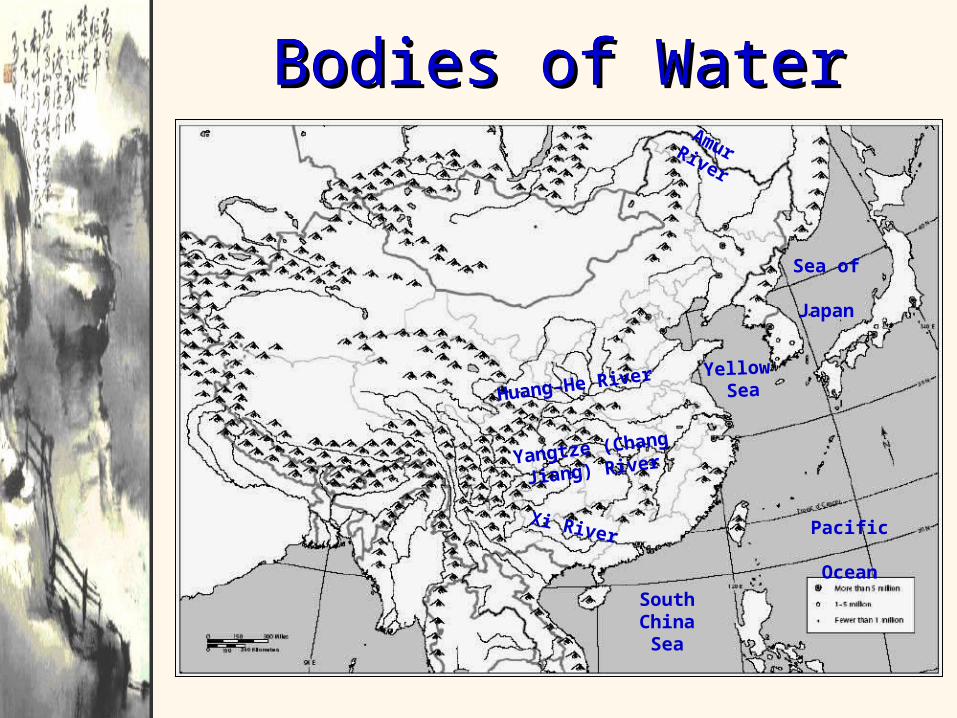
Bodies of WaterBodies of WaterBodies of WaterBodies of Water
Huang-He
River
Yellow Sea
Yangtze
(Chang Jiang)
River
Pacific Ocean
Amur River
Xi River
SouthChinaSea
Sea of
Japan

The Polluted Yellow The Polluted Yellow River!River!
The Polluted Yellow The Polluted Yellow River!River!

The Yangtze RiverThe Yangtze RiverThe Yangtze RiverThe Yangtze River

Three Gorges Dam
• Chang Jiang River
• Finished Oct 2008

Agricultural Regions in Agricultural Regions in ChinaChina
Agricultural Regions in Agricultural Regions in ChinaChina
Shabdong PeninsulaGrand
Canal
Great Wall
CHUNG CHUNG KUOKUO

Completed Completed Topographic MapTopographic Map
Completed Completed Topographic MapTopographic Map
Huang-He
RiverYellow
Sea
Yangtze River
Pacific Ocean
Amur River
Xi River
SouthChinaSea
Sea of
Japan
Tian Shan
Altai Mts. Greater Khingan
Kunlun Shan
Himalayan Mts.
Tibetan Plateau
Taklamakan Desert
Gobi Desert
Manchurian Plain
North China PlainTarim
Basin
Sichuan Basin
Shabdong PeninsulaGrand
Canal
Great Wall
CHUNG CHUNG KUOKUO


China’s Climate ZonesChina’s Climate ZonesChina’s Climate ZonesChina’s Climate Zones

Monsoon Precipitation Monsoon Precipitation PatternsPatterns
Monsoon Precipitation Monsoon Precipitation PatternsPatterns

Winter MonsoonsWinter MonsoonsWinter MonsoonsWinter Monsoons

Summer MonsoonsSummer MonsoonsSummer MonsoonsSummer Monsoons

Precipitation in ChinaPrecipitation in ChinaPrecipitation in ChinaPrecipitation in China

Summer RainfallSummer RainfallSummer RainfallSummer Rainfall


Agricultural Regions in Agricultural Regions in ChinaChina
Agricultural Regions in Agricultural Regions in ChinaChina

Arable LandArable LandArable LandArable Land

““Brown” China vs. “Green” ChinaBrown” China vs. “Green” China““Brown” China vs. “Green” ChinaBrown” China vs. “Green” China
Rice DominantW
heat
Dom
inan
t
Pasture and Oasis
Double-crop rice
SOURCE: Topic 5: “The Awakening Giant” by Dr. Jean-Paul Rodrigue, Dept. of Economics & Geography, Hofstra University.

South ChinaSouth ChinaSouth ChinaSouth China


Major Chinese IndustriesMajor Chinese IndustriesMajor Chinese IndustriesMajor Chinese Industries

Fuels, Power, Minerals, & Metals in Fuels, Power, Minerals, & Metals in ChinaChinaFuels, Power, Minerals, & Metals in Fuels, Power, Minerals, & Metals in ChinaChina


China as % of World China as % of World PopulationPopulation
China as % of World China as % of World PopulationPopulation

Top 10 Populated Top 10 Populated NationsNations
Top 10 Populated Top 10 Populated NationsNations
0 500 1000 1500
China
India
US
Indonesia
Brazil
Russia
Pakistan
Bangladesh
Japan
Nigeria
0 500 1000 1500
India
China
US
Pakistan
Indonesia
Nigeria
Bangladesh
Brazil
Congo
Ethiopia
2001 2050

The Population of The Population of ChinaChina
The Population of The Population of ChinaChina
105 755 10831210
1381 15621650 1753
18121851
18871911
19491953
1970
1981
1995
2000
2050
2
0
200
400
600
800
1000
1200
1400
1600
0 500 1000 1500 2000
thousands
1,330,044,544 July 2008 est1,330,044,544 July 2008 est
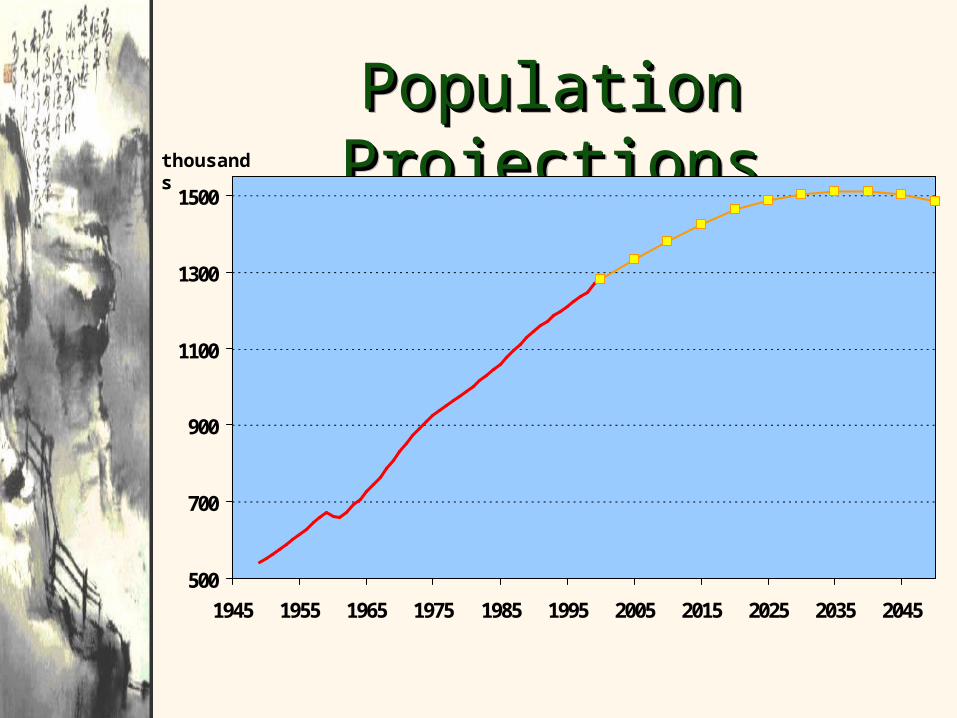
Population ProjectionsPopulation ProjectionsPopulation ProjectionsPopulation Projections
500
700
900
1100
1300
1500
1945 1955 1965 1975 1985 1995 2005 2015 2025 2035 2045
thousands
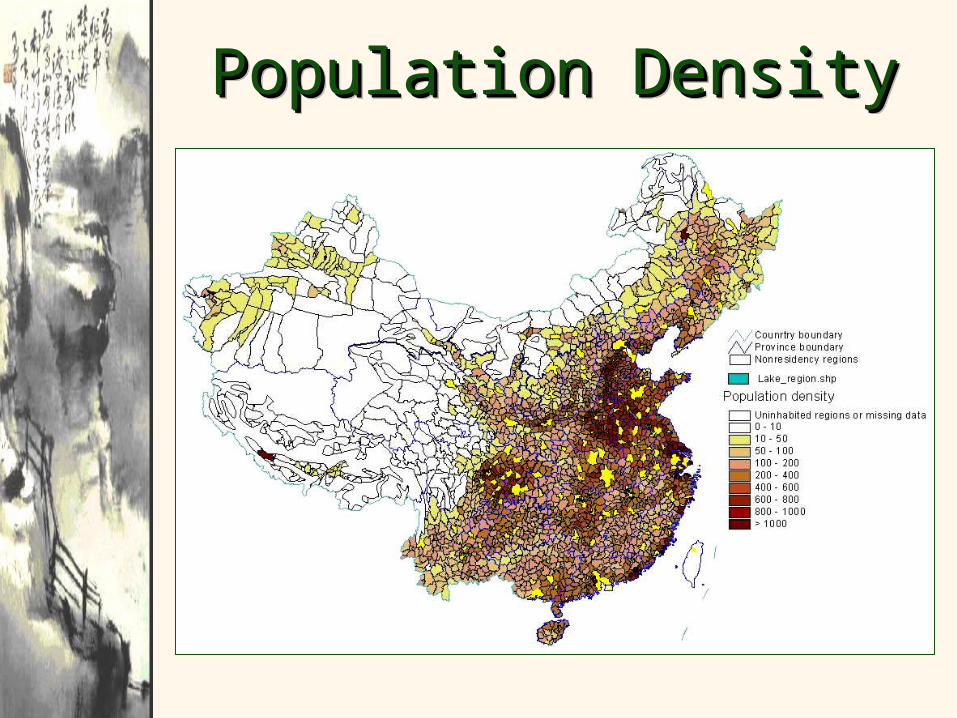
Population DensityPopulation DensityPopulation DensityPopulation Density

Male/Female Birth Male/Female Birth PopulationPopulation
Male/Female Birth Male/Female Birth PopulationPopulationSex Ratio:
•at birth: 1.11 male(s)/female
•under 15 years: 1.13 male(s)/female
•15-64 years: 1.06 male(s)/female
•65 years and over: 0.91 male(s)/female
•total population: 1.06 male(s)/female (2008 est.)
Sex Ratio:
•at birth: 1.11 male(s)/female
•under 15 years: 1.13 male(s)/female
•15-64 years: 1.06 male(s)/female
•65 years and over: 0.91 male(s)/female
•total population: 1.06 male(s)/female (2008 est.)

Life Expectancy at Birth by Life Expectancy at Birth by SexSex
Life Expectancy at Birth by Life Expectancy at Birth by SexSextotal population:
73.18 years male: 71.37 years female: 75.18 years (2008 est.)
total population: 73.18 years male: 71.37 years female: 75.18 years (2008 est.)

Infant Mortality RateInfant Mortality RateInfant Mortality RateInfant Mortality Rate•total: 21.16 deaths/1,000 live births
•male: 19.43 deaths/1,000 live births
•female: 23.08 deaths/1,000 live births (2008 est.)
•total: 21.16 deaths/1,000 live births
•male: 19.43 deaths/1,000 live births
•female: 23.08 deaths/1,000 live births (2008 est.)

Main Chinese NationalitiesMain Chinese NationalitiesMain Chinese NationalitiesMain Chinese Nationalities•Han Chinese
*91.5%
•Zhuang
•Manchu
•Hui
•Miao
•Uyghur
•Tujia
•Yi
•Mongol
•Tibetan
•Buyi
•Han Chinese
*91.5%
•Zhuang
•Manchu
•Hui
•Miao
•Uyghur
•Tujia
•Yi
•Mongol
•Tibetan
•Buyi
•Dong
•Yao
•Korean
•other nationalities 8.5% (2000 census)
•Dong
•Yao
•Korean
•other nationalities 8.5% (2000 census)

Ethno-Linguistic Ethno-Linguistic Groups in ChinaGroups in ChinaEthno-Linguistic Ethno-Linguistic Groups in ChinaGroups in China

Total PopulationTotal Population
with No Educationwith No Education
Total PopulationTotal Population
with No Educationwith No Education

Literacy: definition: age 15 and over can read and write total population: 90.9% male: 95.1% female: 86.5% (2000 census)
Literacy: definition: age 15 and over can read and write total population: 90.9% male: 95.1% female: 86.5% (2000 census)
School life expectancy (primary to tertiary education): total: 11 years male: 11 years female: 11 years (2006)
School life expectancy (primary to tertiary education): total: 11 years male: 11 years female: 11 years (2006)

is a term used to describe a force regarded as unstoppable, that will crush all in its path.
is a term used to describe a force regarded as unstoppable, that will crush all in its path.

Monthly Value of Monthly Value of Imports & ExportsImports & ExportsMonthly Value of Monthly Value of Imports & ExportsImports & Exports
20020044

Total Carbon Total Carbon EmissionsEmissions
[in millions of tons][in millions of tons]
Total Carbon Total Carbon EmissionsEmissions
[in millions of tons][in millions of tons]
0 10,000 20,000 30,000 40,000 50,000 60,000 70,000 80,000 90,000
United States
Russia
Germany
China
United Kingdom
Japan
France
Ukraine
Canada
Poland
India
Italy