world bank documentdocuments.worldbank.org/curated/en/984031468322471673/pdf/805160pub0... · the...
TRANSCRIPT

THE WORLD BANKECONOMIC REVIEW
SYMPOSIUM ISSUE ON INTERNATIONAL MIGRATION
AND DEVELOPMENT
Five Questions on International Migration and DevelopmentCaglar Ozden, Hillel Rapoport, and Maurice Schiff
Part I. International Migration Where on Earth is Everybody? The Evolution of
Global Bilateral Migration 1960–2000Caglar Ozden, Christopher R. Parsons, Maurice Schiff,
and Terrie L. Walmsley
Immigration Policies and the Ecuadorian ExodusSimone Bertoli, Jesús Fernández-Huertas Moraga, and
Francesc Ortega
Do Migrants Improve Governance at Home? Evidence from a Voting Experiment
Catia Batista and Pedro C. Vicente
Part II. International RemittancesWhat Explains the Price of Remittances? An Examination
Across 119 Country CorridorsThorsten Beck and María Soledad Martínez Pería
Remittances and the Brain Drain Revisited: The MicrodataShow That More Educated Migrants Remit MoreAlbert Bollard, David McKenzie, Melanie Morten,
and Hillel Rapoport
Volume 25 • 2011 • Number 1
www.wber.oxfordjournals.org
THE WORLD BANK1818 H Street, NWWashington, DC 20433, USAWorld Wide Web: http://www.worldbank.org/E-mail: [email protected]
2V
olume 25 • N
umber 1 • 2011
TH
E W
OR
LD
BA
NK
EC
ON
OM
IC R
EV
IEW
Pages 1–156
ISSN 0258-6770 (PRINT) ISSN 1564-698X (ONLINE)
Wber.j_25_1_Cover.qxd 6/7/11 5:55 PM Page 1
Pub
lic D
iscl
osur
e A
utho
rized
Pub
lic D
iscl
osur
e A
utho
rized
Pub
lic D
iscl
osur
e A
utho
rized
Pub
lic D
iscl
osur
e A
utho
rized
Pub
lic D
iscl
osur
e A
utho
rized
Pub
lic D
iscl
osur
e A
utho
rized
Pub
lic D
iscl
osur
e A
utho
rized
Pub
lic D
iscl
osur
e A
utho
rized

THE WORLD BANKECONOMIC REVIEW
editorsAlain de Janvry and Elisabeth Sadoulet, University of California at Berkeley
Jaime de Melo, Editor until July 1, 2010, has been technically responsible for this issue.
assistant to the editor Marja Kuiper
editorial boardHarold H. Alderman, World Bank (retired)Pranab K. Bardhan, University of California,
BerkeleyScott Barrett, Columbia University, USAAsli Demirgüç-Kunt, World Bank Jean-Jacques Dethier, World BankQuy-Toan Do, World BankFrédéric Docquier, Catholic University of
Louvain, BelgiumEliana La Ferrara, Università Bocconi, ItalyFrancisco H. G. Ferreira, World BankAugustin Kwasi Fosu, United Nations
University, WIDER, FinlandPaul Glewwe, University of Minnesota,
USAAnn E. Harrison, World BankPhilip E. Keefer, World BankJustin Yifu Lin, World BankNorman V. Loayza, World Bank
William F. Maloney, World BankDavid J. McKenzie, World BankJaime de Melo, University of GenevaJuan-Pablo Nicolini, Universidad Torcuato di
Tella, ArgentinaNina Pavcnik, Dartmouth College, USAVijayendra Rao, World BankMartin Ravallion, World BankJaime Saavedra-Chanduvi, World BankClaudia Paz Sepúlveda, World BankJoseph Stiglitz, Columbia University, USAJonathan Temple, University of Bristol, UKRomain Wacziarg, University of California,
Los Angeles, USADominique Van De Walle, World BankChristopher M. Woodruff, University of
California, San DiegoYaohui Zhao, CCER, Peking University,
China
The World Bank Economic Review is a professional journal used for the dissemination of research indevelopment economics broadly relevant to the development profession and to the World Bank inpursuing its development mandate. It is directed to an international readership among economists andsocial scientists in government, business, international agencies, universities, and development researchinstitutions. The Review seeks to provide the most current and best research in the field of quantita-tive development policy analysis, emphasizing policy relevance and operational aspects of economics,rather than primarily theoretical and methodological issues. Consistency with World Bank policy playsno role in the selection of articles.
The Review is managed by one or two independent editors selected for their academic excellence inthe field of development economics and policy.The editors are assisted by an editorial board composedin equal parts of scholars internal and external to the World Bank. World Bank staff and outsideresearchers are equally invited to submit their research papers to the Review.
For more information, please visit the Web sites of the Economic Review at Oxford University Pressat www.wber.oxfordjournals.org and at the World Bank at www.worldbank.org/research/journals.
Instructions for authors wishing to submit articles are available online at www.wber.oxfordjournals.org.Please direct all editorial correspondence to the Editor at [email protected].
Forthcoming papers in
• Has India’s Economic Growth Become More Pro-Poor in the Wake of Economic Reforms?Gaurav Datt and Martin Ravallion
• Are The Poverty Effects of Trade Policies Invisible? Monika Verma, Thomas Hertel, and Ernesto Valenzuela
• Corruption and Confidence in Public Institutions: Evidence from a Global SurveyBianca Clausen, Aart Kraay, and Zsolt Nyiri
• Agricultural Distortions in Sub-Saharan Africa: Trade and WelfareIndicators, 1961 to 2004Johanna Croser and Kym Anderson
• Thresholds in the Finance-Growth Nexus: A Cross-Country AnalysisHakan Yilmazkuday
• The value of vocational education: High school type and labor marketoutcomes in IndonesiaDavid Newhouse and Daniel Suryadarma
• Disability and Poverty in VietnamDaniel Mont and Nguyen Viet Cuong
THE WORLD BANKECONOMIC REVIEW
Wber.j_25_1_Cover.qxd 6/7/11 5:55 PM Page 2
at International Monetary Fund on A
ugust 19, 2013http://w
ber.oxfordjournals.org/D
ownloaded from

THE WORLD BANK ECONOMIC REVIEW
Volume 25 † 2011 † Number 1
SYMPOSIUM ISSUE ON
INTERNATIONAL MIGRATION AND DEVELOPMENT
Five Questions on International Migration and Development 1Caglar Ozden, Hillel Rapoport, and Maurice Schiff
Part I. International MigrationWhere on Earth is Everybody? The Evolution of Global BilateralMigration 1960–2000 12
Caglar Ozden, Christopher R. Parsons, Maurice Schiff,and Terrie L. Walmsley
Immigration Policies and the Ecuadorian Exodus 57Simone Bertoli, Jesus Fernandez-Huertas Moraga,and Francesc Ortega
Do Migrants Improve Governance at Home? Evidence from a VotingExperiment 77
Catia Batista and Pedro C. Vicente
Part II. International RemittancesWhat Explains the Price of Remittances? An Examination Across119 Country Corridors 105
Thorsten Beck and Marıa Soledad Martınez Perıa
Remittances and the Brain Drain Revisited: The MicrodataShow That More Educated Migrants Remit More 132
Albert Bollard, David McKenzie, Melanie Morten,and Hillel Rapoport

SUBSCRIPTIONS: A subscription to The World Bank Economic Review (ISSN 0258-6770) comprises 3 issues. Prices
include postage; for subscribers outside the Americas, issues are sent air freight.
Annual Subscription Rate (Volume 25, 3 Issues, 2011): Institutions—Print edition and site-wide online access: £168/
$252/E252, Print edition only: £154/$231/E231, Site-wide online access only: £140/$210/E210; Corporate—Print
edition and site-wide online access: £251/$376/E376, Print edition only: £230/$345/E345, Site-wide online access
only: £209/$314/E314; Personal—Print edition and individual online access: £43/$64/E64. US$ rate applies to US &
Canada, EurosE applies to Europe, UK£ applies to UK and Rest of World. There may be other subscription rates
available; for a complete listing, please visit www.wber.oxfordjournals.org/subscriptions. Readers with mailing
addresses in non-OECD countries and in socialist economies in transition are eligible to receive complimentary sub-
scriptions on request by writing to the UK address below.
Full prepayment in the correct currency is required for all orders. Orders are regarded as firm, and payments
are not refundable. Subscriptions are accepted and entered on a complete volume basis. Claims cannot be con-
sidered more than four months after publication or date of order, whichever is later. All subscriptions in Canada
are subject to GST. Subscriptions in the EU may be subject to European VAT. If registered, please supply details to
avoid unnecessary charges. For subscriptions that include online versions, a proportion of the subscription price
may be subject to UK VAT. Personal rates are applicable only when a subscription is for individual use and are
not available if delivery is made to a corporate address.
BACK ISSUES: The current year and two previous years’ issues are available from Oxford University Press. Previous
volumes can be obtained from the Periodicals Service Company, 11 Main Street, Germantown, NY 12526,
USA. E-mail: [email protected]. Tel: (518) 537-4700. Fax: (518) 537-5899.
CONTACT INFORMATION: Journals Customer Service Department, Oxford University Press, Great Clarendon Street,
OxfordOX2 6DP, UK. E-mail: [email protected]. Tel: þ44 (0)1865 353907. Fax: þ44 (0)1865 353485. In the
Americas, please contact: Journals Customer Service Department, Oxford University Press, 2001 Evans Road, Cary,
NC 27513, USA. E-mail: [email protected]. Tel: (800) 852-7323 (toll-free in USA/Canada) or (919) 677-0977. Fax:
(919) 677-1714. In Japan, please contact: Journals Customer Service Department, Oxford University Press, Tokyo, 4-
5-10-8F Shiba, Minato-ku, Tokyo, 108-8386, Japan. E-mail: [email protected]. Tel: þ81 3 5444 5858. Fax: þ81
3 3454 2929.
POSTAL INFORMATION: The World Bank Economic Review (ISSN 0258-6770) is published three times a year, in
February, June, and October, by Oxford University Press for the International Bank for Reconstruction and
Development/THE WORLD BANK. Send address changes to The World Bank Economic Review, Journals
Customer Service Department, Oxford University Press, 2001 Evans Road, Cary, NC 27513-2009. Periodicals
postage paid at Cary, NC and at additional mailing offices. Communications regarding original articles and editorial
management should be addressed to The Editor, The World Bank Economic Review, The World Bank, 3, Chemin
Louis Dunant, CP66 1211 Geneva 20, Switzerland.
ENVIRONMENTAL AND ETHICAL POLICIES: Oxford Journals, a division of Oxford University Press, is committed to
working with the global community to bring the highest quality research to the widest possible audience.
Oxford Journals will protect the environment by implementing environmentally friendly policies and practices
wherever possible. Please see http://www.oxfordjournals.org/ethicalpolicies.html for further information on
environmental and ethical policies.
DIGITAL OBJECT IDENTIFIERS: For information on dois and to resolve them, please visit www.doi.org.
PERMISSIONS: For information on how to request permissions to reproduce articles or information from this
journal, please visit www.oxfordjournals.org/jnls/permissions.
ADVERTISING: Advertising, inserts, and artwork enquiries should be addressed to Advertising and Special Sales,
Oxford Journals, Oxford University Press, Great Clarendon Street, Oxford, OX2 6DP, UK. Tel: þ44 (0)1865
354767; Fax: þ44(0)1865 353774; E-mail: [email protected].
DISCLAIMER: Statements of fact and opinion in the articles in The World Bank Economic Review are those of the
respective authors and contributors and not of the International Bank for Reconstruction and Development/THE
WORLD BANK or Oxford University Press. Neither Oxford University Press nor the International Bank for
Reconstruction and Development/THE WORLD BANK make any representation, express or implied, in respect of the
accuracy of the material in this journal and cannot accept any legal responsibility or liability for any errors or
omissions that may be made. The reader should make her or his own evaluation as to the appropriateness or
otherwise of any experimental technique described.
PAPER USED: The World Bank Economic Review is printed on acid-free paper that meets the minimum require-
ments of ANSI Standard Z39.48-1984 (Permanence of Paper).
INDEXING AND ABSTRACTING: The World Bank Economic Review is indexed and/or abstracted by CAB Abstracts,
Current Contents/Social and Behavioral Sciences, Journal of Economic Literature/EconLit, PAIS International,
RePEc (Research in Economic Papers), and Social Services Citation Index.
COPYRIGHT # 2011 The International Bank for Reconstruction and Development/THE WORLD BANK
All rights reserved; no part of this publication may be reproduced, stored in a retrieval system, or transmitted in
any form or by any means, electronic, mechanical, photocopying, recording, or otherwise without prior written
permission of the publisher or a license permitting restricted copying issued in the UK by the Copyright
Licensing Agency Ltd, 90 Tottenham Court Road, London W1P 9HE, or in the USA by the Copyright
Clearance Center, 222 Rosewood Drive, Danvers, MA 01923.
Typeset by Techset Composition Limited, Chennai, India; Printed by Edwards Brothers Incorporated, USA.
at International Monetary Fund on A
ugust 19, 2013http://w
ber.oxfordjournals.org/D
ownloaded from

Five Questions on International Migrationand Development
Caglar Ozden, Hillel Rapoport, and Maurice Schiff
JEL codes: f22, f24, j61, 015
The movement of people in search of better economic conditions and a moresecure environment is as old as human history. Such movements not only pro-foundly affect the lives of the migrants, but also lead to significant economicand social transformations in migrants’ countries of origin and destination.1 Inrecent years, a significant increase in the growth of international migration andremittance flows and in awareness of their development impact has led to aresurgence of interest by academics, policymakers, and analysts in what hasbeen referred to as the third leg of globalization (the other two being inter-national trade and international capital flows).
The renewed interest in international migration led the World BankDevelopment Research Group to initiate the Research Program on
Caglar Ozden (corresponding author; [email protected]) is a senior economist in the
Development Research Group of the World Bank. Hillel Rapoport ([email protected]) is
visiting research fellow at the Center for International Development at Harvard University and associate
professor at Bar-Ilan University and at EQUIPPE, University of Lille. Maurice Schiff (mschiff@
worldbank.org) is a lead economist in the Office of the Chief Economist for Latin America at the World
Bank, visiting professor at the University of Chile, and fellow at the Institute for the Study of Labor
(IZA-Bonn).
1. Studies have generally shown that international migration has a positive impact on poverty
reduction and human capital investments and outcomes—including on children’s short- and long-term
physical development, education (especially for girls), and use of birth-related healthcare services.
Studies have also shown a positive impact on investments in physical capital (such as land and
agricultural implements); entrepreneurship, including the establishment of small and microenterprises;
housing; and reduction in child labor (see studies in Ozden and Schiff 2006, 2007 and references
therein). Migration has also been found to have a positive impact on trade (Rauch and Trinidade 2002;
Iranzo and Peri 2009) and foreign direct investment (Kugler and Rapoport 2007; Javorcik and others
2011); to reduce home-country fertility in the case of migration to low-fertility countries and raise it in
the case of migration to high-fertility countries (Beine, Docquier, and Schiff 2008); and the brain drain
has been found to promote technology diffusion in some studies (Kerr 2008; Agrawal and others 2011)
though not in others (Schiff and Wang 2009).
THE WORLD BANK ECONOMIC REVIEW, VOL. 25, NO. 1, pp. 1–11 doi:10.1093/wber/lhr021# The Author 2011. Published by Oxford University Press on behalf of the International Bankfor Reconstruction and Development / THE WORLD BANK. All rights reserved. For permissions,please e-mail: [email protected]
1
at International Monetary F
und on August 12, 2011
wber.oxfordjournals.org
Dow
nloaded from

International Migration and Development in 2003.2 More recently, theResearch Department of the Agence francaise de Developpement (AFD) andthe World Bank Development Research Group have collaborated on severalresearch projects and conferences. This symposium issue gathers some of thepapers presented at the Second International Migration and DevelopmentConference, held at the World Bank in Washington, DC, on September 10–11,2009.3 The success of the conference series and the commitment of the WorldBank and AFD to sponsoring the conferences reflect the recognition by inter-national development agencies and the academic community of the importanceof international migration to the development agenda.
The five articles in this symposium issue fall into two groups.4 A first groupof three articles deal with the measurement, determinants, and political effectsof international migration. A new global bilateral migration database for1960–2000 (Ozden and others 2011) updates and extends the Parsons andothers (2007) database back to 1960. The second article takes advantage ofexisting surveys and matches Ecuadorian migrants in the United States andSpain with migrant households in Ecuador to investigate determinants of thesize, selection, and sorting across destinations of the recent migration wave outof that country (Bertoli, Fernandez-Huertas Moraga, and Ortega 2011). Thethird article designs an experiment to examine the impact of Cape Verde’smigrants on the demand for good governance in that country (Batista andVicente 2011). Two articles on international remittances constitute the secondset of contributions. They examine the determinants of remittance costs (Beckand Martınez Perıa 2011) and the relationship between migrants’ educationand their propensity to remit (Bollard and others 2011). Both articles use orig-inal microdata collected from a large number of countries.
2. The research program was initiated under the guidance of Francois Bourguignon, then Senior
Vice President of Development Economics, and Alan Winters, then Director of the Development
Economics Research Group, at the World Bank.
3. The first conference was held at the University of Lille in June 2008, the third at the Paris School
of Economics in September 2010, and the fourth is planned for June 2011 at Harvard.
4. These studies are the latest to come out of the World Bank Research Program on International
Migration and Development. Previous studies have been collected in three volumes. (Many papers were
also published as World Bank Policy Research Working Papers, and most have appeared in refereed
journals.) The first volume (Ozden and Schiff 2006) examined the determinants and development
impact of migration and remittance on such issues as poverty, health, education, entrepreneurship, and
child labor, as well as aspects of brain drain, brain gain, and brain waste. A major contribution was a
new database on international migration to countries of the Organisation for Economic Co-operation
and Development by Docquier and Marfouk. The second volume (Ozden and Schiff 2007) also
examined the impact of migration and remittances on schooling and labor markets, host countries’
immigration policies, and returning migrants’ gains from overseas work experience, as well as a new
global bilateral migration database for 2000 by Parsons and others (2007). A third volume (Morrison,
Schiff, and Sjoblom 2008) focused on the determinants and impact of the migration of women and the
difference between male and female migrants and between no-migrant male and female heads of
household.
2 T H E W O R L D B A N K E C O N O M I C R E V I E W
at International Monetary F
und on August 12, 2011
wber.oxfordjournals.org
Dow
nloaded from

I . I N T E R N A T I O N A L M I G R A T I O N
This section discusses the three articles on international migration dealing withthe new database, the determinants of destination choices, and migration’sgovernance impact.
What Are the Regional Specifics and Dynamics of International Migration?
Evidence on international migration is far sparser than that on trade andcapital flows. Bilateral international trade data are classified by a large anddetailed set of characteristics and are reported monthly. Some capital flow dataare even available daily. And trade and financial flow data are generally avail-able from both importing and exporting countries, so the two sources can becompared for accuracy. Bilateral aggregate (country-level) migration data comemostly from censuses conducted every 10 years, and only from destinationcountries that choose to collect and disseminate these data. In short, migrationdata are among the scarcest international flow data.
Thus, collecting comprehensive and reliable data on international migrationpatterns and migrant characteristics at aggregate and household levels becamean overarching objective of the World Bank international migration researchprogram. A major effort was launched to assemble global migration data-bases.5 Docquier and Marfouk (2004, 2006) constructed a global bilateraldatabase of South–North and North–North migration (from 165 developingcountries to 30 Organisation for Economic Co-operation and Development(OECD) countries and between OECD countries for three levels of educationfor 1990 and 2000. Several extensions followed, including a disaggregation ofskilled migrants by age of entry in the host country (Beine, Docquier, andRapoport 2007)6 and gender (Docquier, Lowell, and Marfouk 2009).7 In aparallel effort, Parsons and others (2007) constructed the most comprehensiveglobal bilateral migration database at the time, consisting of a 226x226 matrixof bilateral migrant stocks for all country pairs in the world for the 2000census round.
The article by Ozden and others (2011) in this issue updates Parsons andothers’ (2007) database on bilateral migrant stocks and extends it back from2000 to 1960 and disaggregates it by gender. The global bilateral matrices
5. The collection effort also included microdata gathered through household surveys, which
contained detailed international migration modules in various countries, including Brazil, India, Ghana,
Pakistan, and Tonga.
6. The data were disaggregated to identify skilled emigrants who obtained their last degree in their
home country and those who obtained it elsewhere. That evidence is not directly available but can be
approximated through information on the age at which skilled immigrants entered the host country.
7. The OECD also assembled a database on migration to the OECD (Dumont and Lemaıtre 2004),
which was then disaggregated by migrants’ age, gender, educational attainment, and place of birth
(OECD 2008). A global bilateral database of the medical brain drain was also put together by Docquier
and Bhargava (2006).
Ozden, Rapoport, and Schiff 3
at International Monetary F
und on August 12, 2011
wber.oxfordjournals.org
Dow
nloaded from

were assembled by combining more than one thousand censuses and popu-lation register records. The matrices provide for the first time a completeset of bilateral migration stocks for the second half of the twentieth century.The article describes in detail the key assumptions made in constructing thebilateral migration matrices and in handling missing observations and theemergence of new countries. The clear and detailed explanations of the meth-odology used to construct these matrices are among the database’s keystrengths, enhancing its usefulness and enabling anyone to improve and extendit as new data become available.
The new evidence enables the authors to identify migrants’ main source anddestination countries, characterize the bilateral structure of migration patternsaround the world, and identify the most important migration corridors, as wellas the evolution of migration at the bilateral, country, and regional levels for1960–2000. The authors note several important changes in these patterns.South–North migration grew rapidly over the period, while the shares ofNorth–North, North–South, and South–South migration declined. TheUnited States remained the world’s main migration destination in 2000, hometo one in five migrants. But the composition of migrant stocks in the UnitedStates and across the world underwent major changes. In 1960, most migrantsin the United States originated in Europe; by 2000, most came from LatinAmerica and the Caribbean. Worldwide, migrants from Europe and South Asiawere important in 1960; by 2000, migrants from Latin America, North Africaand the Middle East had gained prominence.
This database constitutes an important extension of the information avail-able on international migration. If the previous global bilateral migration data-bases are any indication, the new data are likely to be a rich source foracademics, policy analysts, and others interested in bilateral and overallmigration stocks at the country, region, or global level and on their evolutionover the second half of the twentieth century.
How Do Policy and Incentives Affect the Size, Destination, and Compositionof Migration Flows?
Ecuador experienced massive emigration following a deep economic crisis inthe late 1990s. Bertoli, Fernandez-Huertas Moraga, and Ortega (2011) usemicro-level data on Ecuador and its main destination countries, Spain and theUnited States, to examine the impact of wage gaps and immigration policies onthe size and composition of migration flows. Detailed data from the two desti-nations enable the authors to focus more precisely on differences across desti-nations. Other studies have combined micro-level data from various countriesin their analysis, including Bollard and others’ (2011) article on the relation-ship between migrants’ skill levels and their propensity to remit, and Clemens,Montenegro, and Pritchett’s (2008) paper comparing real wages in migrants’home and host countries. The determinants of the level and distribution of
4 T H E W O R L D B A N K E C O N O M I C R E V I E W
at International Monetary F
und on August 12, 2011
wber.oxfordjournals.org
Dow
nloaded from

skilled and unskilled labor migration for different destination countries havealso been examined, for example, by Grogger and Hanson (2011) and Beine,Docquier, and Ozden (2011), though they do so on the basis of aggregate bilat-eral macrodata and do not consider the impact of specific immigration policies.
Migration policies are typically complex collections of laws, rules, andimplementation measures. Their components do not always constitute a cohe-sive whole, possibly because they often originate in different ministries ( justice,interior, foreign affairs, and others) and because they may be influenced bygroups with different and even contradictory interests. Thus, identifyingchanges over time or their impact is likely to be difficult. Bertoli,Fernandez-Huertas Moraga, and Ortega use data on the large emigration flowsfrom Ecuador in the late 1990s to estimate the impact of a sudden change inSpain’s policy in August 2003 (the mid-point of their sample period) withthe introduction of a visa requirement for nonimmigrant admission ofEcuadorians.
Using the microdata to estimate Mincer-type wage equations, the authorsfind that the income gains associated with migration are larger for the UnitedStates than for Spain, with the difference increasing with migrants’ level of edu-cation. This finding is consistent with the higher share of Ecuadorian collegegraduates residing in the United States but not with the finding that Spain wasthe main destination for Ecuadorian emigrants. This seeming anomaly isexplained by the fact that Ecuadorians visiting Spain did not need a visa, sothey could simply remain in the country to work in the parallel labor market.Entering the United States illegally was substantially more difficult, which,together with the higher skill premium in the U.S. labor market, explains whyboth the number of Ecuadorians and the share of unskilled Ecuadorianmigrants were larger in Spain than in the United States. This situation changedin 2003 with the elimination of the visa waiver program, a policy change thatis estimated to have led to a two-thirds reduction in the flow of Ecuadoriansto Spain.
The authors’ findings seem to indicate that some changes in immigrationpolicy can have a dramatic impact on immigration. In contrast, McKenzie andRapoport (2010) and Beine, Docquier, and Ozden (2011) have shown theimportance of diaspora networks for immigration, concluding that changes inimmigration policy may have a limited impact on future immigration flowsbecause of the strength of the network effects. The findings in the Bertoli,Fernandez-Huertas Moraga, and Ortega article suggest that the impact of achange in immigration policy may depend on the policy reform itself and onthe conditions under which the reform takes place.
Do Migrants Improve Governance at Home?
Migrants are affected by their experiences in their country of destination and,in turn, they affect their home country in a variety of ways. Batista and Vicente
Ozden, Rapoport, and Schiff 5
at International Monetary F
und on August 12, 2011
wber.oxfordjournals.org
Dow
nloaded from

(2011) examine the extent to which migrants from Cape Verde, both currentand those that return home, contribute to political change in their homecountry. This is an important issue because of the centrality of institutions toeconomic development (Acemoglu, Johnson, and Robinson 2005; Rodrik2007) and because the literature on the relationship between migration andinstitutions is limited.
Assuming institutions are positively affected by the average level of humancapital in migrants’ home country and the size of their diaspora, unskilledmigration should improve the quality of institutions. Skilled migration, for itspart, would have two opposite effects: a positive impact through the increasedsize of the diaspora and a negative one associated with a decrease in humancapital in the home country. These hypotheses are confirmed in a paper onmigration and democracy by Docquier and others (2011).8 An earlier studybased on data for one point in time finds that emigration has a positive impacton political institutions and a negative one on economic institutions (Li andMcHale 2009). Another study (Spilimbergo, 2009) finds that foreign studentsreturning to their home country have a positive impact on democracy, but onlyif they studied in a democratic country. These studies are based on country-level data.
The article by Batista and Vicente uses microdata to examine whethermigration in general and skilled migration in particular contributes to politicalchange in Cape Verde, a nine-island tropical country off the coast of WestAfrica with half a million inhabitants, good institutional scores by Africanstandards, and a long tradition of migration. Current migrants represent a fifthof the population, and skilled migrants constituted 67 percent of migrants in2000 (Docquier and Marfouk 2006), a share that remained high (60 percent)even after excluding people who acquired their tertiary education abroad(Beine, Docquier, and Rapoport 2007).
Batista and Vicente set up a "voting experiment" along the followinglines: after taking a survey on perceived corruption in public services,respondents were asked to mail a prestamped postcard if they wanted thesurvey results to be published in the national media. Controlling for indi-vidual, household, and locality characteristics, the authors regressed partici-pation in the voting experiment, which they interpret as demand foraccountability, on migration prevalence at the locality level. They show thatboth current and return migrants from the United States, but not fromPortugal, the other main destination country, significantly raise participationrates; the effect is stronger for return migrants. They do not find evidenceof additional effects for skilled migrants.
8. They find, based on a panel of cross-country data, that migration has a positive impact on
political institutions while skilled migration has an ambiguous impact. In a simple model, Schiff and
Docquier (2010) also find an ambiguous U-shaped impact of skilled migration on institutions.
6 T H E W O R L D B A N K E C O N O M I C R E V I E W
at International Monetary F
und on August 12, 2011
wber.oxfordjournals.org
Dow
nloaded from

Thus, the study provides microeconometric evidence supporting the country-level findings on the positive effects of foreign students (Spilimbergo 2009) andemigration (Docquier and others 2011) on democracy at home.
I I . I N T E R N A T I O N A L R E M I T T A N C E S
Another migration dividend for developing countries, probably the mostobvious, is remittances. The rapid rise in South–North migration, as documen-ted in Ozden and others (2011), has been accompanied by a dramatic rise inmigrants’ remittances. Recorded remittance flows to developing countries rosenearly sixfold from 1995 ($57 billion) to 2008 (more than $328 billion). Therecent economic crisis resulted in a 5 percent decline in remittances, though2010 saw a rebound of about the same amount (World Bank 2010). Onaverage and over the last few years, remittances have approximately equaledthe amount of foreign direct investments (a more volatile source of foreignexchange for developing countries) and were about triple the size of officialdevelopment assistance.
There have been two recent structural changes in remittances: in the indus-trial organization of the remittance business, with the entry of new operators(including many banks), and in the skill composition of migration flows,induced largely by increasingly quality-selective immigration policies in richcountries. The common wisdom is that the entry of new operators should leadto more competition, lower remittance costs, and ultimately, higher remittancevolumes thanks to income and substitution (from informal to formal channels)effects. The change in skill composition, in contrast, should lead to lowerremittance volumes or, at least, to lower remittances per migrant (as educatedmigrants, presumably, have lower incentives to remit). As the two contributionsdescribed here show, however, the reality is more nuanced and complex.
What Explains the Price of Remittances?
Reducing the cost (or price) of remittances would seem to be the most obviousway to increase the volume of remittances reaching developing countries.International organizations such as the World Bank and various developmentforums have long called for policy intervention to increase competition in theremittance business. Recently, as Beck and Martinez (2011) recall, worldleaders at the L’Aquila 2009 G-8 summit called for cutting the price of remit-tances by half in five years (from a current average of 10 percent).
The presumption is that more competition (including more transparency)will lead to lower remittance prices. This presumption would seem to be sup-ported by the Mexican experience. In 2008, when the World Bank dataset onremittance costs was launched, Ratha (2008) noted that Mexico’s earlierrelease of remittance cost data from about a dozen U.S. cities to severalMexican cities had been accompanied by a 56 percent decline in remittance
Ozden, Rapoport, and Schiff 7
at International Monetary F
und on August 12, 2011
wber.oxfordjournals.org
Dow
nloaded from

costs between 1999 and 2004. “The hope is,” Ratha wrote, “that the newdatabase will have a similar cost reduction effect.” Publicizing remittanceprices would better inform consumers and elicit further competition in remit-tance corridors. That would reduce the drain on poor migrants’ incomes,increase their ability to send more money home, and prevent incumbent firmsfrom using their market power to extract a large part of the global surplusfrom international migration in transfer, exchange rate conversion, and otherremittance fees. The database also makes remittance data available to research-ers investigating remittance markets.
Beck and Martinez Peira (2011) analyze the bilateral costs of sending remit-tances and find enormous heterogeneity in the magnitude of these costs and intheir determinants across country pairs. Quite surprisingly, they find that finan-cial development and competition in the banking sector are poor predictors ofthe bilateral costs of remittances. A closer look reveals that these costs areinstead driven by competition in the remittance business itself. That segment ofthe market is dominated by one firm, Western Union, whose prices seem to beset independently of competitive pressures. The authors suggest that this maybe due to Western Union’s better network coverage and to more years in oper-ation than other firms in a number of corridors.
Western Union’s price-setting behavior is consistent with the price leadershipmodel in which a dominant firm may be the sole operator in a contestablemarket and yet charge less than the monopoly price to keep potential competi-tors out. Or when its competitive advantage is not too large, it may charge aprice equal to its competitors’ marginal cost (minus epsilon) in order to securemarket share. In either case, observed competition—as measured by standardconcentration indices—is unlikely to accurately predict market prices.
How Does Migrants’ Education Level Affect Their Propensity to Remit?
As noted, international migration from developing to developed countries isincreasingly of the “brain drain” type.9 This has given rise to questions aboutwhether the increasingly high-skilled nature of emigration from developingcountries will slow the rise in remittances. The literature on migrant remit-tances shows that the two main motivations to remit are altruism andexchange.10 Altruism is directed primarily toward one’s immediate family anddecreases with social distance. The exchange motive posits that remittancessimply “buy” various services, such as care of the migrant’s assets (land andcattle, for example) or relatives (children, elderly parents) at home; such trans-fers are typically observed in cases of temporary migration and signal
9. In Organisation for Economic Co-operation and Development (OECD) countries, the number of
migrants with a tertiary education and originating from developing countries doubled between 1990
and 2000, while the number for those with a primary school education rose only 20 percent.
10. See Rapoport and Docquier (2006) for a comprehensive survey of the theoretical and empirical
literature on migrants’ remittances.
8 T H E W O R L D B A N K E C O N O M I C R E V I E W
at International Monetary F
und on August 12, 2011
wber.oxfordjournals.org
Dow
nloaded from

intentions to return. A particular type of exchange takes place when remit-tances are de facto repayments of loans used to finance the migrant’s invest-ments in education or migration. Thus, it is theoretically unclear whethereducated migrants remit more than less educated ones. Educated migrants’income is a priori higher, providing them with a greater capacity to remit; theymay remit more to meet implicit commitments to reimburse the family forfunding education investments. On the other hand, educated migrants tend toemigrate with their family and to do so on a permanent or longer term basisand are therefore less likely to remit (or are likely to remit less) than someonemoving alone on a temporary basis.
The question of whether educated migrants remit more or less than do lesseducated migrants has been surprisingly understudied, especially at a microlevel. Most of the previous literature (Faini 2007; Niimi, Ozden, and Schiff2010) used aggregate data and found a negative effect of migrants’ educationon total remittances received. Bollard and others (2011) question the findingsof that literature, positing that the many differences across countries couldresult in a spurious negative relationship between remittances and migrants’skill levels in cross-country studies. The authors examine this issue by combin-ing household survey data on immigrants in 11 destination countries. They finda mixed pattern for the relationship between education and the likelihood ofremitting, and a strong positive relationship between education and theamount remitted (intensive margin) conditional on remitting (extensivemargin). Combining these intensive and extensive margins gives an overallpositive effect of education on the amount remitted, with an expected amountof $1,000 annually for a migrant with a university degree and $750 forsomeone without one. Data from the surveys containing information onincome show, however, that the less educated tend to remit a larger share oftheir income.
The microdata used in this study also allow investigation of why the moreeducated remit more. Bollard and others (2011) find that it is the higherincome earned by migrants that explains much of the higher remittances ratherthan characteristics of their family situations or their intentions to return.Indeed, and in contrast to common wisdom, declared intentions to return donot differ significantly across education groups. And while it is confirmed thateducated migrants do migrate more with their spouse and children, less edu-cated migrants tend to have larger extended families at destination, suggestingcompensating effects of family closeness and size on remittance behavior acrosseducation categories.
* * * * *
The articles in this symposium issue provide original contributions on fiveimportant questions on the economics of international migration and develop-ment—questions on the measurement, policy determinants and political impactof international migration, and on the determinants of the price of
Ozden, Rapoport, and Schiff 9
at International Monetary F
und on August 12, 2011
wber.oxfordjournals.org
Dow
nloaded from

international remittances and their relationship with migrants’ education levels.These articles are expected to elicit wide interest, stimulate additional researchand further our knowledge in these areas. The articles are part of an ongoingcollaborative research effort between the World Bank Development ResearchGroup and the Research Department of the Agence francaise deDeveloppement, a collaboration of demonstrated value that the two institutionsare committed to pursue.
RE F E R E N C E S
Acemoglu, D., S. Johnson, and J. Robinson. 2005. “Institutions and Growth.” In Handbook of
Economic Growth, ed. P. Aghion, and S. Durlauff. Amsterdam: North Holland.
Agrawal, A.K., D. Kapur, J. McHale, and A. Oettl. 2011. “Brain Drain or Brain Bank? The Impact of
Skilled Emigration on Poor Country Innovation.” Journal of Urban Economics 69 (1): 43–55.
Batista, C., and P. Vicente. 2011. “Do Migrants Improve Governance at Home? Evidence from a Voting
Experiment.” World Bank Economic Review, this issue.
Beck, T., and M.S. Martinez Peria. 2011. “What Explains the Price of Remittances? An Examination
across 119 Country Corridors.” World Bank Economic Review, this issue.
Beine, M., F. Docquier, and C. Ozden. 2011. “Diasporas.” Journal of Development Economics 95 (1):
30–41.
Beine, M., F. Docquier, and H. Rapoport. 2007. “Measuring International Skilled Migration: New
Estimates Controlling for Age of Entry.” World Bank Economic Review 21 (2): 249–54.
Beine, M., F. Docquier, and M. Schiff. 2008. “International Migration, Transfer of Norms and
Home-country Fertility.” IZA Discussion Paper 3912. Institute for the Study of labor (IZA), Bonn.
Bertoli, S., J. Fernandez-Huertas Moraga, and F. Ortega. 2011. “Immigration Policies and the
Ecuadorian Exodus.” World Bank Economic Review, this issue.
Bollard, A., D. McKenzie, M. Morten, and H. Rapoport. 2011. “Remittances and the Brain Drain
Revisited: The Microdata Show That More Educated Migrants Remit More.” World Bank
Economic Review, this issue.
Clemens, M., C. Montenegro, and L. Pritchett. 2008. “The Place Premium: Wage Differences for
Identical Workers across the U.S. Border.” CGD Working Paper 148. Center for Global
Development, Washington, DC.
Docquier, F., E. Lodigiani, H. Rapoport, and M. Schiff. 2011. “Emigration and Democracy” World
Bank Policy Research Paper 5557. World Bank, Washington, DC.
Docquier, F., B.L. Lowell, and A. Marfouk. 2009. “A Gendered Assessment of the Brain Drain.”
Population and Development Review 35 (2): 297–321.
Docquier, F., and A. Marfouk. 2004. “Measuring the international mobility of skilled workers
(1990–2000): Release I.” Policy Research Working Paper 3381. World Bank, Washington, DC.
———. 2006. “International Migration by Educational Attainment, 1990–2000.” In International
Migration, Remittances, and Development, ed. C. Ozden, and M. Schiff. New York: Palgrave
Macmillan.
Dumont, J.C., and G. Lemaıtre. 2004. “Counting Immigrants and Expatriates in OECD Countries: A
New Perspective.” Organisation for Economic Co-operation and Development, Paris.
Faini, R. 2007. “Remittances and the Brain Drain: Do More Skilled Migrants Remit More?” World
Bank Economic Review 21 (2): 177–91.
Grogger, J., and G. Hanson. 2011. “Income Maximization and the Selection and Sorting of
International Migrants.” Journal of Development Economics 95 (1): 42–57.
10 T H E W O R L D B A N K E C O N O M I C R E V I E W
at International Monetary F
und on August 12, 2011
wber.oxfordjournals.org
Dow
nloaded from

Iranzo, S., and G. Peri. 2009. Migration and Trade: Theory with an Application to the Eastern–
Western European Integration. Journal of International Economics 79 (1): 1–19.
Javorcik, B.S., C. Ozden, M. Spatareanu, and I.C. Neagu. 2011. “Migrant Networks and Foreign Direct
Investment.” Journal of Development Economics 94 (2): 231–241.
Kerr, W.R. 2008. “Ethnic Scientific Communities and International Technology Diffusion.” Review of
Economics and Statistics 90: 518–37.
Kugler, M., and H. Rapoport. 2007. “International Labor and Capital Flows: Complements or
Substitutes?” Economics Letters 94 (2): 155–62.
Li, X., and J. McHale. 2009. “Does Brain Drain Lead to Institutional Gain? A Cross-country Empirical
Investigation.” Department of Economics, Queen’s University, Kingston, ON.
McKenzie, D., and H. Rapoport. 2010. “Self-selection Patterns in U.S.–Mexico Migration: The Role of
Migration Networks.” Review of Economics and Statistics 92 (4): 811–21.
Morrison, A.R., M. Schiff, and M. Sjoblom. 2008. The International Migration of Women. New York
and Washington, DC: Palgrave Macmillan and World Bank.
Niimi, Y., C. Ozden, and M. Schiff. 2010. “Remittances and the Brain Drain: Skilled Migrants Do
Remit Less.” Annales d’Economie et de Statistique 97–98.
OECD (Organisation for Economic Co-operation and Development). 2008. A Profile of Immigrant
Populations in the 21st Century: Data from OECD Countries. Paris: Organisation for Economic
Co-operation and Development.
C. Ozden, and M. Schiff, ed. 2006. International Migration, Remittances & the Brain Drain.
New York and Washington, DC: Palgrave Macmillan and World Bank.
C. Ozden, and M. Schiff, ed. 2007. International Migration, Economic Development, and Policy.
New York and Washington, DC: Palgrave Macmillan and World Bank.
Ozden, C., C.R. Parsons, M. Schiff, and T.L. Walmsley. 2011. “Where on Earth is Everybody? The
Evolution of Global Bilateral Migration 1960–2000.” World Bank Economic Review, this issue.
Parsons, C.R., R. Skeldon, T. Walmsley, and L.A. Winters. 2007. “Quantifying International Migration:
A Database of Bilateral Migrant Stocks.” In International Migration, Economic Development and
Policy, ed. C. Ozden, and M. Schiff. New York and Washington, DC: Palgrave Macmillan and
World Bank.
Rapoport, H., and F. Docquier. 2006. “The Economics of Migrants’ Remittances.” In Handbook of the
Economics of Giving, Altruism, and Reciprocity, ed. S.-C. Kolm, and J. Mercier Ythier. Amsterdam:
North Holland.
Ratha, D. 2008. “A New Remittance Prices Database Brings Much-needed Transparency.” People Move:
A Blog about Migration, Remittances and Development (blog). World Bank, Washington, DC.
September 25. http://blogs.worldbank.org/peoplemove/a-new-remittance-price-database-brings-
much-needed-transparency.
Rauch, J.E., and V. Trinidade. 2002. “Ethnic Chinese Networks in International Trade.” Review of
Economics and Statistics 84 (1): 116–30.
Rodrik, D. 2007. One Economics, Many Recipes: Globalization, Institutions, and Economic Growth.
Princeton, NJ: Princeton University Press.
Schiff, M., and F. Docquier. 2010. “Brain Drain, Human Capital, and Institutions.” Office of the Chief
Economist, Latin America and the Caribbean Region, World Bank.
Schiff, M., and Y. Wang. 2009. “North-South Trade-Related Technology Diffusion, Brain Drain, and
Productivity Growth: Are Small States Different?” World Bank Policy Research Working Paper
4828. World Bank, Washington, DC.
Spilimbergo, A. 2009. “Foreign Students and Democracy.” American Economic Review 99 (1):
528–43.
World Bank. 2010. Migration and Remittances Factbook 2011. Washington, DC: World Bank.
Ozden, Rapoport, and Schiff 11
at International Monetary F
und on August 12, 2011
wber.oxfordjournals.org
Dow
nloaded from

Where on Earth is Everybody? The Evolutionof Global Bilateral Migration 1960–2000
Caglar Ozden, Christopher R. Parsons, Maurice Schiff,and Terrie L. Walmsley
Global matrices of bilateral migrant stocks spanning 1960–2000 are presented,disaggregated by gender and based primarily on the foreign-born definition ofmigrants. More than one thousand census and population register records are com-bined to construct decennial matrices corresponding to the five census rounds between1960 and 2000. For the first time, a comprehensive picture of bilateral globalmigration over the second half of the 20th century emerges. The data reveal that theglobal migrant stock increased from 92 million in 1960 to 165 million in 2000.Quantitatively, migration between developing countries dominates, constituting halfof all international migration in 2000. When the partition of India and the dissolutionof the Soviet Union are accounted for, migration between developing countries isremarkably stable over the period. Migration from developing to developed countriesis the fastest growing component of international migration in both absolute and rela-tive terms. The United States has remained the most important migrant destination inthe world, home to one fifth of the world’s migrants and the top destination formigrants from some 60 sending countries. Migration to Western Europe has come
Caglar Ozden (corresponding author; [email protected]) is a senior economist in the
Development Research Group of the World Bank. Christopher Parsons ([email protected]) is a
consultant at the World Bank and a doctoral candidate at the University of Nottingham. Maurice Schiff
([email protected]) is a lead economist in the Office of the Chief Economist for Latin America at
the World Bank. Terrie Walmsley ([email protected]) is an associate professor and executive
director of the Global Trade Analysis Project, Purdue University, and an associate professor at the
University of Melbourne. First and foremost the authors thank the United Nations Population Division
for spearheading the creation of the Global Migration Database. In particular, they thank Bela Hovy
and Hania Zlotnik for their close support and shared vision that ensured the completion of this project.
They are grateful to Richard Black, Ronald Skeldon, and especially L. Alan Winters for having the
foresight to initiate this project and for their unwavering support. They also extend thanks to the
librarians at the British Library, the Library of Congress, and the London School of Economics and to
Lorraine Wright at the United States Census Bureau for assistance beyond the call of duty. The authors
thank Steven Vertovec and Norbert Winnige of the Max Planck Institute for the Study of Religious and
Ethnic Diversity for helping surmount the data issues concerning Germany and the former Soviet
Union. They thank Michel Beine, Frederic Docquier, and the journal editor, as well as three anonymous
referees, for advice and comments. They gratefully acknowledge financial support from the World Bank
Knowledge for Change Program and Ivar Cederholm’s help with administration of the funding. The
findings, interpretations, and conclusions expressed in this article are those of the authors and do not
necessarily represent the views of the World Bank, its Executive Directors, or the countries they
represent.
THE WORLD BANK ECONOMIC REVIEW, VOL. 25, NO. 1, pp. 12–56 doi:10.1093/wber/lhr024# The Author 2011. Published by Oxford University Press on behalf of the International Bankfor Reconstruction and Development / THE WORLD BANK. All rights reserved. For permissions,please e-mail: [email protected]
12
at International Monetary F
und on August 12, 2011
wber.oxfordjournals.org
Dow
nloaded from

largely from elsewhere in Europe. The oil-rich Persian Gulf countries emerge asimportant destinations for migrants from the Middle East and North Africa andSouth and Southeast Asia. Finally, although the global migrant stock is predominantlymale, the proportion of female migrants increased noticeably between 1960 and2000. The number of women rose in every region except South Asia. JEL codes: F22,O15, J11, J16
International migration—the movement of people across national borders—hasimportant economic, social, and political implications. Despite the recent emer-gence of a dynamic literature, empirical analysis of migration flows and theirimpact lags behind the policy debate and the theoretical literature. The mainreason is the absence of comprehensive and reliable data on internationalmigration patterns and migrant characteristics at either the aggregate or thehousehold level.
The objective of this article is to use data from more than one thousand nationalcensuses and population registers to estimate a complete global origin–destinationmigration matrix for each decade over 1960–2000. These 226*226 matrices, com-prising every country, major territory, and dependency around the world, aredivided into periods corresponding to the last five completed census rounds. Thegender dimension of international migration over this period is also presented.
The primary source of the raw data is the United Nations PopulationDivision’s Global Migration Database, created through the collaboration of theUnited Nations Population Division, the United Nations Statistics Division, theWorld Bank, and the University of Sussex (United Nations 2008). This uniquedata repository comprises 3,500 individual census and population registerrecords1 for more than 230 destination countries and territories over the lastfive decades. The database provides information on international bilateralmigrant stocks (by citizenship2 or place of birth), sex, and age. There is con-siderable variation, however, in how destination countries collect, record, anddisseminate immigration data. Meaningful comparison of destination countryrecords over time is thus often confounded.
In constructing global bilateral migration matrices, several challenges arise.First, destination countries typically classify migrants in different ways—by placeof birth, citizenship, duration of stay, or type of visa. Using different criteria for aglobal dataset generates discrepancies in the data. Second, many geopoliticalchanges occurred between 1960 and 2000, with many international borders
1. Of the 3,500 sources detailed in the overarching UN Global Migration Database, 1,107 were
suitable for analysis, once repeated censuses had been removed or combined. The Global Migration
Database should not be confused with the Trends in International Migrant Stock Database, which lists
aggregate migrant stocks for each destination country in the world at five year intervals (United Nations
2006).
2. The article treats the concepts of nationality and citizenship as analogous and uses the terms
interchangeably.
Ozden, Parsons, Schiff, and Walmsley 13
at International Monetary F
und on August 12, 2011
wber.oxfordjournals.org
Dow
nloaded from

redrawn as new countries emerged and others disappeared. In addition to creatingmillions of migrants overnight—as when the Soviet Union collapsed—these eventscomplicate the tracking of migrants over time. Third, even when national censusesof destination countries include data on international migrant stocks, the data arepresented along aggregate geographic categories rather than by country of origin.Data therefore need to be disaggregated to the country level. Finally, the greatesthurdle is dealing with omitted or missing census data. Very few destinationcountries—especially developing countries—have conducted rigorous censuses orpopulation registers during every census round over the second half of the twenti-eth century. Wars, civil strife, lack of funding, and political intransigence are but afew reasons why records may be discontinuous.
The main contributions of this article lie in identifying and overcomingthese challenges in order to construct a consistent and complete set of origin–destination matrices of international migrant stocks for 1960–2000, disaggre-gated by gender. The starting point is a master set of 226 origin or destinationcountries and regions. Despite border changes, all migrants are assigned to thismaster set so that migrations can be meaningfully tracked over time. Theseassignments, especially in cases where only aggregate data are available, aremade using several alternative propensity measures based either on a destina-tion country’s propensity to accept international migrants or on an origincountry’s propensity to send migrants abroad.
Cases of omitted data occur when destination countries do not collect orpublicly disseminate the information on migrants. When data from censusrounds are missing altogether, the approach taken depends on the extent of theomission (see appendixes 3 and 4). When sufficient data are available for otherdecades, interpolation is used. When not enough data are available, propensitymeasures are used to generate bilateral data. When a gender breakdown ismissing, gender splits are calculated based on supplementary statistics or otherdata in the matrices (see appendix 5). The resulting migration matrices shouldbe viewed as work in progress, but they are an important step in an ongoingglobal effort to improve migration data. The matrices can be readily updatedas additional or superior information surfaces, and they can easily be extendedto include future census rounds.
Bilateral datasets of international migration are rare. Attempts to createthem have focused almost exclusively on industrialized countries as destinationsbecause these countries have more accurate and more frequently produceddata. Harrison and others (2003) calculate bilateral remittances for thecountries of the Organisation for Economic Co-operation and Development(OECD) together with the 27 largest nonmembers. These estimates are basedon international bilateral migrant stock data that the authors also provide,although many of the data are derived from the Trends in InternationalMigration (OECD 2002). This report, published annually since 1973, wasarguably the most comprehensive guide to international migration for manyyears and has been the basis for many studies (see, for example, Mayda 2007).
14 T H E W O R L D B A N K E C O N O M I C R E V I E W
at International Monetary F
und on August 12, 2011
wber.oxfordjournals.org
Dow
nloaded from

More recently, the OECD has developed a database that provides a comprehen-sive overview of migration to OECD countries in 2000 (OECD 2008). These dataare disaggregated by a number of covariates including age, gender, educationalattainment, and place of birth. Another series of papers, again concentrating onthe OECD, examines the brain drain in 1990 and 2000 (see, for example,Docquier and Marfouk 2006); migrants’ gender (Docquier, Lowell, and Marfouk2009); age of entry (Beine, Docquier, and Rapoport 2007); and the medical braindrain (Bhargava and Docquier 2007). Parsons and others (2007) construct amatrix encompassing the entire world for the 2000 census round. Until now, thiswas the most comprehensive global overview of bilateral migrant movements.Ratha and Shaw (2007) use an earlier version of the dataset in a paper focusingon migration between developing countries (generally referred to as South–Southmigration in the literature) and bilateral remittance flows.
The data in the current article reveal several important patterns. Between1960 and 2000, the global migrant stock rose from 92 million to 165 million,but fell as a share of world population, from 3.05 percent to 2.71 percent.A large share of the stock in 1960 reflects the partition of India, and in alldecades migration within the Soviet Union (and former Soviet Union) accountsfor a large proportion of the world migrant stock. A majority of the remainingmigrant stocks is due mainly to increasing migration from developing countriesto the United States, Western Europe, and the Persian Gulf (referred to asSouth–North migration). While the growth in South–North migration hasbeen astonishing, North–North, North–South and South–South migrations allrepresent declining shares of world migration. Even so, South–South migrationdominates global trends numerically. The majority of these migrations areintraregional, within the countries of the former Soviet Union, South Asia, andWest Africa. Interregional migrations between developing countries areprincipally to the Persian Gulf countries.
The United States continues to be the most important destination, home toaround one fifth of the world’s migrant population and the recipient of thelargest migrant flows from no less than 60 countries. At the beginning of theperiod, most migrants in the United States were born in Europe; today the vastmajority come from Latin America and the Caribbean. This change in the com-position of migrant stocks mirrors the wider trend. In 1960, except formigration within the Soviet Union, the majority of migrants were born inEurope and South Asia. In 2000, migration from these regions remained impor-tant, but migration from Latin America, East Asia, North Africa, and theMiddle East is also prominent. The origin countries most affected by inter-national migration are small, typically island states, mostly in the Pacific or theCaribbean. The destination countries most affected by migration are thecountries of the New World (the United States, Canada, Australia, and NewZealand) and the oil-rich Persian Gulf countries.
The data clearly show that international migration is spreading across theglobe as migrants widen their destination choices. By 2000, a greater number
Ozden, Parsons, Schiff, and Walmsley 15
at International Monetary F
und on August 12, 2011
wber.oxfordjournals.org
Dow
nloaded from

of migration flows were observed between more country-pairs than at anyother time covered in this database. For example, migrants from East Asia andPacific who once migrated elsewhere within the region now constitute sizablecommunities across the world. An increasing number of Africans make theirhomes in Europe and the United States. This diversification is also reflected indestination countries’ willingness to accept migrants from ever more diversebackgrounds. This is particularly the case for the United States, Australia, NewZealand, and Canada, all of which select migrants based on qualificationsrather than country of origin.
The gender composition of international migration flows has also evolved.Although the global migrant stock is still disproportionately male, the percen-tage of women in the global migrant stock rose between 1960 and 2000. Thisincreased feminization of international migration is particularly pronounced inthe immigrant stocks of Latin America and the Caribbean, Japan, East Asiaand Pacific, and Sub-Saharan Africa. These four areas have also experiencedthe greatest increase in the proportion of female emigrants over the period.
The article is organized as follows. Section I discusses definitions of migrantsand how migrants are recorded, describes the raw data, and identifies gaps inknowledge. Section II considers the comparability of migration data and themajor challenges in constructing the matrices. It also discusses the conventionsand assumptions adopted in meeting the challenges. Given these assumptions,section III investigates the reliability of the estimates, and section IV analyzesthe data, highlighting the key patterns in international migration over1960–2000. Section V discusses some implications of the study.
I . P R E L I M I N A R I E S
Migration data are complex. They almost always come from destinationcountries, because it is difficult for origin countries to collect demographic dataon people who are not living in the country. Unlike trade and financial stat-istics, which are recorded by both transacting parties, the quality of migrationstatistics depends almost entirely on the rigor with which destination countriessurvey the migrants within their borders. In addition, destination countries’recording and dissemination methods can differ greatly. Understanding theanalysis in this article requires an understanding of the subtle differences invarious sources and definitions, together with an understanding of the inherentinconsistencies between them.3
Who Are Classified As Migrants?
The United Nations (1998, p. 6) defines a migrant as “any person that changeshis or her country of usual residence.” This broad definition implies a
3. This section highlights many of the nuances in the data, but for fuller treatment of the subject,
see Bilsborrow and others (1997).
16 T H E W O R L D B A N K E C O N O M I C R E V I E W
at International Monetary F
und on August 12, 2011
wber.oxfordjournals.org
Dow
nloaded from

movement from one location to another, the most relevant concept for econ-omic analysis. However, official records apply many different definitions ofwhat constitutes an international migrant. Most common criteria are based oncountry of birth, country of citizenship, purpose of visit or visa type, place oflast permanent residence, and duration of stay.
The two main definitions of migration—being born in or being a citizen of aforeign country—are used most consistently over time and across countries.Citizenship is important for determining an individual’s legal rights foremployment, voting, and access to public services. The place of birth definitionis superior for determining physical movement. Destination countries typicallypublish migration statistics by either category, mainly according to nationalmigration and citizenship laws. Historically, countries in the Americas andOceania favor the country of birth definition whereas countries in Asia, Africa,and Europe traditionally adopt a mix of the two definitions.
Individuals may be classified as migrants or nonmigrants depending on thedefinition. Many destination countries grant citizenship to foreign-born peoplewho are family members of citizens or who satisfy certain legal and residencerequirements. These naturalized citizens continue to be recorded as migrantsunder the foreign-born definition but not under the foreign citizen definition.Many destination countries (for example, the United States) grant automaticcitizenship to people born within their territory regardless of parents’ citizen-ship. Yet others, such as Japan, require at least one parent to be a citizen forchildren to acquire citizenship, even if they were born within its borders.Because of these differences in citizenship and naturalization laws, the numbersof migrants will be substantially higher in the United States if the foreign-borncriterion is used. In Japan, on the other hand, the number of migrants comesout higher under the foreign citizenship criteria.
Where data are available for both definitions, priority is given to data bycountry of birth, for several reasons. First, country of birth is more appropriatein analyzing physical movements and handling the cases of former colonies anddependencies.4 Second, while nationality can change, place of birth cannot.5
Third, naturalization rates vary enormously across destination countries.Differences in laws on citizenship criteria (for both migrants and their childrenborn in the destination country) do not affect data based on place of birth.
4. This discussion of definitions highlights the somewhat paradoxical possibility of individuals being
classified as migrants without ever having moved across an international border. As mentioned, this is
generally possible only in the case of people born in one country but who are citizens only of another
country. A similar situation arises with dependencies and former colonies. Residents of Martinique, a
French dependency, are automatically granted French citizenship. The statistics for Martinique show all
the domestic population as French, possibly leading one to think that Martinique is part of
metropolitan France or that most of the population moved to France. In such cases, having data
categorized by both foreign born and foreign nationality would enable differentiating between the
number of locally born inhabitants of Martinique who are French (referred to as Martiniquais), those
born in metropolitan France who moved to Martinique, and people from other countries.
5. Of course the country of birth may be redefined, as elaborated in the next section.
Ozden, Parsons, Schiff, and Walmsley 17
at International Monetary F
und on August 12, 2011
wber.oxfordjournals.org
Dow
nloaded from

Fourth, when migrants cannot be assigned to a specific origin, they are oftenrecorded under an aggregated umbrella heading. These categories embodyambiguity about a migrant’s origin, and since migrants are assigned to aggre-gated headings more frequently when the citizenship definition is used, theforeign born concept is again favored. Last, for migrants living in disputed ter-ritories, such as Kashmir and Western Sahara, an individual’s status or officialcitizenship may be unclear, while country of birth is usually more certain.
How Are Migrants Recorded?
Destination countries employ a wide range of tools to enumerate migrants,including population censuses, population registers and registers of foreigners,border statistics, and worker and residence permits.6 This article focuses oncensus and population register records, which are widely available, have thebroadest geographic coverage, and include similar questions, thereby yieldingmore standardized responses. For these reasons, they are the primary sourcesfor most data in the Global Migration Database. Where both censuses andpopulation registers are available, censuses receive priority.
Censuses, generally conducted decennially, are retrospective tools for survey-ing an entire population (or in some cases, a representative sample) at a singlepoint in time. In addition to their universal coverage, their greatest strength isthe inclusion of questions on place of birth and nationality. Censuses also typi-cally aim to enumerate the resident population, whether documented or undo-cumented (Bilsborrow and others 1997). So although some migrants have astrong incentive to provide false information to enumerators, many undocu-mented migrants will be captured in these matrices.7 The size and scope of thecensus questionnaires vary enormously, both over time and in different destina-tion countries. And there is potential variation in the quality of censuses bothacross countries and over time. Richer countries have many resources at theirdisposal to design questionnaires, train interviewers, employ statisticians, anddisseminate results. Researchers have little choice but to accept the data at facevalue. However, where the underlying census is clearly substandard (whenthere are errors that are obviously not coding errors or not easily corrected),these data are omitted from the analysis.
Popular in many parts of Europe, population registers are continuous report-ing systems providing up-to-date demographic and socioeconomic informationfor everyone surveyed. Typically, registers have evolved over time (from parishrecords, for example). They were never developed specifically to record inter-national migration information, and they vary considerably across countries.For example, the laws under which individuals are classified as migrants and
6. This article deals exclusively with migrant stocks. Nothing can be gleaned therefore about when
a migration took place, save for inferences that can be made by comparing differences in stocks over
time. Nor is anything known about the circumstances (such as visa type) under which an individual
entered a particular destination country.
7. The extent to which illegal migration is captured remains unknown.
18 T H E W O R L D B A N K E C O N O M I C R E V I E W
at International Monetary F
und on August 12, 2011
wber.oxfordjournals.org
Dow
nloaded from

the conditions under which they are inscribed or deregistered differ greatly(Bilsborrow and others 1997).
The Raw Data
The Global Migration Database is a vast collection of destination country datasources detailing migrant stocks from numerous origin countries and regions(United Nations (2008). Compiling and maintaining the underlying primarysources require herculean efforts to scour the key census collections of theworld and enter the data manually. In total, the database comprises recordsfrom some 3,500 separate censuses from more than 230 migrant destinationcountries and territories, by sex and age. Destination countries make numerousrevisions between census waves,8 and the database incorporates as many ofthese revised figures as possible.9
The starting point is to choose the most relevant source for each destinationcountry from each completed census round.10 Priority is given to data that aresuperior bilaterally and disaggregated by gender.11 Of the 3,500 sourcesdetailed in the overarching Global Migration Database, 1,107 were suitable foranalysis once repeated censuses were removed or combined. Of these, 951record data disaggregated by gender, as reported in table 1.
Despite the large number of primary sources, there are still inevitable gaps(table 2). This might be because a particular destination country did notconduct a census in a given decade or disseminate the relevant bilateral orgender-specific information. The majority of the migrants omitted from thesecensuses are in the Middle East and Africa. The countries of the Middle Eastare often reticent about releasing data, while many countries in Africa have along history of conflict. Nonetheless, the 68 countries for which there arecomplete data account for 68 percent of the world migrant stock in 2000. The17 countries for which there is only one census account for less than 2 percentof the total stock. The data for earlier decades reflect an identical pattern.
I I . H A R M O N I Z I N G T H E M A T R I C E S
Given the complexities of the underlying data, several major challenges arise inconstructing global bilateral migration matrices. The most critical wereexplained above. In some cases, there is no choice but to recognize that the
8. Census results are also often released in waves, typically beginning with preliminary estimates
and following with incremental releases of more detailed data.
9. The raw data are available at http://esa.un.org/unmigration.
10. Bhutan, Colombia, and El Salvador did not conduct censuses during the 2000 round; the
relevant censuses for 2005 or 2007 are included instead. Similarly, for seven countries without 1960
censuses, data from the 1950 census round are included. In these cases, each origin countries’ migrant
stock as a share of the total is calculated in 1950 and these shares are applied to the 1960 total.
11. There is little standardization in the age brackets that countries use to record migrants’ age. This
is the main reason why an analysis of migrants’ age is omitted from the current study.
Ozden, Parsons, Schiff, and Walmsley 19
at International Monetary F
und on August 12, 2011
wber.oxfordjournals.org
Dow
nloaded from

underlying processes that generated the data are less than ideal and to acceptthe data at face value. In others, every effort has been made to standardize thedata.
Defining the Master Country List
Over the period covered by the 1960–2000 censuses used to construct theglobal bilateral matrices of migrant stocks (1955–2004), the global politicallandscape underwent fundamental changes. Many countries, especially inAfrica, Oceania, and the Caribbean, gained their independence. Following theend of the cold war, many countries redrew their political boundaries. Somefragmented into smaller nation states, such as the Soviet Union,Czechoslovakia, and Yugoslavia, and others reunified following an extendedperiod of separation, such as Germany and Yemen.12
A single standard set of countries is specified for the entire timeframe of thedatabase, for both origin and destination locations, so that migration numbersfor pairs of countries can be compared over time. Since many new origin anddestination countries emerged during the study period, the most current set ofcountries and regions was chosen.
TA B L E 2. Number of Missing Census Rounds
Number of missing censusrounds
Number of destinationcountries
Share of world migration in 2000(%)
0 68 681 55 122 41 103 39 84 17 25 6 0Total 226 100
Source: Authors’ calculations based on data described in text.
TA B L E 1. Total Number of Database Sources
Censusround
Birthplacesources
Nationalitysources
Total nationalsources
Birthplace bygender
Nationality bygender
1960 124 67 149 103 641970 112 52 133 92 491980 145 86 164 117 801990 151 114 175 129 992000 134 122 161 118 100Total 666 441 782 589 392
Source: Authors’ calculations based on data described in text.
12. Small border changes and territorial disputes are ignored.
20 T H E W O R L D B A N K E C O N O M I C R E V I E W
at International Monetary F
und on August 12, 2011
wber.oxfordjournals.org
Dow
nloaded from

A region is defined as any geographic entity that conducts its own censusand that commonly features as an origin in the others’ censuses. For example,Western Sahara is omitted because it does not conduct a census although it is acommonly designated origin region. In all, 226 countries, territories, andregions are included in this list in each of the five migration matrices (seeappendix 1). One implication of these inclusion decisions is that migrationfrom Croatia to Germany, for example, is reported in every matrix, eventhough Croatia did not exist in the early time periods. Researchers interested inmigration from Yugoslavia to Germany in 1960 would simply total the individ-ual migration levels from the successor states of Yugoslavia. Performing theanalysis according to historical boundaries, though easier, would have maskedmany recent international movements. Moreover, drawing conclusions aboutdestination countries that no longer exist would offer policymakers less usefulinformation for drawing inferences.
Another complication is the 11 additional destinations with census data thatdo not map perfectly to the master list. Five of these were aggregated intoother countries in the master list: Christmas Islands (to Australia), CocosIslands (to Australia), Kosovo (to Serbia and Montenegro), South Yemen (toYemen), and West Germany (to Germany). Six additional countries or terri-tories no longer exist, but they map to two or more of the 226 locations on themaster list. These are the Gilbert and Ellice Islands, the former Yugoslavia,Czechoslovakia, Ruanda-Urundi, the Trust Territory of the Pacific Islands, andthe Soviet Union. Except for the Soviet Union, the census data for thesecountries or territories are disaggregated and distributed among the destinationcountries currently in existence on the basis of more recent migration figures.13
All of these assignments are made according to the distribution of immigrantsof the successor countries in later years.
The Soviet Union is a unique challenge. As mentioned, the enforcement ofnew borders and the creation of new nation states typically create new migrantsovernight. According to the foreign-born definition, people who cross newborders that are created with the break-up of a country are consideredmigrants, even if they moved before the break-up while the country was stillunified. This is particularly problematic in the case of the Soviet Union because15 new sovereign nations were created overnight, there have historically beenlarge numbers of internal migrants, and migrants have traditionally beenrecorded using a definition based on ethnicity. Failing to make any adjustmentfor the Soviet Union, therefore, would result in a large artificial jump in thenumber of migrants at the time of break-up (see appendix 3).
13. For example, the 1988 census data for the Trust Territory of the Pacific Islands were
disaggregated and distributed among the Marshall Islands, the Federated States of Micronesia, the
Commonwealth of the Northern Mariana Islands, and the Republic of Palau. However, in years when a
country conducted its own census but was also included in the census of a more aggregated region, the
country’s own census is prioritized.
Ozden, Parsons, Schiff, and Walmsley 21
at International Monetary F
und on August 12, 2011
wber.oxfordjournals.org
Dow
nloaded from
Last, specific adjustments are made in the case of Germany and the Republicof Korea. For Germany, bilateral data are available only by nationality.However, these data fail to take adequate account of the large number ofethnic Germans who arrived from other countries between 1944 and 1950(mainly expellees) and those who arrived after 1950 (mainly resettlers).Material from the German 2005 micro-census was therefore used to sup-plement the data for Germany (see appendix 3). In the case of Korea, data bynationality are readily available for each census round. However, these data failto account for the large numbers of migrants from the People’s DemocraticRepublic of Korea living in the Republic of Korea. Since the United NationsTrends in International Migrant Stock details the total migrant stock in theRepublic of Korea by the country of birth definition and because citizenship israrely granted to people from outside, it is simply assumed that the nationalitydata were comparable to the foreign-born definition. The nationality total wasthen subtracted from the UN total and the remaining migrants were assignedto the People’s Democratic Republic of Korea.
Recording and Recoding
There is little standardization in the recording and dissemination practices forcensuses across destination countries.14 The level of detail with which destina-tion countries record and disseminate migration data depends on the design ofthe original questionnaire. Some census questionnaires ask for a specificcountry of birth and others simply ask for a general geographic region, such asAfrica. Even if the original questionnaire asked detailed questions, somecountries disseminate data only on how many residents were born abroad orhave foreign citizenship. In general, three types of migrant origin are observedin the disseminated census data:
† Specific geographic regions: Some of these correspond to exactly one ofthe 226 countries and territories in the master list. Others pertain tolocalities that tend to be obscure territories, islands, or regions, such asthe Isle of Man or Ceuta.
† Aggregate geographic regions: These correspond to two or morecountries or territories in the master list. They can be continents (such asAfrica), parts of continents (such as South Asia), political alliances(European Union), or other classifications (such as Other Ex-FrenchAfrica; Algeria, Tunisia, and Morocco; and Melanesia). The data forthese aggregate regions need to be allocated to the 226 countries in themaster list. The details of the procedures are discussed below.
14. The United Nations (1998) has developed recommendations aimed at promoting standardized
recording practices across countries. Until such practices are followed uniformly, harmonization will
remain a key issue in understanding and comparing migration statistics.
22 T H E W O R L D B A N K E C O N O M I C R E V I E W
at International Monetary F
und on August 12, 2011
wber.oxfordjournals.org
Dow
nloaded from

† Miscellaneous categories: These include refugees, stateless, and born atsea. There are generally no geographic correspondences for these.
Thousands of geographic regions and categories emerged from the morethan one thousand individual destination country sources chosen for theanalysis. The vast majority of these are repetitions that refer to identicalgeographic locations using different expressions. For example, French UpperVolta and the Republic of Upper Volta were relabeled Burkina Faso. In theend, 292 specific geographic regions (first bullet above) and 236 aggregategeographic regions (second bullet) were identified. The 292 specific regionsinclude the 226 countries and territories in the master list and 66 othersingle locations that can be assigned to one of the 226 in the master list(see appendix 2).15
The 236 aggregate geographic regions pose larger problems. The migrantsoriginating from a given aggregate geographic area need to be allocated to theindividual countries that comprise that area. This is one of the greatest difficul-ties in this project, and resolving it is one of the main contributions of thiswork. Several propensity measures were developed depending on the quality ofthe data. They are based either on a destination country’s propensity to acceptmigrants from a particular origin or on origin countries’ propensity to sendmigrants abroad. These propensity shares are then calculated, and the resultingnumber of migrants are assigned, in order of quality, to specific origincountries in the master list.
Finally, the miscellaneous categories also needed to be dealt with consist-ently to enable meaningful comparisons between country pairs. There is oftena high number of nonresponses to the question about place of birth for foreign-born residents (Bilsborrow and others 1997, p. 60). As a result, some censusesreport large numbers of people whose place of birth is unknown. All these indi-viduals are assumed to be natives in the analysis since it is unclear whetherthey are domestically born or foreign born. These entries are therefore deletedfrom the matrices. In other cases, calculations were made to check whetherthese totals contributed to the foreign born in each census. In most circum-stances they did not, and so they were dropped. In cases when these totals didrefer to migrants, they were treated as an appropriate aggregate category to beassigned later, as detailed below. Finally, all categories referring to the “state-less”16 were dropped because despite their importance as a minority group inglobal migrant patterns, there is no way to meaningfully assign them to anorigin.
15. For example, the Vatican is assigned to Italy, Wake Island to the United States, and Labuan to
Malaysia.
16. Some estimates put the number of stateless people (those lacking any citizenship) as high as 11
million, although many of these people will not be captured in censuses. The stateless represent an
important category of migrants; for more information, see www.unhcr.org/pages/49c3646c155.html.
Ozden, Parsons, Schiff, and Walmsley 23
at International Monetary F
und on August 12, 2011
wber.oxfordjournals.org
Dow
nloaded from

Disaggregation of Aggregate Categories
The disaggregation of the 236 origin regions identified in the censuses is one ofthe key steps in creating the bilateral migration matrix. Three propensityequations are used to allocate migrants to one of the 226 countries in themaster list. Each measure varies in quality depending on the availability ofunderlying data. The preferred option is to use migration data from the destina-tion country for the relevant year. If this option is not available, informationfrom the destination country for other years is used. Should that not be poss-ible, subregions17 are created, and countries with insufficient data are assumedto have a similar propensity to accept migrants as other countries in the subre-gion. Failing this option, global propensity measures are constructed.18 Morethan a single method of allocation is chosen so that the data already in thematrices can be used to maximum effect. All these allocations ignore thegender profile of migrants. This dimension is accounted for at a later stage,once all the aggregate categories have been assigned.
Varying Survey Dates
During the 10-year window of each census round, there are no conventions onwhen a destination country should conduct its census. Although many destina-tion countries conduct their censuses at the turn of the decade, the actual dateis up to each country. Attempting to standardize census dates would requirechanging the numbers reported in the original census documents.
Most destination countries conduct their census within two years of themiddle year of each census round—between 1998 and 2002 for the 2000census round, for example (table 3). The census numbers thus are not changed,and the matrices report all censuses as comparable in each round. A full list ofcensus dates is in appendix 1. An alternative version of the database that hasbeen mapped to the United Nations (2006, 2009) Trends in InternationalMigrant Stock database is available from the authors. These data are standar-dized over time in terms of the years to which they refer.
Calculating Missing Gender Splits
Although common in the underlying data, bilateral migration data disaggre-gated by gender are sparser than aggregate migrant totals (see table 1). Animportant contribution of the current work is in estimating the gender break-down of all migrants in destination countries in the global migration matrices.Similar to the allocation from aggregated categories in the Global Migration
17. The subregions used for the disaggregations are the 21 UN regions (see http://unstats.un.org/
unsd/methods/m49/m49regin.htm, with the countries of Oceania aggregated into a single subregion.
They do not match the large World Bank regions used in the analysis in section IV.
18. While this propensity measure is clearly inappropriate, less than 1 percent of all migrants and
observations are assigned on this basis. This method is included so that every migrant in the underlying
data is accounted for.
24 T H E W O R L D B A N K E C O N O M I C R E V I E W
at International Monetary F
und on August 12, 2011
wber.oxfordjournals.org
Dow
nloaded from

Database to specific origins in the master list, two measures are used forcalculating gender splits; they are described in appendix 5.
Combining Migrant Definitions
Only a single definition of a migrant (foreign born or foreign citizen) can beapplied to each destination country in the final matrices. Switching definitionsover time for the same destination country would yield inconsistent data.Priority is given to the foreign-born definition, and these data are always usedif at least three censuses using that definition and with detailed bilateral infor-mation are available for a particular country. However, only nationality dataare available for many destination countries. For countries such as Japan thatrarely offer citizenship to foreigners, this does not pose much of a problemsince foreign-born and nationality data will be very similar. For other destina-tion countries, including data based on the nationality concept will lead to dis-parities. When fewer than three foreign born data sources are available and thenationality data are of superior quality, the nationality definition is chosen (seeappendix 1). Where fewer than three data points by either definition are avail-able, several assumptions are made to fill the missing data.
Missing Censuses and Census Data
The final hurdle in constructing the global migration matrices is dealing withomitted data. No census round is truly complete since no round has everincluded every country in existence at the time. Censuses are expensive becauseof their universal coverage and labor intensity. For those reasons, manycountries have started to conduct censuses only recently (Bhutan began in2005). Censuses can also be abandoned because of civil unrest or military con-flict. They can also be politicized, because they can be used to estimate the sizeof a particular ethnic group. In other words, data may simply never be releasedeven if they are collected. Nor is there any guarantee that a question on nation-ality or country of birth will even be included in the census questionnaire.Many countries in Central Asia, as well as Fiji, Sri Lanka, and Tonga, have insome years included questions on ethnicity instead, which is useless for
TA B L E 3. Percentage of Censuses Conducted during the Middle of eachCensus Round
Census round Censuses by birthplace Censuses by nationality
1960 78 661970 71 711980 78 591990 80 582000 84 57
Source: Authors’ calculations based on data described in text.
Ozden, Parsons, Schiff, and Walmsley 25
at International Monetary F
und on August 12, 2011
wber.oxfordjournals.org
Dow
nloaded from

identifying migrants. For all these reasons, inevitable gaps in the data emerge(see table 2).
Three conventions are adopted for constructing missing data. The one thatis ultimately used depends on how many data are missing and for whichdecades these data are missing relative to the decades for which data areavailable.
MISSING IN-BETWEEN DECADES. Where data are missing for a particular decadebut are available for the decade before and after, a linear trend is assumedbetween the earlier and later bilateral data. In total, 86 country-years of datawere interpolated using this method.
MISSING BEGINNING OR END DECADES. Where the data are missing at the begin-ning or the end of the time period, the destination country is assumed to havethe same bilateral migrant composition as in the decade closest to the missingperiod. The bilateral shares from the closest decade for which data are avail-able are applied to the destination country’s total number of migrants for themissing decade. The information comes from one of two sources. In somecases, the census provides the total number of migrants without any bilateralinformation. If these data are not available, the total from the closest decade istaken and adjusted for growth in migration. The growth rates are taken fromTrends in International Migrant Stock, which details total migrant stocks forall countries in the world at five year intervals (United Nations 2006).19 Themissing end decades are calculated for 116 countries for which data arelacking, most of them for the 1960s and 1970s.20 Trends in InternationalMigrant Stock database thus can be used to estimate growth rates by estimatingmissing totals in years for which censuses are not available, and it provides aconsistent set of totals over time for countries for that have data of insufficientquality.
An important difference between the matrices presented in this article andthe Trends in International Migrant Stock database is the treatment of refugees.While refugees are generally enumerated in developed country censuses, this isnot always the case for developing countries. Refugees interned in camps areless likely to be surveyed at the time of census. Making allowances for theserefugees, the Trends in International Migrant Stock database adds to thenumber of migrants refugees reported by the United Nations Refugee Agencyand the United Nations Relief and Works Agency for developing countries thatare not likely to have included the refuges in their census data. Since themajority of developed countries record refugees alongside other migrants on abilateral basis, there are normally no remedial measures for removing them.
19. The 2008 revision includes data only for 1990–2010. To ensure consistent figures over time, the
2005 revision, which covers 1960–2005, was used instead.
20. Taiwan, China, and Norfolk Island pose an additional problem, since the United Nations does
not provide data for these locations, so migrant totals in other years cannot be calculated. For these two
areas, therefore, the numbers of migrants are set to zero in the earlier decades for which data are
lacking.
26 T H E W O R L D B A N K E C O N O M I C R E V I E W
at International Monetary F
und on August 12, 2011
wber.oxfordjournals.org
Dow
nloaded from

Similarly, for developing countries for which no census data are available, it isimpossible to know whether the numbers contained in Trends in InternationalMigrant Stock database include refugees. For the cases that rely on the Trendsin International Migrant Stock database, the number of refugees is subtractedfrom the totals, with the intention of removing refugees in camps from thetotal, since the focus is on economic migration.21
COUNTRIES WITH VERY POOR DATA. For the 59 destination countries for whichthere are two or fewer census data points, it is impossible to meaningfullyinterpolate missing census totals or bilateral numbers. In these cases the censustotals detailed in the Trends in International Migrant Stock are used. This hasthe advantage of ensuring consistent totals for the number of migrants in eachof the five census periods. The average bilateral shares from the censuses withdata are then applied to these totals to derive bilateral data for each censusround.
Finally, there are six destination countries for which bilateral data are com-pletely lacking.22 In these cases, data for all the other countries in the subregionare used to calculate the propensity of every country in the destination subre-gion to accept migrants from elsewhere in the world. All of the propensitiessum to one. These shares are multiplied by the total migrant stock figures pro-vided in the Trends in International Migrant Stock database to calculate thebilateral numbers.
I I I . R E L I A B I L I T Y O F T H E E S T I M A T E S
The previous section described the challenges in constructing the matrices andthe range of measures used to generate the missing observations. This sectionhighlights the extent to which the estimates are based on the underlying rawdata and their reliability.
Categorizing the Methods Used
Nine main methods were used to generate the cells:
(1) Pure raw: Derived directly from the raw bilateral census data.(2) Raw scaled: Based on the underlying raw bilateral data scaled to the UN
numbers.(3) Pure remainder: Assigned directly from the disaggregation of aggregate
categories applying one of the propensity measures.
21. In the case of Palestine, for which the UN totals consist entirely of refugees, these totals are not
removed. It is possible to calculate migrant totals for Palestine in other decades.
22. The six countries are China, Eritrea, Maldives, Qatar, Somalia, and Democratic People’s
Republic of Korea. Of these, Eritrea, and Somalia have been affected by conflict. China has conducted
censuses over the period, but their definition of migration is not compatible with the definitions used
throughout the article.
Ozden, Parsons, Schiff, and Walmsley 27
at International Monetary F
und on August 12, 2011
wber.oxfordjournals.org
Dow
nloaded from

(4) Remainder scaled: Based on disaggregations using one of the propensitymeasures and then scaled to the UN numbers.
(5) Raw and remainder combined not scaled: Based primarily on bilateralraw data and to which disaggregations of certain aggregate categorieswere added.
(6) Raw and remainder combined scaled: Similar to R&R not scaled exceptthat the resulting value was scaled to the UN numbers.
(7) Pure interpolation: Calculated solely by interpolating missing end andmiddle censuses, but not scaled to the UN data.
(8) Interpolation and scaled: Both interpolated and scaled, for countrieswith poor data or for cells calculated by interpolating missing and enddecades which then had to be scaled.
(9) Missing: For countries for which bilateral data were missing for everycensus round, such as Somalia.
The data used in the first six methods are from the raw census data. The datafor the last three methods are missing because of omissions in the underlyingdata and need to be filled. Therefore, varying percentages of observations ineach decade are assigned by the methods described (table 4). In 1960, 59percent of observations are directly assigned from the raw bilateral data orfrom one of the disaggregations of the aggregate raw data (the first six cat-egories). By 2000, this proportion rises to 69 percent. However, these obser-vations account for some 84 percent of the total number of internationalmigrants in 1960 (table 5). This proportion rises to 86 percent by 2000because a small number of corridors (cells) account for a large proportion ofglobal migration stocks. The bulk of the remaining international migrants areassigned on the basis of interpolation.
Among the first six categories that are based on raw census data, three cat-egories (raw scaled, R&R not scaled, and R&R scaled) are constructedthrough the summation of bilateral raw numbers and disaggregations of someaggregate categories in the original censuses. Since these categories togetherconstitute around 45 percent of migrants in each census round, the originalbilateral portion of each cell was compared with the final number assigned tothem after the various calculations as a check on accuracy. For each decade,therefore, the overall percentage contribution of the raw bilateral data to thetotal is calculated (table 6).23 In each census round, at least 92 percent of allthose categories are derived from the raw data.
Simulating Missing Data
Finally, to examine the reliability of the estimated missing census data and testthe methodologies, several scenarios are assumed. All bilateral observations for
23. Although only aggregates for each decade are presented here, a full matrix detailing exactly how
each cell was generated is available from the authors.
28 T H E W O R L D B A N K E C O N O M I C R E V I E W
at International Monetary F
und on August 12, 2011
wber.oxfordjournals.org
Dow
nloaded from

TA
BL
E4
.Per
centa
ge
Dis
trib
uti
on
of
Obse
rvat
ions
by
Alloca
tion
Met
hod
Cen
sus
round
Pure
raw
Raw
scale
dPure
rem
ain
der
Rem
ain
der
scale
d
Raw
and
rem
ain
der
com
bin
ed
Pure
inte
rpola
tion
inte
rpola
tion
and
scale
dM
issi
ng
Not
scale
dSca
led
1960
12.3
10.1
340.6
53.3
42.1
20.0
224.8
612.5
83.9
81970
12.0
70.0
234.8
82.0
32.5
40.1
733.6
410.6
83.9
81980
12.0
00.1
545.7
65.9
04.2
80.1
518.8
88.9
13.9
81990
13.8
20.2
747.1
35.8
86.5
00.0
615.2
37.1
23.9
82000
12.8
51.0
239.9
74.2
910.4
10.8
610.6
615.9
73.9
8
Sourc
e:A
uth
ors
’ca
lcula
tions
base
don
dat
ades
crib
edin
text.
Ozden, Parsons, Schiff, and Walmsley 29
at International Monetary F
und on August 12, 2011
wber.oxfordjournals.org
Dow
nloaded from

TA
BL
E5
.Per
centa
ge
Dis
trib
uti
on
of
Mig
rants
by
Alloca
tion
Met
hod
Cen
sus
round
Pure
raw
Raw
scale
dPure
rem
ain
der
Rem
ain
der
scale
d
Raw
and
rem
ain
der
com
bin
ed
Pure
inte
rpola
tion
Inte
rpola
tion
and
scale
dM
issi
ng
Tota
l(m
illions)
Not
scale
dSca
led
1960
28.6
18.7
37.1
00.5
139.2
30.2
04.7
210.5
10.4
092.3
1970
42.9
40.0
04.0
11.9
734.2
50.2
512.0
04.1
10.4
6102.4
1980
30.1
20.2
34.4
20.0
748.7
70.1
411.3
14.6
40.3
0118.6
1990
36.6
10.5
54.7
90.3
543.0
70.1
510.0
53.8
40.5
8139.4
2000
35.6
21.1
87.5
60.3
340.2
21.0
77.0
86.2
30.7
2165.3
Sourc
e:A
uth
ors
’ca
lcula
tions
base
don
dat
ades
crib
edin
text.
30 T H E W O R L D B A N K E C O N O M I C R E V I E W
at International Monetary F
und on August 12, 2011
wber.oxfordjournals.org
Dow
nloaded from

a single year for four countries (Australia, United States, Switzerland, andChile) in different parts of the world are deleted and the missing cells are filledusing one of five methods.24 The first simulation assumes that all bilateral datafor 2000 are missing but that the total number of migrants is available. Themissing bilateral numbers then have to be filled using the propensity measure(equation 1 in appendix 4) based on the data available in other years. Thesecond and third simulations assume that the total is missing as well, andinterpolation is used to fill in all missing data for 1960 and 2000. The fourthand fifth simulations remove all data for all years and then fill the missingyears using data for the remaining portion of the subregion (table 7).
The simulations perform well. The four countries are examined one at a time,starting with Australia. The correlation coefficient between the predicted andactual data in each simulation is at least 0.945. Interpolating the data is the mostaccurate method of predicting the missing data, and simulation 2 for 1960 ismore accurate than simulation 3 for 2000. Simulation 1 does not perform aswell: the data from other years fail to adequately account for the fairly signifi-cant shift in the composition of the Australian immigrant stock after 1990.When simple subregional shares are used (simulations 4 and 5), the correlationcoefficients remain high. The actual distribution of immigrants, however, is lessaccurate, especially in simulation 5. This is because New Zealand, the countryin the subregion that has by far the greatest weight for apportioning migrantsfor Australia’s missing data, did not experience the same influx of migrants fromAsia that Australia did. In other words, Australia represents such a large share ofimmigration in Oceania that when it is removed, the remaining countries(mostly small island countries that are origins, not destinations) are not particu-larly accurate predictors of migration to Australia.
The U.S. case is similar. Using interpolation to fill in the missing yearsproves effective, while the results from simulation 1 are also reasonable. Theresults from simulations 4 and 5 are less accurate. The problem with usingregional shares for calculating missing coefficients for the United States issimilar to that for Australia. The poor results are due to the differences in themigrant profiles of the United States and Canada, which provides the weights
TA B L E 6. Contribution of Raw Bilateral Data to the Total
Census round Accounted for by “raw” data (%)
1960 95.91970 92.51980 92.51990 92.12000 93.6
Source: Authors’ calculations based on data described in text.
24. For all countries, data quality is highest for 2000 and lowest for 1960, except for Chile, for
which 1980 has the worst quality data.
Ozden, Parsons, Schiff, and Walmsley 31
at International Monetary F
und on August 12, 2011
wber.oxfordjournals.org
Dow
nloaded from

TA
BL
E7
.Fiv
eSim
ula
tions
Tes
ting
the
Rel
iabilit
yof
Gen
erat
edC
ells
wit
hM
issi
ng
Dat
a
1Pro
pen
sity
(2000
rem
ove
d)
2In
terp
ola
tion
(1960
rem
ove
d)
3In
terp
ola
tion
(2000
rem
ove
d)
4M
issi
ng
(1960
rem
ove
d)
5M
issi
ng
(2000
rem
ove
d)
Countr
yC
orr
elat
ion
coef
fici
ent
Log
rati
oC
orr
elat
ion
coef
fici
ent
Log
rati
oC
orr
elat
ion
coef
fici
ent
Log
rati
oC
orr
elat
ion
coef
fici
ent
Log
rati
oC
orr
elat
ion
coef
fici
ent
Log
rati
o
Aust
ralia
0.9
45
–0.5
75
0.9
98
–0.0
67
0.9
90
–0.1
26
0.9
54
–0.2
42
0.9
46
–1.3
02
Unit
edSta
tes
0.8
93
–0.2
43
0.9
61
0.1
69
0.9
72
–0.2
62
0.5
96
0.2
84
0.2
50
0.1
24
Sw
itze
rland
0.7
71
0.3
93
0.9
71
0.0
41
0.9
00
–0.3
12
0.8
99
–0.0
06
0.8
18
0.0
10
Chile
0.6
88
0.0
59
0.9
97
0.1
83
0.8
97
0.0
38
0.4
98
–0.0
80
0.3
76
0.0
09
Note
:A
cuto
ffof
250
mig
rants
isim
ple
men
ted
for
calc
ula
ting
the
log
rati
os
since
they
can
be
hig
hly
skew
edby
the
pre
dic
tions
of
very
small
corr
idors
.
Sourc
e:A
uth
ors
’ca
lcula
tions
base
don
dat
ades
crib
edin
text.
32 T H E W O R L D B A N K E C O N O M I C R E V I E W
at International Monetary F
und on August 12, 2011
wber.oxfordjournals.org
Dow
nloaded from

for filling in the missing U.S. values. This methodology significantly underpre-dicts the numbers of migrants from U.S. dependencies, since Canada hosts veryfew of them, and overpredicts the numbers from former British colonies, popu-lations that are more prominent in Canada.
Simulations 4 and 5 perform extremely well for Switzerland: the deviationsfrom the actual data are less than 1 percent. This is due to the fact that severallarge Western European nations have similar migrant profiles to Switzerland,unlike the case for Australia and New Zealand and the United States andCanada. The data for 1970–2000 prove better for interpolating the missingdata for Switzerland for 1960, while the data for earlier years are somewhatless effective at predicting the missing data for 2000.
The results for Chile are also good. Using the data for Chile in other yearsand the propensity measures yields a margin of error that is under 6 percent(simulation 1). Interpolation proves accurate when data for either 1960 or 200are removed. With subregional shares, the differences in the log ratios are small,but the correlation coefficients are not as high as in other cases because Chile’simmigrant profile is bimodal. Chile has a small number of large immigrantstocks and a large number of very small stocks. Although the predictions for thesize of the stocks are reasonable, the relative rankings are not as accurate.
The results indicate that interpolation is the most effective method of allo-cation, although the allocations based on the propensity measures and on thesubregional shares fair reasonably well. This is heartening, since around aquarter of the observations and 14 percent of the world migrant stock is allo-cated for 2000 using interpolation. Filling a missing country-year of data usingpropensities is less effective. Even so, the correlations remain high and the result-ing data are not sufficiently inaccurate to warrant throwing them away. It isimportant to remember, however, that simulation 1 represents a worst case. Thisextreme measure is resorted to only for a few countries for which data aremissing. In almost every case, aggregate categories are much narrower in the rawdata. Nevertheless, even with this constrained method with extreme assumptions(missing all data for a country in a region with very few comparable countries),the results seem reasonable. And even when the results are skewed, this is gener-ally due to the over- or underpredicting of a handful of key migrant corridors.
Finally, the aggregate figures obtained are compared with those from theTrends in International Migrant Stock database (United Nations 2006, 2009)to highlight key differences. The database provides data by destination only,not for each bilateral corridor, so only aggregate numbers can be compared.For this comparison, mid-year estimates of the world migrant stock for 1990–2000 are taken from the 2008 edition and estimates for the earlier censuses,1960–1980, are taken from the 2005 edition (table 8). The analysis subtractsthe estimated number of refugees from the total mid-year estimates of theworld migrant stock from the Trends in International Migrant Stock databaseto yield the net number of migrants in each decade. These numbers are thencompared with the decadal estimates generated through this project, both the
Ozden, Parsons, Schiff, and Walmsley 33
at International Monetary F
und on August 12, 2011
wber.oxfordjournals.org
Dow
nloaded from

total and the net, after subtracting estimates of migrants within the SovietUnion for 1960–1980 (data for 1990 and 2000 should be directly comparable)and the number of ethnic German migrants added to the German censuses.
The aggregate estimates are remarkably close (the two net totals), differingat most by around 1 million migrants, except in 1990. There are several poss-ible explanations for these differences. First, the census totals from the currentwork may not match because censuses do not always make allowances for tem-porary workers. For example, Singapore’s official 2000 census records 563,430foreign-born migrants. The United Nations, however, reports 1,351,806foreign-born migrants for 2000. Second, there are cases where the currentstudy reports data by nationality, but the corresponding figure in the Trends inInternational Migrant Stock refers to the foreign born. This situation generallyarises when a census does not report the number of foreign-born migrants on abilateral basis. Examples include Austria and Cote d’Ivoire. Third, differencesin the years to which the data refer can generate large disparities. For example,this study uses the 1966 data for Australia, whereas Trends in InternationalMigrant Stock reports data for 1970. Overall, however, the fact that the totalsare remarkably close in every decade adds credence to the estimates here.
I V. T H E E V O L U T I O N O F G L O B A L B I L A T E R A L M I G R A T I O N
The greatest strengths of the global migration matrices are their bilateral cover-age, the number of decades covered, and the disaggregation by gender. Thesedata are too rich for a full analysis of all movements between all pairs ofcountries. Instead, this section summarizes the major trends in the evolution ofbilateral migrant stocks, based primarily on World Bank regions.25
TA B L E 8. Comparison of Aggregate Numbers with the United Nations Trendsin International Migrant Stock Database
Census round
Unite Nations database Current study
Net totalTotal Refugees Net total Total Within the Soviet Union Germans
1960 75.5 2.2 73.3 92.3 15.8 3.7 72.7
1970 81.3 3.9 77.4 102.4 21.0 3.8 77.6
1980 99.3 9.1 90.2 118.6 23.6 3.8 91.3
1990 155.5 18.5 137.0 139.4 – 4.7 134.7
2000 178.5 15.6 162.9 165.3 – 3.8 161.5
Source: Authors’ calculations based on data described in text and United Nations (2006,2009).
25. Appendix 1 details the World Bank regions: South Asia, East Asia and Pacific, Sub-Saharan
Africa, Latin America and the Caribbean, Europe and Central Asia, and Middle East and North Africa.
High-income Middle East and North Africa refers to the predominantly oil producing countries in the
Persian Gulf (Bahrain, Kuwait, Oman, Qatar, Saudi Arabia, and the United Arab Emirates) and to
Israel.
34 T H E W O R L D B A N K E C O N O M I C R E V I E W
at International Monetary F
und on August 12, 2011
wber.oxfordjournals.org
Dow
nloaded from

Global Trends
The migration matrix for the 1960 census round reflects a realigning world inthe postcolonial era. Over the 1960–2000 period, the composition of worldmigration fundamentally changed, driven by world events and increasinglyselective immigration policies in developed countries, which led to greatlydiversified migrant stocks. Mirroring this pattern, most countries now sendmigrants to an increasing number of destinations. Migration to developingcountries has been driven largely by the partitioning of India26 and thebreakup of the Soviet Union, both events that need be reconciled when inter-preting the data. However, while the United States and Western Europeremained throughout the most important destinations, there have been signifi-cant migration movements to the other countries of the ‘New World’(Australia, New Zealand, and Canada) as well as to the oil-rich Persian Gulfcountries (primarily from South and East Asia), reflecting a huge increase indemand for labor following the oil shocks of the 1970s.
Between 1960 and 2000, the total global migrant stock increased from92 million to 165 million.27 At the beginning of the period, one fifth of theworld’s migrant population was born in Europe, and one sixth was attributableto the partition of India and migration within the Soviet Union. Two-thirds ofthe growth up to 2000 was due to migrant flows to Western Europe and theUnited States, and the rest was due mostly to increased mobility between thecountries of the former Soviet Union, the emergence of the Gulf States as keymigrant destinations, greater intra-Africa migration flows, and migration toAustralia, New Zealand, and Canada. The number of migrants in South Asiafell over the period, reflecting a falloff after the migrations that followed par-tition (see figure 2 later in this article). Despite the sustained increase in theglobal migrant stock over the period, migrants declined as a share of the worldpopulation between 1960 and 1990 (from 3.05 percent to 2.63 percent), thenrose again slightly to 2.71 percent in 2000.
The importance of migration for destination and origin countries dependson the size of the migrant stock relative to the population. As might beexpected, many countries with the highest concentrations of immigrants aresmall countries with comparatively few people. The countries or territorieswith a population or more than 1 million people and immigrant ratios over20 percent in 2000 include the United Arab Emirates (41 percent), Kuwait (38percent), the Occupied Palestinian Territories (31 percent), Israel (25 percent),and Oman (20 percent). Countries with immigrant ratio less than 1 percentinclude Indonesia, Madagascar, and Cuba. By destination subregion, migrationhas become more concentrated in all developed country regions and less
26. It is not possible to differentiate among migrants who moved before, during, or immediately
after the partition of India because these migrations occurred before the beginning period of the
matrices.
27. This increase would be starker had it not been for the special treatment of the Soviet Union.
Ozden, Parsons, Schiff, and Walmsley 35
at International Monetary F
und on August 12, 2011
wber.oxfordjournals.org
Dow
nloaded from

concentrated in many developing country regions, especially South andSoutheast Asia, South America, and Southern, Eastern, and Central Africa.
Emigration ratios (ratio of emigrants to the sum of the emigrant and dom-estic populations) were calculated for origin countries. Unsurprisingly, smallisland states and those experiencing political upheaval or environmental cata-strophe have the highest emigration concentrations. In 2000 these includedNiue (80 percent), Tokelau (64 percent), Montserrat (56 percent), CookIslands (53 percent), and Palau (47 percent). Countries or territories with morethan 1 million residents and the highest emigration concentrations includeJamaica (26 percent), the Occupied Palestinian Territories (24 percent),Albania (23 percent), Bosnia and Herzegovina (23 percent), Republic ofIreland (23 percent), and Armenia (22 percent). Those at the other end of thespectrum include Mongolia (2 percent), Madagascar (4 percent), Ethiopia(4 percent), and Brazil (5 percent). By subregion of origin, emigrant concen-trations have remained far more stable over the period than immigrant ratiosacross most of the world. Notable changes have occurred, however, in emigra-tion ratios in the Pacific and the Caribbean and Central America (higher) andSouth Asia (lower).
Global Migration between the “North” and the “South”
Dividing the world into two regions, the North (developed countries) and theSouth (developing countries),28 highlights some of important patterns under-pinning international migration over the second half of the twentieth century.The number of migrants from the North remained fairly stable, while thenumber from the South increased (figures 1 and 2). Much of the growth in thenumber of migrants is driven by migrations from the South to the North,which rose from 14 million to 60 million between 1960 and 2000.
Numerically, South–South migration dominates global trends, although thismigration is declining as a proportion of total world migration. In 1960,South–South migration accounted for 61 percent of the total migrant stock; by2000, it had fallen to 48 percent. When the migrant-creating effects of SouthAsia and the Soviet Union are factored in, however, South–South migrationremains stable over the period, at about a quarter of the total (see figure 2). Asa proportion of total migrant stock, only South–North migration rose between1960 and 2000. Increasingly liberal immigration policies in developedcountries have been paralleled by large movements from developing countries.The data show that the proportion of world migration attributable to South–North migration rose from 16 percent to 37 percent. This dramatic increase is
28. The developed countries are Australia, Canada, Japan, New Zealand, the United States, and the
EU-15 and the European Free Trade Association, which have all been relatively affluent over the entire
period of interest. The EU-15, rather than some other European Union grouping, is included because
the latest year to which the data refer is 2004. All other countries are classified as developing.
36 T H E W O R L D B A N K E C O N O M I C R E V I E W
at International Monetary F
und on August 12, 2011
wber.oxfordjournals.org
Dow
nloaded from

unquestionably one of the defining trends of the period, surpassing migrationbetween developed countries from 1970 to 1980, both in numbers and as aproportion of the total migrant stock.
FIGURE 2. Changes in the Share of Migrants by Migration Corridors,1960-2000 (percentage contribution)
Source: Authors’ calculations based on data described in text.
FIGURE 1. Changes in the Number of Migrants in Developed to DevelopingCountry Migration Corridors, 1960–2000
Source: Authors’ calculations based on data described in text.
Ozden, Parsons, Schiff, and Walmsley 37
at International Monetary F
und on August 12, 2011
wber.oxfordjournals.org
Dow
nloaded from

Global Migration to Developed Countries
The growth in the South–North migration has been driven largely by move-ments to the United States and Western Europe. Between 1960 and 2000,migrant stocks grew by 24.3 million in the United States and 22 million inWestern Europe, accounting for some 42 percent of the world total in 2000.However, there are notable differences in the migrant compositions of thesetwo regions. Whereas the U.S. immigrant profile has changed dramatically,Europe’s has remained more stable, reflecting in part its continuing ties withformer colonies.
Immigration to the United States in 1960 was dominated by Europeans,who accounted for around 60 percent of the total and 6 of the top-10 migrantcorridors. Of the 10.4 million migrants in the United States at that time, 1.26million were born in Italy, 990,000 in Germany, 835,000 in Great Britain,750,000 in Poland, 360,000 in Ukraine, 340,000 in Ireland, and 305,000 inAustria. By 2000, the share of these origin countries declined, to around 15percent. Balancing this trend, the number of migrants from Latin America andthe Caribbean and East Asia and Pacific rose sharply. In 2000, 52 percent ofthe immigrant stock in the United States were born in Latin America and theCaribbean and 17 percent in East Asia and Pacific.
The United States is an important destination for migrants from all regionsexcept Southern and Central Africa. In 2000, the United States received thelargest number of migrants29 from 60 countries, including Germany, Vietnam,Cuba, and the Republic of Korea. Moreover, 13 of the 50 largest migrationcorridors in the world and 6 of the 10 largest South–North corridors in 2000were to the United States. The two largest corridors to the United States werefrom Mexico and the Philippines, the largest and 12th largest developing todeveloped country migration corridors in the world. They accounted for 10.8million migrants, equivalent to 31 percent of the migrant stock in the UnitedStates, or nearly 7 percent of the world migrant stock.
Western Europe has been instrumental in many of the largest migrations inhistory, as both a major sending and receiving region. Between 1960 and 2000,many Western European countries transformed from net migration senders tonet migration receivers. Today, Western Europe remains a key destinationregion for migrants from every other part of the world except the high-incomeMiddle East and North Africa region. Increasingly over the period, WesternEuropeans began migrating to other countries in the region. In 2000, two-fifthsof Western European migrants lived elsewhere in Western Europe, drivenlargely by the expansion and economic and political integration of theEuropean Union. This is a significant increase from 1960, when far greaternumbers of Europeans chose to migrate to the United States and to Latin
29. Migration corridors are discussed to highlight the most important global migrant stocks; at no
point does the discussion relate to migration flows. The focus is on stock data, and the term “migration
corridor” simply refers to the bilateral migrant stock for a particular pair of countries.
38 T H E W O R L D B A N K E C O N O M I C R E V I E W
at International Monetary F
und on August 12, 2011
wber.oxfordjournals.org
Dow
nloaded from

America and the Caribbean. Despite these increases, however, intra-WesternEuropean migrants are increasingly becoming a minority proportion of themigrant stock, especially after 1970 as migration from developing countriesincreased. Migrants from Turkey and Poland in Germany constitute the twolargest diasporas in Western Europe and the second and third largest develop-ing to developed countries migration corridor globally. Elsewhere in Europe,the most significant migrant corridor from developing countries is from Algeriato France. In all decades except 2000, this corridor is among the top four mostimportant developing to developed country migrations in the world. Othernotable corridors from the South to Western Europe include South Asia toGreat Britain, the former Yugoslavia to Germany, and North Africa (countriesin addition to Algeria) to France.
Modern day Australia, New Zealand, and Canada were all founded throughimmigration; in 1960, 71 percent of migrants to Australia, New Zealand, andCanada were born in Western Europe—39 percent of them in the UnitedKingdom. By 2000, however, that share had fallen to 36 percent of the total,as migrants from the East Asia and Pacific region (particularly China andVietnam) gained prominence; they now account for more than a fifth ofmigrants.
Germans in the United States and British in Australia are the two largestmigration corridors between developed countries. Facing a chronic skills short-age, Australia implemented the Ten Pound Pom scheme in the postwar periodas part of its Populate or Perish policy. Opening the country to all British citi-zens, including those from Cyprus and Malta, the Australian governmentmanaged to persuade over one million people to migrate before 197330 for theprice of just 10 British pounds. Given the cultural similarities betweenAustralia and the United Kingdom and the relaxed reciprocal visa restrictions,bilateral migration flows remain strong to this day. Japan has historically beenmore reticent than other OECD members to admit migrants. Immigration toJapan is mainly from Korea and elsewhere in East Asia, although from 1960onwards, Japan did admit larger proportions of migrants from both SoutheastAsia and South America, specifically Brazil, the Nikkei burajiru-jin.
Global Migration to Developing Countries
Statistically, the most important events affecting migrant movements to theSouth over the study period are the partition of India and the disintegration ofthe Soviet Union. There have been other important changes as well since 1960,particularly the large shift in global migration toward the Persian Gulfcountries.
In 2000, 15 percent of the migrant stock in developing countries (includingboth India partition and intra-Soviet Union migrants) was in the high-incomeMiddle East and North Africa region, up from under 3 percent in 1960. These
30. From 1973 onward, the price of assisted migrant’s passage rose.
Ozden, Parsons, Schiff, and Walmsley 39
at International Monetary F
und on August 12, 2011
wber.oxfordjournals.org
Dow
nloaded from

migrants reflect movements predominantly from South and Southeast Asia (45percent in 2000) and the low-income Middle East and North Africa region (33percent) to the Gulf and from the countries of the former Soviet Union toIsrael.31 Of total migration to developing countries, the low-income MiddleEast and North Africa and the Latin America and Caribbean regions continueto attract steady shares. Compared with 1960, however, both regions attractproportionally far fewer Western Europeans and more migrants from otherdeveloping countries. Although the number of migrants across Africa increasedby some 4 million over the period, Sub-Saharan Africa accounted for only 14percent of total migrants in developing countries in 2000, down from 11percent in 1960. The numbers of migrants in Southeast Asia, Europe otherthan European Free Trade Association and the EU 15, and Eastern Africa fellover the period, reflecting a sharp drop in migrants from East Asia in SoutheastAsia, fewer migrants from the former Soviet Union in Eastern Europe, andfewer migrants from South Asia and East Africa to other developing countriesin the subregions.
Intra-Soviet Union and intra-South Asia migration constituted 42 percent ofSouth–South migration globally in 2000 (figure 3). The largest migrant corri-dors were between countries of the former Soviet Union, between Russia andUkraine (in both directions), and between Kazakhstan and Russia. Migrantcorridors between Bangladesh, India, and Pakistan are very large in both direc-tions, with Bangladeshi migrants in India the largest migrant population inSouth Asia. In the Persian Gulf, the largest migrant groups are Indian and theEgyptian migrants in Saudi Arabia, Indian migrants in the United ArabEmirates, and Pakistani migrants in Saudi Arabia.
Migration from the North to the South, although still large, is declining (seefigure 2). In 1960, developed country migrants constituted the majority ofmigrants to the Pacific Islands, Central and South America, and Central Africa;today, that is no longer the case. Migrants from developed to developingcountries have declined in both absolute and relative importance. Today, themost important developed to developing country movements are from WesternEurope to South America and to other European countries and from theUnited States to Central America and the Caribbean. Migrants from the UnitedStates to Mexico constitute the largest developed to developing countrymigration corridor in the world today, at more than 340,000 people. Before2000, migration between Italy and Argentina was the largest developed todeveloping country migration corridor in every decade. Other notable devel-oped to developing country corridors are from Spain to Argentina and fromGreat Britain to South Africa.
31. In 1960, over half of all migrants in Israel were born in the Eastern Europe and Central Asia.
40 T H E W O R L D B A N K E C O N O M I C R E V I E W
at International Monetary F
und on August 12, 2011
wber.oxfordjournals.org
Dow
nloaded from

Gender Assessment of International Migrant Stocks
In 1960, men made up a larger share of all regional immigrant stocks except inthe United States and Eastern Europe and Central Asia (figure 4a). Between1960 and 2000, the gender composition of immigrant stocks changed consider-ably. The United States, Eastern Europe and Central Asia, and South Asia allexperienced slight declines in the share of women in total migrants. The largestpercentage increases over the period in the share of women in the total migrantstocks were Latin America and the Caribbean (14.8 percent); Japan (14.3percent); East Asia and Pacific (13.3 percent); Sub-Saharan Africa (11.2percent); Australia, New Zealand, and Canada (8.3 percent); and WesternEurope (4.9 percent). The proportion of women in the migrant stock fellsharply in both the high-income Middle East and North Africa region (23.8percent) and the low-income Middle East and North Africa region (9.1 percentdrop) .
In absolute terms, however, the number of female migrants in all regions butSouth Asia rose. Despite the high-income Middle East and North Africa regionhosting fewer women than men, the region experienced the largest rise in thenumber of female migrants (up 3.5 million or 540 percent) over the period.Other regions that experienced large increases in the number of femalemigrants include the United States (up 12.1 million or 228 percent); WesternEurope (11.2 million, 190 percent); and Australia, New Zealand, and Canada(3 million, 130 percent). The biggest absolute decline in the numbers of femalemigrants between 1960 and 2000 was in South Asia (down 3 million or 40percent). In 2000, the countries with the highest proportion of female migrantswere Nepal (70 percent), Mauritius (63 percent), and Moldova (60 percent).
FIGURE 3. Inter- and Intra- regional Migration between Developing Countries,2000
Source: Authors’ calculations based on data described in text.
Ozden, Parsons, Schiff, and Walmsley 41
at International Monetary F
und on August 12, 2011
wber.oxfordjournals.org
Dow
nloaded from

In terms of emigrant stocks in 1960, only two regions sent higher numbersof women abroad relative to men, Australia, New Zealand, and Canada andEastern Europe and Central Asia (figure 4b). They did so again in 2000, alongwith Western Europe, East Asia and Pacific, and Japan. In percentage terms,the ratio of female to male emigrants declined slightly in the United States;Australia, New Zealand, and Canada; and Eastern Europe and Central Asiaand more substantially in South Asia (9.6 percent) and in both Middle Eastand North Africa regions (high income, 6.2 percent; low-income, 7.8 percent).The four regions that experienced the greatest increases also experienced the
FIGURE 4. The Percentage of Women in Immigrant Stock by Region, 1960and 2000
42 T H E W O R L D B A N K E C O N O M I C R E V I E W
at International Monetary F
und on August 12, 2011
wber.oxfordjournals.org
Dow
nloaded from

largest increase in women as a share of their total immigrant stocks: East Asiaand Pacific (17.9 percent), Japan (15.5 percent), Sub-Saharan Africa (15.4percent), and Latin America and the Caribbean (6.9 percent). In absoluteterms, all regions of the world sent more women abroad in 2000 than in 1960.The largest proportional increase was from Latin America and the Caribbean(up 10.9 million or 630 percent), followed by the high-income Middle Eastand North Africa region (500,000, 290 percent), the low-income Middle Eastand North Africa region (3.3 million, 250 percent), Japan (330,000, 210percent), East Asia and the Pacific (6.3 million, 180 percent), and Sub-SaharanAfrica (4.4 million, 180 percent). In 2000, the countries with the highest pro-portion of women in their emigration stocks were Ukraine (61 percent), thePhilippines (60 percent), and Singapore (60 percent).
V. C O N C L U S I O N
This article draws on the largest collection of censuses and population registersproviding information on international bilateral migration and constructs con-sistent square matrices for the last five completed census rounds (1960 to2000). Problems in the underlying data that confound meaningful comparisonsinclude differences in recording and recoding practices among destinationcountries and missing and omitted data.
The main contribution of this article is in recognizing and overcoming theseobstacles by making a series of simplifying assumptions. Tradeoffs betweenpragmatism and accuracy are inevitable, and one of the largest hurdles is estab-lishing a set of rules for achieving a fixed set of countries. Researchers facedaunting challenges when working with migration data, and any attempt toresolve them will inevitably fall short of the ideal, especially when compared tointernational statistics on trade and financial flows. Nevertheless, given thepaucity of comparable data on international migration, especially outside ofthe OECD, the completed database represents an important step in an ongoingeffort to understand trends in international migration. The matrices provide areasonably accurate portrait of global migration over the second half of thetwentieth century and should provide a useful starting point for researchersand policymakers working on a broad range of issues.
Ozden, Parsons, Schiff, and Walmsley 43
at International Monetary F
und on August 12, 2011
wber.oxfordjournals.org
Dow
nloaded from

A P P E N D I X 1 . L I S T O F S O U R C E S
Table A1. List of Database Sources by Census Round
Country or territory Definitiona 1960 1970 1980 1990 2000
Australia and New Zealand
Australia FB 1961 1966 1981 1991 2001New Zealand FB 1961 1971 1981 1986 2001Japan
Japan NT 1960 1970 1980 1990 2000Canada
Canada FB 1961 1981 1986 2001United States
United States FB 1960 1970 1980 1990 2000Western Europe
Andorra NT 1969 1984 1994 2004Austria NT 1961 1971 1981 1991 2001Belgium NT 1961 1970 1981 1991 2001Cyprus FB 1960 1992 2001Denmark FB 1960 1965 1981 1991 2001Faeroe Islands NT 1994 2004Finland FB 1960 1970 1980 1990 2000France FB 1962 1968 1982 1990 1999Germany NT(FB) 1960 1970 1980* 1990* 2000Gibraltar FB 1961 1970 1981 1991 2001Greece NT 1961 1971 1981 1991 2001Iceland FB 1960 1965 1980 1990 2000Ireland FB 1961 1970 1981 1986 2002Italy FB 1961 1971 1981 1991 2001Liechtenstein NT 1960 1970 1980 1990 1998Luxembourg FB 1960 1970 1981 1991 2001Malta NT 1957 1967 1995Monaco FB 1961 1968 1982 1990 2000Netherlands FB 1960 1992 2002Norway FB 1960 1970 1980 1990 2000Portugal FB 1960 1981 1991 2001San Marino NT 1972 1980Spain FB 1960 1981 1991 2001Sweden FB 1960 1970 1980 1990 2000Switzerland NT 1960 1970 1980 1990 2000United Kingdom FB 1961 1971 1981 1991 2001
Eastern Europe and Central Asia
Albania NT 1989Armenia ETH(FB) 1959 1970 1979 1989 2001Azerbaijan ETH(FB) 1959 1970 1979 1989Belarus ETH(FB) 1959 1970 1979 1989 1999Bosnia & Herzegovina FB 1981*Bulgaria FB 2001Croatia FB 1981* 1991 2001Czech Republic FB 1991* 2001Estonia ETH(FB) 1959 1970 1979 1989 2000Georgia ETH(FB) 1959 1970 1979 1989
(Continued)
44 T H E W O R L D B A N K E C O N O M I C R E V I E W
at International Monetary F
und on August 12, 2011
wber.oxfordjournals.org
Dow
nloaded from

TABLE A1. Continued
Country or territory Definitiona 1960 1970 1980 1990 2000
Hungary NT 1960 2003Kazakhstan ETH(FB) 1959 1970 1979 1989Kyrgyzstan ETH(FB) 1959 1970 1979 1989 1999Latvia ETH(FB) 1959 1970 1979 1989 2000Lithuania ETH(FB) 1959 1970 1979 1989 2001Macedonia FB 1981* 1994Moldova ETH(FB) 1959 1970 1979 1989Poland FB 1970 2002Romania FB 1966 1992 2002Russian Federation ETH(FB) 1959 1970 1979 1989 2002Serbia & Montenegro FB 1981* 1991 2002Slovakia FB 1991* 2001Slovenia FB 1981* 1991 2002Tajikistan ETH(FB) 1959 1970 1979 1989Turkey FB 1960 1965 1980 1990 2000Turkmenistan ETH(FB) 1959 1970 1979 1989Ukraine ETH(FB) 1959 1970 1979 1989 2001Uzbekistan ETH(FB) 1959 1970 1979 1989
High income Middle East and North Africa
Bahrain NT 1959 1971 1981 1991 2001Israel FB 1961 1972 1983 2001Kuwait NT 1957 1970 1975 1985 2001Oman NT 1993 2004Qatar FBSaudi Arabia NT 1992 1995United Arab Emirates NT 1980 1993 2003
Rest of Middle East and North Africa
Algeria NT 1966Egypt NT 1960 1976 1986 1996Iran (Islamic Republic of) NT 1986 1996Iraq FB 1957 1997Jordan NT 1961 1979 1994 2004Lebanon FB 1996Libyan Arab Jamahiriya NT 1964 1973Morocco NT 1960 1971 2004Occupied Palestinian Territory FB 1997Syrian Arab Republic NT 1960 1970 1981 1994Tunisia NT 1956 1966 1984 1994 2004Yemen NT 1986 2004
Africa
Angola FB 1960 1983 1993Benin NT 1979 2002Botswana NT 1971 1981 1991 2001Burkina Faso FB 1975 1985 1996Burundi FB 1979 1990Cameroon FB 1976 1987Cape Verde NT 1980 1990Central African Republic NT 1975 1988Chad FB 1993
(Continued)
Ozden, Parsons, Schiff, and Walmsley 45
at International Monetary F
und on August 12, 2011
wber.oxfordjournals.org
Dow
nloaded from

TABLE A1. Continued
Country or territory Definitiona 1960 1970 1980 1990 2000
Comoros FB 1958 1980 1991Congo NT 1974 1984Cote d’Ivoire NT 1975 1988 1998Democratic Republic of the Congo NT 1958* 1984Djibouti FB 1991Equatorial Guinea NT 1950 1983Eritrea FBEthiopia NT 1961 1994Gabon NT 1960 1993Gambia NT 1963 1973 1983 1993Ghana FB 1960 1970 1984 2000Guinea NT 1983 1996Guinea-Bissau FB 1950 1979 1991Kenya FB 1962 1969 1979 1989 1999Lesotho NT 1956 1976 1986 1996Liberia FB 1962 1974 1984Madagascar NT 1965 1975 1993Malawi FB 1966 1977Mali FB 1976 1987 1998Mauritania NT 1977 1988Mauritius NT 1972 1983 1990 2000Mayotte FB 1991 1997Mozambique NT 1955 1980 1997Namibia NT 1991 2001Niger NT 1977 1993 2001Nigeria NT 1963 1991Rwanda NT 1958* 1978 1991 2002Reunion FB 1961 1974 1982 1990 1999Saint Helena FB 1966 1976 1987 1998Sao Tome and Principe NT 1981 1991Senegal FB 1960 1976 1988 2002Seychelles NT 1960 1982 1987 1997Sierra Leone FB 1985 2004Somalia FBSouth Africa FB 1961 1970 1980 1985 2001Sudan FB 1956 1983 1993Swaziland FB 1956 1966 1976 1986 1997Togo NT 1981Uganda NT 1969 1991 2002United Republic of Tanzania FB 1967 1978 1988 2002Zambia FB 1963 1969 1980 1990Zimbabwe FB 1956 1969 1992
South Asia
Afghanistan FB 1975Bangladesh FB 1961 1974Bhutan FB 2005India FB 1961 1971 1981 1991 2001Maldives FBNepal FB 1961 1971 1981 1991 2001
(Continued)
46 T H E W O R L D B A N K E C O N O M I C R E V I E W
at International Monetary F
und on August 12, 2011
wber.oxfordjournals.org
Dow
nloaded from
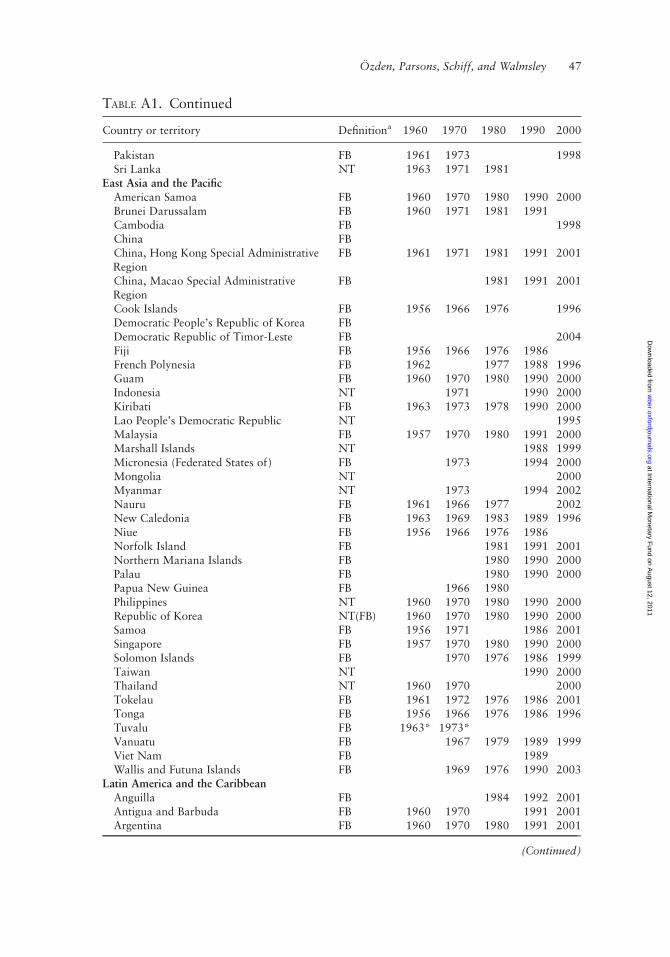
TABLE A1. Continued
Country or territory Definitiona 1960 1970 1980 1990 2000
Pakistan FB 1961 1973 1998Sri Lanka NT 1963 1971 1981
East Asia and the Pacific
American Samoa FB 1960 1970 1980 1990 2000Brunei Darussalam FB 1960 1971 1981 1991Cambodia FB 1998China FBChina, Hong Kong Special AdministrativeRegion
FB 1961 1971 1981 1991 2001
China, Macao Special AdministrativeRegion
FB 1981 1991 2001
Cook Islands FB 1956 1966 1976 1996Democratic People’s Republic of Korea FBDemocratic Republic of Timor-Leste FB 2004Fiji FB 1956 1966 1976 1986French Polynesia FB 1962 1977 1988 1996Guam FB 1960 1970 1980 1990 2000Indonesia NT 1971 1990 2000Kiribati FB 1963 1973 1978 1990 2000Lao People’s Democratic Republic NT 1995Malaysia FB 1957 1970 1980 1991 2000Marshall Islands NT 1988 1999Micronesia (Federated States of) FB 1973 1994 2000Mongolia NT 2000Myanmar NT 1973 1994 2002Nauru FB 1961 1966 1977 2002New Caledonia FB 1963 1969 1983 1989 1996Niue FB 1956 1966 1976 1986Norfolk Island FB 1981 1991 2001Northern Mariana Islands FB 1980 1990 2000Palau FB 1980 1990 2000Papua New Guinea FB 1966 1980Philippines NT 1960 1970 1980 1990 2000Republic of Korea NT(FB) 1960 1970 1980 1990 2000Samoa FB 1956 1971 1986 2001Singapore FB 1957 1970 1980 1990 2000Solomon Islands FB 1970 1976 1986 1999Taiwan NT 1990 2000Thailand NT 1960 1970 2000Tokelau FB 1961 1972 1976 1986 2001Tonga FB 1956 1966 1976 1986 1996Tuvalu FB 1963* 1973*Vanuatu FB 1967 1979 1989 1999Viet Nam FB 1989Wallis and Futuna Islands FB 1969 1976 1990 2003
Latin America and the Caribbean
Anguilla FB 1984 1992 2001Antigua and Barbuda FB 1960 1970 1991 2001Argentina FB 1960 1970 1980 1991 2001
(Continued)
Ozden, Parsons, Schiff, and Walmsley 47
at International Monetary F
und on August 12, 2011
wber.oxfordjournals.org
Dow
nloaded from

TABLE A1. Continued
Country or territory Definitiona 1960 1970 1980 1990 2000
Aruba FB 1960 1981 1991 2000Bahamas FB 1960 1970 1980 1990Barbados FB 1960 1980 1990Belize FB 1960 1980 1991 2000Bermuda FB 1960 1970 1980 1991 2000Bolivia FB 1950 1976 1992 2001Brazil FB 1960 1970 1980 1991 2000British Virgin Islands FB 1960 1970 1980 1991Cayman Islands FB 1960 1979 1989 2000Chile FB 1960 1970 1982 1992 2002Colombia FB 1964 1970 1993 2005Costa Rica FB 1963 1973 1984 2000Cuba FB 1953 1970 2000Dominica FB 1960 1981 1991Dominican Republic FB 1960 1970 2002Ecuador FB 1962 1974 1982 1990 2001El Salvador FB 1961 1971 1992 2007Falkland Islands (Malvinas) FB 1962 1972 1986 2001French Guiana FB 1961 1974 1982 1990 1999Greenland FB 1960 1970 1976Grenada FB 1960 1981 1991Guadeloupe FB 1961 1974 1982 1990 1999Guatemala FB 1963 1973 1981 1994 2002Guyana FB 1960 1980 1991 2002Haiti FB 1950 1971 1982Honduras FB 1961 1988 2001Jamaica FB 1960 1970 1982 1991 2001Martinique FB 1961 1974 1982 1990 1999Mexico FB 1960 1970 1980 1990 2000Montserrat FB 1960 1970 1980 1991Netherlands Antilles FB 1971 1981 1992 2001Nicaragua FB 1963 1971 1995Panama FB 1960 1970 1980 1990 2000Paraguay FB 1950 1972 1982 1992 2002Peru FB 1960 1972 1981 1993Puerto Rico FB 1970 1980 1990 2000Saint Kitts and Nevis FB 1960 1970 1980 1991 2001Saint Lucia FB 1960 1980 1991 2001Saint Pierre et Miquelon FB 1962 1974 1982 1999Saint Vincent and the Grenadines FB 1960 1980 1991Suriname NT 1964 2004Trinidad and Tobago FB 1960 1970 1980 1990 2000Turks and Caicos Islands FB 1960 1980 1990United States Virgin Islands FB 1960 1970 1980 1990 2000Uruguay FB 1963 1975 1985 1996Venezuela FB 1961 1971 1981 1990 2001
*The census year was derived from splitting an aggregated census.
a. FB is foreign born, NT is nationality, and ETH is ethnic group. FB(NT) means that the originaldata by nationality were amended and the resulting numbers are closer to foreign-born definition.
Source: Authors’ calculations based on data described in text.
48 T H E W O R L D B A N K E C O N O M I C R E V I E W
at International Monetary F
und on August 12, 2011
wber.oxfordjournals.org
Dow
nloaded from

APPENDIX 2. LIST OF AGGREGATIONS
TA B L E A2. List of Aggregations
Aggregated region Master region Aggregated region Master region
Aden Yemen Northern Ireland United KingdomAlaska United States of
AmericaPalmyra United States of
AmericaAlboran and Perejil Spain Panama Canal Zone PanamaAscension Island Saint Helena Penang MalaysiaAzores Portugal Pitcairn Island United KingdomBonaire Netherlands Antilles Providencia Island ColombiaBorn abroad of U.S.
parent(s)
United States ofAmerica
Saint Croix United States VirginIslands
British Indian Ocean
Territory
United Kingdom Saint Martin Netherlands Antilles
Canary Islands Spain Saint Thomas United States VirginIslands
Canton and Enderbury
Islands
Kiribati San Andres Island Saint Pierre andMiquelon
Ceuta and/or Melilla Spain Sarawak MalaysiaChannel Islands United Kingdom Scotland United KingdomChannel Islands and the
Isle of Man
United Kingdom South Senegal Senegal
Christmas Island Australia South Vietnam VietnamCocos (Keeling) Islands Australia South Yemen YemenCuracao Netherlands Antilles Spanish Sahara MoroccoDubai United Arab Emirates Svalbard and
J. Mayen Islands
Norway
East Germany Germany Terre Nova CanadaEaster Island Chile Tristan de Cunha Saint HelenaEngland United Kingdom Vatican ItalyEngland and Wales United Kingdom Wake Island United States of
AmericaFrench India India Wales United KingdomGalapagos Ecuador West Germany GermanyGaza Strip Occupied Palestinian
TerritoryWestern New Guinea Indonesia
Germany (East Berlin) Germany Western Sahara MoroccoGermany (unspecified) Germany Zanzibar TanzaniaGreat Britain United KingdomHawaii United States of
AmericaHowland Island United States of
AmericaIsle of Man United KingdomJammu IndiaJohnston Islands United States of
AmericaKashmir IndiaKosovo Serbia and
Montenegro
(Continued)
Ozden, Parsons, Schiff, and Walmsley 49
at International Monetary F
und on August 12, 2011
wber.oxfordjournals.org
Dow
nloaded from

TABLE A2. Continued
Aggregated region Master region Aggregated region Master region
Labuan MalaysiaMadeira PortugalNorth Borneo MalaysiaNorth Senegal SenegalNorth Vietnam VietnamNorth Yemen Yemen
Source: Authors’ calculations based on data described in text.
APPENDIX 3. ADJUSTMENTS TO THE DATA
This appendix describes the adjustments made to the data for the former SovietUnion and Germany.
Former Soviet Union
Censuses for the Soviet Union for 1959, 1970, 1979, and 1989 were collectedto address the data issues created by the dissolution of the Soviet Union. Thesecensuses all use ethnicity to identify migrants. Crucially, for 1989, comparablecountry of birth data exist for all 15 republics. The censuses based on ethnicitydocument intra-Soviet migrants (Uzbeks in Turkmenistan, for example) andexternal nationalities (such as Afghans). In addition, there are miscellaneousSoviet nationalities (such as the Chuvash, Tatars, and Uyghurs), many ofwhose homelands span several Soviet republics/countries and who shouldtherefore not be counted as international migrants since they were born on oneside of the border or the other as opposed to moving across it.
First, people of these miscellaneous nationalities were broadly aggregated toone or more of the 15 former Soviet republics on the basis of country bycountry research and a close inspection of the numbers over time. Similarly,external nationalities were assigned, with particular attention to determiningwhether these people were actually migrants. For example, people recorded asGermans will likely be ethnic Germans who migrated long before the censusperiod examined in this study. Those recorded as Poles, however, are morelikely to have been forcibly deported. Once the aggregations were completed,the ratios of foreign-born migrants to migrants defined by ethnicity in 1989were calculated for people who were both born in one of the 15 former Sovietrepublics and resided there. These ratios were then applied to these republics/countries in every census period before adding the “external” migrants. Thesecorrections captured a large proportion of the most important migrants to andbetween the Soviet republics. This process adds many millions of migrants tothe totals in the early decades and avoids the problem of a very large artificialjump in international migration between 1980 and 1990, after the dissolutionof the Soviet Union.
50 T H E W O R L D B A N K E C O N O M I C R E V I E W
at International Monetary F
und on August 12, 2011
wber.oxfordjournals.org
Dow
nloaded from

Germany
The 2005 German micro-census includes data on emigrants of German originfrom Eastern Europe who arrived between 1944 and 1950 (referred to as expel-lees, Vertriebene) or between 19502005 (referred to as resettlers, Aussiedler).These data are recorded by year of birth and year of migration; country ofbirth is not recorded. As of 1950, there were 11.96 million expellees and 4.48million resettlers residing in Germany. According to the data provided by theMax Planck Institute for the Study of Religious and Ethnic Diversity, 3.61million were still in Germany as of 2005. Mortality data from the UnitedNations Population Division (United Nations 2010) on Germany for eachdecade and age group were used to calculate the number of migrants whowould have been residing in Germany at the beginning of each decade from1960 to 2000, taking into account migrants’ age and year of entry. After calcu-lating the total number residing in Germany in each decade, shares were esti-mated by country of origin using the nationality shares from the 1950 data onexpellees and post-1950 data on resettlers. The numbers of expellees and reset-tlers were then added to the existing totals.
APPENDIX 4. PROPENSITY MEASURES
This appendix presents the propensity measures used to disaggregate the 236aggregate origin regions/countries identified in the censuses. Let Mo,d,t denotethe number of migrants from origin country o in destination country d in yeart. These are the entries in the bilateral matrices that need to be completed.Now, instead of Mo,d,t, suppose a census in country d gives the number ofmigrants originating from region R (which includes country o), denoted asMR,d,t. The problem is to find an allocation rule (so,d,t) for estimating the bilat-eral stock from this aggregate amount. The allocation rule can be written asMo,d,t ¼ so,d,t MR,d,t .
One type of aggregation problem occurs in the case of migrants fromCzechoslovakia, the Soviet Union, and Yugoslavia and their successor states.For example, in many cases, migrants are recorded from Czech Republic,Slovakia, and Czechoslovakia in the same year. Belgium’s 2001 reports 308migrants from Czechoslovakia, 554 from the Czech Republic, and 412 fromSlovakia. Presumably, migrants who left before the partition reportedCzechoslovakia as their origin country, whereas most postpartition migrantsreported the successor countries. In such cases, it is assumed that the distri-bution of migrants from these two countries was the same before and after thebreak-up of Czechoslovakia. Of the 308 migrants recorded as originating fromCzechoslovakia, 177 migrants (308*[554/966]) were assigned to the CzechRepublic and 131 (308*[412/966]) to Slovakia.
In other cases of aggregated migrant stock data, migrant data from otherdecades were used as the basis for disaggregation. Migrants were allocated
Ozden, Parsons, Schiff, and Walmsley 51
at International Monetary F
und on August 12, 2011
wber.oxfordjournals.org
Dow
nloaded from

according to a relative propensity, which is averaged over time. This can be for-mally written as:
so;d;t ¼1
n
� �Xk[K
so;d;k ¼1
n
� �Xk[K
Mo;d;k=MR;d;k
� �ð1Þ
where K denotes the set of census years other than t for which bilateral dataexist, and n is the number of such observations in set K. This propensity issimply the likelihood that a particular destination country will accept migrantsfrom a specific origin country, relative to all the other countries comprisingthat aggregate origin region. For example, Australia records 29,311 migrantsfrom the Soviet Union in 1966. This total needs to be disaggregated among the15 successor countries in the master list. While the data for Australia covercensus material for each of the five census rounds, only the 2001 census pro-vides details for all 15 successor countries. According to the first method forallocating aggregate categories, the 2001 census is used to calculate the contri-bution of each of these countries towards the total. Those shares are then usedto allocate the 29,311 migrants from the Soviet Union in 1966 among the con-stituent republics to yield the bilateral numbers for Australia (table A3).
TA B L E A3. Allocation of Aggregate Origin Region by Migrant Shares overTime for Australia
Origin country listedin 2001 Australiancensus
Total immigrantsto Australia in
2001
Share of Soviet Unionmigration to Australia
in 2001 (%)
Number of migrantsallocated in 1966 across
constituent countries
Azerbaijan 145 0.3 93Armenia 899 2.0 576Belarus 1,041 2.3 667Estonia 2,386 5.2 1,529Georgia 310 0.7 199Kazakhstan 438 1.0 281Kyrgyzstan 101 0.2 65Latvia 6,690 14.6 4,287Lithuania 3,689 8.1 2,364Moldova 483 1.1 309Russian Federation 15,022 32.8 9,625Tajikistan 41 0.1 26Turkmenistan 26 0.1 17Ukraine 14,062 30.7 9,010Uzbekistan 412 0.9 264Total Soviet Union 45,745 100 29,311
Source: Authors’ calculations based on data described in text.
52 T H E W O R L D B A N K E C O N O M I C R E V I E W
at International Monetary F
und on August 12, 2011
wber.oxfordjournals.org
Dow
nloaded from

In this simple example, only the data for 2001 are available. Where data areavailable for more than one census, the shares across all decades are averagedbefore estimating the bilateral numbers.
In the absence of such data (disaggregated data for the same destinationcountry in other census years), the world is disaggregated into destination sub-regions. Origin countries in the same subregion are then assumed to have asimilar propensity over time to send migrants to a particular destinationcountry in a subregion for which data are lacking as they do to other countriesin that subregion. For example, assume that the census data for Morocco in aparticular year include the origin category All West Africa but no individualdata on migrants from Ghana and that there are no bilateral data on Ghanaianmigrants in other Moroccan censuses. In this instance, migrants from Ghanaare assumed to have a similar propensity to migrate to Morocco as they haveto other countries in North Africa. Data from other countries in North Africa(Algeria, Egypt, Libya, and Tunisia) are then used to calculate the propensityof Ghanaians—relative to migrants from other West African countries—tomigrate to each country in North Africa. These propensity shares, which sumto one, can be applied to the All West Africa aggregate category from theMoroccan census to disaggregate it into the constituent West African countries.Equation 2 expresses this propensity measure:
so;d;t ¼1
nf
� �Xk[K
Xg[G
Mo;g;k=MR;g;k
� �ð2Þ
In equation (2), G denotes the set of comparable destination countries (Algeria,Egypt, Libya, and Tunisia in the example above); R is the set of origincountries (All West Africa); n is the number of census years for which dataexist; and f is the number of countries in region G. In short, this is the relativepropensity of origin country o to send migrants to subregion G relative toother countries in its own region (R). Where appropriate data for the subregioncannot be found, the set of all countries in the world is used.
APPENDIX 5. CALCULATING GENDER SPLITS
When gender splits are missing, the preferred option is to divide the world intosubregions. Then it is assumed that the gender ratio of an origin country’s emi-grant stock in a specific decade is the same for each destination country in thatsubregion. The missing gender ratio in an origin country’s emigrant stock canthen be calculated using data disaggregated by gender from all destinations inthe same subregion as the destination country for which data are lacking.Using the same notation as in the previous section, assume that Mo,d,t is theaggregate migrant stock from origin country o to destination country d in yeart and that Wo,d,t is the female migrant stock for the same origin-destination
Ozden, Parsons, Schiff, and Walmsley 53
at International Monetary F
und on August 12, 2011
wber.oxfordjournals.org
Dow
nloaded from

pair in the same year t. The ratio of female migrants to male migrants isdenoted as go,d,t, which is given by go,d,t ¼Wo,d,t/Mo,d,t.
For example, imagine that in a given decade, the gender splits of emigrantsfrom Uruguay in Scandinavian countries are known, except for Sweden. In thissituation, it is assumed that the ratio of female migrants to male migrants fromUruguay to Sweden is the ratio of female migrants to male for all of the otherScandinavian countries (Denmark, Finland, Norway) in that decade. Formally,this can be stated as
go;d;t ¼Wo;G;t=Mo;G;t ð3Þ
where G is the destination region (the Scandinavian countries except Sweden),o is the origin country (Uruguay), and d is the destination country (Sweden).Once this proportion go, d, t is calculated, it can be multiplied by the totalnumber of migrants Mo, d, t to Sweden to calculate the number of femalemigrants. There is considerable variation in the balance between male andfemale migration from Uruguay to Scandinavian countries other than Sweden(Denmark, Finland, Norway) during the 1990 census round (table A4). Onaverage, however, 47 percent of Uruguayan migrants are men and 53 percentare women. In the 1990 census, Sweden records 2,640 migrants as originatingfrom Uruguay. Then 1,390 (0.53*2,640) of these migrants are women and1,250 (0.47*2,640) are men.
These calculations based on concurrent shares can be calculated only if datadisaggregated by gender exist for all other countries in the destination subre-gion. If not, the world is divided into destination subregions, and gender splitsare calculated based on regional shares over time. Continuing from the pre-vious example, assume the data for Denmark, Finland, and Norway are una-vailable in 1990, so that the gender split for Uruguayan migrants in Swedencannot be calculated based on Scandinavian data for 1990. In this case, thedata for Scandinavia across all other decades are used to calculate the average
TA B L E A4. Calculation of Sex Ratios Based on Concurrent SubregionalShares.
Destination countryin Scandinavia
Number of malemigrants in 1990 from
Uruguay
Number of femalemigrants in 1990 from
UruguayMales(%)
Females(%)
Denmark 92 90 51 49Finland 11 21 39 66Norway 67 78 46 54Average across subregion 47 53
Source: Authors’ calculations based on data described in text.
54 T H E W O R L D B A N K E C O N O M I C R E V I E W
at International Monetary F
und on August 12, 2011
wber.oxfordjournals.org
Dow
nloaded from

ratios of female migrants to total migrants over time. This can be written for-mally as:
go;d;t ¼1
n
� �Xk[K
go;G;t ¼1
n
� �Xk[K
Wo;G;k=Mo;G;k
� �ð4Þ
The expression in brackets (Wo,G,k/Mo,G,k) is the ratio of female migrantsto male migrants from origin o to all destination countries in the destinationsubregion G, across all decades k, for which data exist. Of course, completedata are not available for the current decade t since, were that the case,equation (4) would be preferred. Again, once calculated, this share is multi-plied by the total number of migrants to determine the number of femalemigrants.
RE F E R E N C E S
Beine, M., F. Docquier, and H. Rapoport. 2007. “Measuring International Skilled Migration: A New
Database Controlling for Age of Entry.” The World Bank Economic Review 21 (2): 249–54.
Bhargava, A., and F. Docquier. 2008. “HIV Pandemic, Medical Brain Drain, and Economic
Development in Sub-Saharan Africa.” The World Bank Economic Review 22 (2): 345–66.
Bilsborrow, R.E., G. Hugo, A.S. Oberai, and H. Zlotnik. 1997. International Migration Statistics,
Guidelines for Improving Data Collection Systems. Geneva: International Labour Office.
Docquier, F., and A. Marfouk. 2006. “International Migration by Educational Attainment
(1990-2000): Release 1.1.” In International Migration, Remittances and Development, ed. C.
OzdenM. Schiff. New York: Palgrave Macmillan.
Docquier, F., B.L. Lowell, and A. Marfouk. 2009. “A Gendered Assessment of Highly Skilled
Emigration.” Population and Development Review 35 (2): 297–321.
Harrison, A., T. Britton, and A. Swanson. 2003. Working Abroad: the Benefits from Nationals Working
in Other Economies. Paris: Organisation for Economic Cooperation and Development.
Integrated Public Use Microdata Series. 2008. International: Version 6.0 [Machine-readable database].
Minnesota Population Center, University of Minnesota, Minneapolis, MN.
Mayda, A. M. 2007. “International Migration: A Panel Data Analysis Of The Determinants Of
Bilateral Flows.” CReAM Discussion Paper Series 0707, Centre for Research and Analysis of
Migration, Department of Economics, University College London.
OECD (Organisation for Economic Co-operation and Development). 2002. Trends in International
Migration database. SOPEMI 2002 Edition. Paris: OECD.
OECD (Organisation for Economic Co-operation and Development). 2008. A Profile of Immigrant
Populations in the 21st Century: Data from OECD Countries. Paris: OECD.
Parsons, C.R., R. Skeldon, T.L. Walmsley, and L.A. Winters. 2007. “Quantifying the International
Bilateral Movements of Migrants.” In International Migration, Economic Development and Policy,
ed. C. Ozden, and M. Schiff. New York: Palgrave Macmillan.
Ratha, D., and W. Shaw. 2007. “South-South Migration and Remittances.” World Bank Working Paper
102, World Bank, Washington, DC.
United Nations Statistics Division. 1998. Recommendations on Statistics of International Migration
Revision 1. New York: United Nations.
United Nations, Department of Economic and Social Affairs, Population Division. 2008. United
Nations Global Migration Database. New York: United Nations. http://esa.un.org/unmigration
Ozden, Parsons, Schiff, and Walmsley 55
at International Monetary F
und on August 12, 2011
wber.oxfordjournals.org
Dow
nloaded from

———. 2006. Trends in Total Migrant Stock 1960–2000, 2005 Revision. Database. POP/DB/MIG/
Rev.2005/Doc. New York: United Nations.
———. 2009. Trends in International Migrant Stock: The 2008 Revision. Database. POP/DB/MIG/
Stock/Rev.2008. New York: United Nations. http://www.un.org/esa/population/.
———. 2010. “World Population Prospects: The 2009 Revision, Highlights.” Working Paper. ESA/P/
WP.210. New York: United Nations.
56 T H E W O R L D B A N K E C O N O M I C R E V I E W
at International Monetary F
und on August 12, 2011
wber.oxfordjournals.org
Dow
nloaded from

Immigration Policies and the Ecuadorian Exodus
Simone Bertoli , Jesus Fernandez-Huertas Moraga,and Francesc Ortega
Ecuador recently experienced an unprecedented wave of emigration following thesevere economic crisis of the late 1990s. Individual-level data for Ecuador and its twomain migration destinations, Spain and the United States, are used to examine the sizeand skill composition of these migration flows and the role of wage differences inaccounting for these features. Estimations of earnings regressions for Ecuadorians inall three countries show substantially larger income gains following migration to theUnited States than to Spain, with the wage differential increasing with migrants’ edu-cation level. While this finding can account for the pattern of positive sorting in edu-cation toward the United States, it fails to explain why most Ecuadorians opted forSpain. The explanation for this preference appears to lie in Spain’s visa waiverprogram for Ecuadorians. When the program was abruptly terminated, monthlyinflows of Ecuadorians to Spain declined immediately. JEL codes: O15, J61, D31
Following the seminal contributions of Roy (1951), Sjaastad (1962), and Borjas(1987), most studies of international migration have focused on how wagedifferentials shape the decision on whether and where to migrate. There is alsoconsensus that many nonwage factors are important: demographic changes in
Simone Bertoli ([email protected]) is a Jean Monnet Fellow at the Robert Schuman Centre for
Advanced Studies, European University Institute. Jesus Fernandez-Huertas Moraga (corresponding
author; [email protected]) is a researcher at the Institute for Economic Analysis of the Spanish
Council for Scientific Research, Barcelona. Francesc Ortega ([email protected]) is a professor at
Queens College of the City University of New York.
The authors are grateful to the journal editor and to three anonymous referees for careful comments
and suggestions and to Gordon Hanson, Hillel Rapoport, participants at the World Bank–French
Development Agency Second International Conference on Migration and Development and at the Third
Insights on Immigration and Development Economics (INSIDE) Workshop. They also thank Lıdia Brun
and Feray Koc for helpful research assistance. The article is part of the INSIDE research projects. Simone
Bertoli received financial support from the RBNE03YT7Z project, funded by the Italian Ministry for
Education, University and Research. Jesus Fernandez-Huertas Moraga received financial support from the
ECO2008-04785 project, funded by the Spanish Ministry for Science and Innovation. Jesus Fernandez-
Huertas Moraga works under a JAE–Doc contract from the Junta de Ampliacion de Estudios Program,
cofinanced by the European Social Fund; he also acknowledges the support of the Barcelona Graduate
School of Economics Research Network and of the government of Catalonia. The usual disclaimers apply.
A supplemental appendix to this article is available at http://wber.oxfordjournals.org/.
THE WORLD BANK ECONOMIC REVIEW, VOL. 25, NO. 1, pp. 57–76 doi:10.1093/wber/lhr004Advance Access Publication March 18, 2011# The Author 2011. Published by Oxford University Press on behalf of the International Bankfor Reconstruction and Development / THE WORLD BANK. All rights reserved. For permissions,please e-mail: [email protected]
57
at International Monetary F
und on August 12, 2011
wber.oxfordjournals.org
Dow
nloaded from

the origin countries (Hanson and McIntosh 2010a), cultural and linguisticproximity (Grogger and Hanson forthcoming), ethnic networks (McKenzie andRapoport 2010; Beine, Docquier, and Ozden forthcoming), and immigrationpolicies in the main host countries (Mayda 2010; Ortega and Peri 2009).
Identifying the impact of immigration policies on migration decisions isoften problematic because immigration policies are multifaceted; tracking theirdifferences over time and across countries is a challenge. This article focuses onthe massive Ecuadorian migration of the late 1990s and early 2000s1 by isolat-ing the effects of a change in one policy dimension: the introduction of a visarequirement for visitors from Ecuador to Spain in August 2003.
Individual-level data from comparable sources in Ecuador, the United States andSpain, the two main destination countries, were assembled to identify the compositionand distribution of the recent Ecuadorian migration. The information was used toassess to what extent these features can be explained by wage and nonwage factors.
The destination of Ecuadorian migrants was examined by education leveland gender. More women than men and more people without a college degree2
emigrated to Spain, while more college graduates opted for the United States.Individual observations on labor earnings for Ecuadorians were used to run
country-specific Mincer regressions and to estimate the income gain associatedwith migration to the two main destinations. The estimated differences in laborearnings across countries and levels of schooling are consistent with the higheraverage level of education of migrants to the United States.
Still, wage factors are starkly at odds with the relative scale of migration tothe two destination countries. The much larger income gains associated withmigration to the United States do not help explain why most Ecuadorians wholeft in the aftermath of the crisis opted for Spain. This choice is all the morepuzzling considering that precrisis Ecuadorian migration networks were denserin the United States than in Spain,3 yet the postcrisis migration was character-ized by a large shift “from New York to Madrid” (Jokisch 2001). The litera-ture on networks and migration suggests that the denser U.S. networks shouldhave contributed to an increase in the scale of Ecuadorian migration to theUnited States relative to Spain (Beine, Docquier, and Ozden forthcoming;McKenzie and Rapoport 2010).4
This puzzle can be explained by a key difference in the immigration policiesof the United States and Spain. Spain had introduced a visa waiver program for
1. See Beckerman and Solimano (2002), Jacome (2004), Larrea (2004), and Laeven and Valencia
(2008) for an analysis of the causes and economic consequences of the late 1990s crisis.
2. College degree or college graduate is defined as a person with at least four years of college
education.
3. Before 1999, there were 272,000 Ecuadorian-born individuals in the United States (U.S. Census
Bureau 2000) but just 76,000 in Spain (INE 2001).
4. Figure S.1 and table S.1 and the related discussion in the supplemental appendix to this article
(available at http://wber.oxfordjournals.org/) provide some suggestive evidence that this was the case;
observe that networks could have also contributed to reduce the level of education of Ecuadorian
migrants to the United States, as the empirical results in Bertoli (forthcoming) show.
58 T H E W O R L D B A N K E C O N O M I C R E V I E W
at International Monetary F
und on August 12, 2011
wber.oxfordjournals.org
Dow
nloaded from

Ecuadorians since 1963. Its influence on the distribution of Ecuadorianmigrants across the two main destinations can be gauged by what happenedwhen the program was terminated in August 2003, at a time when other rel-evant facets of immigration policies in the two destination countries remainedunchanged: monthly inflows of Ecuadorians into Spain fell sharply.
The article is structured as follows. Section I describes the timing of theEcuadorian exodus. Section II presents descriptive statistics. Section III analyzesthe skill composition of migration flows. Section IV reports Mincerianregressions and attempts to reconcile the implied wages with the data onmigration flows. Section V discusses the most relevant differences in immigra-tion policies between the United States and Spain. Finally, section VI discussessome implications of the findings.
I . D A T A S O U R C E S A N D T I M I N G O F M I G R A T I O N
Ecuador experienced a severe economic and financial crisis in the second halfof the 1990s, prompting a large wave of international migration. Informationon this migration episode comes from three sources: the December 2005 roundof the National Survey of Employment and Unemployment in Urban and RuralAreas (ENEMDU; INEC 2005) for Ecuador, the 2007 American CommunitySurvey (ACS; U.S. Census Bureau 2007) for the United States, and the 2007National Immigrant Survey (ENI; INE 2007) for Spain.5 These data sourcesprovide comparable individual-level information on Ecuadorians residing inthe three countries on age, year of migration, gender, education, marital status,employment status, sector of occupation, and pretax labor earnings.6 The threedatasets contain information on 73,758 individuals residing in Ecuador and2,030 who migrated to Spain or to the United States between 1999 and 2005.
Figure 1 plots the distribution of the Ecuadorian migrants in the ACS 2007and in the ENI 2007 by year of arrival. The time profile of migration flowsfrom Ecuador to the two destinations is very similar, with a surge in flows tothe United States and Spain around 2000, in the aftermath of the economiccrisis. Though the timing is similar, the scale differs substantially. Some137,148 Ecuadorians emigrated to the United States during 1999–2005,7 andsome 318,243 emigrated to Spain—more than twice as many. Ecuadorian data
5. The ENEMDU 2005 is a nationally representative labor market survey covering a sample of
73,758 people (INEC 2005). The ACS 2007 sample covers approximately 2.5 percent of the resident
population in the United States (U.S. Census Bureau 2007; Ruggles and others 2008). The ENI 2007 is
a nationally representative survey of the foreign-born population in Spain, with a sample size of 15,500
(INE 2007).
6. Other relevant variables, such as province of residence in Ecuador or English language
proficiency, are not available on a comparable basis in the three datasets; some of these variables were
used to perform robustness checks, described in the supplemental appendix.
7. The period covers migration episodes that occurred at least two years before the ENI 2007 and
the ACS 2007, as surveys in destination countries might be unable to adequately enumerate recently
arrived migrants (Hanson 2006).
Bertoli, Fernandez-Huertas Moraga, and Ortega 59
at International Monetary F
und on August 12, 2011
wber.oxfordjournals.org
Dow
nloaded from

sources show a similar picture of the scale and timing of migration to the twomain destinations (see figure S.2 in the supplemental appendix).
Two issues arise concerning the representativeness of the sample. First, thesample does not account for temporary migrants who had returned home bythe time of the survey. However, the size of the return flow is very small. Basedon ENEMDU 2005 data, 9,890 people returned to Ecuador from Spain or theUnited States between 1999 and 2005, a very small number compared with theroughly half a million Ecuadorian migrants to the United States and Spain.Thus, any bias due to return migration is likely to be very small. Second, thesample enumerates most Ecuadorians who moved to the United States or Spainover the 1999–2005 period, irrespective of their legal status at destination. Thenumber of Ecuadorians who entered the United States between 1999 and 2005according to the 2007 ACS is very close to the sum of the number ofEcuadorians who became legal permanent residents and the best available esti-mate of the size of illegal flows of Ecuadorians over the same period.8 Spain
FIGURE 1. Arrivals of Ecuadorians to the United States and Spain, 1991–2006
Note: The figure plots the distribution of migrants by their year of first arrival at destination;the two vertical lines delimit the reference period of the analysis.
Source: Authors’ calculations using data from U.S. Census Bureau (2007) and INE (2007).
8. Hoefer, Rytina, and Baker (2008) estimate that 10,000 Ecuadorians entered the United States
illegally every year over 2000–06. The 1999–2005 issues of the Yearbook of Immigration Statistics
(U.S. Department of Homeland Security various years) reveal that 64,034 Ecuadorians became
permanent residents over fiscal years 1999–2005. Adding this figure—which also includes adjustment
of status—to the estimated undocumented inflow yields approximately 135,000, which is reassuringly
close to the 137,148 Ecuadorian migrants recorded by the ACS 2007 over the period.
60 T H E W O R L D B A N K E C O N O M I C R E V I E W
at International Monetary F
und on August 12, 2011
wber.oxfordjournals.org
Dow
nloaded from

extended three amnesties to illegal immigrants (in 2000, 2001 and 2005), somost Ecuadorians had a legal residence permit at the time of the ENI 2007.
I I . S A M P L E S E L E C T I O N A N D D E S C R I P T I V E S T A T I S T I C S
Since the aim of the analysis was to understand the determinants of migrationdecisions by prime working age Ecuadorians, the sample was restricted topeople born during 1949–82 who were 16–49 years old and living in Ecuadorin 1998, at the onset of the economic crisis, and who then left Ecuadorbetween 1999 and 2005 or stayed in the country. Some 205 individuals whoreported past international migration experience were excluded, so that thesubsample of stayers includes only those who had never migrated. Thesesample selection criteria deliver a sample of 509 migrants to the United States,915 migrants to Spain, and 27,917 stayers.
The distribution of migrants in the selected sample between the two destina-tion countries is similar to that depicted in figure 1: the migration flow toSpain was almost three times as large as the flow to the United States, withsome differences by education and gender. The ratio of migrants to Spain tomigrants to the United States was 3.2 for non-college graduates compared with1.9 for college graduates, and 3.2 for women compared with 2.8 for men(see table S.2 in the supplemental appendix). These figures suggest that theincentives and the ability to migrate to the United States differed by educationand gender.
Migrants to the two destinations were similar in age and younger thanstayers (table 1). They had been residing there an average of 6 years at the timeof the surveys. Male migrants to Spain were on average less educated(8 percent had a college degree) than were stayers and migrants to the UnitedStates (14 percent each). Female migrants to the United States were morehighly educated (22 percent had a college degree) than were stayers(13 percent).9 Thus, for both genders, Ecuadorians who migrated to the UnitedStates were more educated than those who migrated to Spain. They had com-pleted 1.3 more years of schooling, and the share of college graduates was6 percentage points higher.
The employment rate for Ecuadorian men—for both those with a collegedegree and those without—is the same in the United States and Spain,suggesting that this played a limited role in influencing prospective malemigrants’ destination choice. For women, the employment rate is substantiallyhigher in Spain than in the United States, which probably reflects the fact thattied movers (individuals who follow a migrating household member) were agreater share of female Ecuadorian migrants in the United States. Ecuadorianmigration to the United States had traditionally been male dominated, so in
9. The same picture emerges when the sample is restricted to individuals born in 1949–73, who
had already completed their education by the onset of the late-1990s crisis.
Bertoli, Fernandez-Huertas Moraga, and Ortega 61
at International Monetary F
und on August 12, 2011
wber.oxfordjournals.org
Dow
nloaded from

TA
BL
E1
.D
escr
ipti
veSta
tist
ics
on
Ecu
adori
ans
inE
cuador,
the
Unit
edSta
tes,
and
Spain
Ecu
ador
Unit
edSta
tes
Spain
Sta
tist
icM
ean
Sta
ndard
dev
iati
on
Mea
nSta
ndard
dev
iati
on
Mea
nSta
ndard
dev
iati
on
Men
Age
atm
igra
tion
37.9
79.7
328.7
88.4
228.6
67.9
1Y
ears
since
mig
rati
on
0.0
00.0
05.7
31.9
96.2
51.3
8C
olleg
egra
duat
ea0.1
40.3
50.1
40.3
50.0
80.2
7Y
ears
of
educa
tion
9.2
34.8
610.8
64.2
59.5
84.0
2E
mplo
ym
ent
rate
0.9
50.2
20.9
00.3
00.9
00.3
0C
olleg
egra
duat
e0.9
30.2
60.9
20.2
70.9
20.2
8N
on-c
olleg
egra
duat
e0.9
50.2
20.9
00.3
00.9
00.3
0L
abor
inco
me
(U.S
.doll
ars
)3,8
29
5,4
47
26,8
96
20,3
44
15,9
79
4,2
14
Colleg
egra
duat
e8,7
93
9,8
17
43,2
19
35,5
81
16,3
08
5,7
43
Non-c
olleg
egra
duat
e3,0
23
3,7
66
23,9
91
14,3
68
15,9
51
4,0
54
Wom
enShare
of
tota
l0.5
20.5
00.4
60.5
00.4
90.5
0A
ge
atm
igra
tion
37.9
79.4
930.2
28.5
428.9
17.5
4Y
ears
since
mig
rati
on
0.0
00.0
05.6
81.8
46.0
71.4
3C
olleg
egra
duat
ea0.1
30.3
40.2
20.4
10.1
50.3
6Y
ears
of
educa
tion
8.9
14.9
011.5
54.2
910.2
94.0
9E
mplo
ym
ent
rate
0.6
00.4
90.6
30.4
80.8
10.3
9C
olleg
egra
duat
e0.8
20.3
90.6
30.4
90.8
40.3
7N
on-c
olleg
egra
duat
e0.5
70.5
00.6
30.4
80.8
10.3
9L
abor
inco
me
(U.S
.doll
ars
)2,8
83
3,7
75
18,1
89
12,7
18
10,7
67
3,3
17
Colleg
egra
duat
e5,6
31
5,6
92
21,3
14
10,4
92
10,8
91
3,0
81
Non-c
olleg
egra
duat
e2,1
99
2,7
18
17,4
45
13,0
84
10,7
44
3,3
58
Num
ber
of
obse
rvat
ions
27,9
17
509
915
a.
Defi
ned
as
atle
ast
four
years
of
coll
ege.
Sourc
e:A
uth
ors
’analy
sis
base
don
dat
afr
om
INE
C(2
005),
U.S
.C
ensu
sB
ure
au
(2007),
and
INE
(2007).
62 T H E W O R L D B A N K E C O N O M I C R E V I E W
at International Monetary F
und on August 12, 2011
wber.oxfordjournals.org
Dow
nloaded from

this postcrisis migration wave, women were more likely than men to be able totake advantage of the family reunification provisions of U.S. immigration law(Sanchez 2004). Conversely, women made up most of the early migrants toSpain, where they were often employed as domestics and in elderly care(Jokisch and Pribilsky 2002).
Pretax labor earnings for Ecuadorians in the United States are well abovethose in Spain and Ecuador for both men and women and for all levels of edu-cation (see table 1). Average annual labor earnings for an Ecuadorian malecollege graduate in the United States are $27,000 more than in Spain; for non-college graduates the differences is $8,000.10 These data were collected in 2007for migrants, and the U.S. dollar depreciated substantially over the seven-yearreference period, implying that the data underestimate the difference in earn-ings at the time when most migrants decided to leave Ecuador.11
The three countries also differ in the variability of labor earnings. Earningsdispersion is greatest for Ecuador, while earnings appear to be compressedaround the mean for Ecuadorians in Spain (see table 1).12
I I I . S E L E C T I O N A N D S O R T I N G I N E D U C A T I O N
The descriptive statistics reported above suggest that the average Ecuadorian inthe United States was substantially more educated than the average Ecuadorianin Spain. This section provides a more rigorous comparison, controlling forindividual differences in observable characteristics, such as age and gender.
Migrants are said to be positively selected in education if their average edu-cational attainment is higher than that of stayers and negatively selected if it islower (Borjas 1999). And migrants to one destination can be said to be posi-tively sorted if their average education is higher than that of migrants to otherdestinations and negatively sorted if it is lower (Grogger and Hansonforthcoming).
To assess the degree of selection and sorting in education, two probitmodels are estimated for the probability of being a college graduate for asample that includes stayers and migrants (selection) or migrants to both
10. The labor earnings figures in table 1 are adjusted for inflation but not for differences in
purchasing power parity, because of the large size of remittances, both in absolute terms and relative to
migrants’ earnings. As a result, the appropriate price index is some unknown combination of the price
level in Ecuador and in the destination country. At any rate, the difference in the price levels in the
United States and Spain is very small. Taking the United States as the base (100 in 2007), Spain’s cost
of living was 95.5 (World Bank 2008). Ecuador’s cost of living was 42.2 in the same year.
11. The exchange rate stood at $0.92 per euro in 2000, when postcrisis migration reached its peak,
rising to $1.37 per euro in 2007 (World Bank 2008), when the labor earning figures were collected
(see also figure S.3 in the supplemental appendix).
12. The supplemental appendix contains additional descriptive statistics that are helpful in
understanding the likely labor market effects of Ecuadorian immigration in the United States and Spain
(see table S.3).
Bertoli, Fernandez-Huertas Moraga, and Ortega 63
at International Monetary F
und on August 12, 2011
wber.oxfordjournals.org
Dow
nloaded from

destinations (sorting). Several alternative specifications are considered, varyingin the control variables included (table 2).
The top two panels in table 2 present estimates for selection. For men, thereis clear evidence of negative selection in education for migrants to Spain (com-pared with stayers), as evidenced by the negative and significant coefficient onthe dummy variable for migration to Spain across all specifications. The esti-mated coefficient on the U.S. dummy variable is positive but not significant.For women, there is significant positive selection for migrants to the UnitedStates and a much smaller and not significant coefficient for migrants to Spain.This finding is robust to controlling for year of birth, marital status, andEcuadorian province of origin (not available for the U.S. data).
The two bottom panels of table 2 present estimates for sorting of migrationby education. The main explanatory variable takes a value of one if themigrant opted for Spain and zero if for the United States. The estimated coeffi-cient for the dummy variable for Spain is negative and highly significant acrossall specifications for both genders, meaning that both male and femaleEcuadorian migrants to Spain were negatively sorted in education relative tomigrants to the United States.
Ideally, the estimation would control for some measure of networks, but theACS 2007 data do not enable linking Ecuadorian immigrants to their commu-nities of origin. Still, it is highly unlikely that networks can account for theobserved pattern of negative sorting in education to Spain, as their greaterdensity in the United States should have contributed to the opposite pattern tothat found in the data.13
I V. E A R N I N G S A N D T H E D E C I S I O N T O M I G R A T E
With individual-level data, Mincer regressions can be run using observed earningsfor Ecuador, Spain, and the United States to estimate the returns to education forEcuadorians in each location, without having to rely on extrapolations fromincome figures for the general population, as in most empirical studies (Belot andHatton 2008; Grogger and Hanson forthcoming; Ortega and Peri 2009). Thedependent variable in the Mincer equations—which are gender- and country-specific—is the log of pretax annual earnings in 2005 dollars, and the regressionsare estimated on the subsample of employed individuals.14 The regressions
13. Bertoli (forthcoming) finds that the greater the density of migration networks (measured as the
share of households in each Ecuadorian county that had a member in the United States before the late
1990s crisis), the lower the average level of schooling of migrants that opted for the United States in the
aftermath of the crisis.
14. Following Heckman (1979), the robustness of the estimates was tested controlling for selection
into employment and adding household size among the regressors in the first stage. This had little
influence on estimated returns to education for men, given the high rates of employment in the three
countries (see table 1); the impact is larger for women, but it does not alter the differences across
countries that emerge in table 3 (see table S.4 in the supplemental appendix).
64 T H E W O R L D B A N K E C O N O M I C R E V I E W
at International Monetary F
und on August 12, 2011
wber.oxfordjournals.org
Dow
nloaded from

TA
BL
E2
.Sel
ecti
on
and
Sort
ing
Reg
ress
ions,
Pro
bit
Model
Spec
ifica
tion
Vari
able
(1)
(2)
(3)
(4)
(5)
(6)
Bir
thco
hort
sN
oY
esN
oY
esY
esY
esY
ear
of
bir
thdum
my
vari
able
No
No
Yes
No
No
No
Mari
tal
stat
us
No
No
No
Yes
Yes
Yes
Pro
vin
cedum
my
vari
able
No
No
No
No
No
Yes
Sel
ecti
on
ined
uca
tion
Men
born
in1949
–82
U.S
.m
igra
nt
dum
my
vari
able
–0.0
04
0.0
57
0.0
55
0.0
09
(0.1
02)
(0.1
03)
(0.1
03)
(0.1
03)
Spain
mig
rant
dum
my
vari
able
–0.3
55
–0.3
01
–0.3
13
–0.3
12
–0.2
79
–0.2
82
(0.1
01)*
**
(0.1
01)*
**
(0.1
01)*
**
(0.1
03)*
**
(0.1
05)*
**
(0.1
07)*
**
Num
ber
of
obse
rvat
ions
13,9
91
13,9
91
13,9
91
13,9
91
13,7
81
13,7
81
Wom
enborn
in1949
–82
U.S
.m
igra
nt
dum
my
vari
able
0.3
40
0.3
32
0.3
41
0.3
22
(0.1
02)*
**
(0.1
03)*
**
(0.1
04)*
**
(0.1
03)*
**
Spain
mig
rant
dum
my
vari
able
0.0
95
0.0
69
0.0
67
0.0
67
0.0
71
0.0
63
(0.0
90)
(0.0
91)
(0.0
91)
(0.0
91)
(0.0
86)
(0.0
86)
Num
ber
of
obse
rvat
ions
15,3
50
15,3
50
15,3
50
15,3
50
15,1
57
15,1
57
Sort
ing
ined
uca
tion
Mal
em
igra
nts
born
in1949
–82
Dum
my
Spain
mig
rant
dum
my
vari
able
–0.3
5–
0.3
83
–0.4
54
–0.4
04
(0.1
41)*
*(0
.145)*
*(0
.149)*
**
(0.1
43)*
**
Num
ber
of
obse
rvat
ions
688
688
688
688
Fem
ale
mig
rants
born
in1949
–82
Dum
my
Spain
mig
rant
dum
my
vari
able
–0.2
45
–0.2
92
–0.2
92
–0.2
54
(0.1
34)*
(0.1
40)*
*(0
.140)*
*(0
.140)*
Num
ber
of
obse
rvat
ions
736
736
736
736
***Sig
nifi
cant
atth
e1
per
cent
confiden
cele
vel;
**
signifi
cant
atth
e5
per
cent
confiden
cele
vel;
*si
gnifi
cant
atth
e10
per
cent
confiden
cele
vel.
Note
:N
um
ber
sin
pare
nth
eses
are
standard
erro
rs.
The
dep
enden
tvari
able
ishav
ing
aco
lleg
edeg
ree
(com
ple
ting
atle
ast
four
years
of
colleg
e).
Sourc
e:A
uth
ors
’ca
lcula
tions
usi
ng
dat
afr
om
INE
C(2
005),
U.S
.C
ensu
sB
ure
au
(2007),
and
INE
(2007).
Bertoli, Fernandez-Huertas Moraga, and Ortega 65
at International Monetary F
und on August 12, 2011
wber.oxfordjournals.org
Dow
nloaded from

include as explanatory variables a proxy for potential labor market experienceand its square, marital status, and a measure of educational attainment (either adummy variable for having a college degree or number of years of schooling).Potential labor market experience is defined as age minus the age at which edu-cation was completed, following Mincer (1974).15 For Spain and the UnitedStates, years since migration are included as a measure of labor market experienceat destination.
The findings are in line with the descriptive statistics in table 1. First, there isa high college wage premium in Ecuador (98 percent for men and a 107percent for women) and in the United States (45 percent for men and 37percent for women).16 In contrast, college-educated Ecuadorians in Spainearned virtually the same as non-college-educated ones. That is, the earningsprofile for Ecuadorians in Spain appears to be flat across education levels forboth men and women.17
The differences in the estimated college premia across the two destinationcountries are due neither to differences in time elapsed since migration, con-trolled for in specification 2 and 3, nor to differences in the legal status of theEcuadorian migrants in the two countries. In 2007, the share of Ecuadorianlegal residents was 60 percent in the United States18 and 91 percent in Spain.19
Therefore, accounting for legal status—for which individual-level data are notavailable for the United States—would likely result in an even larger gap incollege wage premia between the two destinations.
Specification 3 includes years of schooling as a measure of education: formen, the estimated return to an additional year of schooling is 9.8 percent in
15. This is defined as the number of years of schooling plus 6. Since it is reasonable to assume that
child labor experience does not increase adult wages, potential experience before the age of 16 is not
counted.
16. The ACS 2007 provides information on self-reported fluency in English for immigrants;
differential English fluency across education groups is likely to influence the observed college wage
premium for Ecuadorians. In the sample, 20 percent of non-college graduates do not speak any English
compared with less than 1 percent of college graduates. Once controls are included for English
proficiency in the Mincer equation for the United States, the estimated college premium for men falls
from 45 percent to 34 percent, though the difference is not statistically significant (see table S.4 in the
supplemental appendix).
17. The low R2 in the Mincer regressions for Spain can be related to the limited dispersion in
earnings among Ecuadorian migrants to Spain documented in table 1. This reflects the extreme wage
compression in Spain’s labor market for recent migrants, which is due mainly to the highly centralized
wage bargaining. In addition, Ecuadorians working in Spain were heavily concentrated in a few
occupations and sectors (mainly construction and household services; see table S.3 in the supplemental
appendix).
18. The ACS 2007 reports that 403,643 Ecuadorian-born people who were residing in the United
States as of January 1, 2007; for the same date, Hoefer, Rytina, and Baker (2008) report that an
estimated 160,000 Ecuadorians were residing illegally in the country, putting the share of legal migrants
at 60.4 percent. The share would be lower if only postcrisis migrants were considered.
19. Spain’s Local Population Registry recorded 434,673 Ecuadorians as of January 1, 2007. Of
these, 376,233 had legal residence permits and 19,345 were naturalized, putting the share of
Ecuadorian-born individuals residing legally in the Spain at 91 percent.
66 T H E W O R L D B A N K E C O N O M I C R E V I E W
at International Monetary F
und on August 12, 2011
wber.oxfordjournals.org
Dow
nloaded from

Ecuador, 3.7 percent in the United States, and 0.7 percent in Spain, with thelast figure not being significant. For both destination countries, the estimatedrate of return is significantly lower than the corresponding rate of return forthe general population, reinforcing the argument that relying on countrywidefigures to gauge income gains from migration can be misleading. Mincerregressions estimated on the ACS 2007 for the United States and the 2006Wage Structure Survey for Spain (INE 2006) show an 11.6 percent return formen in the United States and 5.4 percent in Spain.20
The Mincer regressions provide a basis for gauging the income gains frommigration provided that the non-random selection in unobservables across thethree countries does not significantly bias the returns to observable character-istics. Bertoli, Fernandez-Huertas Moraga, and Ortega (2010) adopt the semi-parametric approach proposed by Dahl (2002) to correct for selection inunobservables when predicting counterfactual earnings for Ecuadorians in thethree countries focused on here; their results suggest negligible selection bias.21
Table 4 displays the predicted average annual earnings based on specification1 in table 3, by gender and level of education, for Ecuadorians in each of thethree countries. College graduates enjoyed a larger earnings gain frommigrating to the United States (around $35,000 annually) than did non-collegegraduates (around $21,000; table 4). Migration to Spain entailed largerexpected gains in earnings for non graduates (around $11,000 annually) thanfor graduates (about $7,000).
What are the implications of these estimates for expected earnings for the scale,selection, and sorting of immigrants across destinations? First, wage differences bythemselves are unable to account for the differences in the scale of migration tothe United States and Spain, since most Ecuadorians migrated to Spain, the lowerearnings destination. This implies that other factors must have played a key role.
The education composition of migration across destinations is considerednext. The findings in the previous section on selection in education were incon-clusive, with two significant coefficients (male migration to Spain and femalemigration to the United States) and two non-significant ones.22 However, thecomparison of the average educational attainment of migrants to the United
20. These two regressions were estimated for the same set of controls as the results reported in table
3 (except for marital status in Spain, which is not available in the 2006 Wage Structure Survey) and for
individuals born in 1949–82. The rate of return for women is 13.4 percent in the United States and 5.6
percent in Spain (see table S.5 in the supplemental appendix).
21. Internal migrants in Ecuador were compared with Ecuadorian migrants abroad to further
address the concern of nonrandom selection in unobservables. Descriptive statistics show that internal
and international migration flows are similar in gender and education composition (see table S.6 in the
supplemental appendix); Mincer regressions estimated separately for stayers and internal migrants in
Ecuador show no significant differences in the returns to schooling (see table S.7 in the supplemental
appendix), which is reassuring about the limited influence on wages exerted by a possible nonrandom
selection in unobservables.
22. The significant results on selection are consistent with a linear utility specification of the Roy
model, as in Rosenzweig (2007) and Grogger and Hanson (forthcoming).
Bertoli, Fernandez-Huertas Moraga, and Ortega 67
at International Monetary F
und on August 12, 2011
wber.oxfordjournals.org
Dow
nloaded from

TA
BL
E3
.D
eter
min
ants
of
Labor
Earn
ings
inE
cuador,
the
Unit
edSta
tes,
and
Spain
Ecu
ador
Unit
edSta
tes
Spain
Vari
able
(1)
(3)
(1)
(2)
(3)
(1)
(2)
(3)
Men
born
in1949
–82
Yea
rsof
schooling
0.0
98
0.0
37
0.0
07
(0.0
02)*
**
(0.0
12)*
**
(0.0
04)
Colleg
egra
duat
ea0.9
76
0.4
49
0.4
46
0.0
06
–0.0
00
(0.0
33)*
**
(0.1
52)*
**
(0.1
51)*
**
(0.0
65)
(0.0
65)
Exper
ience
0.0
22
0.0
28
–0.0
08
–0.0
05
0.0
01
0.0
04
0.0
03
0.0
04
(0.0
04)*
**
(0.0
04)*
**
(0.0
23)
(0.0
23)
(0.0
23)
(0.0
10)
(0.0
10)
(0.0
10)
Exper
ience
,sq
uare
d–
0.0
01
–0.0
01
0.0
00
0.0
00
–0.0
00
–0.0
00
–0.0
00
–0.0
00
(0.0
00)*
**
(0.0
00)*
**
(0.0
00)
(0.0
00)
(0.0
00)
(0.0
00)
(0.0
00)
(0.0
00)
Yea
rssi
nce
mig
rati
on
0.0
64
0.0
59
0.0
20
0.0
18
(0.0
22)*
**
(0.0
23)*
*(0
.011)*
(0.0
11)*
Mari
tal
stat
us
0.2
92
0.2
17
–0.0
02
–0.0
19
0.0
27
–0.0
13
–0.0
12
–0.0
08
(0.0
20)*
**
(0.0
20)*
**
(0.1
05
(0.1
04)
(0.1
05)
(0.0
33)
(0.0
33)
(0.0
33)
R2
0.1
80.2
80.0
70.1
30.1
10.0
04
0.0
20.0
3
Num
ber
of
obse
rvat
ions
11,9
85
11,9
85
196
196
196
386
386
386
Wom
enborn
in1949
–82
Yea
rsof
schooling
0.1
22
0.0
34
0.0
05
(0.0
03)*
**
(0.0
23)
(0.0
05)
Colleg
egra
duat
ea1.0
67
0.3
71
0.3
40
0.0
29
0.0
28
(0.0
35)*
**
(0.1
42)*
**
(0.1
45)*
*(0
.051)
(0.0
51)
Exper
ience
0.0
03
0.0
09
0.0
08
0.0
05
0.0
11
0.0
02
0.0
00
0.0
01
(0.0
06)
(0.0
06)
(0.0
30)
(0.0
29)
(0.0
28)
(0.0
14)
(0.0
15)
(0.0
15)
Exper
ience
,sq
uare
d–
0.0
001
0.0
00
–0.0
003
–0.0
003
–0.0
00
0.0
00
0.0
00
0.0
00
(0.0
00)
(0.0
00)
(0.0
01)
(0.0
01)
(0.0
01)
(0.0
00)
(0.0
00)
(0.0
00)
Yea
rssi
nce
mig
rati
on
0.0
44
0.0
42
0.0
07
0.0
05
(0.0
37)
(0.0
39)
(0.0
15)
(0.0
15)
Mari
tal
stat
us
0.1
05
0.0
74
–0.1
76
–0.1
66
–0.1
49
–0.0
94
–0.0
96
–0.0
97
(0.0
30)*
**
(0.0
28)*
**
(0.1
42)
(0.1
43)
(0.1
42)
(0.0
43)*
*(0
.041)*
*(0
.041)*
*
R2
0.1
80.3
10.0
50.0
60.0
60.0
40.0
40.0
4
Num
ber
of
obse
rvat
ions
7,0
55
7,0
55
139
139
139
371
371
371
***Sig
nifi
cant
atth
e1
per
cent
confiden
cele
vel;
**
signifi
cant
atth
e5
per
cent
confiden
cele
vel;
*si
gnifi
cant
atth
e10
per
cent
confiden
cele
vel.
Note
:N
um
ber
sin
pare
nth
eses
are
standard
erro
rs.
The
dep
enden
tvari
able
isth
elo
gof
yearl
ypre
tax
labor
earn
ings.
a.
Defi
ned
as
hav
ing
atle
ast
four
years
of
colleg
e.
Sourc
e:A
uth
ors
’analy
sis
base
don
dat
afr
om
INE
C(2
005),
U.S
.C
ensu
sB
ure
au
(2007),
and
INE
(2007).
68 T H E W O R L D B A N K E C O N O M I C R E V I E W
at International Monetary F
und on August 12, 2011
wber.oxfordjournals.org
Dow
nloaded from

States and to Spain (sorting) turned out to be much more revealing, showingpositive sorting toward the United States, for both male and female migrants.The pattern of sorting is consistent with the estimated earnings forEcuadorians in each location reported earlier. The United States offered a sub-stantially higher college wage premium than Spain, which can account for thepositive sorting toward the United States.
In conclusion, wages differences across the three locations can account forthe differences in skill composition of the migration episode analyzed here.However, other factors must be incorporated to account for the differences inthe size of the flows.
V. I M M I G R A T I O N P O L I C I E S A N D T H E C H O I C E O F D E S T I N A T I O N
A country’s attitude toward immigration is manifested in a host of policies,including amnesties for illegal aliens, pension rights portability, quotas on legalimmigrants, enforcement of border controls, and visa requirements for nonim-migrant admissions. While the literature acknowledges that these factors affectimmigration, much less is known about their individual effects.
Why did most Ecuadorians go to Spain despite the substantially largerincome gains from migrating to the United States? Several factors might havehad a role, but identifying their individual influence is difficult. Such factorsinclude the cultural and linguistic ties between Ecuador and Spain, Spain’smore generous welfare services, characteristics of Ecuadorian networks in bothcountries, and the greater ease of legally entering and of becoming a resident,among others.23
TA B L E 4. Predicted Earnings
Ecuador United States Spain
Variable Mean Standard error Mean Standard error Mean Standard error
Men born in 1949–82College graduatea 6,066 210 40,976 3,569 13,403 911Non-college graduate 2,164 41 23,868 1,313 13,181 475Women born in 1949–82College graduatea 4,175 161 28,593 2,771 9,074 540Non-college graduate 1,400 41 15,847 1,155 9,036 437
Note: Predictions are based on specification (1) in table 3.
a. Defined as having at least four years of college.
Source: Authors’ analysis based on data from INEC (2005), U.S. Census Bureau (2007), andINE (2007).
23. Additional time-invariant factors that are not accounted for by the wage differential are
represented by the lower costs of living in Spain, lower income taxes in the United States (Bertoli,
Fernandez-Huertas Moraga, and Ortega 2010), and lower cost of sending remittances from the United
States, because dollarization in Ecuador enabled Ecuadorians to avoid the unfavorable exchange rates
that usually apply to these transfers (see http://remittanceprices.worldbank.org).
Bertoli, Fernandez-Huertas Moraga, and Ortega 69
at International Monetary F
und on August 12, 2011
wber.oxfordjournals.org
Dow
nloaded from

This section looks at the role played by just one factor: the visa waiverprogram that eased Ecuadorian travel to Spain. Its termination in 2003 permitsisolating the effect of this one dimension of immigration policy onEcuadorians’ migration choices.
But first consider some of the differences for Ecuadorians in legally enteringand becoming a resident in the United States and in Spain. Legal migration tothe United States between 1999 and 2005 occurred mostly through familyreunification provisions (17,396 cases of family-based preferences and 36,412cases of close relatives of naturalized immigrants); few Ecuadorians (7,705)obtained a legal residence permit through employment-based preferences (U.S.Department of Homeland Security various years). More than half of the immi-grants over the reference period were undocumented residents, with fewoptions to regularize their status, as the United States has not approved ageneral amnesty since the Immigration Reform and Control Act of 1986. Legalmigration to Spain depended mainly on obtaining a work visa, but undocu-mented Ecuadorians also had several opportunities to legalize their statusthrough one of Spain’s frequent amnesties in the early 2000s. Spain also hadfaster access to citizenship. Ecuadorians become eligible for naturalization aftertwo years of legal residence (a shorter period is required for Ecuadorians ofproven Spanish descent). In the United States, Ecuadorians can apply for citi-zenship only five years after obtaining legal residency documentation (greencard).24
An apparently small but important difference in immigration policies wasthe need for Ecuadorians to obtain a visa to enter the United States, while theycould visit Spain for up to three months without a visa provided that they hadapproximately $2,000, a credit card, a travel plan, hotel reservations, con-firmed return flight, and justification for visiting (Jokisch and Pribilsky 2002).
Most Ecuadorians who wished to immigrate to Spain simply overstayed thethree-month period, became undocumented workers, and waited for a generalamnesty. Conditions for undocumented workers were much easier in Spainthan in the United States. Government raids on workplaces were rare, andeveryone residing in Spain had access to free healthcare regardless of immigra-tion status. Illegal immigrants to the United States, by contrast, often experi-enced expensive and risky travel, a hostile social environment, fear ofapprehension and deportation, and exclusion from most government services.
When Spain’s visa waiver program was terminated in the summer of 2003,there were no other relevant changes in U.S. or Spanish immigration policytoward Ecuadorians, including in immigrants’ access to public services, inEcuadorian networks, or in cultural or economic conditions. Thus the changein Ecuadorian inflows into Spain in the months following termination of the
24. Access to Spanish citizenship is regulated by the Constitution and by the Ley Organica 4/2000,
while criteria for access to U.S. citizenship are set by the Constitution and the 1952 Immigration and
Naturalization Act, partially revised in the early 2000s.
70 T H E W O R L D B A N K E C O N O M I C R E V I E W
at International Monetary F
und on August 12, 2011
wber.oxfordjournals.org
Dow
nloaded from

visa waiver helps to isolate its role in Ecuadorians’ destination decision. InMarch 2003, the European Union included Ecuador among the countrieswhose nationals had to have a visa to enter any EU member state (Council ofthe European Union 2003). Spain complied with this regulation on June 3,2003, notifying Ecuador that the visa waiver would be suspended as of August3, 2003 (Boletın Oficial del Estado 2003).
The inflow of Ecuadorians to Spain dropped sharply immediately after thevisa requirement went into effect (figure 2).25 Average monthly inflows fellfrom 7,862 in the 12 months before the change to 1,566 in the following 12months.26 The United States became the main destination for Ecuadorians in2004 and 2005 (see figure 1).
Such a dramatic effect from termination of the visa waiver might seem sur-prising. Visa waivers do not receive as much attention in the literature as some
FIGURE 2. Monthly Inflows of Ecuadorians to Spain, 1999–2007
Source: Authors’ calculations using data from INE (various years).
25. These data are from the Local Population Registry. Its accuracy is very high, particularly since
January 2000, when the Ley Organica 4/2000 increased the incentives for illegal migrants to register by
allowing them to document their residence in Spain for future amnesties (see Fernandez-Huertas
Moraga, Ferrer, and Saiz, 2009).
26. A regression of the monthly inflows of Ecuadorians into Spain between January 1999 and
December 2005 was run for a set of monthly and yearly dummy variables to control for seasonality in
the data and for the confounding effect of macroeconomic conditions and a dummy variable for
introduction of the visa requirement. The estimated coefficient on the visa requirement variable was
–4,790 and highly statistically significant. Similar results were obtained when GDP per capita in the
three countries was included among the regressors; the estimated coefficient for the change in visa
policy was –5,026, confirming that the policy change introduced a structural break in the series. The
results are available from the authors on request.
Bertoli, Fernandez-Huertas Moraga, and Ortega 71
at International Monetary F
und on August 12, 2011
wber.oxfordjournals.org
Dow
nloaded from

other dimensions of immigration policy, such as quota size and skill require-ments.27 However, the great distance between Ecuador and Spain means thatair travel is virtually the only channel of entry, which simplified enforcement ofthe new visa requirement.
A related question is why the visa waiver had such a large effect on the desti-nation choice of Ecuadorian migrants. A reasonable hypothesis is that forEcuadorians for whom illegal migration was the only feasible alternative, Spainwas a much cheaper, and considerably safer, destination than the UnitedStates.
Anecdotal evidence suggests that illegal migration to the United Statescosted $7,000–$9,000 in the late 1990s (Jokisch and Pribilsky 2002), com-pared with $1,800 per migrant to Spain (based on self-reported data from theENI 2007). That difference was surely important for Ecuadorians, who facedtight liquidity constraints in the years following the crisis. Additionally,attempts to enter the United States illegally entailed a much higher risk ofdeportation (table 5). Between 1999 and 2005 some 21,605 Ecuadorian
TA B L E 5. Apprehensions and Deportations of Ecuadorian Migrants to theUnited States and Spain
Migrants to the United States Migrants to Spain
Year Mexicoa At seab INSc Total Expulsionsd Devolutionse Returnsf Total
1999 — 298 822 1,120 170 10 1,686 1,8662000 — 1,244 913 2,157 52 120 1,106 1,2782001 1,055 1,020 960 3,035 70 91 1,021 1,1822002 1,427 1,608 729 3,764 314 92 4,675 5,0812003 808 703 722 2,233 614 178 4,950 5,7422004 1,076 1,189 1,116 3,381 — — — —2005 3,276 1,149 1,490 5,915 — — — —Total 7,642 7,211 6,752 21,605 1,220 491 13,438 15,149
— is not available.
a. Apprehensions and deportations by Mexican authorities.
b. Alien migrants interdiction by the U.S. Coast Guard, fiscal year.
c. Aliens removed by the Immigration and Naturalization Service (now Immigration andCustoms Enforcement), fiscal year.
d. Repatriation of illegal aliens resident in the country.
e. Individuals who attempted to enter Spain illegally through nonborder areas.
f. Individuals rejected at Spanish borders.
Source: Authors’ analysis based on data from the INAMI (various years), U.S. Coast Guard(2010), U.S. Department of Homeland Security (various years), and Ministerio de Trabajo eInmigracion (various years).
27. Grogger and Hanson (forthcoming) control for visa waivers, which they find “are associated
with higher migration rates, although the effect is marginally significant.” Ortega (2005, 2010) studies
the political-economy determinants of immigration policy but focuses exclusively on quotas and skill
requirements.
72 T H E W O R L D B A N K E C O N O M I C R E V I E W
at International Monetary F
und on August 12, 2011
wber.oxfordjournals.org
Dow
nloaded from

migrants were caught at sea by the Coast Guard, in Mexico, or by U.S. borderpatrols.28 Over 1999–2003, some 15,149 Ecuadorian migrants were deportedfrom Spain, nearly all of them rejected at the border.
Combining the data on deportations from table 5, the data on totalmigration flows from figure 1, and information on legal migration from second-ary sources gives an approximate measure of the probability of apprehensionwhen attempting to migrate illegally to Spain or the United States (ratio ofnumber of deportations to the estimated number of illegal migrants plus depor-tations).29 The estimated probability was 23.6 percent for migrants to theUnited States and 5.7 percent for Spain (before the end of the vise waiverprogram).30 Illegal migrants to the United States also faced a high risk of deathin transit, whereas the voyage from Ecuador to Spain was safe andcomfortable.
V I . C O N C L U S I O N S
While the analysis in the article found that the skill composition of Ecuadorianmigration flows was consistent with the wages received by Ecuadorians at eachdestination, the larger size of the Ecuadorian migration flows to Spain was puz-zling considering the large college wage premium in the United States. Thepuzzle is resolved by taking into account that the options for migrating legallyto either country were severely limited and that migrating illegally to theUnited States was much more costly than migrating illegally to Spain, largelyfor policy-induced reasons.
The evidence presented here shows that changes in some dimensions ofimmigration policy can have very large effects on immigration flows. Mostlikely, the U.S. tightening of controls over illegal immigration since themid-1990s, combined with factors that made Spain an attractive destination,was effective in diverting the Ecuadorian exodus toward Spain. When the visa
28. A concern with deportation figures is that the same would-be migrant can be apprehended and
deported more than once and may eventually succeed in migrating; Pribilsky (2007, p. 166) observes
that “it is a common practice for Border Patrol agents to ‘throw back’ alien Mexicans caught crossing
illegally” and most Ecuadorians can successfully pretend to be Mexicans when apprehended, so that
they can make another attempt to cross the border. Still, the figures in table 5 include only those who
were identified as Ecuadorians by U.S. authorities and hence were deported to Ecuador.
29. The number of Ecuadorians who entered the United States illegally over 1999–2005 (70,000) is
from Hoefer, Rytina, and Baker (2008). The number for Spain takes the 303,555 Ecuadorians who
entered Spain between 1999 and 2003 from figure 1 and subtracts the 52,828 who were granted visas
over the same period, leaving approximately 250,727 Ecuadorians who entered Spain through
nonimmigrant admission provisions.
30. As with the monetary costs of migration, the income gain was still larger for migrating to the
United States rather than to Spain even after discounting the differences in the probability of failing to
reach the two countries. Still, the crisis of the 1990s probably increased the risk aversion of Ecuadorian
households, who would be more unwilling (and unable) to bear the costs of a migration attempt that
entailed a high risk of failure.
Bertoli, Fernandez-Huertas Moraga, and Ortega 73
at International Monetary F
und on August 12, 2011
wber.oxfordjournals.org
Dow
nloaded from

waiver granted to Ecuadorians was repealed in August 2003, the inflow ofEcuadorians to Spain halted almost immediately.
The inflows of Ecuadorians increased the relative supply of unskilled laborin both the United States and Spain. The effects on the U.S. labor market wereprobably very limited, as Ecuadorians represented just 1.3 percent of immigra-tion inflows to the United States in 1999–2005. Their share of immigrationinflows to Spain was substantially larger, at 12 percent.31 Still, there is wide-spread agreement among researchers that the largest effects of migration are onmigrants’ themselves, rather than on natives, in the form of income gains, partof which can be remitted back to the country of origin. Additionally, asHanson and McIntosh (2010b) argue for the case of Mexico, the large emigra-tion of Ecuadorians may have kept wages in Ecuador from falling as much asthey would otherwise have in the aftermath of the late 1990s crisis.Globalization can provide relief in times of severe economic distress.
RE F E R E N C E S
Beckerman, P., and A. Solimano, ed. 2002. Crisis and Dollarization in Ecuador. Washington, DC:
World Bank.
Beine, M., F. Docquier, and C. Ozden. Forthcoming. “Diasporas.” Journal of Development Economics.
Bertoli, S. Forthcoming. “Networks, Sorting and Self-selection of Ecuadorian Migrants.” Annales
d’Economie et de Statistique.
Bertoli, S., J. Fernandez-Huertas Moraga, and F. Ortega. 2010. “Crossing the Border: Self-selection,
Earnings and Individual Migration Decisions.” IZA Discussion Paper 4957. Institute for the Study
of Labor, Bonn, Germany.
Borjas, G.J. 1987. “Self-selection and the Earnings of Immigrants.” American Economic Review 77:
531–53.
———. 1999. “The Economic Analysis of Immigration.” In Handbook of Labor Economics Vol. 3.1,
ed. O. Ashenfelter, and D. Card. Amsterdam: Elsevier.
Boletın Oficial del Estado. 2003. No. 159, July 4th. www.boe.es. Madrid.
Council of the European Union. 2003. “Council Regulation (EC) 453/2003.” Official Journal of the
European Union L 69 : 10–11,
Dahl, G.B. 2002. “Mobility and the Return to Education: Testing a Roy Model with Multiple
Markets.” Econometrica 70 (6): 2367–420.
Fernandez-Huertas Moraga, J., A. Ferrer, and A. Saiz. 2009. “Localizacion de los Inmigrantes y
Preferencias Residenciales de la Poblacion Autoctona: ¿Nuevos guetos?”. Institute for Economic
Analysis (CSIC), Bellaterra (Barcelona), Spain.
Grogger, J., and G. Hanson. Forthcoming. “Income Maximization and the Selection and Sorting of
International Migrants.” Journal of Development Economics.
Hanson, G. 2006. “Illegal Migration from Mexico to the United States.” Journal of Economic
Literature 44 (4): 869–924.
Hanson, G., and C. McIntosh. 2010a. Birth Rates and Border Crossings: Latin American Migration to
the US, Canada, Spain, and the UK. NBER Working Paper 16471. Cambridge, MA: National
Bureau of Economic Research.
31. See also the discussion for table S.3 in the supplemental appendix.
74 T H E W O R L D B A N K E C O N O M I C R E V I E W
at International Monetary F
und on August 12, 2011
wber.oxfordjournals.org
Dow
nloaded from

———. 2010b. “The Great Mexican Emigration.” Review of Economics and Statistics 92 (4): 798–
810.
Heckman, J.J. 1979. “Sample Selection Bias as a Specification Error.” Econometrica 47: 153–61.
Hoefer, M., N. Rytina, and B.C. Baker. 2008. Estimates of the Unauthorized Immigrant Population
Residing in the United States: January 2007. Office of Immigration Statistics, Policy Directorate,
United States Department of Homeland Security, Washington, DC.
INAMI (Instituto Nacional de Migracion). Various issues. Boletın Estadıstico Anual. Mexico Distrito
Federal: Instituto Nacional de Migracion.
INE (Instituto Nacional de Estadıstica). 2001. Censo de Poblacion y Viviendas. Madrid: Instituto
Nacional de Estadıstica.
———. 2006. Encuesta de Structura Salarial. Madrid: Instituto Nacional de Estadıstica.
———. 2007. Encuesta Nacional de Inmigrantes. Madrid: Instituto Nacional de Estadıstica.
———. Various years. Estadıstica de Variaciones Residenciales. Madrid: Instituto Nacional de
Estadıstica.
INEC (Instituto Nacional de Estadıstica y Censo). 2001. Censo Poblacion y Vivienda. Quito: Instituto
Nacional de Estadıstica y Censo.
———. 2005. Encuesta Nacional sobre el Empleo y Desempleo en el Area Urbana y Rural. Quito:
Instituto Nacional de Estadıstica y Censo.
Jacome, L.I. 2004. “The Late 1990s Financial Crisis in Ecuador: Institutional Weaknesses, Fiscal
Rigidities, and Financial Dollarization at Work.” IMF Working Paper 04/12. International
Monetary Fund, Washington, DC.
Jokisch, B. 2001. “Desde Nueva York a Madrid: Tendencias en la Migracion Ecuatoriana.” Ecuador
Dedate 54: 59–84.
Jokisch, B., and J. Pribilsky. 2002. “The Panic to Leave: Economic Crisis and the ‘New Emigration’
from Ecuador.” International Migration 40 (4): 76–101.
Laeven, L., and F.V. Valencia. 2008. “Systemic Banking Crisis: A New Database.” IMF Working Paper
08/224. International Monetary Fund, Washington, DC.
Larrea, C. 2004. Pobreza, Dolarizacion y Crisis en el Ecuador. Quito: Ediciones Abya-Yala.
Mayda, A.M. 2010. “International Migration: A Panel Data Analysis of the Determinants of Bilateral
Flows.” Journal of Population Economics 23: 1249–74.
McKenzie, D., and H. Rapoport. 2010. “Self-selection Patterns in Mexico–U.S. Migration: The Role of
Migration Networks.” Review of Economics and Statistics 92 (4): 811–21.
Mincer, J. 1974. Schooling, Experience and Earnings. New York: Columbia University Press.
Ministerio de Trabajo y Inmigracion. Various years. Anuario Estadıstico de Inmigracion, Madrid:
Ministerio de Trabajo y Inmigracion.
Ortega, F. 2005. “Immigration Policy and Skill Upgrading.” Journal of Public Economics 89: 1841–63.
———. 2010. “Immigration, Citizenship, and the Size of Government.” The B.E. Journal of Economic
Analysis & Policy: Contributions 10 (1): Article 26.
Ortega, F., and G. Peri. 2009. The Causes and Effects of International Migrations: Evidence from
OECD Countries 1980–2005. NBER Working Paper 14883. Cambridge, MA: National Bureau of
Economic Research.
Pribilsky, J. 2007. La Chulla Vida: Gender, Migration and the Family in Andean Ecuador and
New York City. Syracuse, NY: Syracuse University Press.
Rosenzweig, M. 2007. “Education and Migration: A Global Perspective.” Yale University, New Haven,
CT.
Roy, A.D. 1951. “Some Thoughts on the Distribution of Earnings.” Oxford Economic Papers 3 (2):
135–46.
Bertoli, Fernandez-Huertas Moraga, and Ortega 75
at International Monetary F
und on August 12, 2011
wber.oxfordjournals.org
Dow
nloaded from

Ruggles, S., M. Sobek, A. Trent, C.A. Fitch, R. Goeken, P. Kelly Hall, M. King, and C. Ronnander.
2008. Integrated Public Use Microdata Series: Version 4.0 [Machine-readable database].
Minneapolis, MN: Minnesota Population Center.
Sanchez, J. 2004. “Ensayo sobre la Economıa de la Emigracion en Ecuador.” Ecuador Debate 63:
47–62.
Sjaastad, L.A. 1962. “The Costs and Returns of Human Migration.” Journal of Political Economy 70
(5): 80–93.
U.S. Census Bureau. 2000. United States Census. Washington, DC: Census Bureau.
———. 2007. American Community Survey. Washington, DC: Census Bureau.
U.S. Coast Guard. 2010. “Alien Migrant Interdiction.” Department of Homeland Security,
United States Coast Guard. www.uscg.mil/hq/cg5/cg531/amio.asp.
U.S. Department of Homeland Security. Various years. Yearbook of Immigration Statistics. Washington,
DC: Department of Homeland Security, Office of Immigration Statistics.
World Bank. 2008. World Development Indicators. Washington, DC: World Bank.
76 T H E W O R L D B A N K E C O N O M I C R E V I E W
at International Monetary F
und on August 12, 2011
wber.oxfordjournals.org
Dow
nloaded from

Do Migrants Improve Governance at Home?Evidence from a Voting Experiment
Catia Batista and Pedro C. Vicente
Can international migration promote better institutions at home by raising the demandfor political accountability? A behavioral measure of the population’s desire for bettergovernance was designed to examine this question. A postcard was distributed to house-holds promising that if enough postcards were mailed back, results from a surveymodule on perceived corruption would be published in the national media. Data from atailored household survey were used to examine the determinants of this behavioralmeasure of demand for political accountability (undertaking the costly action of mailingthe postcard) and to isolate the positive effect of international emigration using locality-level variation. The estimated effects are robust to the use of instrumental variables,including past migration and macro shocks in the destination countries. The estimatedeffects can be attributed mainly to migrants who emigrated to countries with better gov-ernance, especially migrants who return home. JEL codes: F22, O12, O15, O43, P16Keywords: international migration, governance, political accountability, institutions,effects of emigration in origin countries, household survey, Cape Verde, sub-SaharanAfrica
Recent research has examined the importance of international migration todevelopment in countries of origin. The positive effects on economic growthare well documented for international remittances, return migrants, diaspora
Catia Batista ([email protected]) is assistant professor at Trinity College Dublin and research affiliate
at the Institute for the Study of Labor (IZA). Pedro C. Vicente ([email protected]) is assistant professor at
Trinity College Dublin, research associate at the Centre for the Study of African Economies (CSAE),
University of Oxford, and research affiliate at the Bureau for Research and Economic Analysis of
Development (BREAD). The authors gratefully acknowledge useful comments from the journal editor and
three anonymous referees. Additional valuable suggestions were provided by Alan Barrett, Michel Beine,
Ron Davies, Claudia Martinez, Franco Mariuzzo, John McHale, Kevin O’Rourke, Pia Orrenius, Hillel
Rapoport, Frances Ruane, Maurice Schiff, Antonio Spilimbergo, Dean Yang, and participants in a number
of seminars and conferences. The authors are indebted to Paul Collier for his initial encouragement of this
research project. They thank the dedicated team of local enumerators with whom they worked, and
Deolinda Reis and Francisco Rodrigues at the National Statistics Office of Cape Verde. Research
assistance was provided by Mauro Caselli. Batista gratefully acknowledges financial support from the
George Webb Medley Fund at the University of Oxford. Vicente gratefully acknowledges financial support
from the Economic and Social Research Council (ESRC)–funded Global Poverty Research Programme for
the household survey conducted in Cape Verde on which this article is based.
THE WORLD BANK ECONOMIC REVIEW, VOL. 25, NO. 1, pp. 77–104 doi:10.1093/wber/lhr009Advance Access Publication May 12, 2011# The Author 2011. Published by Oxford University Press on behalf of the International Bankfor Reconstruction and Development / THE WORLD BANK. All rights reserved. For permissions,please e-mail: [email protected]
77
at International Monetary F
und on August 12, 2011
wber.oxfordjournals.org
Dow
nloaded from

effects promoting foreign investment and international trade, and emigration ofthe most educated.1 Less attention has gone to the influence of internationalmigration on the quality of institutions, which can be crucial to economicdevelopment (see Acemoglu, Johnson, and Robinson 2005).
The traditional perspective views emigration as a safety valve that allowsindividuals unhappy with their political institutions to leave their homecountry.2 Emigration could therefore be detrimental to the domestic politicalsystem (a form of “brain drain”) by undermining demand for political account-ability and, if those who leave are especially qualified to improve political insti-tutions, by weakening the capacity to supply better quality institutions.
Emigration may also promote improved political institutions in several ways:emigrants may create strong diaspora effects influencing political change (forexample, by influencing local authorities on the supply side or by exposing thedomestic population to better institutions abroad on the demand side). Ifreturn emigrants benefited from an enriching experience abroad, that couldalso translate into improvements in the quality of domestic political institutions(on the supply side by increasing direct participation in the political system andon the demand side by raising awareness and demand for politicalaccountability).
Because emigration could affect political institutions differently dependingon the context, what actually happens is an empirical question that remainsunanswered in the literature. This article tests the hypothesis that internationalmigration experiences promote better institutions at home by boosting demandfor political accountability.
Examining this question requires understanding popular demand forpolitical accountability. A simple voting experiment was used to capture abehavioral measure of demand for better governance at home. Following asurvey of perceived corruption in public services, respondents were asked tomail a prestamped postcard if they wanted the (anonymous) results of thissurvey to be made publicly available in the media. They were told that at least50 percent of respondents would have to return postcards for the informationto be released publically.
1. Evidence of the positive effects of remittances is provided, among others, by Edwards and Ureta
(2003) for El Salvador and Yang (2008) for the Philippines. Dustmann and Kirchkamp (2003),
Mesnard and Ravallion (2006) and Batista, McIndoe-Calder, and Vicente (2010) examine the role of
return migration. Gould (1994), Rauch and Trindade (2002), Kugler and Rapoport (2007), Iranzo and
Peri (2009), and Javorcik and others (forthcoming) evaluate the relationship between migrant networks,
and trade and foreign investment. The possibility of a “brain gain” as opposed to traditional “brain
drain” is empirically supported by Beine, Docquier, and Rapoport (2008) and Batista, Lacuesta, and
Vicente (forthcoming).
2. Hirschman (1970) proposed the “exit” vs. “voice” dichotomy by which citizens unhappy with
the domestic situation choose either to emigrate (exit) or to protest and contribute to political change
(voice). In this setting, emigration may be understood as a “safety valve,” which releases protest
intensity in the home political system and therefore reduces demand for political improvements.
78 T H E W O R L D B A N K E C O N O M I C R E V I E W
at International Monetary F
und on August 12, 2011
wber.oxfordjournals.org
Dow
nloaded from

This voting experiment was not a randomized controlled trial but simply away to obtain a behavioral measure of demand for political accountability.This measure is likely superior to standard self-reported measures from surveydata, which may suffer from “conformity bias” (respondents may want toconform to the perceived anticorruption message of the survey). This behavioralmeasure of demand for better institutions is therefore a methodological contri-bution of this article.
Tailored data from a purposely designed and conducted household survey inCape Verde is used to examine the determinants of voting behavior and toisolate the positive effect of international emigration on the demand for politi-cal accountability. A simple political economy framework takes voting behav-ior as the outcome of an expected cost-benefit analysis. A detailed survey wascustomized to control for potentially varying voting costs (such as the distanceto post mail and the ease and frequency of doing so) and for characteristicsaffecting perceived voting benefits (such as confidence in surveyors, income,and family structure). Overall, the results show that international emigrationpositively affects demand for improved political accountability, with strongereffects for migrants to countries with better governance and for return migrantsthan for current migrants.
Empirical evidence on the impact of emigration on the quality of politicalinstitutions in origin countries is scarce, but there are a few recent contri-butions. Docquier and others (2010) present cross-country evidence thatunskilled emigration from a large sample of developing countries toOrganisation for Economic Co-operation and Development countries over1975–2000 positively affected institutional quality in origin countries(measures of democracy and economic freedom). Though skilled emigrationhad an ambiguous effect in the short run, simulations found significant insti-tutional gains from “brain drain” over the long run, after considering incentiveeffects of the brain drain on human capital formation. Li and McHale (2009)describe possible mechanisms through which skilled emigration could affectpolitical and economic institutions at home, presenting cross-country evidencefor 1990–2006 consistent with the hypothesis of a positive effect on politicalinstitutions (particularly on political accountability) but not on economic insti-tutions. Spilimbergo (2009) uses evidence from 1960 to show that foreign edu-cation acquired in democratic countries seems to promote democracy in homecountries.
These empirical contributions are consistent with the results reported here,but they cannot distinguish between supply and demand forces nor capture themechanisms underlying the identified effects because they use aggregate dataand explore cross-country variation. This article uses tailored household surveydata for a single country, which allows focusing more specifically on theimpact of emigration on the demand for improved political accountability,while discriminating between the impact of return and current migrants.This approach relies on within country variation, rather than the traditional
Batista and Vicente 79
at International Monetary F
und on August 12, 2011
wber.oxfordjournals.org
Dow
nloaded from

cross-country source of variation. Reliance on data for a single country may,however, raise external validity concerns, so that contributions by these differ-ent lines of work are both important and complementary.
Section I presents an overview of Cape Verde, to provide context for thestudy. Section II describes the experimental design and theoretical frameworksupporting the empirical strategy. Section III details the tailored householdsurvey used in the empirical work, including the main descriptive statistics.These data are then used in the empirical analysis reported in section IV.Section V presents some concluding remarks.
I . A N I N T R O D U C T I O N T O C A P E V E R D E
Cape Verde is an island country off the coast of West Africa whose 441,000inhabitants live on nine islands. Much of the population is concentrated onSantiago, the largest island and home to the country’s capital, Praia (INE2002). The country is religiously and ethnically homogeneous: the index ofreligious fractionalization is 7.66 percent 3 (96 percent of the population isRoman Catholic). The ethnolinguistic fractionalization index is 41.74 percent,comparable to that in Spain and New Zealand and in contrast with high frac-tionalization indexes of more than 80 percent in 20 Sub-Saharan countries.
Cape Verde won its independence from Portugal in 1975, and a socialistregime took power. The first free elections took place in 1991, and a stabledemocracy has been in place since then. Governance has been good, particu-larly for a Sub-Saharan African country: Cape Verde ranked 46 of 180countries according to Transparency International (2009), slightly behindBotswana and Mauritius. The World Bank’s (2011) Worldwide GovernanceIndicators heralded Cape Verde as having the Best Control of Corruption inSub-Saharan Africa in 2005, after Botswana.
In economic performance, Cape Verde is ranked as a lower middle-incomeeconomy by the World Bank (2006), with a 2003 GDP per capita of $5,900(in purchasing power parity terms; Heston, Summers, and Aten 2006). With anaverage annual per capita economic growth rate of 4.4 percent over 1981–2004 (and 5.8 percent over 1991–2000), it has greatly outperformed theSub-Saharan African average of 0.6 percent, with only Equatorial Guinea (11percent) and Botswana (5 percent) growing faster (Heston, Summers, and Aten2006). While these countries have exports accounting for 47 percent and 55percent of GDP and are rich in natural resources, Cape Verde grew despite amuch smaller export share of 20 percent and a dearth of natural resources—infact, Cape Verde has been plagued by droughts and famines.
3. This index is computed as one minus the Herfindahl index of group shares and expresses the
probability that two randomly selected individuals from a population belong to different groups. See
Alesina and others (2003) for details.
80 T H E W O R L D B A N K E C O N O M I C R E V I E W
at International Monetary F
und on August 12, 2011
wber.oxfordjournals.org
Dow
nloaded from

Those droughts and famines have been closely related to the country’smassive emigration. Based on the stock of immigrants in most destinationcountries, Batista, Lacuesta, and Vicente (forthcoming) estimate that there arearound 100,000 Cape Verdean current emigrants, or about 23 percent of thepopulation. Also striking is the magnitude of brain drain emigration: an aston-ishing 68 percent of the educated labor force of Cape Verde lives abroad(Docquier and Marfouk, 2006). While these results depend on how educationalattainment is defined, this is arguably the highest rate in Africa. Finally, inter-national remittances are high, accounting for 16 percent of GDP over 1987–2003 (World Bank 2006).4 Remittances have always surpassed foreign directinvestment and have nearly duplicated the amount of foreign aid, particularlysince 2000.
Freedom House (2011) classifies Cape Verde as “among the freest mediaenvironments in Africa.” According to the Press Freedom Index, Cape Verderanked 44 of 175 countries in freedom of the press, close to France, Spain, andArgentina (Reporters without Borders 2009).
I I . E X P E R I M E N T A L D E S I G N A N D E M P I R I C A L S T R A T E G Y
To empirically evaluate the hypothesis that international emigration maypromote demand for better governance at home, this study offered respondentsto a survey on perceived corruption in public services the opportunity to (anon-ymously5) make the results available in the national media by participating in a“special referendum.” Following their completion of the corruption question-naire, respondents were offered the opportunity to vote for political account-ability by taking the incentive-compatible voting action of mailing a prepaidpostcard that read: “I wish that the conclusions of the survey on the quality ofnational public services (health, education, justice, . . .), conducted by theUniversity of Oxford (UK) in the first months of 2006 to 1,000 households inthe islands of Santiago, Sao Vicente, Santo Antao, and Fogo, be made public inthe Cape Verdean media.” Interviewers told each respondent that “it is veryimportant that you put the postcard in the mail if you want Cape Verdeans tobe able to demand higher quality public services.”6
4. This share is likely an underestimate as it is based on official statistics, which exclude informal
channels, both legal and illegal.
5. Postcards were anonymous in the sense that respondents did not have to write their names on the
postcard. This is the message that interviewers were instructed to convey. However, each postcard had a
six-digit number that linked each postcard to each interviewed household, so that the household and
respondent characteristics were known for each returned postcard.
6. The interview, which averaged 60 minutes, asked explicit questions about the need to bribe
public officials or to otherwise influence them in order to receive public services. The postcard referred
to “the quality of public services” instead of “corruption” in order to minimize behavior correlated
with public opinion about corruption and thus to elicit a more accurate behavioral measure of the
demand for political accountability.
Batista and Vicente 81
at International Monetary F
und on August 12, 2011
wber.oxfordjournals.org
Dow
nloaded from

The results on perceived corruption in public services would be made publicif 50 percent or more of the postcards were returned. To add credibility to thesurvey, a “media contract” between survey fieldworkers and respondentsdetailed the promise that the survey results would be publicized in the nationalmedia provided at least half of respondents returned the postcards. Newsreports and interviews on national television, radio, and newspapers helped topublicize the media contract and to confer legitimacy on the effort.
This voting experiment was not a randomized controlled trial but rather asimple means to elicit a behavioral measure of demand for political account-ability. Using a behavioral measure is likely superior to standard self-reportmeasures, which may be tainted by “conformity bias”—respondents would bemore likely to conform to what they believe are the interviewers’ expectationsabout anticorruption attitudes. This hypothesis cannot be rejected from theempirical evidence in this article, as discussed in section IV.
Theoretical Framework
Before testing whether international emigration increases the desire for politicalaccountability at home, a theoretical framework was developed to elucidate thedeterminants of voting in this postcard experiment.
There are many potentially relevant political economy theories of turnoutand voting, as surveyed by Merlo (2006). Following the traditional literatureon electoral participation, voter turnout was modeled as the outcome of anexpected cost-benefit analysis.7
The postcard distributed to the survey respondents was prestamped, so thecost of voting was largely the opportunity cost of mailing it. This cost coulddepend on how familiar respondents were with posting mail and with howpractical it was to do so. The cost will be higher for people who are not usedto posting mail, those for whom it is more difficult to do so, and those withhigher labor income.
The literature emphasizes the importance of considering an individual’s cal-culation of expected benefits. The expected benefit of mailing the postcardarises from the desire for political accountability, which is the focus of thisarticle. Crucially, survey respondents who are more confident about the trust-worthiness and independence of the foreign institution sponsoring the survey(and about the reliability of the Cape Verdean postal system) will attribute ahigher probability to the public dissemination of the results on perceived cor-ruption. The expected benefit is finally a function of other variables directlyaffecting the desire for political accountability. Of greatest interest is the effectof international emigration, but factors such as gender, age, education, wealth,
7. Downs (1957) first provided a “calculus of voting” framework, which was later formalized by
Tullock (1967) and Riker and Ordeshook (1968). Because of the simple nature of the voting experiment
(a simple decision to vote or not), we can ignore strategic voting considerations and assume sincere
voting behavior.
82 T H E W O R L D B A N K E C O N O M I C R E V I E W
at International Monetary F
und on August 12, 2011
wber.oxfordjournals.org
Dow
nloaded from

and family ties must also be considered (see, for instance, Alesina and Giuliano2009).
Empirical Strategy
An individual respondent i’s voting decision on the survey (and therefore thedemand for better political accountability) can be summarized by the followinglatent variable model:
Vi ¼ 1 ðV�i �Þ�� >V�i ¼ a0 þ a1Ml þ a02Xi þ 1i:
This decision will be made whenever the (unobserved) expected net benefitfrom voting, Vi
*, is positive. The expected net benefit from voting depends onthe local proportion of migrants, Ml, with impact a1 on voting behavior,which is the primary estimate of interest.8 The main explanatory variable iscomputed as:
Proportion of international migrants within the household’s spatial area ofresidence
¼ Number of migrants in the locality
Number of residents in the locality
where migrants includes both current and return migrants. The effect of thelocal proportion of migrants on an individual’s demand for good governanceincludes direct and indirect effects—effects arising directly from the presence ofreturn migrants and indirect effects due to the influence return migrants exerton their peers (think, for instance, of neighbor families with no migrants whobecome more sensitive to governance issues after talking to a return migrantneighbor who lived in the United States for some years). An additional sourceof indirect migrant impact on the demand for accountability by local residentsis the influence of current migrants who keep in touch with family and friends.Thus the proportion of migrants within a household’s spatial area of residencecan be understood as a proxy for how frequently a resident can be expected tomeet migrants (or their relatives and friends) in this locality. Recall that eventhough the results intuitively point to the importance of return migrants, theframework is sufficiently wide to encompass the impact on the locality oforigin of current migrants—through their contacts with family and friends, forinstance.
Second, the empirical specification includes a vector of individual, house-hold, and locality characteristics, Xi, determining the costs and benefits ofmailing the voting postcard. This vector includes individual demographics(such as age as a determinant of the ease of mailing the postcard and of the
8. Locality here is a census area in Cape Verde, which corresponds roughly to a small
neighborhood, where social interaction would be expected to occur.
Batista and Vicente 83
at International Monetary F
und on August 12, 2011
wber.oxfordjournals.org
Dow
nloaded from

demand for accountability) and individual controls for how familiar someoneis with posting mail and how practical it is. In addition, there is an individualindicator of confidence in the foreign institution sponsoring the survey andexperiment. At the household level, vector Xi includes variables such as familystructure and asset ownership, which are likely determinants of an individual’ssubjective valuation of the benefit of improved governance. At the localitylevel, the analysis controls for average expenditure per capita and for the shareof local residents working in agriculture, construction, and retail trade, whichmay also influence the perceived benefit of better governance. All regressionsalso include island fixed effects.
Probit regressions are used to estimate this empirical model. Variation ofmigration behavior across localities, after controlling for individual, household,and local characteristics, is the source of variation that enables identification ofthe main coefficient of interest,a1.
Unlike with family-level variation, using locality-level variation mitigatesself-selection concerns based on unobservable characteristics: unobservedability (which may increase both migration and demand for good governance)may be correlated across family members but that is not likely at the localitylevel. Indeed, using locality-level variation should permit averaging out unob-served heterogeneity to some extent, thus avoiding the most apparent endo-geneity problems. Moreover, Cape Verde is a small, homogeneous country,which rules out the most obvious (potentially omitted) factors that couldpromote migration and accountability demand simultaneously at the localitylevel.
I I I . D A T A D E S C R I P T I O N : TA I L O R E D H O U S E H O L D S U R V E Y
The empirical work is based on a household survey on migration and thequality of public services designed to answer the research questions. The surveywas conducted in Cape Verde from December 2005 to March 2006 by theauthors, who were affiliated with the University of Oxford. (Additional detailson the fieldwork and survey are at www.csae.ox.ac.uk/resprogs/corruption/cv/cv.htm.)
The survey was submitted to a representative sample of 1,066 residenthouseholds (997 complete interviews) in 5 percent of the 561 census areas ofCape Verde. This sample provided information on resident nonmigrants andreturn migrants and on a large sample of current emigrants. The questionnaireincluded a module on the perceived quality/corruption of public services andone on migration characteristics of the household (including full migration his-tories). The interviewed household member, who had to be at least 30 yearsold, was asked to provide the socio-demographic characteristics of all house-hold members, including children living elsewhere. The respondent was alsoasked to characterize all migration spells of household members, includingwho emigrated, where, and when. Finally, there were questions about the
84 T H E W O R L D B A N K E C O N O M I C R E V I E W
at International Monetary F
und on August 12, 2011
wber.oxfordjournals.org
Dow
nloaded from

household’s economic situation, such as living standards, income, and whetherany member had received remittances the previous year. (An English trans-lation of the questionnaire is available at www.csae.ox.ac.uk/resprogs/corruption/cv/questcveng.pdf.)
Face to face survey interviews were conducted by teams of local interviewersand the authors, who recruited and trained the local teams. Interviewersreceived at least 18 hours of training in groups of two or three on understand-ing the content/objectives of the survey, answering the questionnaire, andpiloting.
Census areas for the sample were chosen randomly, with weighting bynumber of households, and households within a census area were chosen ran-domly using standard techniques (nth house, with second visits attempted thesame day). To be eligible, members of the household had to be resident in thecountry any time during 1985–2006.
The random sampling of households had two weaknesses: differences in thenumber of attempts to interview a selected household in the different censusareas and differences in the number of nonresponses. Weighted data were usedto account for these problems, although differences from unweighted data arenegligible. Data collected on nonrespondents on their gender, approximate age,approximate schooling, and approximate income were used for this purpose.
About half the respondents did not provide information on income, soregressions were run with 452 observations, at most.9
The survey data on nonmigrants, return migrants, and current migrantsshow that relative to nonmigrants, current emigrants are slightly more likely tobe male and in their prime working years (ages 21–50; table 1). They are alsomore likely to have a postsecondary education. Return migrants are stronglymore likely to be male (compared with both residents and current migrants)and most are over 50 years old. They tend to be less educated than currentmigrants, but are still more likely than residents to have a postsecondaryeducation.
The survey results on annual migration flows over 2000–05 are close tothose for the last national census period 1995–2000 (INE 2002), for bothmigrant outflows (around 4 percent) and returns (about 20 percent). Portugal(55 percent) and the United States (20 percent) are the main destination
9. An attrition analysis was conducted to evaluate the impact of the missing observations on the
baseline econometric results (with and without controls) using multiple imputation methods. It showed
that comparing the effect of local migration on voting behavior when observations without income
information are excluded has a large impact on the magnitude and significance of the estimated results.
When multiple imputation methods were used to recover the missing information, the magnitude of
estimated coefficients falls but the statistical significance remains. This suggests that the missing income
observations influence the magnitude of estimated effects, which would likely be smaller were income
data available for all respondents, but that the positive sign and statistical significance of the estimates
remain in all possible specifications. The results are fairly stable, however, regardless of the number of
imputations performed (if anything, results improve as the number of imputations rises).
Batista and Vicente 85
at International Monetary F
und on August 12, 2011
wber.oxfordjournals.org
Dow
nloaded from

countries for migrants; again, these results are similar to official census stat-istics (INE 2002). The next most popular destinations are European countries(France with 12%, Netherlands and Luxemburg with 2% each) and Brazil(with 3%).
Because only 43 percent of the postcards were returned, the results of thesurvey were not published in the national media.
I V. E M P I R I C A L R E S U L T S
This section on the main empirical results focuses on the robustness of the esti-mates of a gain in the demand for political accountability arising from inter-national migration.
Baseline Results
The baseline estimation of the probability of a given survey respondent return-ing the postcard is shown in table 2 (column 1). Even before controlling forother covariates (except for urban locality and island fixed effects), there is
TA B L E 1. Characteristics of Cape Verdean Migrants and Nonmigrants
Characteristic Nonmigrants Current migrants Return migrants
Sample size 4997 907 241Gender (%)Male 48 52 64Female 52 48 36
Age (%)0–10 years 21.4 0.4 2.411–20 years 28.6 11.2 4.921–30 years 12.9 33.9 5. 531–40 years 13.1 25.0 17.641–50 years 10.1 20.5 15.851–60 years 4.4 8.0 11.561–70 years 4.2 0.9 18.871–80 years 3.8 0.2 20.681–90 years 1.2 0.0 3.0.91 years 0.02 0.0 0.00
Education (males ages 15–64; %)No education 3.7 3.6 5.2Preschool 1.5 0.7 0.0Basic reading and writing 11.4 8.2 14.3Primary 59.7 62.4 50.7Intermediate secondary 18.8 9.9 19.5Secondary 1.1 0.4 3.9Postsecondary 3.8 14.9 6.5
Note: Numbers may not sum to 100 because of rounding.
Source: Authors’ survey.
86 T H E W O R L D B A N K E C O N O M I C R E V I E W
at International Monetary F
und on August 12, 2011
wber.oxfordjournals.org
Dow
nloaded from

TA
BL
E2
.Pro
babil
ity
of
ing
Voti
ng
Post
card
(Colu
mns
1–
6,
Marg
inal
Eff
ects
of
Pro
bit
Est
imat
es)
and
Pro
babil
ity
of
Sel
f-re
port
edD
emand
for
Acc
ounta
bilit
y(C
olu
mn
7,
Ord
ered
Pro
bit
Est
imat
es):
Base
line
Res
ult
s
Vari
able
(1)
(2)
(3)
(4)
(5)
(6)
(7)
Pro
port
ion
of
inte
rnat
ional
mig
rants
(rel
ativ
eto
resi
den
ts)
inlo
cality
0.9
419
0.9
446
1.0
103
1.0
724
1.1
034
1.0
886
2.0
218
(0.3
465)*
**
(0.3
512)*
**
(0.3
623)*
**
(0.3
510)*
**
(0.3
859)*
**
(0.3
677)*
**
(1.3
204)
Tru
stin
Oxfo
rdU
niv
ersi
ty0.0
077
0.0
211
0.0
228
0.0
334
0.0
348
0.0
365
(0.0
232)
(0.0
231)
(0.0
226)
(0.0
238)
(0.0
237)
(0.0
665)
Habit
of
post
ing
0.0
045
0.0
083
0.0
100
0.0
089
0.0
092
–0.0
152
(0.0
132)
(0.0
127)
(0.0
127)
(0.0
137)
(0.0
138)
(0.0
267)
Male
–0.0
863
–0.0
928
–0.0
751
–0.0
751
0.1
954
(0.0
485)*
(0.0
467)*
*(0
.0485)
(0.0
485)
(0.1
179)*
Age
0.0
207
0.0
161
0.0
131
0.0
140
–0.0
602
(0.0
134)
(0.0
143)
(0.0
143)
(0.0
142)
(0.0
304)*
*A
ge
square
d–
0.0
002
–0.0
002
–0.0
001
–0.0
001
0.0
004
(0.0
001)
(0.0
001)
(0.0
001)
(0.0
001)
(0.0
003)
Indiv
idual
labor
inco
me
–0.0
002
–0.0
002
–0.0
003
–0.0
003
0.0
001
(0.0
001)*
*(0
.0001)*
*(0
.0001)*
*(0
.0001)*
*(0
.0003)
Num
ber
of
chil
dre
n0.0
205
0.0
212
0.0
215
0.0
189
(0.0
120)*
(0.0
120)*
(0.0
121)*
(0.0
296)
House
hold
ass
etow
ner
ship
–0.1
401
–0.1
242
–0.1
244
–0.0
016
(0.0
626)*
*(0
.0651)*
(0.0
647)*
(0.1
569)
(Conti
nued
)
Batista and Vicente 87
at International Monetary F
und on August 12, 2011
wber.oxfordjournals.org
Dow
nloaded from

TA
BL
E2.
Conti
nued
Vari
able
(1)
(2)
(3)
(4)
(5)
(6)
(7)
Ave
rage
pri
vat
eco
nsu
mpti
on
expen
dit
ure
per
capit
ain
loca
lity
0.9
789
0.6
916
–0.9
512
(0.6
637)
(0.7
866)
(1.8
530)
Share
of
resi
den
tsw
ork
ing
inagri
cult
ure
inlo
cality
–0.8
688
–1.2
906
–0.1
134
(0.5
572)
(0.9
234)
(2.1
112)
Share
of
resi
den
tsw
ork
ing
inco
nst
ruct
ion
inlo
cality
–0.5
909
–0.7
994
–6.8
096
(1.1
277)
(1.1
626)
(2.5
307)*
**
Share
of
resi
den
tsw
ork
ing
inre
tail
trade
inlo
cality
1.2
200
0.9
100
4.2
588
(1.6
264)
(1.7
060)
(3.3
857)
Share
of
house
hold
sre
ceiv
ing
inte
rnat
ional
rem
itta
nce
sin
loca
lity
0.9
963
(1.3
944)
Num
ber
of
obse
rvat
ions
452
452
452
452
452
452
451
*Sig
nifi
cant
atth
e10
per
cent
leve
l;**
signifi
cant
atth
e5per
cent
leve
l;***
signifi
cant
atth
e1per
cent
leve
l.
Note
:N
um
ber
sin
pare
nth
eses
are
robust
standard
erro
rscl
ust
ered
atth
elo
cality
leve
l.A
llre
gre
ssio
ns
incl
ude
urb
an
loca
lity
dum
my
vari
able
and
isla
nd
fixed
effe
cts.
Sel
f-re
port
eddem
and
for
acco
unta
bilit
yis
expre
ssed
as
a1
–7
scale
.
Sourc
e:A
uth
ors
’analy
sis
base
don
auth
ors
’su
rvey
.
88 T H E W O R L D B A N K E C O N O M I C R E V I E W
at International Monetary F
und on August 12, 2011
wber.oxfordjournals.org
Dow
nloaded from

a striking statistically significant difference between the postcard voting prob-ability of localities depending on the ratio of migrants to residents (each per-centage point increase in the ratio of migrants to residents, including bothcurrent and return migrants, leads to a 0.94 percentage point increase in theprobability of voting). After controlling for several individual- andhousehold-level covariates, the observed voting differences remain (see table 2,columns 2–4).
The signs of all significant coefficients are as expected and do not vary asadditional controls are included. Because of the potential for omitted-variablebias, several locality-level controls are added, such as average private consump-tion expenditure per capita and the occupational structure in the locality. Theaddition of these controls does not alter the magnitude and significance of theestimated effect (table 2, column 5). Another concern is that internationalmigration may be proxying for important local financial characteristics, so thatinternational remittances may also matter as determinants of the desire forbetter governance. That does not seem to be the case: including the proportionof local households receiving international remittances has an insignificanteconomic and statistical impact and almost no affect on the estimated coeffi-cients and significances of the other determinants included in the regression(table 2, column 6).
The baseline estimates are therefore those presented in column 5 of table 2.There is a strong negative income/wealth effect on the demand for moreaccountability. Having annual labor income with a negative estimated coeffi-cient would be difficult to interpret directly as a negative income effect as thiscould simply be proxying the opportunity cost (time value) of mailing the post-card. However, this effect is also strong for asset ownership: wealthier peopleseem to place less value on the benefits of political accountability, which isconsistent with Minier’s (2001) finding that democracy is not a normal good.At the local level, though, the results consistently point to average expenditureper capita as positively influencing postcard mailing behavior.
Baseline Robustness Checks
Several robustness checks were conducted. Drawing from the evidence on“brain gain” (Batista, Lacuesta, and Vicente, forthcoming), the first robustnesscheck addresses whether local education affects the way international migrationfor a locality generates a desire for political accountability. When controllingfor local educational attainment, intermediate secondary and secondary school-ing do not change the sign, magnitude, and statistical significance of the impactof local migration on the demand for political accountability (table 3, columns1–3). A postsecondary education, however, increases the migration effects,even though the positive coefficient on postsecondary education is not signifi-cant at conventional levels.
A potential concern with these estimated effects is that the probability ofmailing a postcard may depend on respondents’ experience with and
Batista and Vicente 89
at International Monetary F
und on August 12, 2011
wber.oxfordjournals.org
Dow
nloaded from

TA
BL
E3
.Pro
bab
ilit
yof
Mailin
gPost
card
(Mar
gin
al
Eff
ects
of
Pro
bit
Reg
ress
ions)
:R
obust
nes
sC
hec
ks
Vari
able
(1)
(2)
(3)
(4)
(5)
(6)
(7)
(8)
(9)
(10)
Pro
port
ion
of
inte
rnat
ional
mig
rants
(rel
ativ
eto
resi
den
ts)
inlo
cali
ty
1.1
091
1.0
818
1.3
132
0.9
140
1.1
349
0.9
889
1.0
639
0.9
920
0.9
012
1.0
104
(0.3
863)*
**
(0.4
054)*
**
(0.3
708)*
**
(0.4
334)*
*(0
.4159)*
**
(0.4
066)*
*(0
.3813)*
**
(0.3
680)*
**
(0.3
780)*
*(0
.4157)*
*
Rat
ioof
resi
den
ts
com
ple
ting
rela
tive
tore
siden
ts
not
com
ple
ting
9ye
ars
of
schooli
ng
inlo
cali
ty
–0.0
471
0.5
362
(0.2
704)
(0.3
314)
Rat
ioof
resi
den
ts
com
ple
ting
rela
tive
tore
siden
ts
not
com
ple
ting
12
years
of
schooli
ng
inlo
cali
ty
–0.3
184
–2.0
897
(0.4
014)
(0.7
537)*
**
Rat
ioof
resi
den
ts
com
ple
ting
rela
tive
tore
siden
ts
not
com
ple
ting
15
years
of
schooli
ng
inlo
cali
ty
1.8
460
6.1
358
(1.1
037)*
(1.9
907)*
**
Per
ceiv
edco
rrupti
on
in
hea
lth
sect
or
0.0
381
0.0
150
(0.0
147)*
**
(0.0
182)
Per
ceiv
edco
rrupti
on
in
educa
tion
sect
or
0.0
382
0.0
364
(0.0
154)*
*(0
.0191)*
90 T H E W O R L D B A N K E C O N O M I C R E V I E W
at International Monetary F
und on August 12, 2011
wber.oxfordjournals.org
Dow
nloaded from

Confiden
cein
post
al
syst
em–
0.0
144
–0.0
061
(0.0
263)
(0.0
288)
Wait
tom
ail
unti
lpass
esa
post
box
–0.0
366
–0.0
195
(0.1
955)
(0.2
044)
Giv
esto
(taxi)
dri
ver
topost
0.1
933
0.0
552
(0.1
696)
(0.2
303)
Giv
esto
fam
ily
mem
ber
to
post
0.0
884
–0.0
237
(0.1
390)
(0.1
515)
Giv
esto
lett
erca
rrie
r0.3
767
(0.2
607)
Makes
inte
nti
onal
trip
to
post
box
0.0
945
0.0
180
(0.1
167)
(0.1
287)
Tim
eto
post
box
–0.0
078
–0.0
128
(0.0
149)
(0.0
219)
Com
fort
inpost
ing
0.0
119
0.0
358
(0.0
130)
(0.0
251)
Num
ber
of
obse
rvat
ions
452
452
452
426
400
435
451
443
445
363
*Sig
nifi
cant
atth
e10
per
cent
leve
l;**
signifi
cant
atth
e5per
cent
leve
l;***
signifi
cant
atth
e1per
cent
leve
l.
Note
:N
um
ber
sin
pare
nth
eses
are
robust
standard
erro
rscl
ust
ered
atth
elo
cality
leve
l.A
llre
gre
ssio
ns
incl
ude
the
sam
eco
ntr
ols
as
the
base
line
regre
ssio
nin
colu
mn
5of
table
2.
Sourc
e:A
uth
ors
’analy
sis
base
don
auth
ors
’su
rvey
.
Batista and Vicente 91
at International Monetary F
und on August 12, 2011
wber.oxfordjournals.org
Dow
nloaded from

perceptions of corruption. That is indeed the case: respondents who perceivemore corruption in the health and education sectors (the sectors most respon-dents had contact with) are significantly more likely to mail the postcard(table 3, columns 4–5). The impact of perceived corruption also affects themagnitude and significance of the impact of international emigration, but theimpact is not systematically in one direction. Overall, the sign, magnitude, andbroad statistical significance of the effect of international migration remainstable throughout the different specifications. This result points to an intuitive,crucial role of perceived corruption in creating incentives for greater demandfor accountability.
Another important issue is to control properly for the cost of mailing thepostcard and the confidence when doing so. The sign, magnitude, and signifi-cance of the estimated coefficients on local international emigration are notstrongly affected by the choice of these controls (table 3, columns 6–9). Noneof these controls is ever statistically significant. This is consistent with the ideathat, although incentive compatible, the costs of mailing the postcard are ofslight importance to the results.
When all the alternative controls are used simultaneously in a singleregression, the main coefficient of interest has the same magnitude as that esti-mated using other important controls and is again significant at the 5 percentlevel despite the loss of observations implied by using all controls simul-taneously (table 3, column 10).
Mechanics 1: Migrant Destination
Having established the relevance of local migration in determining voting be-havior in the experimental setting, it is reasonable to wonder about the mech-anisms underlying this result. How does local migration affect behavior? Oneapproach is to examine how the destination of local migrants affects theresults. A comparison of the effect of the two main migrant destinations,Portugal and the United States, is striking: only migration to the United Stateshas a sizable and significant impact on the desire for better governance(table 4, columns 1 and 2). The effects of local migration to Portugal are notstatistically significant.
Mechanics 2: Current and Return Migrants
Continuing along this line of investigation, it is possible to distinguish betweenthe effects of current and return migrants by country of destination (table 5,columns 1 and 2). The magnitude and significance of effects are much higherfor return migrants than for current migrants, regardless of country of destina-tion. This is an intuitive result, as migrants’ experience is more likely to affectthe community of residence once migrants return and interact with residentsthan while they are away. Note also that the effects of both return and currentmigrants to the United States are positive (although insignificant for currentmigrants), whereas the effect of migrants returning from Portugal is negative.
92 T H E W O R L D B A N K E C O N O M I C R E V I E W
at International Monetary F
und on August 12, 2011
wber.oxfordjournals.org
Dow
nloaded from

TA
BL
E4
.Pro
bab
ilit
yof
Mailin
gV
oti
ng
Post
card
(Colu
mns
1–
7,
Marg
inal
Eff
ects
of
Pro
bit
Est
imat
es)
and
Pro
babilit
yof
Sel
f-re
port
edD
eman
dfo
rA
ccounta
bilit
y(C
olu
mns
8and
9,
Ord
ered
Pro
bit
Est
imat
es)
Vari
able
(1)
(2)
(3)
(4)
(5)
(6)
(7)
(8)
(9)
Pro
port
ion
of
inte
rnat
ional
mig
rants
toPort
ugal
(rel
ativ
eto
resi
den
ts)
inlo
cality
1.1
210
0.5
435
0.6
185
0.7
998
0.6
865
0.1
818
0.2
358
–3.0
466
–0.3
748
(1.0
271)
(1.1
214)
(1.3
669)
(1.1
458)
(1.0
633)
(1.2
426)
(1.2
329)
(2.3
588)
(2.4
081)
Pro
port
ion
of
inte
rnat
ional
mig
rants
toU
nit
edSta
tes
(rel
ativ
eto
resi
den
ts)
inlo
cality
2.7
384
2.6
239
2.6
069
2.5
595
2.6
833
2.3
141
3.1
322
11.0
254
12.6
180
(0.8
777)*
**
(1.0
761)*
*(1
.0271)*
*(1
.1184)*
*(0
.9900)*
**
(1.1
519)*
*(1
.1275)*
**
(2.1
924)*
**
(1.6
359)*
**
Rat
ioof
resi
den
tsco
mple
ting
rela
tive
tore
siden
tsnot
com
ple
ting
9ye
ars
of
schooling
inlo
cality
–0.0
343
(0.3
374)
Rat
ioof
resi
den
tsco
mple
ting
rela
tive
tore
siden
tsnot
com
ple
ting
12
years
of
schooling
inlo
cality
–0.3
994
(0.3
812)
(Conti
nued
)
Batista and Vicente 93
at International Monetary F
und on August 12, 2011
wber.oxfordjournals.org
Dow
nloaded from

TA
BL
E4.
Conti
nued
Vari
able
(1)
(2)
(3)
(4)
(5)
(6)
(7)
(8)
(9)
Rat
ioof
resi
den
tsco
mple
ting
rela
tive
tore
siden
tsnot
com
ple
ting
15
years
of
schooling
inlo
cality
1.1
284
(1.0
349)
Per
ceiv
edco
rrupti
on
inhea
lth
sect
or
0.0
372
(0.0
148)*
*Per
ceiv
edco
rrupti
on
ined
uca
tion
sect
or
0.0
390
(0.0
157)*
*C
ontr
ols
incl
uded
No
Yes
Yes
Yes
Yes
Yes
Yes
No
Yes
Num
ber
of
obse
rvat
ions
452
452
452
452
452
426
400
451
451
*Sig
nifi
cant
atth
e10
per
cent
leve
l;**
signifi
cant
atth
e5per
cent
leve
l;***
signifi
cant
atth
e1per
cent
leve
l.
Note
:N
um
ber
sin
pare
nth
eses
are
robust
standard
erro
rscl
ust
ered
atth
elo
cality
leve
l.A
llre
gre
ssio
ns
incl
ude
the
sam
eco
ntr
ols
as
the
base
line
regre
ssio
nin
colu
mn
5of
table
2.
Sel
f-re
port
eddem
and
for
acco
unta
bilit
yis
expre
ssed
as
a1
–7
scale
.
Sourc
e:A
uth
ors
’analy
sis
base
don
auth
ors
’su
rvey
.
94 T H E W O R L D B A N K E C O N O M I C R E V I E W
at International Monetary F
und on August 12, 2011
wber.oxfordjournals.org
Dow
nloaded from

TA
BL
E5
.Pro
bab
ilit
yof
Mailin
gV
oti
ng
Post
card
(Colu
mns
1–
7,
Marg
inal
Eff
ects
of
Pro
bit
Est
imat
es)
and
Pro
babilit
yof
Sel
f-re
port
edD
eman
dfo
rA
ccounta
bilit
y(C
olu
mns
8and
9,
Ord
ered
Pro
bit
Est
imat
es)
Vari
able
(1)
(2)
(3)
(4)
(5)
(6)
(7)
(8)
(9)
Pro
port
ion
of
curr
ent
inte
rnat
ional
mig
rants
toPort
ugal
(rel
ativ
eto
resi
den
ts)
inlo
cality
2.0
057
0.9
979
0.8
934
0.9
949
1.8
130
0.7
794
0.9
772
–4.2
651
–2.0
208
(1.1
713)*
(1.3
858)
(1.4
444)
(1.3
717)
(1.4
379)
(1.5
497)
(1.5
515)
(3.2
703)
(2.9
193)
Pro
port
ion
of
curr
ent
inte
rnat
ional
mig
rants
toU
nit
edSta
tes
(rel
ativ
eto
resi
den
ts)
inlo
cality
0.9
286
0.0
938
0.4
789
0.0
001
0.8
021
–1.2
650
0.9
654
4.5
386
6.9
932
(2.1
526)
(3.0
738)
(3.0
037)
(3.1
214)
(2.8
120)
(3.8
085)
(3.3
864)
(7.2
504)
(7.0
402)
Pro
port
ion
of
inte
rnat
ional
retu
rnm
igra
nts
toPort
ugal
(rel
ativ
eto
resi
den
ts)
inlo
cality
–4.8
152
–4.9
271
–6.0
974
–4.0
434
–6.6
494
–7.0
375
–5.8
158
–4.4
922
0.9
119
(2.4
159)*
*(2
.8707)*
(3.6
964)*
(3.3
599)
(2.4
733)*
**
(3.5
251)*
*(3
.4314)*
(12.3
565)
(12.8
589)
Pro
port
ion
of
inte
rnat
ional
retu
rnm
igra
nts
toU
nit
edSta
tes
(rel
ativ
eto
resi
den
ts)
inlo
cality
4.5
445
5.0
953
4.7
343
5.1
888
4.2
942
5.7
620
5.0
397
19.7
322
19.8
166
(2.5
979)*
(2.3
956)*
*(2
.4130)*
*(2
.4798)*
*(2
.3635)*
(2.7
759)*
*(2
.5711)*
*(6
.9132)*
**
(7.1
887)*
**
Rat
ioof
resi
den
tsco
mple
ting
rela
tive
tore
siden
tsnot
com
ple
ting
9ye
ars
of
schooling
inlo
cality
0.1
610
(0.3
662)
(Conti
nued
)
Batista and Vicente 95
at International Monetary F
und on August 12, 2011
wber.oxfordjournals.org
Dow
nloaded from

TA
BL
E5.
Conti
nued
Vari
able
(1)
(2)
(3)
(4)
(5)
(6)
(7)
(8)
(9)
Rat
ioof
resi
den
tsco
mple
ting
rela
tive
tore
siden
tsnot
com
ple
ting
12
years
of
schooling
inlo
cality
–0.2
466
(0.3
932)
Rat
ioof
resi
den
tsco
mple
ting
rela
tive
tore
siden
tsnot
com
ple
ting
15
years
of
schooling
inlo
cality
2.0
197
(0.8
948)*
*
Per
ceiv
edco
rrupti
on
inhea
lth
sect
or
0.0
375
(0.0
153)*
*Per
ceiv
edco
rrupti
on
ined
uca
tion
sect
or
0.0
370
(0.0
162)*
*C
ontr
ols
incl
uded
No
Yes
Yes
Yes
Yes
Yes
Yes
No
Yes
Num
ber
of
obse
rvat
ions
452
452
452
452
452
426
400
451
451
*Sig
nifi
cant
atth
e10
per
cent
leve
l;**
signifi
cant
atth
e5per
cent
leve
l;***
signifi
cant
atth
e1per
cent
leve
l.
Note
:N
um
ber
sin
pare
nth
eses
are
robust
standard
erro
rscl
ust
ered
atth
elo
cality
leve
l.A
llre
gre
ssio
ns
incl
ude
the
sam
eco
ntr
ols
as
the
base
line
regre
ssio
nin
colu
mn
5of
table
2.
Sel
f-re
port
eddem
and
for
acco
unta
bilit
yis
expre
ssed
as
a1
–7
scale
.
Sourc
e:A
uth
ors
’analy
sis
base
don
auth
ors
’su
rvey
.
96 T H E W O R L D B A N K E C O N O M I C R E V I E W
at International Monetary F
und on August 12, 2011
wber.oxfordjournals.org
Dow
nloaded from

Robustness Checks: Self-selection
How can we ensure that the estimated local migration effects are really causingthe demand for accountability? One might conjecture that selection (forinstance, on observable characteristics such as education) is driving the find-ings. To examine this possibility, the differences in means were estimatedbetween localities with strong migration to Portugal (migrants to Portugal con-stitute at least 5 percent of the resident population) and those without; thesame was done for migration to the United States.
Households in areas prone to migration to Portugal are usually less well offthan those in areas prone to migration to the United States, although thoseprone to migrate to the United States seem to possess above mean assets thatcould allow them to overcome the financial costs of an international move(table 6). Migrants to Portugal tend to originate in areas where agriculture andconstruction dominate over services, such as retail trade; the reverse is true formigrants to the United States. Education profiles differ as well: the most edu-cated migrants move to the United States, an expected outcome considering thehigher costs involved (financial, language, and distance). Finally, there is aslightly higher perception of corruption in the health sector in areas withstrong migration to Portugal.
With such a profile, it is desirable to control for local educational attainmentin regressions evaluating the impact of migration by destination country. Theeffects of education are not visible at the aggregate level, when the impact ofall migrants to different destinations is considered (see table 4, column 3-5).Only when the analysis is decomposed into current and return migrants doesthe impact become apparent. The most striking dimension of selectivity inmigration, college education, also has the greatest impact on the results. Aftercontrolling for tertiary education, the impact of return migration from Portugalbecomes significantly negative (see table 5, columns 3–5)—this may be relatedto the fact that Cape Verde had no universities until 1995 and that Portugalwas the usual destination for Cape Verdeans seeking a college education. Apartfrom this strong impact on the coefficient on return migration from Portugal,the estimated results are not very sensitive to this or other dimensions alongwhich migrants seem to self-select when choosing a migration destination.
This result indicates that self-selection is not likely to underlie the impact ofmigration on the demand for political accountability. Indeed, migrant assimila-tion of the accountability norms in the destination country is a better expla-nation for this impact.10 In the latest Transparency International (2009)
10. This is consistent with the findings of Fidrmuc and Doyle (2004) and Spilimbergo (2009), which
also provide evidence supporting migrant assimilation effects in the destination country. Fidrmuc and
Doyle (2004) focus on Czech and Polish migrants and also find that self-selection (by political attitudes
and economic characteristics) is not likely to explain migrants’ political attitudes. Spilimbergo (2009)
describes how the political attitudes of migrants differ depending on the political characteristics of the
destination countries.
Batista and Vicente 97
at International Monetary F
und on August 12, 2011
wber.oxfordjournals.org
Dow
nloaded from

cross-country governance ranking, the United States places 19th, Portugal ranks35th and Cape Verde 46th. This evidence can be interpreted to show that theexperience of emigrants to the United States is more conducive to promotingdemand for better governance than that of emigrants to Portugal. Also, the
TA B L E 6: Descriptive Statistics for Survey Respondents in Areas with StrongMigration to Portugal and Areas with Strong Migration to the United States
VariableStrong migration to
PortugalStrong migration to
United States
Male –0.0001 0.0726(0.0500) (0.0732)
Age 1.18987 0.8926(1.4803) (2.0500)
Individual labor income –82.8924 19.6443(26.9850)*** (41.7703)
Number of children 0.1787 –0.3183(0.2490) (0.2903)
Household asset ownership 0.1252 –0.0280(0.0317)*** (0.0564)
Trust in Oxford University 0.2551 –0.1278(0.1089)** (0.1679)
Habit of posting –0.3219 –0.2356(0.1967) (0.2681)
Average private consumption expenditure percapita in locality
0.0077 0.0316(0.0058) (0.0112)***
Fraction of residents working in agriculture inlocality
0.0322 0.0017(0.0043)*** (0.0047)
Fraction of residents working in construction inlocality
0.0227 –0.0181(0.0029)*** (0.0026)***
Fraction of residents working in retail trade inlocality
–0.0057 –0.0119(0.0024)** (0.0021)***
Fraction of households receiving internationalremittances in locality
0.0028 0.0279(0.0020) (0.0044)***
Ratio of residents completing relative to residentsnot completing 9 years of schooling in locality
–0.0239 0.0886(0.0229) (0.0479)*
Ratio of residents completing relative to residentsnot completing 12 years of schooling in locality
–0.0265 0.0448(0.0110)** (0.0200)**
Ratio of residents completing relative to residentsnot completing 15 years of schooling in locality
–0.0097 0.0172(0.0031)*** (0.0058)***
Perceived corruption in health sector 0.4074 –0.1839(0.2149)* (0.2659)
Perceived corruption in education sector –0.0358 –0.3119(0.1845) (0.2377)
* Significant at the 10 percent level; ** significant at the 5percent level; *** significant at the1percent level.
Note: Numbers in parentheses are robust standard errors clustered at the locality level. Strongmigration to a certain destination is defined as migrants to that destination representing at least5 percent of the resident population. Table shows mean difference relative to areas wheremigration to the same destination is not strong.
Source: Authors’ analysis based on authors’ survey.
98 T H E W O R L D B A N K E C O N O M I C R E V I E W
at International Monetary F
und on August 12, 2011
wber.oxfordjournals.org
Dow
nloaded from

negative impact of return migrants from Portugal should be viewed in thecontext of the baseline destinations against which migrants to the United Statesand Portugal are being compared; those are mostly European countries, such asFrance and the Netherlands, which rank closer to the United States in govern-ance than to Portugal or Cape Verde.
Robustness Check: Potential Endogeneity and Instrumental VariableEstimation
Despite the supportive evidence that observable self-selection does not seem toexplain the estimated results, there may still be endogeneity concerns relatedto potential unobserved heterogeneity and locality-level omitted variables. Toexamine these concerns, the baseline regressions are reestimated using two setsof instrumental variables: five-year lagged local migrant stocks based on thefull migration history available for all household members in the survey, andexternal sources in destination countries (unemployment rates, nominal GDPper capita, and GDP growth rates in the United States and Portugal) in the10 years before the survey.
These variables are aggregated using a weighted sum in which the weight isthe five-year lagged local migrant stock to each destination relative to the five-year lagged overall stock of migrants to that destination in each 10-year period.This weight can be understood as a five-year lagged proxy for migration net-works in the destination country, which combined with macro informationfrom the destination country, should constitute an exogenous source of vari-ation for migration, enabling identification of the coefficients of interest. Notethat the weighting procedure guarantees enough variation to identify the effectsof interest at the locality level. The second set of instruments also enablestesting for overidentification in all three estimated specifications. This secondset of instruments is also stronger—lagged instrument strength could be aproblem for certain regressions, as displayed in table 7, column 7.
After finding that the instruments used seem strong and exogenous in allpossible specifications (see table 7), it is also reassuring to observe that the esti-mates are not substantially different from those obtained using probit methods.This finding points to the small importance of any endogeneity concerns at thelocal level, after controlling for all relevant covariates.
Robustness Check: Alternative Measures of the Demand for Accountability
One additional potential concern with the analysis is that the postcard exper-iment might not be exactly measuring a desire for political accountability. Tostrengthen the contention that that is the case, a survey variable is used thatasks respondent directly whether they agree or disagree (on a 1–7 scale) withthe statement: “As a common citizen of Cape Verde, I believe I should requirecompetence in the public services (health centers, schools, courts, police) thatare aimed at my needs.”
Batista and Vicente 99
at International Monetary F
und on August 12, 2011
wber.oxfordjournals.org
Dow
nloaded from

TA
BL
E7
.Pro
babil
ity
of
ing
Voti
ng
Post
card
(Colu
mns
1,
2,
4,
5,
7,
and
8)
and
Pro
babil
ity
of
Sel
f-re
port
edD
emand
for
Acc
ounta
bilit
y(C
olu
mns
3,
6,
and
9):
Inst
rum
enta
lV
ari
able
Est
imat
es
Vari
able
(1)
(2)
(3)
(4)
(5)
(6)
(7)
(8)
(9)
Pro
port
ion
of
inte
rnat
ional
mig
rants
(rel
ativ
eto
resi
den
ts)
inlo
cali
ty
1.0
298
1.4
380
1.8
467
(0.3
895)*
**
(0.3
472)*
**
(1.0
169)*
Pro
port
ion
of
inte
rnat
ional
mig
rants
toPort
ugal
(rel
ativ
eto
resi
den
ts)
inlo
cali
ty
–1.0
262
–0.4
735
–0.3
474
(1.8
587)
(1.5
247)
(2.8
333)
Pro
port
ion
of
inte
rnat
ional
mig
rants
toU
nit
edSta
tes
(rel
ativ
eto
resi
den
ts)
inlo
cality
2.7
575
3.3
261
7.7
153
(0.9
659)*
**
(0.9
731)*
**
(1.5
838)*
**
Pro
port
ion
of
curr
ent
inte
rnat
ional
mig
rants
toPort
ugal
(rel
ativ
eto
resi
den
ts)
inlo
cality
1.2
976
1.6
291
0.7
949
(9.0
557)
(1.4
478)
(2.4
863)
Pro
port
ion
of
curr
ent
inte
rnat
ional
mig
rants
toU
nit
edSta
tes
(rel
ativ
eto
resi
den
ts)
inlo
cali
ty
3.3
171
–0.6
921
4.4
871
(5.6
915)
(5.8
877)
(6.7
337)
100 T H E W O R L D B A N K E C O N O M I C R E V I E W
at International Monetary F
und on August 12, 2011
wber.oxfordjournals.org
Dow
nloaded from

Pro
port
ion
of
inte
rnat
ional
retu
rnm
igra
nts
toPort
ugal
(rel
ativ
eto
resi
den
ts)
inlo
cality
–2.7
566
–4.8
785
–0.8
931
(11.2
768)
(3.6
941)
(8.3
697)
Pro
port
ion
of
inte
rnat
ional
retu
rnm
igra
nts
toU
nit
edSta
tes
(rel
ativ
eto
resi
den
ts)
inlo
cality
1.9
758
4.9
559
9.6
918
(3.6
264)
(3.2
493)
(4.8
695)*
*
Inst
rum
ent
seta
AB
BA
BB
AB
BF-s
tati
stic
son
excl
uded
inst
rum
ents
infirs
tst
age
regre
ssio
ns
394.1
28.1
28.2
9.5
;124.2
9.2
;52.3
9.2
;52.4
2.1
;11.2
;129.5
;378.1
13.9
;11.5
;180.7
;1156.5
13.9
;11.6
;178.2
;1169.1
Ove
riden
tifica
tion
test
(p-v
alu
e)N
A0.1
80.4
2N
A0.3
30.7
6N
A0.1
50.3
8C
ontr
ols
incl
uded
Yes
Yes
Yes
Yes
Yes
Yes
Yes
Yes
Yes
Num
ber
of
obse
rvat
ions
452
452
451
452
452
451
452
452
451
*Sig
nifi
cant
atth
e10
per
cent
leve
l;**
signifi
cant
atth
e5per
cent
leve
l;***
signifi
cant
atth
e1per
cent
leve
l.
Note
:N
um
ber
sin
pare
nth
eses
are
robust
standard
erro
rscl
ust
ered
atth
elo
cality
leve
l.A
llre
gre
ssio
ns
incl
ude
the
sam
eco
ntr
ols
as
the
base
line
regre
ssio
nin
colu
mn
5of
table
2.
a.
Inst
rum
ent
set
Ain
cludes
five
-yea
rla
gged
regre
ssors
of
inte
rest
.In
stru
men
tse
tB
use
sm
acro
econom
icvari
able
sat
des
tinat
ion
wei
ghte
dby
five
-yea
rla
gged
loca
lm
igra
tion
stock
size
indic
ators
,as
des
crib
edin
the
text.
Batista and Vicente 101
at International Monetary F
und on August 12, 2011
wber.oxfordjournals.org
Dow
nloaded from

This self-reported measure of demand for better governance is used to verifywhether the determinants of postcard voting behavior are similar. The resultsare reassuring. The sign and significance of the main estimated coefficientsremain stable except for the effect of the proportion of international migrantsin a locality on the probability of mailing a postcard, which has a p-value ofonly 12.6 percent (see table 2, column 7). The impact of migration to theUnited States is also still strongly positive and significant and that of migrationto Portugal is statistically insignificant (see table 4, columns 8 and 9). Thesame results hold when disaggregated by current and return migration status:return migration from the United States is a powerful positive determinant ofthe demand for accountability, whereas current migration and return migrationto Portugal are not statistically significant (see table 5, columns 8 and 9).
Overall, the most salient outcome when of using self-reported survey datainstead of the postcard behavioral measure is that the magnitude of the esti-mated effects is much larger, an outcome that could be related to surveyrespondents’ desire to conform to the perceived anticorruption message of thesurvey (conformity bias).
Mechanics 3: Direct and Social Effects of Local Migration
In summary, the evidence points to international emigration to countries withgood governance (in particular, to the presence of return migrants) as promot-ing demand for political accountability in the origin country.
It is important to emphasize that the focus here is on the impact of locality-level migration. The variable used, the proportion of international migrantswithin the household’s spatial area of residence, can be understood as a proxyfor the frequency of potential interactions between migrants and residents(who are not necessarily migrants and who do not necessarily have a return orcurrent migrant in the household). The larger this proportion, the more likelysuch interactions will be and the more likely that people in the locality aremore open to demanding accountability.
The effects of local migration are both direct and indirect. Return migrants,for instance, should have both a direct and an indirect impact on households inthe locality. Current migrants can also have indirect effects through communi-cations with their network of friends and family back home.
The empirical question left unanswered is that of the different magnitude ofthe direct and indirect effects identified at the local level. If additional data onmigrant networks became available, this could be an important way forward inthe literature.
V. C O N C L U D I N G R E M A R K S
This article contributes to the understanding of a largely unmeasured butimportant potential effect of international emigration: its impact on insti-tutional quality, a determinant of economic growth.
102 T H E W O R L D B A N K E C O N O M I C R E V I E W
at International Monetary F
und on August 12, 2011
wber.oxfordjournals.org
Dow
nloaded from

The findings point to an overall positive impact of international emigrationon the demand for improved political accountability in the country of origin.In particular, the results emphasize the importance of the migration destinationcountry: the impacts are stronger for migration to countries with better govern-ance. The impacts are also stronger for return migrants than for currentmigrants, who can only indirectly influence their relationship networks in thehome country.
International emigration likely affects the supply side of domestic politicalinstitutions as well as the demand side, a part of the lively ongoing “braindrain” vs. “brain gain” debate. Total effects could presumably be negative ifthere were positive selection in current emigration flows and positive if skilledmigrants return. This is an empirical question to be answered by futureresearch.
RE F E R E N C E S
Acemoglu, Daron, Simon Johnson, and James A. Robinson. 2005. “Institutions as a Fundamental
Cause of Long-Run Growth.” In Handbook of Economic Growth, ed. Philippe Aghion, and Steven
Durlauff. Amsterdam: North-Holland.
Alesina, Alberto, Arnaud Devleeschauwer, William Easterly, Sergio Kurlat, and Romain Wacziarg.
2003. “Fractionalization”. Journal of Economic Growth 8 (2): 155–94.
Alesina, Alberto, and Paola Giuliano. 2009. “Family Ties and Political Participation.” IZA Discussion
Paper 4150. Institute for the Study of Labor, Bonn.
Beine, Michel, Frederic Docquier, and Hillel Rapoport. 2008. “Brain Drain and LDCs’ Growth:
Winners and Losers”. Economic Journal 118: 631–52.
Batista, Catia, Tara McIndoe-Calder, and Pedro C. Vicente. 2010. “Return Migration and
Entrepreneurship in Mozambique”. Trinity College, Dublin.
Batista, Catia, Aitor Lacuesta, and Pedro C. Vicente. Forthcoming. “Testing the ‘Brain Gain’
Hypothesis: Micro Evidence from Cape Verde.” Journal of Development Economics.
Docquier, Frederic, Elisabetta Lodigiani, Hillel Rapoport, and Maurice Schiff. 2010. “Emigration and
the Quality of Home Country Institutions”. Catholic University of Louvain, University of
Luxembourg, Harvard University, and World Bank.
Docquier, Frederic, and Abdeslam Marfouk. 2006. “International Migration by Education Attainment,
1990–2000.” In International Migration, Brain Drain and Remittances, ed. Caglar Ozden,
and Maurice Schiff. New York, NY: Palgrave Macmillan.
Downs, Anthony. 1957. An Economic Theory of Democracy. New York: Harper Collins.
Dustmann, Christian, and Oliver Kirchkamp. 2003. “Migration Duration and Activity Choice after
Re-Migration”. Journal of Development Economics 67: 351–72.
Edwards, A., and M. Ureta. 2003. “International Migration, Remittances, and Schooling: Evidence
from El Salvador.” Journal of Development Economics 72: 429–61.
Fidrmuc, Jan, and Orla Doyle. 2004. “Voice of the Diaspora: An Analysis of Migrant Voting
Behaviour”. CEPR Discussion Paper 4619. Center for Economic and Policy Research, Washington,
DC.
Gould, D. M. 1994. “Immigrant Links to the Home Country: Empirical Implications for U.S. Bilateral
Trade Flows,” Review of Economics and Statistics 76 (2): 302–16.
Freedom House. 2010. Freedom of the Press 2010. www.freedomhouse.org/template.cfm?page=16
Batista and Vicente 103
at International Monetary F
und on August 12, 2011
wber.oxfordjournals.org
Dow
nloaded from

Heston, Alan, Robert Summers, and Bettina Aten. 2006. Penn World Table Version 6.2. Center for
International Comparisons of Production, Income, and Prices at the University of Pennsylvania,
Philadelphia.
Hirschman, Albert. 1970. Exit, Voice, and Loyalty: Responses to Decline in Firms, Organizations, and
States. Cambridge, MA: Harvard University Press.
INE (Instituto Nacional de Estatistica). 2002. Recenseamento Geral da Populacao e da Habitacao.
Cidade da Praia, Cabo Verde: INE.
———. 2004. Inquerito as Despesas e Receitas Familiares. Cidade da Praia, Cabo Verde: INE.
Iranzo, S., and G. Peri. 2009. “Migration and Trade: Theory with an Application to the
Eastern-Western European Integration.” Journal of International Economics 79 (1): 1–19.
Javorcik, Beata, Caglar Ozden, Mariana Spatareanu, and Cristina Neagu. Forthcoming.“Migrant
Networks and Foreign Direct Investment”. Journal of Development Economics.
Kugler, Maurice, and Hillel Rapoport. 2007. “International Labor and Capital Flows: Complements or
Substitutes?”. Economics Letters 92 (2): 155–62.
Li, Xiaoyang, and John McHale. 2009. “Emigrants and Institutions”. University of Michigan, Ann
Arbor, and National University of Ireland, Galway.
Merlo, Antonio. 2006. “Whither Political Economy? Theories, Facts, and Issues.” In Advances in
Economics and Econometrics, Theory, and Applications: Ninth World Congress of the Econometric
Society, vol. I, ed. R. Blundell, W. Newey, and T. Persson. Cambridge, UK: Cambridge University
Press.
Mesnard, Alice, and Martin Ravallion. 2006. “The Wealth Effect on New Business Startups in a
Developing Economy.” Economica 73: 367–92.
Minier, Jenny. 2001. “Is Democracy a Normal Good?” Southern Economic Journal 67 (4): 996–1009.
Rauch, J., and Vitor Trindade. 2002. “Ethnic Chinese Networks in International Trade.” Review of
Economics and Statistics 84: 116–30.
Reporters without Borders. 2009. Press Freedom Index 2009. http://en.rsf.org/
Riker, William H., and Peter C. Ordeshook. 1968. “A Theory of the Calculus of Voting.” American
Political Science Review 62: 25–42.
Spilimbergo, Antonio. 2009. “Foreign Students and Democracy.” American Economic Review 99 (1):
528–43.
Transparency International. 2009. Transparency International Annual Report 2009. www.transparency
.org .
Tullock, Gordon. 1967. Toward a Mathematics of Politics. Ann Arbor: University of Michigan Press.
World Bank. 2006. World Development Indicators. Washington, DC: World Bank.
———. 2011. Worldwide Governance Indicators. http://info.worldbank.org/governance/wgi/
Yang, Dean. 2008. “International Migration, Remittances, and Household Investment: Evidence from
Philippine Migrants’ Exchange Rate Shocks.” The Economic Journal 118: 591–630.
104 T H E W O R L D B A N K E C O N O M I C R E V I E W
at International Monetary F
und on August 12, 2011
wber.oxfordjournals.org
Dow
nloaded from

What Explains the Price of Remittances? AnExamination Across 119 Country Corridors
Thorsten Beck and Marıa Soledad Martınez Perıa
Remittances are a substantial source of external financing for developing countriesthat influence many aspects of their development. Though research has shown thatremittances are both expensive and price sensitive, little is known about what explainstheir price. Newly gathered data across 119 country pairs or corridors are used toexplore the factors associated with the price of remittances. Corridors with largernumbers of migrants and more competition among providers are found to exhibitlower prices for remittances, when average prices across all types of remittance serviceproviders are considered. Corridors with lower barriers to access banking services andbroader regulation of remittance service providers also have lower prices. Remittanceprices are higher in richer corridors and in corridors with greater bank participationin the remittance market. Few significant differences emerge when results arecompared across banks and, separately, across money transfer operators. However,estimations for Western Union, a leading player in the remittances business, suggestthat its prices are less sensitive to competition. JEL classification: F22, F24.
In 2008, remittances to developing countries reached $328 billion, more thantwice the amount of official aid and over half of foreign direct investment flows(World Bank 2009a). Numerous studies have shown that remittances have apositive and significant impact on economic development along multipledimensions, including poverty alleviation, education, entrepreneurship, infant
Thorsten Beck (corresponding author; [email protected]) is a professor of economics and CentER
fellow and chair of the European Banking Center at Tilburg University. Marıa Soledad Martınez Perıa
([email protected]) is a senior economist in the Finance and Private Sector Development
Research Group of the World Bank. The authors thank Diego Anzoategui and Subika Farazi for
excellent research assistance. They received helpful comments from participants at the Second
International Conference on Migration and Development and the International Conference on Diaspora
for Development, as well as from World Bank colleagues in the Finance and Private Sector
Development Research Group and the Payment Systems Unit. The authors are particularly grateful to
the journal editor and to three anonymous referees for constructive comments and suggestions. This
article’s findings, interpretations, and conclusions are entirely those of the authors and do not
necessarily represent the views of the organizations with which they are affiliated.
THE WORLD BANK ECONOMIC REVIEW, VOL. 25, NO. 1, pp. 105–131 doi:10.1093/wber/lhr017Advance Access Publication May 23, 2011# The Author 2011. Published by Oxford University Press on behalf of the International Bankfor Reconstruction and Development / THE WORLD BANK. All rights reserved. For permissions,please e-mail: [email protected]
105
at International Monetary F
und on August 12, 2011
wber.oxfordjournals.org
Dow
nloaded from

mortality, and financial development.1 Hence, understanding the market forremittance transactions can be critical for promoting the development processin many low-income countries.
Remittance transactions are known to be expensive, with estimates averaging10 percent of the amount sent (World Bank 2009b). At the same time, thesecosts are widely dispersed across corridors and range from 2.5 percent to 26percent. Furthermore, case studies have shown that remittance flows are verysensitive to prices and are likely to increase substantially as prices fall. Forexample, Gibson, McKenzie, and Rohorua (2006) estimate a 22 percent priceelasticity in the New Zealand–Tonga corridor and calculate that lowering thefees to the levels found in the most competitive corridors would raise remit-tances by 28 percent. Using a randomized experiment, Aycinena, Martinez,and Yang (2009) estimate that a $1 lower fee in the United States–El Salvadorcorridor would boost remittances $25 a month from an average of $290.
Because remittances are important for economic development and appear tobe sensitive to price, lowering the price has become a priority for policymakers.At the L’Aquila 2009 G-8 Summit, leaders pledged to reduce the price ofremittances by half (from 10 to 5 percent) in five years.2 Yet, little is knownempirically about what explains the price of remittances.3 Are high prices duemainly to factors in the sending or the receiving country? Are high pricesrelated to socioeconomic factors, industry market structure, or government pol-icies and regulations that affect remittance service providers and the mark-upsthey are able to charge? Are there significant differences between banks andmoney transfer operators (MTOs)? Explaining the variation in prices is thus ofinterest for academics and policymakers alike.
Using a new dataset assembled by the World Bank Payment Systems Groupon the price of remittances across 119 country pairs or corridors (RemittancePrices Worldwide database (World Bank 2009b), this article explores the
1. For example, see Adams and Page (2003), Adams (2005), IMF (2005), Lopez-Cordova (2005),
Maimbo and Ratha (2005), and Taylor, Mora, Adams and Lopez-Feldman (2005) for studies on the
impact of remittances on poverty. Studies such as Cox-Edwards and Ureta (2003), Hanson and
Woodruff (2003), Lopez-Cordova (2005), and Yang (2008) find that by helping to relax household
constraints, remittances are associated with improved schooling outcomes for children. Remittances
have also been shown to promote entrepreneurship (see Massey and Parrado 1998; Maimbo and Ratha
2005; Yang 2008; Woodruff and Zenteno 2007). Furthermore, a number of studies on infant mortality
and birth weight have documented that, at least in the Mexican case, migration and remittances help
lower infant mortality and are associated with higher birth weight among children in households that
receive remittances (see Kanaiaupuni and Donato 1999; Hildebrandt and McKenzie 2005; Duryea et al.
2005; and Lopez-Cordova 2005). Aggarwal, Demirguc-Kunt, and Martinez Peria (2010) show that
remittances can have a positive impact on financial development.
2. Paragraph 134, page 49 of the L’Aquila 2009 G8 Summit. http://www.g8italia2009.it/static/
G8_Allegato/G8_Declaration_08_07_09_final,0.pdf.
3. Orozco (2006) and Freund and Spatafora (2008) are the exception, but their data is limited to a
few countries or a few providers. While Orozco’s work focuses exclusively on Latin America, the
Freund and Spatafora study analyzes only the costs of remittances sent from the United States and the
United Kingdom exclusively via MoneyGram or Western Union to 66 countries.
106 T H E W O R L D B A N K E C O N O M I C R E V I E W
at International Monetary F
und on August 12, 2011
wber.oxfordjournals.org
Dow
nloaded from

factors associated with remittance prices in 2009.4 It studies corridors thatinclude 13 major remittance sending countries and 60 receiving countriesrepresenting approximately 60 percent of total remittances to developingcountries. Using data at the corridor level permits bilateral analysis of pricesrather than analysis of prices aggregated at the receiving or sending countrylevel only. Furthermore, unlike previous studies focusing on a certain type ofremittance service provider (usually the largest international MTOs), the analy-sis here considers the largest providers, whatever the type, in each corridor.5
And by averaging across all types of providers and across each type of provider(banks and MTOs) separately, the factors associated with the price of remit-tances can be compared across different types of institutions. Finally, analyzingthe prices charged by Western Union across 98 corridors (80 percent of thesample) alleviates concerns about bias due to differences across firms and thussheds light on the factors correlated with the prices charged by a leading remit-tance service provider with worldwide operations.
The analysis distinguishes three groups of variables that can be associatedwith cross-corridor variation in the price of remittances. One is the impactof government policies—including exchange rate policies, capital controls,and regulation of remittance service providers—that can influence the priceof remittances through their impact on the cost structure of remittanceservice providers. The second is the role of factors that might affect theability of remittance service providers to increase their mark-up, such asextent of competition, market structure, and level of education of themigrant population. The third is the role of socioeconomic characteristics insending and receiving countries that might influence fees through theirimpact on the cost structure of remittance service providers and on provi-ders’ ability to raise the mark-up.
Estimations of the price of remittances across all types of remittance serviceproviders show that prices are consistently lower in corridors with a largernumber of migrants and more competition and in corridors with lower accessbarriers to the banking system and broader regulation of remittance serviceproviders. Remittance prices are higher in richer corridors and in corridorswith a higher share of banks among providers. The prices of sending remit-tance using banks or MTOs are associated with similar factors. Western Unionprices appear to be less sensitive to competition, perhaps a reflection of thefirm’s market power.
This article is related to the literature on the price of banking services. Beck,Demirguc-Kunt, and Martınez Perıa (2008) document large cross-country
4. The original World Bank database for the period analyzed here contains information on 134
corridors. From that total, 13 corridors (where Russia is the sending country) are missing exchange rate
data and 2 other corridors are missing information for some explanatory variables.
5. On average, 8–10 providers are included for each corridor. In some corridors, primarily those
including the United States and Spain as sending countries, the number of providers surveyed exceeds 10.
Thorsten Beck and Marıa Soledad Martınez Perıa 107
at International Monetary F
und on August 12, 2011
wber.oxfordjournals.org
Dow
nloaded from

variation in the costs to customers of opening and maintaining bank accountsand in the fees for using automated teller machines and for transferring funds,finding that firms report lower financing constraints in countries with lowercosts of financial services. Freund and Spatafora (2008) and Orozco (2006)also present data on remittance prices, but for few countries and providers andnot at the corridor level.
In a broader sense, this article is also related to the literature on bank inter-est rate spreads (the differences between deposit and lending rates), with higherspreads indicating more expensive banking services. Both institution-specificcharacteristics, such as size and ownership, and market and country character-istics, such as competition and the legal and institutional framework, havebeen shown to be significant predictors of interest rate spreads (seeDemirguc-Kunt, Laeven and Levine 2004; Laeven and Majnoni 2005; andBeck 2007 for a general discussion).
This article is a first exploration of corridor variation in the price of remit-tances and is subject to two important caveats. First, as a pure cross-sectionalanalysis, it is potentially subject to reverse causation and omitted-variablebiases. Hence, only limited, if any, inference can be made on causality.6
Second, the analysis is also limited in scope since it includes data only fromformal providers of remittance services. By some estimates, at least a third ofremittances are sent through informal channels (Freund and Spatafora 2008).These limitations notwithstanding, the article offers interesting evidence thatshould stimulate further data collection and analysis.
The article is organized as follows. Section I describes the data on the priceof remittances. The empirical methodology is in section II and the results are insection III. Section IV summarizes the findings and recommends furtherresearch.
I . D A T A O N T H E P R I C E O F R E M I T T A N C E S
The data on the price of remittances are from the Remittance PricesWorldwide database, a recent survey of remittance service providers conductedby the Payment System Unit of the World Bank in the first quarter of 2009(World Bank 2009b).7 The price of remittances consists of a fee componentand an exchange rate spread component. The World Bank dataset covers 14sending and 72 receiving countries. However, because spread information ismissing for remittances from the Russian Federation and data are missing forsome explanatory variables, the focus is on 119 corridors, at most, including
6. Most of the variables, however, are likely to be exogenous to remittance prices, including
migration flows, distance, and even banking market structure, given the small share of bank profits
stemming from remittances.
7. Since then, the data have been updated, and prices are now available through the first quarter of
2010. However, because data for most of the correlates used in this analysis are not updated with the
same frequency, the panel dimension of the data could not be exploited.
108 T H E W O R L D B A N K E C O N O M I C R E V I E W
at International Monetary F
und on August 12, 2011
wber.oxfordjournals.org
Dow
nloaded from

13 sending countries and 60 receiving countries.8 In most cases, data cover theprices from the main sending location for the corridor in question to thecapital city or most populous city in the receiving market.
Data were collected by interviewers posing as customers and by contactingindividual firms. Within each corridor, the data were gathered on the same dayto control for exchange rate fluctuations and other changes in fee structures. Ingeneral, price data were collected for 8–10 major service providers in each cor-ridor, including the main MTOs and banks active in the market.9 Companiessurveyed in each segment were selected to cover the maximum remittancemarket share possible.10 Since the dataset does not provide information on themarket shares of each provider, it is not possible to compute weightedaverages. Hence, the regression analysis uses both the simple average and themedian prices calculated across all providers in a corridor as dependent vari-ables.11 Results are reported using only the simple averages, however, becauseaverage and median prices are highly correlated (0.96).
Prices based on two amounts are available per corridor: the local equiv-alent of $200 and the local equivalent of $500. Since previous studies havefound that a typical remittance transaction involves sending close to $200,the analyses are based on the prices associated with this amount.12
Furthermore, the prices of sending $200 and $500 (expressed as a percen-tage of the amount sent) are highly correlated (0.91), so the results do notvary significantly.13
Figure 1 illustrates the variation in average prices across the 119 corridors,calculated across all surveyed remittance service providers in each corridor.The average remittance prices are lowest in the Saudi Arabia–Pakistan corridor(2.5 percent of $200) and highest in the Germany–Croatia corridor (25.8percent). Averaged across all corridors and providers, the price is 10.2 percent.
There is considerable heterogeneity in prices even when the same sending orremittance receiving country is considered. Prices of remittances sent from theUnited States vary from 3.7 percent to Ecuador to 14.1 percent to Thailand(figure 2). Remittance prices to India vary from 3.1 percent from Saudi Arabiato 13.3 percent from Germany (figure 3). This variation underlines the
8. The full data are available at www.remittanceprices.org. Data on exchange rate spreads are also
missing for some institutions in Germany, France, and Japan. These institutions are excluded from the
calculations of the average remittances costs from those countries.
9. The number of respondents by corridors varies depending on the number of firms active in the
corridor. Some corridors (like the Spain–China corridor) include only two firms, while others (like the
United States–Mexico corridor) go as high as 18.
10. No more information is provided on how firms were selected. For a discussion of the
methodology, see http://remittanceprices.worldbank.org/Methodology/.
11. A priori, it is not clear how having weighted averages instead of simple averages would change
the estimations. This problem is interpreted as a potential case of measurement error in the dependent
variable, which should not bias the estimates but would affect their efficiency.
12. Freund and Spatafora (2008) use the same amount in their study.
13. These results are available on request.
Thorsten Beck and Marıa Soledad Martınez Perıa 109
at International Monetary F
und on August 12, 2011
wber.oxfordjournals.org
Dow
nloaded from

FIGURE 1. Average Price of Remittances Sent Across 119 Migration Corridors
Source: Remittance Prices Worldwide database.
FIGURE 2. Average Price of Remittances from the United States to 22Receiving Countries
Source: Authors’ analysis based on data from World Bank (2009b).
110 T H E W O R L D B A N K E C O N O M I C R E V I E W
at International Monetary F
und on August 12, 2011
wber.oxfordjournals.org
Dow
nloaded from

importance of analyzing the price of remittances at the corridor rather than atthe sending or receiving country level.
Remittance prices also vary across provider types (table 1). On average,banks charge substantially higher fees (12.4 percent) than do MTOs (8.8percent). This differential does not control for the fact that banks andMTOs are not active in all corridors and that different banks and differentMTOs are active in different corridors. When the analysis focuses on corri-dors where both types of institutions are active, average prices for banksexceed those for MTOs in 43 of the 63 corridors. Furthermore, when pricesat the provider level are regressed on a set of corridor dummy variables anda bank dummy variable, bank prices average 3 percentage points higherthan MTO fees. Western Union’s prices (10.8 percent) are slightly higherthan the average for all MTOs (8.8 percent). Western Union prices alsoexhibit high cross-corridor variation, ranging from 2.7 percent in the SaudiArabia–Yemen corridor to 29.9 percent in the United Kingdom–Albaniacorridor (figure 4).
I I . E M P I R I C A L M E T H O D O L O G Y
To examine the determinants of remittance prices, the average price of sendingremittances, Pij, is regressed on a set of sending and receiving country
FIGURE 3. Average Price of Remittances to India from Eight SendingCountries
Source: Authors’ analysis based on data from World Bank (2009b).
Thorsten Beck and Marıa Soledad Martınez Perıa 111
at International Monetary F
und on August 12, 2011
wber.oxfordjournals.org
Dow
nloaded from

TA
BL
E1
.Sum
mary
Sta
tist
ics
and
Dat
aSourc
es
Des
crip
tion
Abbre
via
tion
Num
ber
of
obse
rvat
ions
Mea
nM
edia
nD
ate
Sourc
e
All
pro
vid
ers
119
10.2
49.4
72009
Rem
itta
nce
Pri
ces
Worl
dw
ide
(Worl
dB
ank
2009b)
Banks’
aver
age
pri
ces
(%of
$200)
Banks
avg
pri
ce70
12.4
011.7
82009
Rem
itta
nce
Pri
ces
Worl
dw
ide
(Worl
dB
ank
2009b)
Money
transf
eroper
ators
’av
erage
pri
ces
(%of
$200)
MT
Os
avg
pri
ce112
8.7
88.0
72009
Rem
itta
nce
Pri
ces
Worl
dw
ide
(Worl
dB
ank
2009b)
Wes
tern
Unio
n’s
aver
age
pri
ces
(%of
$200)
WU
avg
pri
ce98
10.8
410.3
32009
Rem
itta
nce
Pri
ces
Worl
dw
ide
(Worl
dB
ank
2009b)
Log
of
num
ber
of
mig
rants
inth
eco
rrid
or
Log
bil
mig
119
11.6
111.8
82006
Rat
ha
and
Shaw
(2007)
Log
of
GD
Pper
capit
ain
rece
ivin
gco
untr
yL
og
GD
Pre
c119
7.1
57.4
0A
vera
ge
for
2006-0
7W
orl
dD
evel
opm
ent
Indic
ators
(Worl
dB
ank
2009c)
Log
of
GD
Pper
capit
ain
sendin
gco
untr
yL
og
GD
Pse
nd
119
10.0
210.1
7A
vera
ge
for
2006-0
7W
orl
dD
evel
opm
ent
Indic
ators
(Worl
dB
ank
2009c)
Dum
my
for
peg
ged
exch
ange
rate
or
dollari
zati
on
Peg
rec
119
0.3
30.0
02008
Annual
Rep
ort
on
Exch
ange
Arr
angem
ents
and
Res
tric
tions
(IM
F)
Share
rura
lpopula
tion
(%)
inre
ceiv
ing
countr
yR
ura
lpop
rec
119
49.4
850.2
2A
vera
ge
for
2006-0
7W
orl
dD
evel
opm
ent
Indic
ators
(Worl
dB
ank2009c)
Share
rura
lpopula
tion
(%)
inse
ndin
gco
untr
yR
ura
lpop
send
119
20.5
618.9
9A
vera
ge
for
2006-0
7W
orl
dD
evel
opm
ent
Indic
ators
(Worl
dB
ank
2009c)
Log
of
dis
tance
bet
wee
nse
ndin
gand
rece
ivin
gco
untr
ies
Log
dis
t119
8.2
28.3
9-
Dis
tance
sdat
abase
(CE
PII
2010)
Com
mon
language
Com
Language
119
0.4
40.0
0-
Dis
tance
sdat
abase
(CE
PII
2010)
Contr
ols
on
rem
itta
nce
sin
rece
ivin
gco
untr
yC
trl
rem
itre
c105
0.2
10.0
02007
Annual
Rep
ort
on
Exch
ange
Arr
ange
men
tsan
dR
estr
icti
ons
(IM
F2007)
Share
of
educa
ted
(sec
ondary
or
tert
iary
educa
tion)
mig
rants
Mig
educ
88
54.1
453.4
72000
Dat
abase
on
Imm
igra
nts
and
Expat
riat
es(O
EC
D2010)
Bra
nch
esper
capit
a(1
00,0
00
peo
ple
)in
rece
ivin
gco
untr
yB
rchs
pc
rec
89
6.6
26.3
02008
Dat
abase
on
Acc
ess
toFin
anci
al
Ser
vic
es(W
orl
dB
ank
2007)
112 T H E W O R L D B A N K E C O N O M I C R E V I E W
at International Monetary F
und on August 12, 2011
wber.oxfordjournals.org
Dow
nloaded from

Bra
nch
esper
capit
a(1
00,0
00
peo
ple
)in
sendin
gco
untr
yB
rchs
pc
send
119
33.6
430.8
62008
Dat
abase
on
Acc
ess
toFin
anci
al
Ser
vic
es(W
orl
dB
ank
2007)
Index
of
regula
tions
for
rem
itta
nce
pro
vid
ers
inre
ceiv
ing
countr
yR
egre
c91
2.2
02.0
02008
Worl
dB
ank
Glo
bal
Pay
men
tSys
tem
sSurv
ey(W
orl
dB
ank
2008)
Index
of
regula
tions
for
rem
itta
nce
pro
vid
ers
inse
ndin
gco
untr
yR
egse
nd
119
2.2
52.0
02008
Worl
dB
ank
Glo
bal
Pay
men
tSys
tem
sSurv
ey(W
orl
dB
ank
2008)
H-s
tati
stic
for
bankin
gse
ctor
inre
ceiv
ing
countr
yH
-Sta
tre
c111
0.5
40.5
21994-2
006
Banksc
ope
dat
abase
(Bure
au
van
Dijk
2009)
and
auth
or
calc
ula
tions
H-s
tati
stic
for
bankin
gse
ctor
inse
ndin
gco
untr
yH
-Sta
tse
nd
119
0.5
20.5
01994-2
006
Banksc
ope
dat
abase
(Bure
au
van
Dijk
2009)
and
auth
or
calc
ula
tions
Num
ber
of
resp
onden
tsper
corr
idor
Res
pper
corr
119
7.9
78.0
02009
Rem
itta
nce
Pri
ces
Worl
dw
ide
(Worl
dB
ank
2009b)
Share
of
banks
per
corr
idor
(%)
%of
banks
119
31.3
520.0
02009
Rem
itta
nce
Pri
ces
Worl
dw
ide
(Worl
dB
ank
2009b)
Index
import
ance
of
banks
rece
ivin
gco
untr
yB
ank
imp
rec
90
5.3
26.0
02007/8
Worl
dB
ank
Glo
bal
Pay
men
tSys
tem
sSurv
ey(W
orl
dB
ank
2008)
Index
import
ance
of
banks
sendin
gco
untr
yB
ank
imp
send
108
5.1
15.5
02007/8
Worl
dB
ank
Glo
bal
Pay
men
tSys
tem
sSurv
ey(W
orl
dB
ank
2008)
Log
of
bilat
eral
trade
Log
Bil
Tra
de
111
21.9
021.8
7A
vera
ge
for
2006-0
7D
irec
tion
of
Tra
de
Sta
tist
ics
(IM
F2009)
Sav
ings
acco
unt
annual
fee
(%of
GD
Ppc)
rece
ivin
gco
untr
yA
nnual
fee
rec
85
0.5
50.0
72003
Bec
k,
Dem
irguc-
Kunt,
Mart
ınez
Per
ıa(2
008)
Sav
ings
acco
unt
annual
fee
(%of
GD
Ppc)
sendin
gco
untr
yA
nnual
fee
send
72
0.1
20.0
02003
Bec
k,
Dem
irguc-
Kunt,
Mart
ınez
Per
ıa(2
008)
Min
imum
am
ount
toopen
asa
vin
gs
acco
unt
(%of
GD
Ppc)
rece
ivin
gco
untr
yM
inam
nt
open
rec
85
7.3
61.5
92003
Bec
k,
Dem
irguc-
Kunt,
Mart
ınez
Per
ıa(2
008)
Min
imum
am
ount
toopen
asa
vin
gs
acco
unt
(%of
GD
Ppc)
sendin
gco
untr
yM
inam
nt
open
send
72
0.1
10.0
02003
Bec
k,
Dem
irguc-
Kunt,
Mart
ınez
Per
ıa(2
008)
Sourc
e:A
uth
ors
’analy
sis
base
don
dat
are
fere
nce
din
the
table
.
Thorsten Beck and Marıa Soledad Martınez Perıa 113
at International Monetary F
und on August 12, 2011
wber.oxfordjournals.org
Dow
nloaded from

characteristics and on some corridor-specific variables captured by the matrixX in equation (1):
Pij ¼ a0 þ a1Sending country factorsi þ a2Receiving country factors j
þ a3Xij þ uij ð1Þ
where Pij is the price of sending $200 from country i to country j expressed asa percentage of $200. All explanatory variables are lagged relative to the pricevariable. Since this does not completely rule out reverse causation or endogene-ity bias, the results are interpreted as associations rather than as causalimpacts. Table 1 provides the summary statistics and data sources for each vari-able, and table 2 reports correlations across the main variables.
Government Policies
Equation (1) captures an array of factors that might be correlated with remit-tance prices through their association with the costs faced by remittance serviceproviders and the mark-up providers can charge over their marginal costs.First, it controls for different government policies relating to the exchange rate,
FIGURE 4. Average Price of Remittances sent through Western Union
Source: Authors’ analysis based on data from World Bank (2009b).
114 T H E W O R L D B A N K E C O N O M I C R E V I E W
at International Monetary F
und on August 12, 2011
wber.oxfordjournals.org
Dow
nloaded from

TA
BL
E2
.C
orr
elat
ion
Mat
rix:
Pair
wis
eC
orr
elat
ions
am
ong
Main
Vari
able
s
Avg
Pri
ce
Log
bil
mig
Log
GD
Pre
c
Log
GD
Pse
nd
Peg rec
Rura
l
pop
rec
Rura
l
pop
send
Com
language
Brc
hs
pc
rec
Brc
hs
pc
send
Reg
.re
cR
eg.
send
H-S
tat
rec
H-S
tat
send
Res
p
per
corr
Share
of
banks
Log
bil
trade
Annual
fee
rec
Annual
fee
send
Min
am
nt
open
rec
Avg
pri
ce1
Log
bil
mig
20.3
8**
1L
og
GD
Pre
c0.0
90.2
6**
1
Log
GD
Pse
nd
20.1
40.3
2**
0.1
8**
1Peg
rec
20.0
82
0.1
02
0.1
22
0.1
41
Rura
lpop
rec
0.0
32
0.1
22
0.7
5**
20.1
9**
0.0
71
Rura
lpop
send
0.3
6**
20.1
00.0
92
0.5
1**
0.0
62
0.0
91
Com
language
20.2
0**
0.1
52
0.1
10.0
22
0.0
40.0
52
0.2
9**
1B
rchs
pc
rec
0.0
50.1
60.5
8**
0.0
40.2
02
0.5
9**
0.1
22
0.1
91
Brc
hs
pc
send
20.1
10.1
20.2
1**
0.0
90.0
12
0.2
6**
0.2
2**
20.1
8**
0.1
91
Reg
.re
c0.0
40.0
80.1
80.1
00.0
12
0.2
5**
0.1
12
0.0
62
0.1
70.1
41
Reg
.se
nd
20.5
1**
0.0
32
0.1
40.1
20.0
30.0
62
0.6
6**
0.1
9**
20.1
50.0
72
0.0
41
H-S
tat
rec
20.2
1**
0.0
20.2
0**
0.1
32
0.0
22
0.0
32
0.1
22
0.0
30.0
52
0.0
20.0
00.0
61
H-S
tat
send
20.2
7**
0.3
5**
0.2
8**
0.5
6**
20.1
42
0.3
3**
0.0
52
0.0
70.1
60.5
5**
0.2
2**
20.1
10.1
61
Res
pper
corr
20.3
3**
0.3
5**
0.2
6**
0.1
80.0
02
0.2
2**
20.2
0**
0.3
0**
0.2
00.3
0**
0.1
30.2
2**
0.1
20.1
9**
1Share
of
banks
0.5
5**
20.0
80.0
52
0.4
6**
0.0
70.0
90.6
0**
20.2
2**
0.1
72
0.2
6**
0.0
12
0.6
3**
20.1
62
0.4
6**
20.1
71
Log
bil
Tra
de
0.0
20.3
6**
0.3
5**
0.2
5**
20.2
5**
20.0
80.0
30.0
00.0
42
0.1
20.2
12
0.1
70.1
20.2
5**
0.1
80.1
11
Annual
fee
rec
0.2
9**
20.5
1**
20.3
3**
20.2
5**
0.0
70.2
8**
0.0
60.2
6**
20.1
82
0.1
72
0.0
22
0.0
72
0.1
02
0.2
6**
20.1
40.1
02
0.2
7**
1A
nnual
fee
send
0.2
9**
20.4
2**
20.2
12
0.9
4**
0.1
10.2
5**
0.6
5**
0.1
02
0.1
72
0.3
0**
20.1
22
0.5
0**
20.1
02
0.5
5**
20.2
8**
0.5
3**
20.1
10.4
0**
1
Min
am
nt
open
rec
20.0
12
0.2
3**
20.5
5**
0.0
10.1
70.3
1**
20.1
20.2
2**
20.2
4**
20.1
60.1
10.0
82
0.1
02
0.1
22
0.1
12
0.1
82
0.4
1**
0.4
0**
0.0
71
Min
am
nt
open
send
0.3
9**
20.4
4**
20.2
22
0.9
3**
0.1
50.2
7**
0.5
6**
0.1
72
0.1
62
0.3
8**
20.1
42
0.4
7**
20.1
32
0.7
2**
20.2
00.6
1**
20.1
00.4
6**
0.9
6**
0.0
9
**Sig
nifi
cant
atle
ast
atth
e5
per
cent
leve
l.
Note
:For
defi
nit
ions,
see
table
1.
Only
the
main
vari
able
sare
incl
uded
inth
ista
ble
.Full
resu
lts
are
available
on
reques
t.
Sourc
e:A
uth
ors
’analy
sis
base
don
dat
ades
crib
edin
the
text.
Thorsten Beck and Marıa Soledad Martınez Perıa 115
at International Monetary F
und on August 12, 2011
wber.oxfordjournals.org
Dow
nloaded from

the capital account, and regulation of the remittance market that might influ-ence the costs faced by remittance service providers. It includes a dummy vari-able for receiving countries with pegged exchanged rates (including cases ofcurrency boards, de facto pegged regimes, and no separate legal tender). Lowerexchange rate volatility should be associated with lower prices, by lowering theexchange rate costs and uncertainty faced by providers and, thus, the spreadsthey charge to customers. At the same time, the price of sending remittances isexpected to be higher in countries that impose controls on remittance trans-actions, since controls operate like a tax that is likely to be passed onto recipi-ents. Both the dummy variable for pegged exchange rate regimes and thecapital controls dummy variable are from the International Monetary Fund(IMF 2007). In 39 corridors (almost 33 percent of the sample), the exchangerate is pegged or the economy is fully dollarized, so there is no exchange ratevariability, and in 22 corridors (18 percent of the sample) there are controls ongifts from abroad or remittances.
The analysis controls for the breadth of regulation of remittance service pro-viders in sending and receiving countries by creating an index of regulationthat takes a value of 0–5 depending on whether providers must be registered,must be licensed, are subject to specific safety and efficiency requirements, needto comply with anti–money laundering regulations, or need to comply withlaws and regulations of general applicability. Data for creating the indexes arefrom the 2008 Global Payment Systems Survey conducted by the World Bank(2008). While a broader regulatory framework might make the remittancemarket more transparent and more competitive, greater exposure to regulationscan also increase the costs for regulated institutions, so the impact is ambigu-ous a priori.14 Similarly, greater breadth of regulation might reduce thenumber of service providers, with negative repercussions for competitiveness.The index averages 2.2 among remittance receiving countries and 2.3 amongremittance sending countries.
Remittance Mark-ups
The regressions also include proxies for factors that might be associated withremittance prices because of their effect on the mark-up remittance service pro-viders can charge their customers. The analysis posits that providers can morereadily charge a mark-up if there is little competition in the remittance marketand if customers are not well informed. Two indirect measures of competitionamong remittance service providers are used (direct measures are lacking). Oneis the number of remittance service providers in the database for each corridor.Since the Remittances Prices Worldwide survey tries to cover the most impor-tant providers in a corridor, corridors with more providers are assumed to have
14. Note that the index does not measure the severity of regulations, but only the scope of the
regulatory framework.
116 T H E W O R L D B A N K E C O N O M I C R E V I E W
at International Monetary F
und on August 12, 2011
wber.oxfordjournals.org
Dow
nloaded from

more active firms and, other things equal, to be more competitive.15 Theaverage number of respondents across all corridors is 8, and the number variesfrom 2 in the Spain–China corridor to 18 in the United States–Mexicocorridor.
The second measure is of competition among banks in receiving and sendingcountries. The rationale is that more competitive banking sectors will offercheaper services, including for remittance transactions. This will create pressurefor other providers to lower prices as well. Of course, this implicitly assumesthat banks are important players in the remittance business. Following Panzarand Rosse (1982, 1987), the H-statistic is used to measure the degree of com-petition in the banking sector by calculating the sum of the elasticities ofbanks’ interest revenues to different input prices (see the appendix for a discus-sion of the methodology used to calculate the H-statistic).16 Under perfectcompetition, an increase in input prices raises both marginal costs and revenuesby the same amount and, thus, the H-statistic will equal 1. In a monopoly, anincrease in input prices results in a rise in marginal costs, a fall in output, anda decline in revenues, leading to an H-statistic of less than or equal to 0. WhenH is between 0 and 1, the system operates under monopolistic competition. Anegative relationship is expected between the H-statistic in sending and receiv-ing countries and the price of sending remittances. Data for 1994–2006 fromBankscope database (Bureau van Dijk 2009) are used to compute theH-statistic. Among both remittance receiving and sending countries, theH-statistic averages close to 0.53. But the standard deviation is larger for remit-tance sending countries.
The significance of the relative importance of banks in the remittancemarket in explaining cross-corridor variation in remittance prices is alsoexplored using the share of bank respondents among all remittance service pro-viders in the database. To the extent that, as some have argued, banks viewremittances as a marginal product and are less likely to offer competitive prices(Ratha and Riedberg 2005), a positive correlation is expected between theshare of bank respondents and the average price of remittances. Across the 119corridors, the share of bank respondents varies from 0 percent in the Italy–SriLanka corridor to 100 percent in the South Africa–Swaziland corridor. Onaverage, the share across corridors is 31 percent.
Because data were lacking on the share of the remittance market capturedby each provider, the percentage of bank respondents described above may notreflect the actual importance of commercial banks. Hence, an alternativemeasure, obtained from the Global Payment Systems Survey (World Bank
15. Because in most cases, mystery shoppers were used to gather data on the price of remittances,
the number of respondents should not be affected by the willingness of certain providers to cooperate.
However, it is still possible that in some corridors the number of respondents is small simply because
interviewers had difficulty reaching or locating some providers.
16. Other studies that use this methodology to estimate competition include Bikker and Haaf
(2002), Gelos and Roldos (2004), Claessens and Laeven, (2004), and Levy-Yeyati and Micco (2007).
Thorsten Beck and Marıa Soledad Martınez Perıa 117
at International Monetary F
und on August 12, 2011
wber.oxfordjournals.org
Dow
nloaded from

2008), is used to test the sensitivity of the findings. The measure indicates thedegree to which central banks consider commercial banks to be significantremittance service providers, on a scale from 1 (least relevant) to 6 (most rel-evant).17 The correlation between this variable and the percentage of bankrespondents is 0.37 and is significant at the 5 percent level.
The financial literacy of remittance senders can also affect mark-ups. Sincefinancial literacy cannot be captured directly, a measure of the education levelof migrants in each corridor is used (migrants with a secondary or tertiary edu-cation as a share of total migrants from the remittance receiving country resid-ing in the remittance sending country). This variable comes from the OECDDatabase on Immigrants and Expatriates (OECD 2010). This variable isexpected to be correlated with financial literacy, and to the degree that finan-cial literacy enables consumers to make better informed choices, prices shouldbe lower. The ratio of secondary and tertiary educated migrants varies from 21percent for Chinese migrants in Italy to 91 percent for Nigerian migrants in theUnited States. Because this variable is available for only 88 of the 119 corri-dors, it is not included in the baseline estimations but is shown as an additionalvariable.
Socioeconomic Variables
Several socioeconomic variables are included that can influence remittanceprices by affecting both costs and mark-ups. One, a proxy for the volume ofremittance transactions within corridors, is the number (bilateral stock) ofmigrants residing in the remittance sending country who are originally fromthe remittance receiving country. These data are from the World Bank (Rathaand Shaw 2007). Unlike the flow of actual remittances, migrant stock is lesslikely to be endogenous to the price variable. A negative relationship is conjec-tured between the stock of migrants and the price of remittances; a highervolume of migrants might imply scale economies and, hence, lower costs forproviders and more competition among them, resulting in smaller mark-ups.18
The number of migrants is negligible in the South Africa–Zambia corridor andexceeds 10 million people in the United States–Mexico corridor. The averageis 379,200 migrants.
GDP per capita is also included, as a proxy for economic development andstandard of living. This variable comes from the World Bank’s WorldDevelopment Indicators database (World Bank 2009c). The cost of goods andservices will be higher in countries with higher standards of living, so remit-tance prices would also be expected to be higher. Countering that tendency,economic development may be associated with greater efficiencies and lower
17. The Global Payment Systems Survey scale uses 1 to indicate most relevant and 6 the least
relevant. The scale is inverted here so that higher values indicate that banks are more important.
18. The presence of more migrants might encourage entry of a larger number of remittance service
providers, leading to more contestability and lower mark-ups.
118 T H E W O R L D B A N K E C O N O M I C R E V I E W
at International Monetary F
und on August 12, 2011
wber.oxfordjournals.org
Dow
nloaded from

costs for financial intermediation (Harrison, Sussman, and Zeira 1999) andthus lower remittance prices. In the sample, GDP per capita for receivingcountries varies from $148 in Malawi to close to $14,000 in the Republic ofKorea. Among remittance sending countries, GDP per capita varies from$3,640 in South Africa to $40,200 in Japan (all prices in U.S. dollars).19
The geographic distribution of the population in sending and receivingcountries might also be an important driver of the price of remittances, as amore sparsely distributed population might be harder to reach, thus raisingtransaction costs for providers. A more sparsely distributed population mightalso increase the pricing power of providers, as geographic access is more diffi-cult for senders and recipients of remittances. The share of rural population inboth sending and receiving countries is used to proxy for the disparity in geo-graphic distribution.20 These data come from the World Bank’s WorldDevelopment Indicators (World Bank 2009c). Among receiving countries, therural population varies from 13 percent of the total in Lebanon to 87 percentin Uganda and averages 48 percent. By contrast, among sending countries, therural population varies from 0 for Singapore to 40 percent for South Africaand averages 21 percent.
Bank Variables
To measure access to financial services more directly, some estimations alsocontrol for the number of bank branches per capita in sending and receivingcountries.21 This variable is expected to have a negative association with theprice of sending remittances, as higher branch penetration will reduce trans-action costs and increase scale. The ratio of branches per capita averages about6 per 100,000 inhabitants in receiving countries and close to 34 per 100,000in sending countries.
Measures of the costs of accessing formal banking services in both sendingand receiving countries (the minimum amount to open a savings account andthe annual fee to maintain an account) are also included (Beck,Demirguc-Kunt, and Martınez Perıa 2008). Easier and cheaper access is conjec-tured to increase the options for both senders and recipients of remittances andthus to boost competition. The minimum balance to open a savings accountaverages 7.36 percent of GDP per capita in receiving countries and 0.11
19. Regressions were also run that controlled separately for the level of financial development using
the ratio of liquid liabilities to GDP. The results are very similar to those including GDP per capita.
Since these variables are highly correlated—(0.2) among receiving countries and (0.4) among sending
countries—these estimations are not reported, and GDP per capita is included instead as a broader
measure of development.
20. The share of rural population is a better proxy for the effect of service delivery than population
density, which is an average within a country and does not take into account which share of the
population actually lives in more remote areas. The population density variable yielded similar results.
21. These data are from Beck, Demirguc-Kunt, and Martınez Perıa (2007) and can be accessed at
http://go.worldbank.org/EZDOBVQT20. Because these data are not available for all corridors, this
variable is not included in all estimations.
Thorsten Beck and Marıa Soledad Martınez Perıa 119
at International Monetary F
und on August 12, 2011
wber.oxfordjournals.org
Dow
nloaded from

percent in sending countries; fees average 0.55 percent of GDP per capita inreceiving countries and 0.12 percent in sending countries.
Corridor-specific Variables
Finally, several corridor-specific variables are included that might influence theextent and ease of remittance transactions and, therefore, their costs. These arethe distance between sending and receiving countries (from capital city tocapital city) and a dummy variable for a common language (takes a value ofone if both countries have at least one common language spoken by more than9 percent of the population). These data come from the French ResearchCenter in International Economics (CEPII) Distances database (CEPII 2010).Smaller geographic and linguistic distances might also foster the emergence ofinformal remittance service providers, adding competitive pressure to theformal remittance market. Some estimations also include the log of bilateralexports and imports, a measure of bilateral trade. These data come from theIMF Direction of Trade Statistics (IMF 2009).
Correlations Between Variables in Our Dataset
The average prices of remittances are significantly lower in corridors with ahigher number of migrants, smaller share of rural population, and a commonlanguage (see table 2). Prices are also lower in corridors where competition ishigher and bank participation in the remittance industry is lower. Finally,prices are lower in corridors where sending countries have a broader regulatoryframework for remittance service operators and where minimum balances toopen a savings account and annual fees to maintain them are lower.
Some explanatory variables are highly correlated with others. For instance,GDP per capita in receiving and sending countries is significantly correlatedwith competition among providers, rural population share, branch penetration,cost of using banking services, and extent of bilateral trade.
I I I . E M P I R I C A L R E S U L T S
Table 3, column 3.1 reports the baseline estimation considering average remit-tance prices charged across all providers with variables for which data areavailable for all 119 corridors. Though information on the number of respon-dents and the percentage of banks among respondents is also available acrossall corridors, these variables are not included in the baseline estimations since,as discussed earlier, they might not adequately capture the degree of compe-tition and the importance of banks in the remittance market.
The baseline regression shows that, across all providers in 119 corridors,remittance prices are significantly associated with the number of migrants inthe corridor, the level of income, and the share of rural population in receivingand sending countries. Corridors with a higher number of migrants exhibit
120 T H E W O R L D B A N K E C O N O M I C R E V I E W
at International Monetary F
und on August 12, 2011
wber.oxfordjournals.org
Dow
nloaded from

TA
BL
E3
.R
egre
ssio
ns
for
the
Ave
rage
Pri
ces
of
Sen
din
g$200
inR
emit
tance
sfo
rall
Rem
itta
nce
Ser
vice
Pro
vid
ers
Vari
able
(3.1
)(3
.2)
(3.3
)(3
.4)
(3.5
)(3
.6)
(3.7
)(3
.8)
(3.9
)(3
.10)
(3.1
1)
(3.1
2)
Log
num
ber
of
mig
rants
21.0
92
0.9
82
1.1
22
1.1
02
1.0
52
1.0
22
1.4
72
0.4
42
0.3
52
1.0
72
0.8
72
1.0
6(2
4.9
6)*
**
(24.4
0)*
**
(26.2
0)*
**
(24.3
7)*
**
(24.4
4)*
**
(24.4
0)*
**
(210.5
4)*
**
(21.2
5)
(22.2
6)*
*(2
4.4
1)*
**
(22.5
0)*
*(2
4.3
3)*
**
Log
GD
Pper
capit
are
ceiv
ing
1.9
12.1
12.7
61.3
13.5
71.9
63.2
03.1
83.2
32.2
52.6
42.1
3
(2.4
0)*
*(2
.66)*
**
(3.7
4)*
**
(1.8
8)*
(3.9
8)*
**
(2.2
8)*
*(3
.60)*
**
(2.3
0)*
*(2
.50)*
*(2
.69)*
**
(3.1
7)*
**
(2.5
1)*
*L
og
GD
Pper
capit
ase
ndin
g2.0
41.9
53.9
02.7
32.3
81.0
32.3
36.4
310.6
41.9
42.3
62.1
9
(2.2
1)*
*(2
.11)*
*(3
.96)*
**
(3.3
2)*
**
(2.8
2)*
**
(0.9
1)
(2.9
2)*
**
(2.5
6)*
*(7
.19)*
**
(2.0
2)*
*(1
.12)
(2.0
3)*
*Peg
ged
or
doll
ari
zed
21.1
62
1.0
22
0.7
72
1.2
02
0.2
22
0.5
32
1.4
01.0
60.9
82
1.3
72
0.0
72
1.1
6(2
1.3
8)
(21.2
3)
(21.0
3)
(21.6
4)
(20.2
0)
(20.4
9)
(21.4
6)
(0.5
7)
(0.6
0)
(21.4
5)
(20.0
7)
(21.2
1)
Share
rura
lpopula
tion
r ece
ivin
g0.0
90.0
90.1
00.0
50.1
30.0
90.1
20.1
40.1
40.1
20.1
10.1
0
(2.9
1)*
**
(2.7
5)*
**
(3.2
3)*
**
(1.8
3)*
(4.0
1)*
**
(2.6
4)*
**
(2.5
9)*
*(2
.16)*
*(2
.63)*
*(3
.34)*
**
(2.8
3)*
**
(2.8
5)*
**
Share
rura
lpopula
tion
sendin
g0.2
20.2
10.3
30.0
80.2
32
0.0
10.2
50.1
60.1
60.2
20.0
80.2
2
(4.4
3)*
**
(4.2
7)*
**
(7.1
9)*
**
(1.7
1)*
(4.6
7)*
**
(20.1
1)
(4.8
1)*
**
(1.4
7)
(2.3
1)*
*(4
.21)*
**
(1.0
0)
(3.8
3)*
**
Log
dis
tance
20.3
62
0.2
90.2
32
0.0
20.4
70.1
90.5
82
0.1
00.7
52
0.2
02
0.1
22
0.3
6(2
0.7
0)
(20.5
7)
(0.5
5)
(20.0
5)
(0.8
7)
(0.3
4)
(1.0
0)
(20.0
8)
(0.9
0)
(20.3
9)
(20.1
8)
(20.6
5)
Com
mon
language
0.0
60.4
90.2
30.4
61.3
12
0.4
10.1
51.3
50.7
82
0.3
62
1.3
22
0.2
9(0
.08)
(0.6
6)
(0.3
4)
(0.6
9)
(1.4
3)
(20.4
4)
(0.1
9)
(0.7
5)
(0.6
1)
(20.4
4)
(21.4
6)
(20.3
4)
Num
ber
resp
onden
tsper
corr
idor
20.3
0
(22.8
2)*
**
H2
stat
isti
cre
ceiv
ing
25.1
5(2
2.6
5)*
**
H2
stat
isti
cse
ndin
g2
16.1
2(2
5.0
8)*
**
Share
of
banks
per
corr
idor
0.0
9
(6.7
0)*
**
Index
banks
import
ance
rece
ivin
g0.7
0
(1.6
5)
Index
banks
import
ance
sendin
g1.8
8
(4.4
0)*
**
Index
of
regula
tion
rece
ivin
g0.2
4
(Conti
nued
)
Thorsten Beck and Marıa Soledad Martınez Perıa 121
at International Monetary F
und on August 12, 2011
wber.oxfordjournals.org
Dow
nloaded from

TA
BL
E3.
Conti
nued
Vari
able
(3.1
)(3
.2)
(3.3
)(3
.4)
(3.5
)(3
.6)
(3.7
)(3
.8)
(3.9
)(3
.10)
(3.1
1)
(3.1
2)
(0.7
4)
Index
of
regula
tion
sendin
g2
2.7
8
(22.9
3)*
**
Bank
bra
nch
esper
capit
are
ceiv
ing
0.1
2
(0.6
2)
Bank
bra
nch
esper
capit
ase
ndin
g2
0.0
5
(23.2
0)*
**
Sav
ings
acco
unts
fee
rece
ivin
g0.4
9
(1.3
3)
Sav
ings
acco
unts
fee
sendin
g16.2
8
(1.7
6)*
Min
.am
ount
toopen
acco
unt
rece
ivin
g2
0.0
2
(20.4
2)
Min
.am
ount
toopen
acco
unt
sendin
g27.9
7
(7.2
4)*
**
Contr
ols
on
rem
itta
nce
s0.0
6(0
.06)
Share
of
educa
ted
mig
rants
0.0
2
(0.7
3)
Log
bil
ater
al
trade
20.0
6(2
0.2
5)
Obse
rvat
ions
119
119
111
119
84
91
89
53
53
105
88
111
R-s
quare
d0.3
60.3
80.5
60.5
30.5
40.4
50.5
20.3
80.6
20.3
90.2
50.3
6D
iff.
max-m
inpri
ces
pre
dic
ted
ove
rac
tual
0.2
60.2
50.2
70.3
50.4
10.3
30.2
80.3
60.2
50.2
30.2
30.2
8
*Sig
nifi
cant
atth
e10
per
cent
leve
l;**si
gnifi
cant
atth
e5
per
cent
leve
l;***si
gnifi
cant
atth
e1
per
cent
leve
l.N
ote
:N
um
ber
inpare
nth
eses
are
robust
t-st
atis
tics
.C
onst
ant
isin
cluded
but
not
show
n.
Sourc
e:A
uth
ors
’analy
sis
base
don
dat
ades
crib
edin
the
text.
122 T H E W O R L D B A N K E C O N O M I C R E V I E W
at International Monetary F
und on August 12, 2011
wber.oxfordjournals.org
Dow
nloaded from

lower prices, while those with higher incomes per capita and a larger percen-tage of rural population face higher prices. These results are consistent acrossall estimations reported in table 3.
As expected, greater competition among providers (measured by number ofrespondents or the H-statistic for the banking sector) is associated with lowerremittance prices (table 3, columns 3.2 and 3.3). Corridors where banks play alarger role in the remittance market exhibit higher prices (columns 3.4 and3.5). Corridors with broader regulation of remittance service providers in thesending country have lower prices, while the regulatory breadth in the receivingcountry does not seem to matter (column 3.6).
Greater access to and lower costs of banking services are associated withlower prices of remittances (columns 3.7–3.9). In particular, corridors withmore bank branches per capita in the sending country face lower prices, whilecorridors with higher minimum amounts to open accounts and higher annualfees have higher remittance prices.
The results discussed so far are economically as well as statistically signifi-cant. For example, an increase in the number of migrants from the corridor atthe 25th percentile (United Kingdom–China with 56,774) to the corridor atthe 75th percentile (Spain–Colombia with 384,621) is associated with a 2 per-centage point drop in average prices. An increase in competition (as measuredby the H-statistic) in the sending country from the 25th percentile to the 75thimplies a 4.4 percentage point reduction in remittance prices, while an increasein the receiving country is associated with a 1.4 percentage point reduction. Asimilar change in the number of remittance service respondents (from 6, the25th percentile, to 10, the 75th percentile) is associated with a 1.2 percentagepoint drop in prices, while an increase in the scope of remittance regulation inthe sending country implies a reduction of 2.8 percentage points. A comparableincrease in the number of branches per capita in the sending country is associ-ated with a 1.6 percentage point decline in prices. Even stronger, an increase inthe percentage of banks among survey respondents from the 25th (0 percent)to the 75th percentile (50 percent) implies an increase in prices of more than 4percentage points. Note that the average price across corridors associated withthese changes is close to 10 percent, so the effects are considerable.
In contrast, no robust association is found between remittance prices andmeasures of exchange rate stability or the presence of capital controls on remit-tances (columns 3.1 and 3.10). Similarly, the distance between sending andreceiving countries, the extent of bilateral trade, and whether countries share acommon language are not correlated with remittance prices (columns 3.1 and3.12).22 Finally, the share of educated migrants does not have a significanteffect (column 3.11).
22. If common language is replaced with a dummy variable for whether the receiving and sending
countries have colonial ties, the main results do not change and the dummy variable for colonial ties
tends to be positive and significant. These results are available on request.
Thorsten Beck and Marıa Soledad Martınez Perıa 123
at International Monetary F
und on August 12, 2011
wber.oxfordjournals.org
Dow
nloaded from

Using alternative indicators for several variables, such as the Parson andothers (2007) data on bilateral migration and a Barro and Lee (2001) measureof educational attainment, yields similar findings.23 Also, running theregressions for median instead of average prices does not change the results sig-nificantly; neither does using prices based on sending $500 instead of $200.The results are not reported here but are available on request.
Overall, the estimations have good predictive power. The R-squared for thebaseline regression (table 3, column 3.1) is 0.36 and varies from 0.25 (column3.11) to 0.56 (column 3.3), depending on the additional controls included.Similarly, the estimations are reasonably good at predicting the differencebetween extreme observations (the difference between the corridors with themaximum and minimum prices). Depending on the estimation, the share of theactual difference between the maximum and minimum prices that is predictedby the estimations varies from 0.23 (column 3.11) to 0.41 (column 3.5).
Finally, partial plots of remittance prices against the variables found to beconsistently significant (log of migrants, log of GDP per capita in sendingcountry, share of rural population in sending country, number of respondentsin the corridor, H-statistic for bank competition in the sending country, shareof bank respondents, index of importance of banks among remittance serviceproviders, and index of regulation of remittance service providers) show thatthese variables do a good job of predicting prices and that the correlations arenot driven by outliers (figure 5). The log of migrants appears to be an excep-tion, with large outliers for the South Africa–Zambia and South Africa–Angola corridors (top left corner of figure 5). However, when these two out-liers are removed, the log of migrants remains significant at the 1 percent leveland the other results in the baseline estimations do not change significantly.
Next are the factors that influence remittance prices across service providertypes. Table 4 shows separate estimations for average prices among banks(columns 4.1–4.4), MTOs (columns 4.5–4.8), and Western Union (4.9–4.12).To save space, only some of the specifications shown to be significant in theregressions for all providers (see table 3) are reported here; others are availableon request. In columns 4.1–4.4, the dependent variable is the average priceacross all bank respondents in a corridor. Since there are corridors wherebanks do not play a significant role in the remittance market (and so were notincluded in the database), the sample size is smaller than that in table 3. Mostof the results discussed so far hold when the sample is restricted to banks. Inparticular, a larger number of migrants, lower levels of per capita income inthe receiving country, and a smaller share of rural population are still
23. The correlation between the World Bank bilateral migration data and the Parson and others
(2007) data is 0.66, and results do not change when the Parson and others data are used. These results
are available on request. Barro and Lee’s (2001) average years of schooling of the population over 25
for the receiving country was used. Results remain unchanged. The results using the data on the
education of migrants are presented here, since those data more directly relate to the population that
conducts remittance transactions.
124 T H E W O R L D B A N K E C O N O M I C R E V I E W
at International Monetary F
und on August 12, 2011
wber.oxfordjournals.org
Dow
nloaded from

FIGURE 5. Partial Plots of Selected Regressors against Remittance Prices
Source: Authors’ analysis based on data described in the text.
Thorsten Beck and Marıa Soledad Martınez Perıa 125
at International Monetary F
und on August 12, 2011
wber.oxfordjournals.org
Dow
nloaded from

TA
BL
E4
.R
egre
ssio
ns
for
the
Ave
rage
Pri
ces
Charg
edby
Banks,
Money
Tra
nsf
erO
per
ators
,and
Wes
tern
Unio
non
$200
inR
emit
tance
s
Banks
Money
transf
eroper
ators
Wes
tern
Unio
n
Vari
able
(4.1
)(4
.2)
(4.3
)(4
.4)
(4.5
)(4
.6)
(4.7
)(4
.8)
(4.9
)(4
.10)
(4.1
1)
(4.1
2)
Log
num
ber
of
mig
rants
21.0
72
1.5
72
1.0
72
1.0
42
1.3
42
1.2
02
1.2
42
0.7
12
2.0
02
1.8
62
2.0
72
2.0
3
(22.6
4)*
*(2
3.9
7)*
**
(22.1
5)*
*(2
2.5
0)*
*(2
7.8
5)*
**
(26.4
2)*
**
(25.4
0)*
**
(22.2
3)*
*(2
7.4
4)*
**
(26.9
7)*
**
(27.3
2)*
**
(24.1
0)*
**
Log
GD
Pper
capit
are
ceiv
ing
3.0
66.2
85.9
215.7
91.0
21.5
90.6
91.6
31.6
21.9
51.3
32.0
6
(1.7
9)*
(3.4
2)*
**
(3.6
3)*
**
(2.1
4)*
*(1
.82)*
(2.9
5)*
**
(0.8
7)
(2.1
5)*
*(2
.19)*
*(2
.56)*
*(1
.42)
(1.9
7)*
Log
GD
Pper
capit
ase
ndin
g4.8
13.2
80.2
614.6
31.4
11.6
71.0
13.6
32.3
13.3
72.2
33.8
4
(2.8
8)*
**
(1.4
6)
(0.1
4)
(2.4
4)*
*(2
.42)*
*(2
.58)*
*(0
.93)
(2.7
0)*
*(2
.93)*
**
(2.5
9)*
*(1
.68)*
(0.4
9)
Peg
ged
or
dollari
zed
21.2
20.5
11.1
53.9
72
0.9
12
0.8
42
0.7
00.1
82
2.1
02
2.0
82
2.0
02
1.1
6(2
0.7
2)
(0.2
3)
(0.4
5)
(0.8
5)
(21.5
8)
(21.6
4)
(20.8
8)
(0.1
9)
(22.7
0)*
**
(22.5
6)*
*(2
1.8
7)*
(20.7
2)
Share
rura
lpopula
tion
rece
ivin
g0.0
70.1
50.1
80.4
90.0
40.0
70.0
40.0
90.0
40.0
50.0
50.0
7
(1.1
8)
(2.1
5)*
*(3
.02)*
**
(2.0
4)*
(1.6
7)*
(2.8
6)*
**
(1.4
7)
(2.6
2)*
*(1
.13)
(1.4
5)
(1.2
3)
(1.5
3)
Share
rura
lpopula
tion
sendin
g0.0
20.3
32
0.2
32
0.1
40.0
60.1
20.0
40.0
40.0
60.1
50.0
50.0
5
(0.2
3)
(3.7
7)*
**
(21.3
3)
(20.8
7)
(1.4
4)
(2.5
6)*
*(0
.56)
(0.5
4)
(0.9
0)
(1.5
5)
(0.4
3)
(0.3
1)
Log
dis
tance
0.1
41.1
40.9
92.6
92
0.2
62
0.1
92
0.2
70.1
42
0.2
82
0.2
82
0.4
82
0.3
4(0
.18)
(1.1
3)
(1.2
0)
(1.1
4)
(20.7
7)
(20.6
1)
(20.6
0)
(0.2
5)
(20.5
4)
(20.5
2)
(20.7
4)
(20.3
2)
Com
mon
language
0.7
32
0.8
72
1.7
12
6.9
30.3
90.1
32
0.2
31.0
12
0.2
02
0.3
52
1.1
42.6
2(0
.49)
(20.5
7)
(20.9
3)
(22.4
1)*
*(0
.58)
(0.2
0)
(20.2
7)
(0.7
4)
(20.2
2)
(20.3
8)
(21.0
7)
(1.0
2)
Share
of
banks
per
corr
idor
0.1
90.0
30.0
2
(5.7
1)*
**
(2.4
8)*
*(0
.89)
126 T H E W O R L D B A N K E C O N O M I C R E V I E W
at International Monetary F
und on August 12, 2011
wber.oxfordjournals.org
Dow
nloaded from

H2
stat
isti
cre
ceiv
ing
27.2
72
4.5
52
2.6
1(2
1.4
7)
(23.4
6)*
**
(21.2
0)
H2
stat
isti
cse
ndin
g2
14.3
42
5.1
32
7.9
9(2
1.8
0)*
(22.0
2)*
*(2
1.6
0)
Index
of
regula
tion
rece
ivin
g0.5
42
0.0
30.4
8
(0.8
2)
(20.1
0)
(1.1
8)
Index
of
regula
tion
sendin
g2
6.3
92
0.6
32
0.2
5
(23.7
0)*
**
(20.7
2)
(20.2
1)
Min
.am
ount
toopen
acco
unt
rece
ivin
g0.5
42
0.0
22
0.0
4
(0.9
9)
(20.4
8)
(20.7
0)
Min
.am
ount
toopen
acco
unt
sendin
g50.7
552.9
92
19.6
6
(3.8
5)*
**
(1.0
2)
(20.2
7)
Obse
rvat
ions
70
66
58
26
112
106
86
50
98
92
75
38
R-s
quare
d0.5
40.4
70.5
60.6
30.3
60.4
20.3
30.3
50.4
40.4
60.5
00.4
4D
iff.
max-m
inpri
ces
pre
dic
ted
ove
rac
tual
0.4
50.3
80.6
10.7
20.2
80.1
80.3
70.1
90.6
60.6
80.7
00.6
9
*Sig
nifi
cant
atth
e10
per
cent
leve
l;**si
gnifi
cant
atth
e5
per
cent
leve
l;***si
gnifi
cant
atth
e1
per
cent
leve
l.
Note
:N
um
ber
inpare
nth
eses
are
robust
t-st
atis
tics
.C
onst
ant
isin
cluded
but
not
show
n.
Sourc
e:A
uth
ors
’analy
sis
base
don
dat
ades
crib
edin
the
text.
Thorsten Beck and Marıa Soledad Martınez Perıa 127
at International Monetary F
und on August 12, 2011
wber.oxfordjournals.org
Dow
nloaded from

associated with lower prices, as is broader regulation of remittance service pro-viders in the sending country. As before, a higher share of banks amongrespondents and higher minimum balances to open accounts are positively cor-related with prices. The measures of competition are no longer significant atthe 5 percent level, a result likely due to the lower number of observations.24
Most of the earlier findings are confirmed when the sample is restricted toMTOs (columns 4.5–4.8 of table 4). A larger number of migrants and greatercompetition in the banking system are associated with lower prices, whilehigher levels of income and bank participation are associated with higherprices. A larger share of rural population is associated with higher remittanceprices among MTOs, but regulation of remittance service providers and costsof opening bank accounts are not significantly associated with remittanceprices among MTOs.
Columns 4.9–4.12 of table 3 show results for the prices charged by WesternUnion, one of the world’s largest MTOs, active in 98 corridors of the sample.Focusing on one financial institution permits controlling for any bias arisingfrom differences in institutions across corridors (composition bias), even withinthe group of banks and MTOs. The price data for Western Union confirm thata larger number of migrants and lower GDP per capita in the receiving andsending countries are associated with lower prices. In addition, exchange ratestability (as a result of pegged rates or dollarization) is also correlated withlower prices. Contrary to previous estimations, however, none of thecompetition-related indicators enter significantly, which could be due toWestern Union’s dominant position in the remittance business across most cor-ridors.25 Similarly, the share of rural population is generally not significantlyassociated with remittance prices across corridors for Western Union.
I V. C O N C L U S I O N S
This article on 119 migration corridors finds that remittance prices are associ-ated with a number of factors. First, the number of migrants is negatively andsignificantly associated with the price of remittances across different samplesand providers. This seems to suggest an important volume effect that worksthrough scale economies and lower costs for providers or through higher com-petition in a larger market leading to a lower mark-up. Second, remittanceprices are higher in corridors with higher income per capita, which couldreflect higher prices of nontradable goods, such as services, in general. Third,competition and market structure matter, except in the case of Western Union.Corridors with a larger number of providers and countries with more
24. This is established by rerunning the regression for the average fee across all providers for the
same sample as used in table 4.
25. This could be due to the fact that Western Union might have been operating longer in some
corridors than other firms. Also, Western Union might have better network coverage than other
providers in some countries.
128 T H E W O R L D B A N K E C O N O M I C R E V I E W
at International Monetary F
und on August 12, 2011
wber.oxfordjournals.org
Dow
nloaded from

competitive banking sectors exhibit lower prices, although prices are higher incorridors with a higher share of banks among providers. Fourth, bankingsector outreach, as measured by branch penetration and cost barriers, is associ-ated with lower remittance prices. Finally, a broader regulatory framework forremittance service providers in the sending country is associated with lowerremittance prices, especially among banks.
Several factors were not found to be consistently correlated with remittanceprices, In particular, exchange rate stability, capital controls, and financial lit-eracy. However, this might be due to the use of imperfect variables to capturethese policies.
While this article offers some interesting findings on an important topic, it isonly a first exploration into what drives remittance prices. Future researchshould be able to exploit panel variation to get deeper into the issues, whilealso addressing some of the limitations of the data and analysis.
RE F E R E N C E S
Adams, Richard H. 2005. “Remittances and Poverty and Investment in Guatemala.” In International
Migration, Remittances and the Brain Drain, ed. M. Schiff, and C. Ozden. Washington DC:
World Bank.
Adams, Richard H., and John Page. 2003. “International Migration, Remittances and Poverty in
Developing Countries.” Policy Research Working Paper 3179. World Bank, Washington DC.
Aggarwal, Reena, Asli Demirguc-Kunt, and Marıa Soledad Martınez Perıa. Forthcoming. “Do Workers’
Remittances Promote Financial Development?” Journal of Development Economics.
Aycinena, Diego, Claudia Martinez, and Dean Yang. 2009. “The Impact of Remittance Fees on
Remittance Flows: Evidence from a Field Experiment among Salvadoran Migrants.” Department of
Economics, University of Michigan, Ann Arbor.
Barro, Robert J., and Jong-Wha Lee. 2001. “International Data on Educational Attainment: Updates
and Implications.” Oxford Economic Papers 53 (3): 541–63.
Beck, Thorsten. 2007. “Efficiency in Financial Intermediation: Theory and Empirical Measurement.” In
Bernd Balkenhol, ed., Microfinance and Public Policy: Outreach, Performance and Efficiency,
New York, Palgrave, MacMillan.
Beck, Thorsten, Asli Demirguc-Kunt, and Marıa Soledad Martınez Perıa. 2007. “Reaching Out: Access
to and Use of Banking Services across Countries.” Journal of Financial Economics 85: 234–66.
———. 2008. “Banking Services for Everyone? Barriers to Bank Access and Use around the World”.
World Bank Economic Review 22 (3): 397–430.
Bikker, Jacob A., and Katharina Haaf. 2002. “Competition, Concentration, and Their Relationship: An
Empirical Analysis of the Banking Industry.” Journal of Banking and Finance 26 (11): 2191–214.
Bureau van Dijk. 2009. Bankscope Database. www.bvdinfo.com/ProductsContainer/Bankscope.aspx.
CEPII (French Research Center in International Economics). 2010. Distances database. CEPII, Paris.
http://www.cepii.fr/anglaisgraph/bdd/bdd.htm.
Claessens, Stijn, and Luc Laeven. 2004. “What Drives Bank Competition? Some International
Evidence.” Journal of Money, Credit, and Banking 36 (3): 562–83.
Cox-Edwards, Alejandra, and Manuelita Ureta. 2003. “International Migration, Remittances, and
Schooling: Evidence from El Salvador.” Journal of Development Economics 72 (2): 429–61.
Demirguc-Kunt, Asli, Luc Laeven, and Ross Levine. 2004. “Regulations, Market Structure, Institutions,
and the Cost of Financial Intermediation.” Journal of Money, Credit, and Banking 36 (3): 593–622.
Thorsten Beck and Marıa Soledad Martınez Perıa 129
at International Monetary F
und on August 12, 2011
wber.oxfordjournals.org
Dow
nloaded from

Duryea, Suzanne, Ernesto Lopez Cordova, and Alexandra Olmedo. 2005. “Migrant Remittances and
Infant Mortality: Evidence from Mexico.” Inter-American Development Bank, Washington, DC.
Freund, Caroline L., and Nikola Spatafora. 2008. “Remittances, Transaction Costs, Determinants, and
Informality.” Journal of Development Economics 86 (2): 356–66.
Gelos, R. Gaston, and Jorge Roldos. 2004. “Consolidation and Market Structure in Emerging Banking
Systems.” Emerging Markets Review 5 (1): 39–59.
Gibson, John, David J. McKenzie, and Halahingano Rohorua. 2006. “How Cost Elastic Are
Remittances? Evidence from Tongan Migrants in New Zealand.” Pacific Economic Bulletin 21 (1):
112–28.
Hanson, Gordon H., and Christopher Woodruff. 2003. “Emigration and Educational Attainment in
Mexico.” School of International Relations and Pacific Studies, University of California, San Diego.
Mimeo.
Harrison, Paul, Oren Sussman, and Joseph Zeira. 1999. “Finance and Growth: Theory and New
Evidence.” Finance and Economics Discussion Series, FEDS Working Paper 99-35. Federal Reserve
Board, Washington, DC.
Hildebrandt, Nicole, and David McKenzie. 2005. “The Effects of Migration on Child Health in
Mexico.” Economia 6 (1): 257–89.
IMF (International Monetary Fund). 2005. World Economic Outlook 2005. Washington, DC: IMF.
———. 2007. Annual Report on Exchange Arrangements and Restrictions. Washington, DC: IMF.
———. 2009. Direction of Trade database. DOT Online. IMF, Washington, DC. http://www2.
imfstatistics.org/DOT/help/DOThelp.htm.
Kanaiaupuni, Shawn Malia, and Katharine M. Donato. 1999. “Migradollars and Mortality: The Effects
of Migration on Infant Survival in Mexico.” Demography 36 (3): 339–53.
Laeven, Luc, and Giovanni Majnoni. 2005. “Does Judicial Efficiency Lower the Cost of Credit?”
Journal of Banking and Finance 29 (7): 1791–812.
Levy-Yeyati, Eduardo, and Alejandro Micco. 2007. Concentration and Foreign Penetration in Latin
American Banking Sectors: Impact on Competition and Risk. Journal of Banking and Finance 31
(6): 1633–47.
Lopez Cordova, Ernesto. 2005. “Globalization, Migration, and Development: The Role of Mexican
Migrant Remittances.” Economia 6: 217–49.
Maimbo, Samuel Munzele, and Dilip Ratha. 2005. Remittances: Development Impact and Future
Prospects. Washington, D.C.: World Bank.
Massey, D., and E. Parrado. 1998. “International Migration and Business Formation in Mexico.” Social
Science Quarterly 79: 1–20.
OECD (Organisation for Economic Co-operation and Development). 2010. Database on Immigrants
and Expatriates. OECD, Paris. http://stats.oecd.org/Index.aspx?lang=en#.
Orozco, Manuel. 2006. “International Flows of Remittances: Cost, Competition and Financial Access
in Latin America and the Caribbean—Toward an Industry Scorecard.” Inter-American Dialogue,
Washington, DC.
Panzar, John C., and James N. Rosse. 1982. “Structure, Conduct, and Comparative Statistics.”
Economic Discussion Paper 248. Bell Laboratories, Murray Hill, NJ.
———. 1987. “Testing for ‘Monopoly’ Equilibrium.” The Journal of Industrial Economics 35 (4):
443–56.
Parsons, Christopher, Ronald Skeldon, Terrie Lousie Walmsley, and L. Alan Winters. 2007.
“Quantifying International Migration: A Database of Bilateral Migrant Stocks.” Policy Research
Working Paper 4165. World Bank, Washington, DC.
Ratha, Dilip, and Jan Riedberg. 2005. “On Reducing Remittance Costs.” Development Prospects
Group. World Bank, Washington, DC.
Ratha, Dilip, and William Shaw. 2007. South–South Migration and Remittances. World Bank Working
Paper 102. Washington, DC: World Bank. http://go.worldbank.org/U4RXL56V20.
130 T H E W O R L D B A N K E C O N O M I C R E V I E W
at International Monetary F
und on August 12, 2011
wber.oxfordjournals.org
Dow
nloaded from

Taylor, J. Edward, Jorge Mora, Richard Adams, and Alejandro Lopez-Feldman. 2005. “Remittances,
Inequality, and Poverty: Evidence from Rural Mexico.” Working Paper 05-003. Department of
Agricultural and Resource Economics, University of California, Davis.
Woodruff, Christopher, and Rene Zenteno. 2007. “Migration Networks and Microenterprises in
Mexico.” Journal of Development Economics 82 (2): 509–28.
World Bank. 2007. Data on Access to Financial Services. World Bank, Washington, DC. http://econ.
worldbank.org/WBSITE/EXTERNAL/EXTDEC/EXTRESEARCH/0,,contentMDK:21546633�page
PK:64214825�piPK:64214943�theSitePK:469382,00.html
———. 2008. Payment Systems Worldwide, a Snapshot: Outcomes of the Global Payment
Systems Survey 2008. Washington, DC: World Bank. http://siteresources.worldbank.org/
INTPAYMENTREMMITTANCE/Resources/Global_Survey_Book.pdf
———. 2009a. Migration and Remittances Website. http://go.worldbank.org/SSW3DDNLQ0.
———. 2009b. Remittance Prices Worldwide database. World Bank, Washington, DC. http://
remittanceprices.worldbank.org.
———. 2009c. World Development Indicators database. World Bank, Washington, DC. http://data.
worldbank.org/data-catalog/world-development-indicators.
Yang, Dean. 2008. “International Migration, Remittances, and Household Investment: Evidence from
Philippine Migrants’ Exchange Rate Shocks.” Economic Journal 118 (528): 591–630.
A P P E N D I X : O B T A I N I N G T H E P A N Z A R A N D R O S S E ( 1 9 8 7 )H - S T A T I S T I C
Based on the Panzar and Rosse (1987) methodology and following the empiri-cal strategy pursued by Classes and Laeven (2004), the H-statistic is obtainedby estimating equation (A1):
LnðPitÞ ¼ ai þ b1 lnðW1;itÞ þ b2 lnðW2;itÞ þ b3 lnðW3;itÞ þ g lnðZ;itÞþ dDþ eit
ðA1Þ
where P is the ratio of gross interest revenues to total assets (proxy for banks’output price); W1 is the ratio of interest expenses to total deposits and moneymarket funding (proxy for input price of deposits); W2 is the ratio of personnelexpenses to total assets (proxy for input price of labor); W3 is the ratio ofother operating and administrative expenses to total assets (proxy for inputprice of equipment/fixed capital); Z is a matrix of controls including the ratioof equity to total assets, the ratio of net loans to total assets, and the logarithmof assets; D is a matrix of year dummies; ai denotes bank-level fixed effects; idenotes banks; and t denotes years. Annual balance sheet and income state-ments from Bureau van Dijk’s Bankscope database (Bureau van Dijk 2009)were used to calculate the H-statistic for each sending and receiving countrybanking sector during 1994–2006.
The H-statistic equals b1 þ b2 þ b3, the sum of the input price elasticities oftotal revenues. Conceptually, the statistic measures the responsiveness of bankrevenues to input prices. An H-statistic less than or equal to 0 is a sign of amonopoly, H equal to 1 indicates perfect competition, and H between 0 and 1indicates monopolistic competition.
Thorsten Beck and Marıa Soledad Martınez Perıa 131
at International Monetary F
und on August 12, 2011
wber.oxfordjournals.org
Dow
nloaded from

Remittances and the Brain Drain Revisited: TheMicrodata Show That More Educated Migrants
Remit More
Albert Bollard, David McKenzie, Melanie Morten, andHillel Rapoport
Two of the most salient trends in migration and development over the last two decadesare the large rise in remittances and in the flow of skilled migrants. However, recent lit-erature based on cross-country regressions has claimed that more educated migrantsremit less, leading to concerns that further increases in skilled migration will impederemittance growth. Microdata from surveys of immigrants in 11 major destinationcountries are used to revisit the relationship between education and remitting behavior.The data show a mixed pattern between education and the likelihood of remitting, and astrong positive relationship between education and amount remitted (intensive margin),conditional on remitting at all (extensive margin). Combining these intensive and exten-sive margins yields an overall positive effect of education on the amount remitted for thepooled sample, with heterogeneous results across destinations. The microdata allowinvestigation of why the more educated remit more, showing that the higher incomeearned by migrants, rather than family characteristics, explains much of the higher remit-tances. remittances, migration, brain drain, education JEL codes: O15, F22, J61
Two of the most salient trends in migration and development over the last twodecades are the large rise in remittances and in the flow of skilled migrants.Officially recorded remittances to developing countries have more than tripledover the last decade, rising from $85 billion in 2000 to $305 billion in 2008
Albert Bollard ([email protected]) is a PhD student at Stanford University. David McKenzie
([email protected]; corresponding author) is a senior economist in the Finance and Private
Sector Research Unit of the Development Research Group at the World Bank. Melanie Morten
([email protected]) is a PhD student at Yale University. Hillel Rapoport ([email protected]) is
professor of economics at Bar Ilan University and at EQUIPPE, University of Lille and is currently a
visiting research fellow at the Center for International Development at Harvard University. The authors
are grateful for funding for this project from the Agence Francaise de Developpement (AFD). They
thank all the individuals and organizations that graciously shared their surveys of immigrants, and they
are grateful to Michael Clemens, participants at the 2nd Migration and Development Conference held at
the World Bank in September 2009, three anonymous referees, and the journal editor for helpful
comments. All opinions are those of the authors and do not necessarily represent those of AFD or the
World Bank. A supplemental appendix to this article is available at http://wber.oxfordjournals.org.
THE WORLD BANK ECONOMIC REVIEW, VOL. 25, NO. 1, pp. 132–156 doi:10.1093/wber/lhr013Advance Access Publication May 12, 2011# The Author 2011. Published by Oxford University Press on behalf of the International Bankfor Reconstruction and Development / THE WORLD BANK. All rights reserved. For permissions,please e-mail: [email protected]
132
at International Monetary F
und on August 12, 2011
wber.oxfordjournals.org
Dow
nloaded from
(World Bank 2008, 2009). The number of highly educated migrants fromdeveloping countries residing in Organisation for Economic Co-operation andDevelopment (OECD) countries doubled over 1990–2000 (Docquier andMarfouk 2005) and likely has grown since then as developed countries haveincreasingly pursued skill-selective immigration policies.1
However, despite this positive association at the global level between risingremittances and rising high-skill migration, there are concerns—stemming fromthe belief that more educated individuals may remit less—that increasinglyskill-selective immigration policies may slow or even end the rise in remit-tances. This belief is taken as fact by many; for example, an OECD (2007,p. 11) report says that “low skilled migrants tend to send more money home.”The main empirical evidence to support this assertion across a range ofcountries comes from two recent studies (Faini 2007; Niimi, Ozden, and Schiffforthcoming) whose cross-country macroeconomic analyses find that the highlyskilled (defined as those with tertiary education) remit less.
Yet there are many reasons to question the results of these cross-country esti-mations. Both studies relate the amount of remittances received at a countrylevel to the share of migrants with tertiary education, at best telling us whethercountries that send a larger share of highly skilled migrants receive less or morein remittances than countries that send fewer skilled migrants. The studies donot answer the factual question of whether more educated migrants remit moreor less. There are a host of differences across countries that could cause a spur-ious relationship to appear between remittances and skill level across countries.For example, if poverty is a constraint to both migration and education, richerdeveloping countries might be able to send more migrants (yielding moreremittances) and those migrants might also have more schooling. Faini (2007)treats the share of migrants who are skilled as exogenous. Niimi, Ozden, andSchiff (forthcoming) try to instrument for the education mix of migrants, buttheir instruments seem unlikely to satisfy the exclusion restrictions. Forexample, public spending on education is likely a function of a country’soverall institutional and economic development, which should independentlyaffect the incentive to remit; migrants might send money to overcome poorpublic spending or for investment when complementary infrastructure andinstitutions are in place.
This article revisits the relationship between remittances and education levelusing microdata that permit computing the association between a migrant’seducation level and remitting behavior. The authors assembled the most com-prehensive micro-level database on remitting behavior currently available, com-prising data on 33,000 immigrants from developing countries from 14 surveys
1. In contrast, the number of low-skill migrants (primary education or less) increased only 15
percent over the period. Immigration to OECD countries (as defined by the number of foreign born)
was estimated at 90 million in 2000, about half of total world migration. Of the 90 million immigrants,
60 million were ages 25 or older and were split equally across education categories (primary, secondary,
and tertiary; Docquier and Marfouk 2005).
Bollard, McKenzie, Morten, and Rapoport 133
at International Monetary F
und on August 12, 2011
wber.oxfordjournals.org
Dow
nloaded from

in 11 OECD destination countries. The analysis begins by establishing thefactual relationship between the propensity to remit and education. No attemptis made to estimate the causal impact of education on remittances.2 From apolicy perspective, the concern is whether migration policies that shift the edu-cation composition of migrants affect remittances, not whether education pol-icies that change how much education individuals have affects remittances.Microdata enables asking whether more educated individuals are more or lesslikely to remit (the extensive margin) and whether they send more or less remit-tances if they do remit (the intensive margin). A mixed association is foundbetween education and remittances at the extensive margin, and a strong posi-tive relationship at the intensive margin. Combining both the extensive andintensive margins reveals that, at least in this large sample, more educatedmigrants do remit significantly more—migrants with a university degree remit$300 more yearly than migrants without a university degree, where the meanannual remittance over the entire sample is $730.
The article is organized as follows. Section I summarizes several theories ofremitting behavior and the predictions they give for the relationship betweeneducation and remittances. Section II then describes the dataset of immigrantsurveys with remittances. Section III provides results, and section IV drawssome implications.
I . T H E O R E T I C A L B A C K G R O U N D
Theoretically, there are several reasons to believe that there will be differencesin the remitting patterns of highly skilled and less-skilled emigrants. However,a priori, it is not clear which direction will dominate and thus whether thehighly skilled will remit more or less on average. On the one hand, severalfactors tend to lead highly skilled migrants to be more likely to remit and tosend a larger amount of remittances. First, highly skilled individuals are likelyto earn more as migrants, potentially increasing the amount they can remit.Second, their education may have been funded by family members in the homecountry, with remittances serving as repayment. Third, skilled migrants are lesslikely to be illegal migrants and more likely to have bank accounts, loweringthe financial transaction costs of remitting. On the other hand, several otherfactors might lead highly skilled migrants to be less likely to remit and to remitless. First, highly skilled migrants may be more likely to migrate with theirentire household, so they would not have to send remittances in order to sharetheir earnings with their household. Second, they might come from richerhouseholds, which have less need for remittances to alleviate liquidity con-straints. Third, they might have less intention of returning to their homecountry, reducing the role of remittances as a way of maintaining prestige andties to the home community.
2. Convincing instruments are lacking to identify this impact.
134 T H E W O R L D B A N K E C O N O M I C R E V I E W
at International Monetary F
und on August 12, 2011
wber.oxfordjournals.org
Dow
nloaded from

Before turning to the empirical analysis, it is useful to clarify the theoreticalrelationship between education and remittances and the implied testable predic-tions about education. This will allow identifying the role of several variablesthat, once interacted with education and various possible motivations to remit,have the potential to explain differences in remitting behavior by educationlevel. The discussion is limited to three possible motives for remittances: altru-ism, exchange, and investment. These were selected for general empirical rel-evance and as the motives through which education is most likely to affectremittances.3
Altruism
Altruistic preferences are generally captured by weighting one’s own (themigrant’s) and others’ (relatives) consumption in an individual utility function,with weights reflecting the individual’s degree of altruism, which can itselfdepend on the closeness among the relatives considered (both family and geo-graphic proximity). For given weights and initial distribution of income,altruistic individuals maximize their utility by transferring (remitting) incomeso as to reach the desired distribution between themselves and the beneficiariesof their altruism. Altruistic transfers take place if pretransfer income differencesare sufficiently large or altruism is strong enough and increases with thedonor’s income (the extensive margin) and decreases with the recipients’income (the intensive margin)
What does this basic theoretical framework imply for the comparative remit-ting behavior of highly educated and less well educated migrants? First, edu-cated migrants tend to earn more, which all else equal should induce moreremittances (at both margins). Second, the conventional wisdom is that edu-cated migrants tend to have more family members with them because of ahigher propensity to move with their immediate family, which all else equalshould lower remittances.4 Methodologically, this suggests that the locationand composition of the family (which fraction of the family accompanies themigrant and which fraction stays in the country of origin) is jointly determinedwith remittances. This makes it difficult to estimate the causal impact of familycomposition on remittances. Instead, the analysis simply looks at whetherdifferences in remitting patterns by education level disappear when they areconditioned on family composition. Empirically, the analysis will show thatwhile less educated migrants have more relatives in the home country, they alsohave larger households and more relatives with them in the destinationcountry.
3. See Rapoport and Docquier (2006) for a comprehensive survey of the economic literature on
migrants’ remittances.
4. In this basic framework, education has no impact beyond its effect on the migrants’ income and
family size, composition, and location, and altruistic preferences are independent of education.
Bollard, McKenzie, Morten, and Rapoport 135
at International Monetary F
und on August 12, 2011
wber.oxfordjournals.org
Dow
nloaded from

Exchange and Investment Motives
There are many situations of Pareto-improving exchanges in which remittances“buy” various types of services, such as taking care of the migrant’s assets (landand cattle, for example) or relatives (children, elderly parents) at home. Suchmotivations are generally a sign of temporary migration and signal a migrant’sintention to return. In such exchanges, there is a participation constraint deter-mined by each partner’s external options, with the exact division of the pie(or surplus) to be shared depending on each partner’s bargaining power.
How does education interact with such exchange motives? Two directionsemerge from the short discussion above: one through the effect of education onintentions to return, and another through education’s effect on threat pointsand bargaining powers.
The conventional wisdom is that migrants with higher education have lessintention (and propensity) to return than do migrants with lower education (seeFaini 2007), because they are better integrated or can obtain permanent residentstatus more easily. If that is the case, more educated migrants should transfer lessfor an exchange motive, reflecting their lower propensity to return.5 What aboutbargaining powers? Exchange models allow for different possible contractualarrangements reflecting the parties’ outside options and bargaining powers (see,for example, Cox 1987; Cox, Eser, and Jimenez 1998). This has two complemen-tary implications for education as a determinant of remittances in an exchangemodel. First, to the extent that education is associated with higher income, thisrelationship is likely to increase a migrant’s willingness to pay, leading to higherremittances; and second, to the extent that educated migrants come from moreaffluent families, this relationship is likely to increase the receiving household’sbargaining power, also leading to higher remittances. On the whole, an exchangemotive therefore predicts that education will have an ambiguous effect on remit-tances, with the sign of the effect depending on whether return intentions orbargaining issues matter more to remittance behavior.
The investment motive can be seen as a particular exchange of services in acontext of imperfect credit markets. In such a context, remittances can be seenas part of an implicit migration contract between migrant and family, allowingthe family access to higher income (investment motive) or less volatile income(insurance motive; Stark 1991). Since the insurance motive does not in theorygive rise to clear differences in transfer behavior between highly educated andless educated migrants, the focus here is on the investment motive. The amountof investment financed by the family may include the physical costs (such astransportation) and informational costs of migration, as well as educationexpenditures, and repayment of this implicit loan through remittances isobviously expected to depend on the magnitude of the loan. Thus, the
5. Again, as shown later in the article, this conventional wisdom is not supported by the data;
exchange motives are equally relevant for highly educated and less educated migrants as far as return
intentions are concerned.
136 T H E W O R L D B A N K E C O N O M I C R E V I E W
at International Monetary F
und on August 12, 2011
wber.oxfordjournals.org
Dow
nloaded from

investment motive clearly predicts that, all else equal, more educated migrantsshould remit more to compensate the family for the additional educationexpenditures incurred.
Summary of Predictions
Both the altruistic and the exchange motives for remittances yield uncleartheoretical predictions as to whether more educated migrants remit more orless than do less education migrants. Once migrants’ incomes are controlledfor, their education level should not play a role under the altruistic hypoth-esis (assuming preferences are exogenous to education) except for its effecton the spatial distribution of the family. As already noted, the conventionalwisdom here is that the highly educated tend to move with their immediatefamily, which would lower remittances. Similarly, education is expected tolower remittances under the exchange hypothesis if educated migrants havelower propensities to return; bargaining mechanisms work in the otherdirection and should translate into higher remittances, with the sign of thetotal expected effect being theoretically uncertain. Finally, education islikely to have a clear positive impact on remittances under the investmenthypothesis.
Given these expected mechanisms and the fact that the descriptive statisticsfor the sample do not support the conjecture that more educated migrants havea substantially higher propensity to move with their family or a substantiallylower propensity to return, the other forces at work should be expected todominate, so that migrants with more education would remit more, which isindeed what the analysis shows.
I I . D A T A
The micro-level database on remitting behavior created for this study is the mostcomprehensive available, comprising data on 33,000 immigrants from develop-ing countries derived from 14 surveys in 11 OECD destination countries thatwere the destination for 79 percent of global migrants to OECD countries in2000 (Docquier and Marfouk 2005). The focus on destination country datasources enables looking directly at the relationship between education and remit-tance sending behavior by analyzing the migrants’ decision to remit. It alsopermits capturing the remittance behavior of individuals who emigrate withtheir entire household; using household surveys from the remittance receivingcountries would typically miss such individuals. Since more educated individualsare believed to be more likely to emigrate with their entire household thanless educated individuals (Faini 2007), using surveys from migrant sendingcountries would not be appropriate for examining the relationship betweenremittances and education.
Most of the empirical literature on immigrants uses data from censuses orlabor force surveys, but neither contains information on remittances. That
Bollard, McKenzie, Morten, and Rapoport 137
at International Monetary F
und on August 12, 2011
wber.oxfordjournals.org
Dow
nloaded from

requires special purpose surveys of immigrants. The authors pulled together allpublicly available datasets they were aware of6 and six additional surveys thatare not publicly available but that other researchers generously shared. Table 1provides an overview of the database of migrants, summarizing the datasets,sample population, and survey methodology. Full details of the source of eachdataset are in the supplemental appendix, available online at http://wber.oxfordjournals.org/. The database covers a wide range of populations. Itincludes both nationally representative surveys, such as the New ImmigrantSurvey (NIS) in the United States (drawn from green card recipients) and theSpanish National Survey of Immigrants (ENI), which draws on a neighborhoodsampling frame, as well as surveys focusing on specific migrant communitieswithin the recipient country, such as the Black/Minority Ethnic Survey (BME)in the United Kingdom and the Belgium International Remittance SendersHousehold Survey (IRSHS) of immigrants from the Democratic Republic ofCongo, Nigeria, and Senegal. In all cases, the database includes only migrantswho were born in developing countries.7
For each country dataset, comparable covariates were constructed tomeasure household income, remittance behavior, family composition, anddemographic characteristics. Remittances are typically measured at the house-hold rather than individual level. The level of analysis is therefore the house-hold, and variables are defined at this level whenever possible—for example,by taking the highest level of schooling achieved by any adult migrant in thehousehold. All financial values are reported in 2003 U.S. dollars. In addition,any reported annual remittances that are more than twice annual householdincome are dropped. While remittance data in surveys can be subject tomeasurement error, the use of survey fixed effects will capture any commonsurvey-level effects, and there is no strong reason to believe such measurementerror would be correlated with education status. Mean and median reportedremittances also seem to be of the right order of magnitude when comparedwith other surveys and migrant incomes.
The sample weights provided with the data are always used. Data are pooledby poststratifying by country of birth and by education, so that the combinedweighted observations match the distribution of developing country migrantsto all OECD countries in 2000 (Docquier and Marfouk2005). The supplemen-tal appendix provides further details.
Table 2 presents summary statistics for each country survey and the pooledsamples of all destination countries. Overall, 37 percent of migrants in thedatabase have completed a university degree, ranging from 4 percent in theSpanish Netherlands Interdisciplinary Demographic Institute (NIDI) survey to
6. Exceptions include longitudinal surveys of immigrants from Canada and New Zealand, which
can only be accessed through datalabs in these countries, and so are not included here.
7. High income countries are defined based on the World Bank Country Classification Code, April
2009.
138 T H E W O R L D B A N K E C O N O M I C R E V I E W
at International Monetary F
und on August 12, 2011
wber.oxfordjournals.org
Dow
nloaded from

TA
BL
E1
.M
igra
nt
Dat
ase
ts
Dat
ase
tN
am
eY
ear
Num
ber
of
obse
rvat
ionsa
Popula
tion
Met
hodolo
gy
Aust
ralia
LSIA
Longit
udin
al
Surv
eyof
Imm
igra
nts
toA
ust
rali
a1997
2,5
37
Pri
mary
applica
nt
mig
rant
arr
ivals
Sep
tem
ber
1993
–A
ugust
1995
Sam
ple
of
offi
cial
reco
rds
of
those
livin
gin
citi
esB
elgiu
mIR
SH
SIn
tern
atio
nal
Rem
itta
nce
Sen
der
sH
ouse
hold
Surv
ey2005
377
Imm
igra
nts
from
DR
Congo,
Nig
eria
,and
Sen
egal
Ref
erra
lsth
rough
Em
bass
ies.
Fra
nce
2M
OSurv
eyof
House
hold
s’T
ransf
erof
Funds
toth
eir
Countr
ies
of
Ori
gin
2007
713
Rem
itte
rsto
Alg
eria
,M
oro
cco,
Tunis
ia,
Turk
eyand
the
countr
ies
of
Sub-S
ahar
an
Afr
ica
Inte
rvie
ws
of
rem
itte
rsat
post
offi
ces
inhig
h-m
igra
nt
regio
ns
Fra
nce
DR
EE
SPro
file
and
Tra
ckin
gof
Mig
rants
Surv
ey2006
4,2
78
New
and
regula
rize
dm
igra
nts
wit
h1þ
year
resi
den
ceper
mit
sSam
ple
of
offi
cial
reco
rds
Ger
many
SO
EP
Ger
man
Soci
o-E
conom
icPanel
Stu
dy
2000
854
Res
iden
tpopula
tion
of
the
Fed
eral
Rep
ublic
of
Ger
many
in1984.
Sam
ple
of
offi
cial
reco
rds
Italy
NID
IN
ether
lands
Inte
rdis
cipli
nary
Dem
ogra
phic
Inst
itute
Inte
rnat
ional
Mig
rati
on
Surv
ey
1997
1,0
72
Egypti
ans
and
Ghanaia
ns
who
imm
igra
ted
wit
hin
past
10
years
Inte
rvie
ws
atm
igra
nt
mee
ting
pla
ces
Japan
IDB
Surv
eyof
Bra
zili
ans
and
Per
uvia
ns
inJa
pan
2005
846
Lat
inA
mer
ican
imm
igra
nt
adult
slivin
gin
Japan
Inte
rvie
ws
in15
citi
es
Net
her
lands
CSR
Consu
men
tenbond
Surv
eyof
Rem
itta
nce
s2005
648
Majo
rim
mig
rant
popula
tions:
Moro
ccans,
Turk
s,Suri
nam
ese,
Anti
llea
ns,
Som
alis,
and
Ghanaia
ns
Fac
e-to
-fac
ein
terv
iew
s
Norw
ayL
KI
Liv
ing
Condit
ions
of
Imm
igra
nts
Surv
ey1996
2,4
66
Imm
igra
nts
from
10
countr
ies:
Bosn
iaand
Her
zegovin
a,
Chile,
Iraq,
Iran,
Pakis
tan,
Ser
bia
,Som
alia,
Sri
Lanka,
Turk
ey,
and
Vie
tnam
Rep
rese
nta
tive
surv
eyof
imm
igra
nt
popula
tion
from
thes
eco
untr
ies
Spain
EN
IN
atio
nal
Surv
eyof
Imm
igra
nts
2006
9,2
34
Fore
ign-b
orn
who
(inte
nd
to)
live
inSpain
for
1þ
years
Sam
ple
of
offi
cial
nei
ghborh
ood
rost
ers
(Conti
nued
)
Bollard, McKenzie, Morten, and Rapoport 139
at International Monetary F
und on August 12, 2011
wber.oxfordjournals.org
Dow
nloaded from

TA
BL
E1.
Conti
nued
Dat
ase
tN
am
eY
ear
Num
ber
of
obse
rvat
ionsa
Popula
tion
Met
hodolo
gy
Spain
NID
IN
ether
lands
Inte
rdis
cipli
nary
Dem
ogra
phic
Inst
itute
Inte
rnat
ional
Mig
rati
on
Surv
ey
1997
1,0
20
Moro
ccans
and
Sen
egale
sew
ho
imm
igra
ted
wit
hin
past
10
years
Geo
gra
phic
al
sam
pling,
&re
fere
nce
sfr
om
sam
ple
d
UK
BM
EB
lack
/Min
ori
tyE
thnic
Rem
itta
nce
Surv
ey2006
993
Mig
rant
min
ori
ties
who
hav
ere
mit
ted
inpast
12
month
sSam
pling
of
geo
gra
phic
al
blo
cks
U.S
.N
ISN
ewIm
mig
rant
Surv
ey2003
7,0
46
Mig
rants
rece
ivin
ggre
enca
rds
May
–N
ove
mber
1993
Sam
ple
of
offi
cial
reco
rds
Pew
Nat
ional
Surv
eyof
Lat
inos
2006
1084
Nat
ionally
repre
senta
tive
sam
ple
of
Lat
ino
resp
onden
tsages
18
and
old
er
Sam
ple
dphone
num
ber
sin
hig
h-L
atin
oare
as
U.S
.Pew
Pew
Nat
ional
Surv
eyof
Lat
inos
2006
1,0
84
Nat
ionally
repre
senta
tive
sam
ple
of
Lat
ino
resp
onden
tsages
18
and
old
er
Sam
ple
dphone
num
ber
sin
hig
h-L
atin
oare
as
Note
:N
um
ber
of
obse
rvat
ions
use
dto
calc
ula
teth
efirs
tre
sult
inea
chco
lum
nof
table
2.
140 T H E W O R L D B A N K E C O N O M I C R E V I E W
at International Monetary F
und on August 12, 2011
wber.oxfordjournals.org
Dow
nloaded from

TA
BL
E2
.Surv
eyM
eans,
by
Educa
tion
Aust
rali
aB
elgiu
mFra
nce
Fra
nce
Ger
many
Italy
Japan
Net
her
lands
Norw
aySpain
Spain
UK
U.S
.U
.S.
Poole
dPoole
dPoole
d
Vari
able
and
educa
tion
leve
lL
SIA
IRSH
S2M
OD
RE
ES
SO
EP
NID
IID
BC
SR
LB
IE
NI
NID
IB
ME
NIS
Pew
Exte
nsi
veIn
tensi
veT
ota
l
Num
ber
of
obse
rvat
ions
2,6
56
451
717
4,2
80
900
1,1
53
1,0
65
836
2,4
66
10,2
82
1,1
13
1,1
52
7,3
52
1,3
04
33,0
22
28,9
81
26,2
76
Fra
ctio
nw
ith
univ
ersi
tyed
uca
tion
0.3
20.5
90.0
70.1
80.2
00.2
10.1
40.1
10.1
20.2
30.0
40.2
00.3
40.0
60.3
60.3
70.3
7
Tota
lre
mit
tance
s($
per
year)
No
univ
ersi
ty286
1,6
81
1,3
80
368
2,7
24
2,6
62
993
988
3,0
99
2,6
91
375
1,5
30
699
793
650
Univ
ersi
ty379
2,4
75*
1,6
52
511
2,2
27
2,9
20
1,4
05*
743**
2,8
35
2,6
29
1,1
45**
671**
868
897
874
Fra
ctio
nw
ho
rem
it
No
univ
ersi
ty0.4
10.9
10.2
30.1
80.6
00.8
00.3
40.4
90.7
80.1
50.5
40.3
10.3
20.3
2
Univ
ersi
ty0.3
70.8
60.2
30.2
00.4
5**
0.9
0**
0.2
90.3
7**
0.4
8**
0.1
70.4
30.2
7**
0.2
7**
0.2
7**
Log
rem
itta
nce
s
No
univ
ersi
ty5.7
86.9
26.6
26.9
77.8
97.7
66.4
97.1
57.9
96.7
77.0
17.3
46.9
66.8
26.9
1
Univ
ersi
ty6.2
3**
7.2
9**
6.9
27.0
18.1
17.7
06.8
1**
7.2
28.4
9*
6.9
27.4
0**
6.9
77.0
26.9
7*
7.0
0
House
hold
inco
me
($per
year)
No
univ
ersi
ty14,4
57
16,9
18
23,1
73
18,6
12
19,5
26
10,9
03
34,0
14
32,4
67
14,0
66
9,0
74
44,6
31
33,2
97
22,4
17
22,6
24
23,5
83
21,9
64
Univ
ersi
ty13,5
56
25,5
34**
31,3
01*
28,6
74**
21,9
84
13,3
02*
43,6
24**
41,9
95**
19,9
14**
10,1
68
50,5
65
61,0
84
34,7
29**
38,9
48**
38,6
69**
39,0
87**
Log
inco
me
No
univ
ersi
ty9.5
9.5
9.8
9.6
9.8
9.3
10.2
10.1
9.4
9.0
10.3
9.2
9.7
9.6
9.5
9.5
Univ
ersi
ty9.8
**
9.8
**
10.0
9.9
**
9.8
9.4
10.4
10.3
**
9.7
**
9.2
10.4
10.0
**
10.2
**
9.9
**
9.9
**
9.9
**
Work
ing
No
univ
ersi
ty0.4
80.7
00.8
70.8
00.6
30.8
20.9
30.4
80.6
80.8
10.8
20.6
60.6
60.6
50.6
60.6
4
Univ
ersi
ty0.6
7**
0.7
40.8
60.8
6**
0.6
70.8
70.9
30.7
0**
0.7
3**
0.6
60.9
0**
0.7
8**
0.7
7*
0.7
5**
0.7
4**
0.7
3**
House
hold
size
No
univ
ersi
ty3.8
11.8
82.5
12.9
01.8
01.5
33.8
21.8
43.3
34.1
03.4
43.7
33.7
6
Univ
ersi
ty3.4
4**
2.5
5**
1.9
0**
2.5
82.1
6**
1.7
6**
3.1
9**
1.9
53.0
4*
3.4
9**
3.1
7**
3.3
5**
3.3
6**
Marr
ied
No
univ
ersi
ty0.7
30.7
20.6
50.6
70.6
10.5
60.4
70.6
40.6
60.5
40.6
30.6
30.6
3
Univ
ersi
ty0.8
0**
0.5
1**
0.7
1*
0.5
90.6
00.4
8*
0.5
6**
0.5
10.8
6**
0.5
60.7
3**
0.7
4**
0.7
4**
Spouse
outs
ide
countr
y
No
univ
ersi
ty0.0
30.2
50.0
50.0
60.4
20.0
50.0
50.0
50.0
6
Univ
ersi
ty0.0
1*
0.1
90.0
1**
0.0
50.1
0**
0.0
3**
0.0
3**
0.0
3**
0.0
3**
Num
ber
of
chil
dre
n
No
univ
ersi
ty1.2
91.1
61.7
81.0
62.5
02.0
61.5
82.2
52.3
71.9
92.0
52.0
3
Univ
ersi
ty1.2
20.8
9**
1.2
7**
1.0
02.1
5**
1.8
5**
0.6
2**
1.3
5**
1.8
1**
1.3
7**
1.3
7**
1.3
7**
Chil
dre
nouts
ide
countr
y
No
univ
ersi
ty0.2
10.1
00.2
50.7
10.2
00.1
60.3
81.1
00.7
30.4
90.4
50.4
80.5
0
Univ
ersi
ty0.0
7**
0.0
60.1
7**
0.4
9*
0.1
50.0
90.2
6**
0.2
1**
0.3
1**
0.3
70.2
4**
0.2
5**
0.2
5**
Num
ber
of
pare
nts
No
univ
ersi
ty1.9
71.1
30.9
51.3
51.4
21.2
72.1
81.8
11.8
41.8
3
(Conti
nued
)
Bollard, McKenzie, Morten, and Rapoport 141
at International Monetary F
und on August 12, 2011
wber.oxfordjournals.org
Dow
nloaded from

TA
BL
E2.
Conti
nued
Aust
rali
aB
elgiu
mFra
nce
Fra
nce
Ger
many
Italy
Japan
Net
her
lands
Norw
aySpain
Spain
UK
U.S
.U
.S.
Poole
dPoole
dPoole
d
Vari
able
and
educa
tion
leve
lL
SIA
IRSH
S2M
OD
RE
ES
SO
EP
NID
IID
BC
SR
LB
IE
NI
NID
IB
ME
NIS
Pew
Exte
nsi
veIn
tensi
veT
ota
l
Univ
ersi
ty2.3
2**
1.0
30.7
0**
1.3
21.3
5**
1.3
72.7
4**
2.1
8**
2.2
1**
2.2
3**
Pare
nts
outs
ide
countr
y
No
univ
ersi
ty1.4
80.8
10.4
20.9
41.0
31.0
11.2
30.8
80.9
80.9
81.0
0
Univ
ersi
ty2.0
0**
0.8
80.5
40.6
7**
1.1
7*
1.0
41.3
31.2
6**
1.3
0**
1.3
1**
1.3
1**
Yea
rssp
ent
abro
ad
No
univ
ersi
ty3.7
09.3
217.9
04.0
019.2
06.6
98.3
518.4
610.0
67.2
714.8
97.3
516.4
39.2
011.1
710.2
9
Univ
ersi
ty3.9
1**
12.2
8**
12.7
0**
4.2
113.5
1**
7.0
29.1
819.3
612.4
1**
6.7
414.6
67.0
518.3
48.0
6**
8.7
5**
8.4
0**
Leg
al
imm
igra
nt
No
univ
ersi
ty1.0
01.0
00.8
40.5
10.6
61.0
00.8
70.8
40.8
5
Univ
ersi
ty1.0
01.0
00.8
50.3
9**
0.8
2*
1.0
00.8
5**
0.8
40.8
4
Wil
lre
turn
hom
e
No
univ
ersi
ty0.0
20.4
50.0
60.2
30.3
90.0
10.0
80.3
50.6
30.0
90.1
90.0
90.1
60.1
1
Univ
ersi
ty0.0
40.6
5**
0.1
0*
0.1
70.5
3**
0.0
20.0
80.5
10.7
00.1
3**
0.1
40.0
90.1
2**
0.0
9*
*Sig
nifi
cant
atth
e5
per
cent
leve
l**
signifi
cant
atth
e1
per
cent
leve
l
Note
:Sig
nifi
cant
resu
lts
indic
ate
that
the
mea
nof
the
vari
able
isst
atis
tica
lly
dif
fere
nt
bet
wee
nuniv
ersi
ty-e
duca
ted
and
non-u
niv
ersi
tyed
uca
ted
house
-hold
s.See
table
1fo
rfu
llsu
rvey
nam
es.
Sourc
e:A
uth
ors
’analy
sis
base
don
dat
ades
crib
edin
the
text.
142 T H E W O R L D B A N K E C O N O M I C R E V I E W
at International Monetary F
und on August 12, 2011
wber.oxfordjournals.org
Dow
nloaded from

59 percent in the Belgium IRSHS. The table also summarizes the covariates bythe maximum educational attainment of all adult migrants in the household.Altogether, including both the extensive and intensive margins, more highlyeducated migrants send home an average of $874 annually, compared with$650 for less educated migrants. There are two opposing effects of education:negative on the extensive margin, and positive on the intensive margin. At theextensive margin, migrants with a university degree are less likely to remit any-thing than migrants without a degree: 32 percent of low-skilled migrants sendsome money home, compared with 27 percent of university-educated migrants.However, conditional on remitting (the intensive margin), highly educatedmigrants send about 9 percent more than do less educated migrants.
Characteristics that can affect remittance behavior differ between less andmore educated migrants. First, more skilled migrants are both more likely tolive in a household with working adults and to have a higher householdincome than are low skilled migrants. But contrary to conventional wisdom,household composition does not differ much for migrants by education level:on average, only 6 percent of low skilled migrants have a spouse outside thecountry, compared with 3 percent of high skilled migrants. Low skilledmigrants are significantly less likely to be married (63 percent) than are highskilled migrants (74 percent). Low skilled migrants have more children(an average of 2.03 compared with 1.37 for high skilled migrants), as well asmore children living outside the destination country (0.50) than do high skilledmigrants (0.25). However, low skilled migrants also have more family insidethe destination country than do high skilled migrants: the average householdsize for low skilled migrants is 3.76 people, statistically different from themean household size of 3.36 people for high skilled migrants.8
Another piece of conventional wisdom, that more educated people are lesslikely to return home, is also not supported by the microdata. Indeed, moreeducated migrants have spent less time abroad (mean of 8.4 years) than haveless educated migrants (10.3 years). Reported plans to return home are similarbetween the two groups: 9 percent of high skilled migrants report planning toreturn home, compared with 11 percent of low skilled migrants. While oneshould be cautious with treating both measures as truly reflecting return prob-abilities; at the very least, they do not indicate a strong tendency for the lowskilled to be more likely to return.
The simple comparison of means in table 2 shows differences in remittancebehavior by education status. However, these comparisons show only thatmore educated developing country emigrants remit more than less educateddeveloping country emigrants. This risks confounding differences in remittance
8. In some cases this might reflect households in which poorer, less skilled migrants live with other
immigrants who are not family members. The database can identify the presence of a spouse, child, or
parent in the home country household but cannot identify who migrants live with abroad or the extent
to which they share resources within the household abroad.
Bollard, McKenzie, Morten, and Rapoport 143
at International Monetary F
und on August 12, 2011
wber.oxfordjournals.org
Dow
nloaded from

behavior among migrants from different countries with differences inremittance behavior by education level: the next section aims to separate thesetwo differences.
I I I . R E S U L T S : T H E R E L A T I O N S H I P B E T W E E N E D U C A T I O N A N D
R E M I T T A N C E S
Results are reported for regressions of three remittance measures on education:total remittances (both extensive and intensive margins), an indicator forhaving remitted in the previous year (extensive margin), and log total remit-tances conditional on remitting (intensive margin; table 3). All regressionsinclude country of birth fixed effects and dataset fixed effects.
The key result is that more educated migrants remit more. In the pooledsample, migrants with a university degree remit $298 more per year than non-university educated migrants (row last, last column), with a mean annual remit-tance for all migrants of $734. This overall effect is composed of a negative(statistically insignificant) effect at the extensive margin and a highly significantpositive effect at the intensive margin. The results are consistent when thesecond measure of education, years of schooling, is considered.
Results for individual countries are mixed at the extensive margin, with edu-cation significantly positively associated with the likelihood of remitting in twosurveys (the U.S. NIS and the Survey of Brazilians and Peruvians in Japan), sig-nificantly negatively associated with this likelihood in three surveys (the U.S.Pew survey and both Spanish surveys), and no significant relationship in theother six surveys, with three positive and three negative point estimates. Onegeneral observation is that a more negative relationship appears in surveys thatfocus on sampling migrants through community-sampling methods, such as theNIDI surveys, which take their sample from places where migrants cluster, andthe Pew Hispanic surveys, which randomly dial phone numbers in areas withdense Hispanic populations. One might expect that educated migrants who livein such areas (and who take the time to respond to phone or on-the-streetsurveys) would be less successful than educated migrants who live in more inte-grated neighborhoods and thus who would not be picked up in these surveys.
In contrast, at the intensive margin, 10 of 12 individual surveys show a posi-tive relationship between remittances and education, 5 of them statistically sig-nificant, and 2 show a negative and insignificant relationship. Thus it is notsurprising that when the data are pooled there is a strong positive associationat the intensive margin and that it outweighs the small negative and insignifi-cant relationship at the extensive margin in the total effect.
This point is made graphically on a log scale in figure 1, which plots thenonparametric relationship between total remittances and years of schooling,after linearly controlling for dataset fixed effects using a partial linear model(Robinson 1988), together with a 95 percent confidence interval. The verticallines demarcate the quartiles of years of schooling. Average remittances steadily
144 T H E W O R L D B A N K E C O N O M I C R E V I E W
at International Monetary F
und on August 12, 2011
wber.oxfordjournals.org
Dow
nloaded from

TA
BL
E3
:C
oef
fici
ents
from
Reg
ress
ions
of
Rem
itta
nce
Mea
sure
son
Educa
tion
Aust
rali
aB
elgiu
mFra
nce
Fra
nce
Ger
many
Italy
Japan
Net
her
lands
Norw
aySpain
Spain
UK
U.S
.U
.S.
Poole
dPoole
dPoole
d
Vari
able
LSIA
IRSH
S2M
OD
RE
ES
SO
EP
NID
IID
BC
SR
LB
IE
NI
NID
IB
ME
NIS
Pew
Exte
nsi
veIn
tensi
veT
ota
l
Educa
tion
mea
sure
dby
univ
ersi
tydeg
ree
Tota
lre
mit
tance
s($
per
year)
58.4
922.8
**
291.0
-526.6
237.5
-92.6
-168.8
769.5
**
-554.0
*298.0
*
Num
ber
of
obse
rvat
ions
2,5
37
377
854
1,0
72
846
9,2
34
1,0
20
7,0
46
1,0
84
24,0
33
Exte
nsi
ve:
Rem
its
indic
ator
20.0
19
-0.0
55
0.0
14
0.0
42
-0.0
65
0.0
91**
0.0
12
-0.0
49**
-0.2
32**
0.0
38**
-0.1
40*
-0.0
18
-0.0
10
Num
ber
of
obse
rvat
ions
2,6
54
451
4,2
78
854
1,1
53
1,0
30
2,4
66
10,2
82
1,1
12
7,1
13
1,2
96
32,6
51
25,9
07
Inte
nsi
ve:
Log
rem
itta
nce
s0.3
41*
0.4
33**
0.3
63
0.4
92
0.0
73
-0.0
57
0.3
33**
0.0
93
0.4
30*
0.1
68
0.3
97*
-0.1
99
0.2
49**
0.2
26**
Num
ber
of
obse
rvat
ions
958
317
713
184
545
690
648
3,9
66
761
993
1,1
18
514
11,3
92
9,0
38
Educa
tion
mea
sure
din
years
Tota
lre
mit
tance
s($
per
year)
19.0
8*
86.5
026.3
9-7
.56
-3.0
32.4
0-1
3.6
586.5
364.8
957.8
1
Num
ber
of
obse
rvat
ions
2,5
31
377
854
1,0
72
846
9,1
64
1,0
20
7,0
33
1,0
84
23,9
44
Exte
nsi
ve:
Rem
its
indic
ator
0.0
080
-0.0
042
0.0
018
0.0
145
0.0
010
0.0
024**
0.0
008
-0.0
023
-0.0
072**
0.0
034**
0.0
010
0.0
006
0.0
014
Num
ber
of
obse
rvat
ions
2,6
48
451
5,5
29
854
1,1
53
1,0
30
2,4
50
10,2
01
1,1
12
7,1
00
1,2
96
32,5
35
25,8
07
Inte
nsi
ve:
Log
rem
itta
nce
s0.0
441*
0.0
341
0.0
224*
-0.0
085
-0.0
032
-0.0
040
0.0
247*
0.0
199**
0.0
091
0.0
548*
0.0
329*
0.0
369
0.0
256**
0.0
229**
Num
ber
of
obse
rvat
ions
956
317
713
184
545
690
648
3,9
42
761
993
1,1
16
514
11,3
64
9,0
10
Mea
ns
Tota
lre
mit
tance
s($
per
year)
316
2,1
59
1,3
99
396
2,6
21
2,6
92
1,0
40
932
3,0
89
2,6
79
633
1,4
79
764
2,4
66
734
Fra
ctio
nw
ho
rem
it0.4
00.8
50.2
30.1
90.5
30.7
70.3
40.4
10.7
50.1
50.4
60.3
01.0
00.2
7
Fra
ctio
nw
ith
univ
ersi
ty0.3
20.6
00.0
70.1
80.2
00.2
10.1
20.1
10.1
20.2
30.0
40.2
00.3
30.0
60.3
60.3
10.3
8
Yea
rsof
educa
tion
13.4
14.2
7.7
12.0
11.5
14.1
13.3
10.7
12.2
11.4
7.5
13.4
13.4
9.4
12.9
12.3
13.0
*Sig
nifi
cant
atth
e5
per
cent
leve
l**
signifi
cant
atth
e1
per
cent
leve
lN
ote
:See
table
1fo
rfu
llsu
rvey
nam
es.
Sourc
e:A
uth
ors
’analy
sis
base
don
dat
ades
crib
edin
the
text.
Bollard, McKenzie, Morten, and Rapoport 145
at International Monetary F
und on August 12, 2011
wber.oxfordjournals.org
Dow
nloaded from

increase from around $500 in the lowest education quartile to close to $1,000for those with university degrees. Moreover, the positive association increasesmost strongly for migrants with postgraduate education, which shows that notonly do migrants with some university education remit more than thosewithout, but also that migrants with postgraduate degrees remit more thanthose with only a couple of years of university.
Robustness
Although this database on remittances is the most comprehensive available,there are clear limitations, which make it important to see how sensitive theresults are to alternative ways of using these surveys.
First note that the results pertain only to migration in a sample of OECDcountries. The surveys cover a large share of OECD destinations, but they omitother important destinations for developing country migrants such as the Gulfcountries and South Africa. This is a limitation shared by the macro studies(Faini 2007; Niimi and others 2008), which also have data only for migrantsin OECD countries. Nevertheless, the same forces acting on migrants in theOECD countries are likely to apply in these other destinations: more educatedmigrants will earn higher incomes and therefore remit more. Although data arerare, there is some evidence to support this is in a study of Pakistani migrantsin the Gulf countries, which found that conditional on age and duration of
Figure 1. Total Remittances by Years of Schooling
Note: Figure depicts a semiparametric regression line from a partial linear model with datasetdummy variable evaluated at means; 95 percent pointwise confidence intervals shown from 500bootstrap repetitions. Vertical lines separate quartiles.
Source: Authors’ analysis based on data described in the text.
146 T H E W O R L D B A N K E C O N O M I C R E V I E W
at International Monetary F
und on August 12, 2011
wber.oxfordjournals.org
Dow
nloaded from

stay, more educated Pakistani migrants remitted more (Abbasi and Hashmi2000).
Moreover, it is still the case that there are a large number of low skilledmigrants in the OECD. A large majority of migrants in the pooled sample(63 percent) do not have a university education. A reasonable concern iswhether surveys like the U.S. NIS, which capture only legal immigrants, aremissing most of the low-skilled migrants. Comparing the skill distribution ofimmigrants included in the NIS with that of immigrants included in the U.S.Census (which is generally believed to do a good job surveying both legal andillegal migrants), does show a higher skill level in the NIS (12.26 mean years ofeducation) than in the Census (10.84 years). However, once Mexican immi-grants are excluded (the group with the largest number of illegal immigrants),the skill distributions of the NIS (12.96 mean years of education) and theCensus (12.21) are much closer, and16 percent of immigrants in both the NISand the Census have 8 years of education or less. The first two columns oftable 4 then show that the results for the association between remittances andeducation continue to hold in the NIS (and, if anything, are more strongly posi-tive) when Mexican immigrants are excluded (table 4, columns 1 and 2).Columns 3 and 4 show that this is also true for the pooled sample of allsurveys, which suggests that failure to capture illegal migrants in the survey isnot driving the main result.
A second potential concern is whether it is valid to pool so many differentsurveys with different sampling methods and differing degrees of representa-tiveness. Note that survey fixed effects are included in the regression analysis,so that only within-survey variation is used to identify the effect of education;the pooled estimate is thus a consistent estimate for the average associationamong the surveys. Nonetheless, as an alternative, the regressions are run onlyfor the five surveys based on representative sampling from a list of migrants:(Longitudinal Survey of Immigrants to Australia (LSIA), the French Profile andTracking of Migrants Survey (DREES), the German Socioeconomic PanelStudy (SOEP), and the Spanish ENI and the NIS). The results show point esti-mates and levels of statistical significance that are very close to those for thefull pooled sample (see table 4, column 5). This demonstrates that the resultsare not being driven by the specialized surveys of particular migrant groups,such as the Japanese and Belgian surveys.
Finally, one might query whether the results are being driven by students.That could influence the results based on university education if there weremany students studying for undergraduate degrees who do not send remittancesand do not yet have a college degree. There are several reasons to believe thatthis is not the main factor driving results. First, the LSIA and NIS surveys donot include students, which eliminates from the sample students in thecountries that are among the most popular destinations for international study.Second, many international students come for postgraduate education, so theywould be classified as having a college education and remitting little, which
Bollard, McKenzie, Morten, and Rapoport 147
at International Monetary F
und on August 12, 2011
wber.oxfordjournals.org
Dow
nloaded from

TA
BL
E4
.R
obust
nes
sC
hec
ks U
.S.
New
Imm
igra
nt
Surv
ey(N
IS)
sam
ple
Poole
dsa
mple
Vari
able
Full
sam
ple
Excl
udin
gM
exic
ans
Full
sam
ple
Excl
udin
gN
ISM
exic
ans
Nat
ionally
repre
senta
tive
sam
ple
sO
nly
mig
rants
ages
25þ
Only
work
ing
mig
rants
Educa
tion
mea
sure
dby
univ
ersi
tydeg
ree
Tota
lre
mit
tance
s($
per
year)
769.5
**
839.7
**
298.0
*306.8
*318.5
*267.7
308.7
Num
ber
of
obse
rvat
ions
7,0
46
5,9
22
24,0
33
22,9
09
19,6
43
21,3
43
16,6
93
Exte
nsi
ve:
Rem
its
indic
ator
0.0
38**
0.0
46**
-0.0
10
0.0
00
-0.0
11
-0.0
23*
0.0
48**
Num
ber
of
obse
rvat
ions
7,1
13
5,9
84
25,9
07
24,7
78
20,8
75
23,0
43
18,1
47
Inte
nsi
ve:
Log
rem
itta
nce
s0.3
97*
0.4
58**
0.2
26**
0.2
36**
0.2
20**
0.1
92**
0.2
30**
Num
ber
of
obse
rvat
ions
1,1
18
982
9,0
38
8,9
02
6,2
20
8,3
03
7,3
60
Educa
tion
mea
sure
din
years
Tota
lre
mit
tance
s($
per
year)
86.5
3108.0
957.8
168.1
762.5
258.7
878.4
9N
um
ber
of
obse
rvat
ions
7,0
33
5,9
09
23,9
44
22,8
20
19,5
54
21,2
63
16,6
39
Exte
nsi
ve:
Rem
its
indic
ator
0.0
034**
0.0
021
0.0
014
0.0
016
0.0
017
0.0
007
0.0
031*
Num
ber
of
obse
rvat
ions
7,1
00
5,9
71
25,8
07
24,6
78
20,7
75
22,9
54
18,0
83
Inte
nsi
ve:
Log
rem
itta
nce
s0.0
329*
0.0
391*
0.0
229**
0.0
260**
0.0
307**
0.0
235**
0.0
242**
Num
ber
of
obse
rvat
ions
1,1
16
980
9,0
10
8,8
74
6,1
92
8,2
79
7,3
35
Mea
ns
Tota
lre
mit
tance
s($
per
year)
633
719
734
813
614
772
935
Fra
ctio
nw
ho
rem
it0.1
50.1
60.2
70.2
90.2
40.2
80.3
3Fra
ctio
nw
ith
univ
ersi
ty0.3
30.4
00.3
80.3
80.3
80.3
80.3
8Y
ears
of
educa
tion
13.4
14.0
13.0
13.1
13.1
13.0
13.4
*Sig
nifi
cant
atth
e5
per
cent
leve
l**
signifi
cant
atth
e1
per
cent
leve
l.
Note
:N
atio
nall
yre
pre
senta
tive
surv
eys
are
Aust
ralia
LSIA
,Fra
nce
DR
EE
S,
Ger
many
SO
EP,
Spain
EN
Iand
U.S
.N
IS.
See
table
1fo
rfu
llsu
rvey
nam
es.
Sourc
e:A
uth
ors
’analy
sis
base
don
dat
ades
crib
edin
the
text.
148 T H E W O R L D B A N K E C O N O M I C R E V I E W
at International Monetary F
und on August 12, 2011
wber.oxfordjournals.org
Dow
nloaded from

would offset any effect of undergraduates.9 As a final check, the analysis isrestricted to individuals who are working (table 4, last column). Since moreeducated individuals are more likely to be working, this eliminates one channelthrough which the more educated can earn more and thereby remit more.Nevertheless, even with this restriction, there is a significant positive coefficientat both the extensive and intensive margins, and the point estimate for totalremittances is similar in magnitude, although it is not statistically significant.
Taken together, these results indicate that the basic finding of a positiverelationship between total remittances and education appears reasonablyrobust to alternative ways of combining the surveys.
Channels
This section uses these microdata to explore some of the channels throughwhich education might influence remittances. Proxies are added to the modelto control for differences in household income and work status, in householddemographics and the presence of family abroad, in time spent abroad, in legalstatus, and in intentions to return home.
Table 5 shows the results of adding this full set of variables to the pooledmodel, using years of education as the measure of educational attainment. Thesechannels operate as theory would predict. Households with more income andwith adults who work more are more likely to remit: households where a migrantmember is working send $345 more annually, with an extra $38 remittedannually for each 10 percent increase in income. As expected, family compositionvariables are also strongly significant both overall and for the extensive and inten-sive margins: a spouse outside the country is associated with a colossal additional$1,120 remitted each year, approximately one and a half times the mean annualremittance for all migrants. Each child living outside the destination country isassociated with an additional $340 remitted annually and each parent for anadditional $180. Residing in the destination country legally is associated with anadditional $400 annually, providing no evidence that legal migrants lose theirdesire to remain in contact with their home country. Migrants who plan to moveback home also remit significantly more, but this effect is primarily through theextensive margin rather than the intensive margin.
Which channels account for the association between education and remit-tance behavior? Tables 6, 7, and 8 report how the coefficient on education inan ordinary least squares regression changes as controls are added for totalremittances, the extensive margin, and the intensive margin. Each panel of eachtable first shows the baseline education coefficient from regressing remittancesonly on education and country of birth and dataset fixed effects (from table 3).Each succeeding row then shows changes in this coefficient when controls are
9. In the United States, 47 percent of international students are studying for postgraduate degrees,
compared with 12 percent for associate degrees and 32 percent for bachelor degrees (http://opendoors
.iienetwork.org/?p=150827).
Bollard, McKenzie, Morten, and Rapoport 149
at International Monetary F
und on August 12, 2011
wber.oxfordjournals.org
Dow
nloaded from

added for income and work status, family composition, and all controls fromtable 5 (income and family controls, as well as legal status, time spent abroad,and intent to return home).
Remittance behavior is accounted for primarily by income and not by differ-ences in family composition. The baseline result for total remittances fromtable 3, controlling only for country of birth and dataset fixed effects, is thatmigrants with a university degree remit $300 more than migrants without one.Controlling for the full set of covariates (the all row) reduces the coefficient onuniversity degree by two-thirds, and it becomes statistically insignificant. Thethird row adds just the family composition variables to the baseline
TA B L E 5. Remittances on Years of Education for Pooled Sample with AllControls
Total Extensive IntensiveVariable remittances Remits Log remittances
Years of education 37.81 20.002* 0.017**(29.64) (0.001) (0.005)
Log income 384.59** 0.023** 0.364**(105.37) (0.003) (0.034)
Working 345.06** 0.113** 0.514**(90.80) (0.010) (0.065)
Household size 28.14 20.002 0.015(17.67) (0.002) (0.016)
Married 289.77 0.004 20.097(68.78) (0.010) (0.061)
Spouse outside country 1,120.95** 0.145** 0.568**(236.04) (0.020) (0.097)
Number of children 2121.56** 20.006 20.099**(36.44) (0.003) (0.027)
Children outside country 337.78** 0.048** 0.228**(75.14) (0.006) (0.039)
Number of parents 247.07 20.020** 20.125**(53.56) (0.005) (0.045)
Parents outside country 182.58** 0.063** 0.243**(38.02) (0.006) (0.045)
Years spent abroad / 100 2,539.77 0.251** 1.744**(2,533.08) (0.095) (0.656)
Years spent abroad squared / 100 231.43 20.010** 20.033*(27.14) (0.002) (0.015)
Legal immigrant 398.79** 0.096** 0.167**(121.36) (0.018) (0.061)
Will return home 692.30** 0.095** 0.085(201.83) (0.021) (0.072)
Number of observations 23,944 32,535 11,364
*Significant at the 5 percent level ** significant at the 1 percent level.
Note: Includes dummy variables for missing covariates and fixed effects for country of birthand survey. Trimmed remittances greater than twice income. Pooled samples poststratified bycountry and education.
Source: Authors’ analysis based on data described in the text.
150 T H E W O R L D B A N K E C O N O M I C R E V I E W
at International Monetary F
und on August 12, 2011
wber.oxfordjournals.org
Dow
nloaded from

TA
BL
E6
.E
duca
tion
Coef
fici
ent
as
Contr
ols
Are
Added
:T
ota
lA
nnual
Rem
itta
nce
s(U
.S.
dollar
s)
Aust
rali
aB
elgiu
mG
erm
any
Italy
Japan
Spain
Spain
U.S
.U
.S.
Poole
dV
ari
able
LSIA
IRSH
SSO
EP
NID
IID
BE
NI
NID
IN
ISPew
tota
l
Univ
ersi
tyed
uca
tion
Base
line
58.4
922.8
**
291.0
2526.6
237.5
292.6
2168.8
769.5
**
2554.0
*298.0
*(6
1.1
)(3
51.4
)(2
75.6
)(4
11.6
)(3
74.1
)(6
2.8
)(7
49.4
)(2
54.4
)(2
27.2
)(1
37.6
)In
com
e2
10.1
557.0
*238.5
2623.9
166.5
2189.3
**
24.7
396.6
*2
741.5
**
102.3
(62.4
)(2
81.4
)(2
62.2
)(4
07.2
)(3
59.8
)(6
3.5
)(7
29.0
)(1
74.4
)(2
63.8
)(9
2.8
)Fam
ilya
29.8
534.7
237.8
2306.7
317.5
2112.8
26.9
623.6
**
2698.6
**
228.2
*(6
1.4
)(3
10.5
)(2
43.5
)(3
94.7
)(3
80.3
)(5
7.6
)(7
25.9
)(2
04.7
)(2
41.9
)(1
03.1
)A
ll2
16.5
475.8
144.6
2539.6
328.7
2181.7
**
266.2
402.2
**
2835.7
**
99.9
(62.1
)(2
72.7
)(1
79.8
)(3
83.3
)(3
65.3
)(5
8.6
)(6
98.6
)(1
54.3
)(2
69.9
)(7
1.6
)N
um
ber
of
obse
rvat
ions
2,5
37
377
854
1,0
72
846
9,2
34
1,0
20
7,0
46
1,0
84
24,0
33
Yea
rsof
educa
tion
Base
line
19.0
8*
86.5
026.3
92
7.5
62
3.0
32.4
02
13.6
586.5
364.8
957.8
1(9
.01)
(45.1
1)
(29.3
7)
(34.0
5)
(7.9
2)
(7.3
6)
(19.9
5)
(46.5
0)
(44.9
7)
(37.0
8)
Inco
me
7.9
947.8
03.5
12
32.4
42
2.5
92
13.3
92
26.9
544.9
849.1
832.1
2(8
.69)
(38.2
8)
(27.3
3)
(33.3
9)
(11.5
0)
(7.4
1)
(19.6
8)
(40.0
0)
(45.0
9)
(31.9
8)
Fam
ilya
17.0
329.2
825.5
647.3
12
1.8
63.9
310.3
280.7
847.9
555.4
3(8
.98)
(38.4
5)
(27.7
9)
(34.9
3)
(8.6
2)
(6.8
4)
(19.9
8)
(44.7
5)
(46.3
7)
(34.2
4)
All
8.8
633.7
79.6
622.6
41.9
92
7.5
74.5
054.8
127.0
137.8
1(8
.91)
(36.9
4)
(22.8
2)
(32.7
9)
(10.6
3)
(6.8
4)
(19.3
2)
(37.3
2)
(46.3
8)
(29.6
4)
Num
ber
of
obse
rvat
ions
2,5
31
377
854
1,0
72
846
9,1
64
1,0
20
7,0
33
1,0
84
23,9
44
*Sig
nifi
cant
atth
e5
per
cent
leve
l**
signifi
cant
atth
e1
per
cent
leve
l.
Note
:B
ase
line
row
incl
udes
only
countr
yof
bir
thand
dat
ase
tfixed
effe
cts.
Inco
me
row
adds
work
ing
dum
my
and
log
inco
me
tobase
line.
Fam
ily
row
adds
seve
nfa
mil
ym
ember
contr
ols
tobase
line.
All
row
isfu
llsp
ecifi
cati
on
from
table
3.
Tri
mm
edre
mit
tance
sgre
ater
than
twic
ein
com
e.Poole
dsa
mple
spost
stra
tified
by
countr
yand
educa
tion.
See
table
1fo
rfu
llsu
rvey
nam
es.
a.
Incl
udes
house
hold
size
,dum
my
vari
able
ifm
arr
ied,
dum
my
vari
able
ifsp
ouse
isouts
ide
the
countr
y,num
ber
of
childre
n,
num
ber
of
childre
nouts
ide
the
countr
y,num
ber
of
pare
nts
,and
num
ber
of
pare
nts
outs
ide
the
countr
y
Sourc
e:A
uth
ors
’analy
sis
base
don
dat
ades
crib
edin
the
text.
Bollard, McKenzie, Morten, and Rapoport 151
at International Monetary F
und on August 12, 2011
wber.oxfordjournals.org
Dow
nloaded from

TA
BL
E7
.E
duca
tion
Coef
fici
ent
as
Contr
ols
are
Added
:R
emit
sIn
dic
ator
Aust
ralia
Bel
giu
mFra
nce
Ger
many
Italy
Japan
Norw
aySpain
Spain
U.S
.U
.S.
Poole
d
Vari
able
LSIA
IRSH
SD
RE
ES
SO
EP
NID
IID
BL
BI
EN
IN
IDI
NIS
Pew
Exte
nsi
veT
ota
l
Univ
ersi
tyed
uca
tion
Base
line
20.0
19
20.0
55
0.0
14
0.0
42
20.0
65
0.0
91**
0.0
12
20.0
49**
20.2
32**
0.0
38**
20.1
40*
20.0
18
20.0
10
(0.0
32)
(0.0
29)
(0.0
27)
(0.0
48)
(0.0
43)
(0.0
34)
(0.0
30)
(0.0
15)
(0.0
81)
(0.0
11)
(0.0
60)
(0.0
10)
(0.0
10)
Inco
me
20.0
52
20.1
12**
20.0
27
0.0
23
20.0
74
0.0
82*
20.0
20
20.0
62**
20.1
85*
20.0
00
20.1
65**
20.0
43**
20.0
33**
(0.0
32)
(0.0
29)
(0.0
27)
(0.0
47)
(0.0
42)
(0.0
35)
(0.0
30)
(0.0
15)
(0.0
78)
(0.0
11)
(0.0
58)
(0.0
10)
(0.0
11)
Fam
ilya
20.0
62
20.0
69*
0.0
15
0.0
39
20.0
46
0.0
88*
20.0
04
20.0
67**
20.2
34**
0.0
22
20.1
48*
20.0
31**
20.0
26*
(0.0
32)
(0.0
32)
(0.0
27)
(0.0
48)
(0.0
41)
(0.0
35)
(0.0
30)
(0.0
13)
(0.0
81)
(0.0
12)
(0.0
60)
(0.0
10)
(0.0
11)
All
20.0
80*
20.1
13**
20.0
27
0.0
28
20.0
65
0.0
83*
20.0
31
20.0
73**
20.1
77*
0.0
06
20.1
61**
20.0
43**
20.0
33**
(0.0
31)
(0.0
30)
(0.0
27)
(0.0
48)
(0.0
38)
(0.0
35)
(0.0
30)
(0.0
14)
(0.0
75)
(0.0
12)
(0.0
59)
(0.0
10)
(0.0
11)
Num
ber
of
obse
rvat
ions
2,6
54
451
4,2
78
854
1,1
53
1,0
30
2,4
66
10,2
82
1,1
12
7,1
13
1,2
96
32,6
51
25,9
07
Yea
rsof
educa
tion
Base
line
0.0
080
20.0
042
0.0
018
0.0
145
0.0
010
0.0
024**
0.0
008
20.0
023
20.0
072**
0.0
034**
0.0
010
0.0
006
0.0
014
(0.0
043)
(0.0
040)
(0.0
025)
(0.0
084)
(0.0
040)
(0.0
005)
(0.0
025)
(0.0
018)
(0.0
021)
(0.0
012)
(0.0
060)
(0.0
009)
(0.0
010)
Inco
me
0.0
014
20.0
117**
20.0
016
0.0
071
20.0
027
0.0
035**
20.0
027
20.0
049**
20.0
074**
20.0
015
20.0
035
20.0
027**
20.0
018
(0.0
042)
(0.0
040)
(0.0
025)
(0.0
084)
(0.0
037)
(0.0
011)
(0.0
026)
(0.0
018)
(0.0
021)
(0.0
012)
(0.0
057)
(0.0
010)
(0.0
010)
Fam
ilya
0.0
018
20.0
060
0.0
050*
0.0
152
0.0
062
0.0
019**
20.0
006
20.0
040*
20.0
054*
0.0
029*
0.0
006
0.0
000
0.0
006
(0.0
044)
(0.0
042)
(0.0
025)
(0.0
087)
(0.0
041)
(0.0
006)
(0.0
026)
(0.0
017)
(0.0
021)
(0.0
012)
(0.0
060)
(0.0
009)
(0.0
010)
All
20.0
025
20.0
115**
0.0
012
0.0
130
0.0
031
0.0
034**
20.0
037
20.0
061**
20.0
046*
0.0
002
20.0
059
20.0
019*
20.0
011
(0.0
041)
(0.0
041)
(0.0
024)
(0.0
087)
(0.0
037)
(0.0
010)
(0.0
026)
(0.0
017)
(0.0
020)
(0.0
012)
(0.0
055)
(0.0
010)
(0.0
010)
Num
ber
of
obse
rvat
ions
2,6
48
451
5,5
29
854
1,1
53
1,0
30
2,4
50
10,2
01
1,1
12
7,1
00
1,2
96
32,5
35
25,8
07
*Sig
nifi
cant
atth
e5
per
cent
leve
l**
signifi
cant
atth
e1
per
cent
leve
l.
Note
:B
ase
line
row
incl
udes
only
countr
yof
bir
thand
dat
ase
tfixed
effe
cts.
Inco
me
row
adds
work
ing
dum
my
and
log
inco
me
tobase
line.
Fam
ily
row
adds
seve
nfa
mil
ym
ember
contr
ols
tobase
line.
All
row
isfu
llsp
ecifi
cati
on
from
table
3.
Tri
mm
edre
mit
tance
sgre
ater
than
twic
ein
com
e.Poole
dsa
mple
spost
stra
tified
by
countr
yand
educa
tion.
a.
Incl
udes
house
hold
size
,dum
my
vari
able
ifm
arr
ied,
dum
my
vari
able
ifsp
ouse
isouts
ide
the
countr
y,num
ber
of
childre
n,
num
ber
of
childre
nouts
ide
the
countr
y,num
ber
of
pare
nts
,and
num
ber
of
pare
nts
outs
ide
the
countr
y
Sourc
e:A
uth
ors
’analy
sis
base
don
dat
ades
crib
edin
the
text.
152 T H E W O R L D B A N K E C O N O M I C R E V I E W
at International Monetary F
und on August 12, 2011
wber.oxfordjournals.org
Dow
nloaded from

specification. The main hypothesis for why less skilled migrants remit more isthat they are more likely to have family members outside the country.Therefore, controlling only for this variable would be expected to increase thecoefficient on education, but the opposite occurs: the coefficient on educationdrops from $300 to $230 and remains statistically significant. This casts doubton the idea that low skilled migrants remit more because of their family com-position. One explanation is the earlier observation that low skilled migrantsare not only likely to have more family abroad, but they are also likely to livein larger households in the host country. The second row of the table adds justthe income variables (a dummy variable for working and log income) to thebaseline specification. The coefficient on university degree falls by more thanhalf and is no longer statistically significant. This suggests that the incomeeffect is a key channel through which education affects remittances—more edu-cated people send more money because they have higher incomes.
Although education becomes insignificant after controlling for income in thepooled sample, this result masks the heterogeneity in the individual surveys. Forexample, the education coefficient remains statistically significant even after con-trolling for all available covariates for three datasets: the Spanish ENI survey,the U.S. Pew dataset, and the U.S. NIS survey. There are several reasons why theeducation coefficient might remain significant in some datasets and not in othersthat cannot be examined with the dataset. One key variable that cannot be con-trolled for is the socioeconomic status of the family in the home country. Moreeducated individuals might come from better-off families and therefore not needto send back as much money. This could explain the negative coefficient in theENI and the Pew datasets.10Or more educated individuals might have fewer tiesto their home country. Time spent away from the home country and desire toreturn home are used to control for this, but they may not fully capture thestrength of the ties. Also lacking are data on whether migrants are using remit-tance to repay family loans—for example, for education. One additional keyissue is that the use of cross-section data does not yield any information abouteconomic shocks that affect the migrant or the migrant’s family.
Table 7 examines the extensive margin. In the baseline specification, moreeducated migrants are less likely to remit anything, but this result is not statisti-cally significant. The negative effect of education on the decision to remit any-thing is strengthened by the inclusion of different sets of covariates. Thecoefficient on education (measured by university degree) is negative and signifi-cant once any covariates are included. The alternative measure of education,years of schooling, is not statistically significant. Table 8 examines the intensivemargin result, which again appears to be driven by the income effect. Adding
10. An alternative explanation may be that the high-earning highly educated migrants are less likely
to respond to surveys. Survey methods that draw a sample from areas known to have a high
concentration of migrants (such as the Pew survey) or from locations where migrants tend to congregate
(such as the NIDI surveys) are especially likely to miss highly educated high-income individuals, who
may be living in areas where there are fewer of their countrymen.
Bollard, McKenzie, Morten, and Rapoport 153
at International Monetary F
und on August 12, 2011
wber.oxfordjournals.org
Dow
nloaded from

TA
BL
E8
.E
duca
tion
Coef
fici
ent
as
Contr
ols
Are
Added
:L
og
Rem
itta
nce
s
Aust
ralia
Bel
giu
mFra
nce
Ger
many
Italy
Japan
Net
her
lands
Spain
Spain
UK
U.S
.U
.S.
Poole
dPoole
d
Vari
able
LSIA
IRSH
S2M
OSO
EP
NID
IID
BC
SR
EN
IN
IDI
BM
EN
ISPew
Inte
nsi
veT
ota
l
Univ
ersi
tyed
uca
tion
Base
line
0.3
41*
0.4
33**
0.3
63
0.4
92
0.0
73
20.0
57
0.3
33**
0.0
93
0.4
30*
0.1
68
0.3
97*
20.1
99
0.2
49**
0.2
26**
(0.1
45)
(0.1
31)
(0.2
11)
(0.4
50)
(0.1
71)
(0.1
46)
(0.1
16)
(0.0
66)
(0.2
02)
(0.1
33)
(0.1
69)
(0.2
16)
(0.0
60)
(0.0
71)
Inco
me
0.2
37
0.2
43*
0.3
06
0.4
08
0.0
21
20.0
86
0.3
33**
0.0
40
0.3
67
0.0
97
0.0
23
20.2
78
0.1
43*
0.1
14
(0.1
38)
(0.1
16)
(0.2
03)
(0.4
45)
(0.1
65)
(0.1
40)
(0.1
16)
(0.0
64)
(0.2
00)
(0.1
23)
(0.1
68)
(0.2
10)
(0.0
58)
(0.0
67)
Fam
ilya
0.2
88*
0.2
58*
0.3
90
0.4
23
0.1
05
20.0
33
0.3
33**
0.0
92
0.4
95**
0.2
06
0.3
64*
20.2
53
0.2
46**
0.2
20**
(0.1
39)
(0.1
28)
(0.2
07)
(0.3
68)
(0.1
78)
(0.1
50)
(0.1
16)
(0.0
61)
(0.1
87)
(0.1
32)
(0.1
66)
(0.2
18)
(0.0
57)
(0.0
66)
All
0.1
79
0.2
25
0.3
18
0.2
93
20.0
15
0.0
03
0.3
23**
0.0
54
0.4
09*
0.1
27
0.0
71
20.3
47
0.1
57**
0.1
18
(0.1
34)
(0.1
18)
(0.2
10)
(0.3
09)
(0.1
76)
(0.1
38)
(0.1
17)
(0.0
59)
(0.1
93)
(0.1
23)
(0.1
65)
(0.2
06)
(0.0
55)
(0.0
63)
Num
ber
of
obse
rvat
ions
958
317
713
184
545
690
648
3,9
66
761
993
1,1
18
514
11,3
92
9,0
38
Yea
rsof
educa
tion
Base
line
0.0
441*
0.0
341
0.0
224*
20.0
085
20.0
032
20.0
040
0.0
247*
0.0
199**
0.0
091
0.0
548*
0.0
329*
0.0
369
0.0
256**
0.0
229**
(0.0
194)
(0.0
174)
(0.0
112)
(0.0
783)
(0.0
163)
(0.0
038)
(0.0
100)
(0.0
076)
(0.0
063)
(0.0
237)
(0.0
146)
(0.0
221)
(0.0
061)
(0.0
071)
Inco
me
0.0
266
0.0
103
0.0
105
20.0
387
20.0
077
20.0
041
0.0
247*
0.0
114
0.0
021
0.0
313
20.0
008
0.0
294
0.0
135*
0.0
112
(0.0
199)
(0.0
164)
(0.0
115)
(0.0
770)
(0.0
164)
(0.0
048)
(0.0
100)
(0.0
075)
(0.0
062)
(0.0
220)
(0.0
126)
(0.0
216)
(0.0
053)
(0.0
062)
Fam
ilya
0.0
383*
0.0
101
0.0
344**
0.0
053
0.0
098
20.0
042
0.0
247*
0.0
247**
0.0
146*
0.0
612**
0.0
392**
0.0
194
0.0
272**
0.0
243**
(0.0
187)
(0.0
167)
(0.0
111)
(0.0
649)
(0.0
168)
(0.0
037)
(0.0
100)
(0.0
072)
(0.0
066)
(0.0
235)
(0.0
144)
(0.0
231)
(0.0
060)
(0.0
070)
All
0.0
227
0.0
060
0.0
268*
20.0
183
0.0
009
20.0
020
0.0
274**
0.0
179*
0.0
086
0.0
319
0.0
172
0.0
128
0.0
169**
0.0
139*
(0.0
193)
(0.0
165)
(0.0
124)
(0.0
511)
(0.0
159)
(0.0
050)
20.0
1(0
.0070)
(0.0
064)
(0.0
224)
(0.0
123)
(0.0
213)
(0.0
052)
(0.0
060)
Num
ber
of
obse
rvat
ions
956
317
713
184
545
690
648
3,9
42
761
993
1,1
16
514
11,3
64
9,0
10
*Sig
nifi
cant
atth
e5
per
cent
leve
l**
signifi
cant
atth
e1
per
cent
leve
l.
Note
:B
ase
line
row
incl
udes
only
countr
yof
bir
thand
dat
ase
tfixed
effe
cts.
Inco
me
row
adds
work
ing
dum
my
and
log
inco
me
tobase
line.
Fam
ily
row
adds
seve
nfa
mil
ym
ember
contr
ols
tobase
line.
All
row
isfu
llsp
ecifi
cati
on
from
table
3.
Tri
mm
edre
mit
tance
sgre
ater
than
twic
ein
com
e.Poole
dsa
mple
spost
stra
tified
by
countr
yand
educa
tion.
a.
Incl
udes
house
hold
size
,dum
my
vari
able
ifm
arr
ied,
dum
my
vari
able
ifsp
ouse
isouts
ide
the
countr
y,num
ber
of
childre
n,
num
ber
of
childre
nouts
ide
the
countr
y,num
ber
of
pare
nts
,and
num
ber
of
pare
nts
outs
ide
the
countr
y
Sourc
e:A
uth
ors
’analy
sis
base
don
dat
ades
crib
edin
the
text.
154 T H E W O R L D B A N K E C O N O M I C R E V I E W
at International Monetary F
und on August 12, 2011
wber.oxfordjournals.org
Dow
nloaded from

only family variables to the baseline specification reduces the coefficient on uni-versity education by approximately 3 percent, but it remains highly significant.However, if only income variables are added to the baseline specification, thecoefficient becomes statistically insignificant, with approximately the samepoint value as the full specification with the full set of covariates.
I V. C O N C L U S I O N S
The key advantage of this analysis over that in other papers in this literature(Faini 2007; Niimi and others 2008) is the ability to link the remittancedecision of migrants with their education level and therefore directly answerthe question of whether more educated migrants remit more. Cross-countrymacroeconomic analyses that relate the amount of remittances received at acountry level to the share of migrants with tertiary education can at best tell uswhether countries that send a larger share of highly skilled migrants receiveless or more remittances than countries that send fewer skilled migrants,without accounting for the other differences between countries that couldunderlie such a relationship.
This new database on migrants allows direct examination of the relationshipbetween education and remittance decisions. Results for the extensive margin(the decision to remit at all) and the intensive margin (the decision on howmuch to remit) combined show that, at least in this combined sample, moreeducated migrants remit significantly more: migrants with a university degreeremit $300 more yearly than migrants without one. Nonetheless, there is someheterogeneity across destination countries, with negative point estimates in afew of the surveys used—mainly in surveys that sample migrants only in areaswhere migrants cluster, thereby missing more educated, higher earningmigrants who may live outside of the immigrant clusters.
The data also allow analysis of several competing theoretical channels thathelp to explain this result. Differences in household composition between highand low skilled migrants do not explain the observed remittance behavior. Oneexplanation may be that although low skilled migrants are more likely to havea spouse and children in the home country, they have larger families onaverage than do high skilled migrants and tend to live in larger households inthe host country. In contrast, there is considerable support for an income effectas the dominant channel through which education operates. More educatedmigrants earn more money and therefore remit more than low skilled migrants.
The article also highlights the clear limitations of existing microdata on remit-tances. While some basic information on migrants can be obtained from censusmicrodata and government immigration records, there are no comparablyreliable sources for remittances. The new database relies on specialized one-offsurveys of migrants. Given the importance of remittances for many developingcountries, it would be beneficial for migrant-receiving countries to include ques-tions on remittances in their regular labor force or household budget surveys.
Bollard, McKenzie, Morten, and Rapoport 155
at International Monetary F
und on August 12, 2011
wber.oxfordjournals.org
Dow
nloaded from

This would be a first step to being able to analyze how remittance patternschange as countries pursue more skill-selective immigration policies.
Policy debates on migration often raise concerns about the potential negativeeffects of the “brain drain” on developing countries. However, the mainfinding that remittances increase with education illustrates one beneficialdimension of high skilled migration for developing countries. High skilledmigrants work in better jobs and earn more money than low skilled migrantsand in turn send more money back home in remittance flows. This suggeststhat the fear that remittances will fall as the migrant skill level rises is not sup-ported by existing empirical evidence.
RE F E R E N C E S
Abbasi, Saif-Ur-Rehman Saif, and Arshad Hussain Hashmi. 2000. “Migrants Earning at Overseas Job
and Extent of Remittances Transferred to their Families in Pakistan.” International Journal of
Agriculture and Biology 2 (3): 222–25.
Cox, Donald. 1987. “Motives for Private Transfers.” Journal of Political Economy 95 (3): 508–46.
Cox, Donald, Zekeriya Eser, and Emmanuel Jimenez. 1998. “Motives for private transfers over the life
cycle: An analytical framework and evidence for Peru.” Journal of Development Economics 55: 57–80.
Docquier, Frederic, and Abdeslam Marfouk. 2005. “International Migration by Education Attainment,
1990–2000.” In International Migration, Remittances and the Brain Drain, ed. C. Ozden, and M. Schiff,
151–99. New York: Palgrave Macmillan.
Faini, Riccardo. 2007. “Remittances and the Brain Drain: Do more Skilled Migrants Remit More?”
World Bank Economic Review 21 (2): 177–91.
Groenewold, George, and Richard Bilsborrow. 2004. “Design of Samples for International Migration
Surveys: Methodological Considerations, Practical Constraints and Lessons Learned from a
Multi-Country Study in Africa and Europe.” Paper presented at the Population Association of
America 2004 General Conference, Boston, MA, April 1–3.
IDB (Inter-American Development Bank). 2005. “Survey of Brazilians and Peruvians in Japan” Survey
commissioned by the Multilateral Investment Fund.
Miotti, Luis, El Mouhoub Mouhoud, and Joel Oudinet. 2009. “Migrations and Determinants of
Remittances to Southern Mediterranean Countries: When History Matters.” Paper presented at the
2nd Migration and Development Conference, Washington, DC, September 10–11.
Niimi, Yoko, Caglar Ozden, and Maurice Schiff. Forthcoming. “Remittances and the Brain Drain:
Skilled Migrants Do Remit Less.” Annales d’Economie et de Statistique.
OECD (Organisation for Economic Co-operation and Development). 2007. Policy Coherence for
Development 2007: Migration and Developing Countries. Paris: OECD.
Rapoport, Hillel, and Frederic Docquier. 2006. “The Economics of Migrants’ Remittances.” In
Handbook of the Economics of Giving, Altruism and Reciprocity, ed. S.-C. Kolm, and J. Mercier
Ythier, 1135–98. Amsterdan: North-Holland.
Robinson, Peter M. 1988. “Root-N Consistent Semiparametric Regression.” Econometrica 56: 931–54.
Siegel, Melissa. 2007. “Immigrant Integration and Remittance Channel Choice.” Working Paper 2007/
09. Maastricht Graduate School of Governance.
Stark, Oded. 1991. The Migration of Labor. Cambridge, MA: Basil Blackwell.
World Bank. 2008. Migration and Remittances Factbook 2008. Washington, DC: World Bank.
———. 2009. “Migration and Development Brief No. 9.” http://siteresources.worldbank.org/
INTPROSPECTS/Resources/MD_Brief9_Mar2009.pdf. Accessed July 10, 2009.
156 T H E W O R L D B A N K E C O N O M I C R E V I E W
at International Monetary F
und on August 12, 2011
wber.oxfordjournals.org
Dow
nloaded from

THE WORLD BANKECONOMIC REVIEW
editorsAlain de Janvry and Elisabeth Sadoulet, University of California at Berkeley
Jaime de Melo, Editor until July 1, 2010, has been technically responsible for this issue.
assistant to the editor Marja Kuiper
editorial boardHarold H. Alderman, World Bank (retired)Pranab K. Bardhan, University of California,
BerkeleyScott Barrett, Columbia University, USAAsli Demirgüç-Kunt, World Bank Jean-Jacques Dethier, World BankQuy-Toan Do, World BankFrédéric Docquier, Catholic University of
Louvain, BelgiumEliana La Ferrara, Università Bocconi, ItalyFrancisco H. G. Ferreira, World BankAugustin Kwasi Fosu, United Nations
University, WIDER, FinlandPaul Glewwe, University of Minnesota,
USAAnn E. Harrison, World BankPhilip E. Keefer, World BankJustin Yifu Lin, World BankNorman V. Loayza, World Bank
William F. Maloney, World BankDavid J. McKenzie, World BankJaime de Melo, University of GenevaJuan-Pablo Nicolini, Universidad Torcuato di
Tella, ArgentinaNina Pavcnik, Dartmouth College, USAVijayendra Rao, World BankMartin Ravallion, World BankJaime Saavedra-Chanduvi, World BankClaudia Paz Sepúlveda, World BankJoseph Stiglitz, Columbia University, USAJonathan Temple, University of Bristol, UKRomain Wacziarg, University of California,
Los Angeles, USADominique Van De Walle, World BankChristopher M. Woodruff, University of
California, San DiegoYaohui Zhao, CCER, Peking University,
China
The World Bank Economic Review is a professional journal used for the dissemination of research indevelopment economics broadly relevant to the development profession and to the World Bank inpursuing its development mandate. It is directed to an international readership among economists andsocial scientists in government, business, international agencies, universities, and development researchinstitutions. The Review seeks to provide the most current and best research in the field of quantita-tive development policy analysis, emphasizing policy relevance and operational aspects of economics,rather than primarily theoretical and methodological issues. Consistency with World Bank policy playsno role in the selection of articles.
The Review is managed by one or two independent editors selected for their academic excellence inthe field of development economics and policy.The editors are assisted by an editorial board composedin equal parts of scholars internal and external to the World Bank. World Bank staff and outsideresearchers are equally invited to submit their research papers to the Review.
For more information, please visit the Web sites of the Economic Review at Oxford University Pressat www.wber.oxfordjournals.org and at the World Bank at www.worldbank.org/research/journals.
Instructions for authors wishing to submit articles are available online at www.wber.oxfordjournals.org.Please direct all editorial correspondence to the Editor at [email protected].
Forthcoming papers in
• Has India’s Economic Growth Become More Pro-Poor in the Wake of Economic Reforms?Gaurav Datt and Martin Ravallion
• Are The Poverty Effects of Trade Policies Invisible? Monika Verma, Thomas Hertel, and Ernesto Valenzuela
• Corruption and Confidence in Public Institutions: Evidence from a Global SurveyBianca Clausen, Aart Kraay, and Zsolt Nyiri
• Agricultural Distortions in Sub-Saharan Africa: Trade and WelfareIndicators, 1961 to 2004Johanna Croser and Kym Anderson
• Thresholds in the Finance-Growth Nexus: A Cross-Country AnalysisHakan Yilmazkuday
• The value of vocational education: High school type and labor marketoutcomes in IndonesiaDavid Newhouse and Daniel Suryadarma
• Disability and Poverty in VietnamDaniel Mont and Nguyen Viet Cuong
THE WORLD BANKECONOMIC REVIEW
Wber.j_25_1_Cover.qxd 6/7/11 5:55 PM Page 2

THE WORLD BANKECONOMIC REVIEW
SYMPOSIUM ISSUE ON INTERNATIONAL MIGRATION
AND DEVELOPMENT
Five Questions on International Migration and DevelopmentCaglar Ozden, Hillel Rapoport, and Maurice Schiff
Part I. International Migration Where on Earth is Everybody? The Evolution of
Global Bilateral Migration 1960–2000Caglar Ozden, Christopher R. Parsons, Maurice Schiff,
and Terrie L. Walmsley
Immigration Policies and the Ecuadorian ExodusSimone Bertoli, Jesús Fernández-Huertas Moraga, and
Francesc Ortega
Do Migrants Improve Governance at Home? Evidence from a Voting Experiment
Catia Batista and Pedro C. Vicente
Part II. International RemittancesWhat Explains the Price of Remittances? An Examination
Across 119 Country CorridorsThorsten Beck and María Soledad Martínez Pería
Remittances and the Brain Drain Revisited: The MicrodataShow That More Educated Migrants Remit MoreAlbert Bollard, David McKenzie, Melanie Morten,
and Hillel Rapoport
Volume 25 • 2011 • Number 1
www.wber.oxfordjournals.org
THE WORLD BANK1818 H Street, NWWashington, DC 20433, USAWorld Wide Web: http://www.worldbank.org/E-mail: [email protected]
2V
olume 25 • N
umber 1 • 2011
TH
E W
OR
LD
BA
NK
EC
ON
OM
IC R
EV
IEW
Pages 1–156
ISSN 0258-6770 (PRINT) ISSN 1564-698X (ONLINE)
Wber.j_25_1_Cover.qxd 6/7/11 5:55 PM Page 1