world bank operations evaluation...
TRANSCRIPT

2002Annual Report on Operations Evaluation
W O R L D B A N K O P E R A T I O N S E V A L U A T I O N D E P A R T M E N T
Director-General, Operations Evaluation: Robert PicciottoDirector, Operations Evaluation Department: Gregory K. IngramManager, Corporate Evaluations and Methods: Victoria M. ElliotTask Manager: Laurie EffronTask Team: Carlos Reyes, Deepa Chakrapani, Gillian Perkins,
Zamir Islamshah
2002The World Bank
Washington, D.C.http://www.worldbank.org/oed
Laurie Effron
© 2002 The International Bank for Reconstruction and Development / The World Bank1818 H Street, NWWashington, DC 20433
All rights reserved.
OPERATIONS EVALUATION DEPARTMENT
ENHANCING DEVELOPMENT EFFECTIVENESSTHROUGH EXCELLENCE AND INDEPENDENCE IN EVALUATIONThe Operations Evaluation Department (OED) is an independent unit within the World Bank; it reports directly to the Bank’s Board of Executive Directors. OED assesses what works, and what does not; how a borrower plans to run and maintain a project; and the lasting contribution of the Bank to a country’s overall development. The goals of evaluation are to learn from experience, to provide an objective basis for assessing the results of the Bank’s work, and to provide accountability in the achievement of its objectives. It also improves Bank work by identifying and disseminating the lessons learned from experience and by framing recommendations drawn from evaluation findings.
The findings, interpretations, and conclusions expressed here are those of the author(s) and do not necessarily reflect the views of the Board of Executive Directors of the World Bank or the governments they represent.
The World Bank cannot guarantee the accuracy of the data included in this work. The boundaries, colors, denominations, and other information shown on any map in this workdo not imply on the part of the World Bank any judgment of the legal status of any territory orthe endorsement or acceptance of such boundaries.
Rights and Permissions
The material in this work is copyrighted. No part of this work may be reproduced or transmittedin any form or by any means, electronic or mechanical, including photocopying, recording, or inclusion in any information storage and retrieval system, without the prior written permission of the World Bank. The World Bank encourages dissemination of its work and will normallygrant permission promptly.
For permission to photocopy or reprint, please send a request with complete information to theCopyright Clearance Center, Inc., 222 Rosewood Drive, Danvers, MA 01923, USA, telephone978-750-8400, fax 978-750-4470, www.copyright.com.
All other queries on rights and licenses, including subsidiary rights, should be addressed to the Office of the Publisher, World Bank, 1818 H Street NW, Washington, DC 20433, USA,fax 202-522-2422, e-mail [email protected].
Printed on Recycled Paper
v Foreword v Background vi Evolving Corporate Strategies vi Progress in Evaluation, Control, and Risk Management vi Remaining Challenges vii Recommendations
ix Abbreviations and Acronyms
1 1. Introduction
3 2. The Control Environment
7 3. Risk Assessment7 Lending: Risk Assessment for Projects in the Pipeline and
under Implementation 9 Grants, Trust Funds, and Partnerships 11 Risk Assessment at the Country Level 11 Risk Assessment at the Corporate Level
13 4. Control Activities13 Bank Policies and Guidelines 13 Quality Assurance/Enhancement of Lending 14 Monitoring and Self-Evaluation at the Project Level 16 Quality Assurance for Economic and Sector Work (ESW) 16 Control Self-Assessments and Enterprise Risk Management
17 5. Monitoring17 Monitoring Projects and ESW at the Corporate Level 18 Sector and Thematic Monitoring and Evaluation 19 Country-Level Evaluation 20 Monitoring and Evaluation in the World Bank Institute (WBI) 21 Monitoring and Evaluating the Bank’s Research 21 Corporate-Level Performance Measurement
23 6. Information and Communication23 Information24 New Sector and Thematic Codes 24 Communication and Disclosure
25 7. OED’s Agenda25 OED’s Outputs: The View from the Committee on
Development Effectiveness (CODE)26 Recommendations from Previous AROEs 26 OED Outcomes and Impact 29 Recommendations for OED
31 8. Conclusions and Recommendations31 Main Findings 32 Recommendations
35 Annexes35 Annex 1: OED Review of ICRs 41 Annex 2: Regional Quality Teams: A Comparison across Regions
C O N T E N T S
i i i

2 0 0 2 A N N U A L R E P O R T O N O P E R AT I O N S E VA L U AT I O N
i v
45 Annex 3: Quality at Entry, Outcomes, and Portfolio at Risk—A Comparative Analysis of QAG and OED Findings on Lending Operations
49 Annex 4: FY02 OED Summary Work Plan and Results Frameworkas of March 31, 2002
51 Annex 5: OED Surveys 59 Annex 6: CAE Tracer Study 63 Annex 7: Chairman’s Statement, Committee on Development
Effectiveness (CODE)
67 Endnotes
71 References
Boxes2 1.1 COSO 4 2.1 Milestones in the Control Framework for Risk Management5 2.2 Increasing Focus on Poverty8 3.1 Regional Approaches to Risk Assessment10 3.2 Grants, Trust Funds, Partnerships: What They Are,
What Risks They May Involve 11 3.3 Risk Assessment Tools at the Country Level 12 3.4 Sample Checklist for Country Risk Analysis 14 4.1 Conversion and Updating Process of OP/BP: Progress Reporting15 4.2 Efforts to Strengthen M&E Over the Past Decade 19 5.1 Strengthening Evaluation Capacity in the Bank and Borrower Countries20 5.2 Learning Achievement of WBI Course Participants 21 5.3 Ex ante and Ex post Evaluation of Bank Research 26 7.1 OED’s 1997 Renewal Strategy 29 7.2 CAE Recommendations and Implementation of Bank Assistance:
A Varied Picture
Figure27 7.1 Quality of OED Evaluations
Tables8 3.1 Quality of Risk Management Processes28 7.1 OED Influence

v
FOREWORD
The Annual Report on Operations Evaluation (AROE) fulfills a statutoryresponsibility of the Operations Evaluation Department (OED)—to attestto the progress, status, and prospects of development accountability and
organizational learning within the World Bank. This year’s AROE, grounded in a10-year retrospective of monitoring, evaluation, and risk management systems inthe Bank, documents remarkable progress. Further adaptation will be needed torespond to the new demands of the corporate strategy and the Bank’s endorsementof the Millennium Development Goals.
BackgroundThe shift toward an implementation culture datesfrom an internal Bank review, commonly referredto as the “Wapenhans report,” commissioned byPresident Preston in 1992. It brought into sharprelief the disappointing performance results doc-umented by OED, and it succeeded in shiftingmanagerial attention from the approval of individualloans to proactive portfolio management. In 1994,accountability for results on the ground was fur-ther enhanced by the creation of an independentInspection Panel equipped to investigate local com-munities’ allegations of Bank failures to comply withagreed policies.
Further intensification of the managerial focuson development effectiveness has taken placeunder the leadership of President Wolfensohn. TheExecutive Directors provided strong support to the
President’s initiatives and contributed to the cul-ture of results by adding a Committee on Devel-opment Effectiveness (CODE) to the Board’soversight structure. A new risk assessment and con-trol framework (COSO) was adopted. A profes-sional corruption and fraud investigation unitwas created. A quality assurance and complianceunit to improve safeguard policy performancewas introduced within the Environmentally andSocially Sustainable Development Vice Presi-dency.
Most important, a Quality Assurance Group(QAG) was set up to track operational quality anddevelopment risks in real time. OED launched itsrenewal, which focused on filling evaluation gaps,enhancing organizational learning, and movingevaluation to the higher plane of country andsector programs.

Evolving Corporate StrategiesThe “country focus” of the operational matrix, theComprehensive Development Framework (CDF),the Poverty Reduction Strategy Paper program(PRSP), and the Heavily Indebted Poor Country(HIPC) initiative have put the country “at thecenter” of Bank operations. Aid coordination andcapacity building services have assumed a higherprofile in country assistance strategies. Knowl-edge and partnership have replaced resource trans-fer and conditionality as favored instruments ofoperational assistance. The scope and number ofinstitutional partnerships—many with a regionaland global reach—have expanded rapidly.
These changes have received broad-based sup-port from the development community. So havethe Bank’s efforts to emphasize country per-formance in lending resource allocations, to for-mulate explicit sector strategies in consultationwith partners, and to recast policies so as to drawclearer distinctions between mandatory “do noharm” safeguards and “do good” socially and en-vironmentally sustainable practices.
A decision matrix weighted toward the Re-gions has contributed to tensions between theBank’s country focus and its implementation ofmore comprehensive and rigorous operationalstandards. In weak institutional environmentsand where borrower commitment has been lack-ing, excessive transaction costs, high operationalattrition rates, and risk aversion have hindered de-velopment effectiveness. Further efforts to balancethe matrix and improve the linkages betweencountry programs and sector strategies wouldimprove the Bank’s development effectiveness.
Progress in Evaluation, Control, and RiskManagement Complex challenges for evaluation, control, andrisk management have emerged as the Bank’s strat-egy evolved toward a more comprehensive ap-proach. In 1997, poverty reduction wasincorporated in the Bank’s mission statement andthe Strategic Compact channeled incremental re-sources toward social development, governancereform, and increased participation with the pri-vate sector and the civil society. In parallel, CODEendorsed a new evaluation strategy designed by
OED in consultation with management. It soughtto respond to an unprecedented transformation inthe strategies, products, services, and internal cul-ture of the Bank.
By creating incentives for quality work andmeasuring progress, QAG and OED contributedto significant improvements in operational out-comes. The quality of economic and sector workalso improved after independent and self-evaluation of analytical and advisory services gotunder way. As the country rather than the proj-ect became the unit of account, OED’s country as-sistance evaluations (CAEs) became a standardevaluation product. New-style OED sector andpolicy evaluations have informed the Bank’s newsector strategies and the recasting of operationalpolicies. In parallel, development effectiveness hasbecome a focus of the Bank’s research program, andthe World Bank Institute (WBI) has embarked ona major expansion of its training programs and col-laborative partnerships so as to inform partnersabout the lessons of development experience.
Remaining Challenges Major challenges remain despite the substantialprogress achieved. Monitoring, evaluation, andrisk management capacities must be enhanced fur-ther to meet the demands of the corporate strat-egy and the conclusions of the recent UnitedNations Conference on Financing for Developmentin Monterrey, Mexico. The consensus emphasizesresults at country and global levels, knowledge fordevelopment, and partnership. Self-evaluation hasyet to move to the “higher plane” of country, sec-tor, and global programs. Most of the Bank’s knowl-edge programs have yet to embody clear objectives,precise modalities, and explicit fiduciary require-ments; and Bank country assistance strategies andcollaborative multicountry programs do not de-lineate precisely the shared goals, distinct ac-countabilities, and reciprocal obligations of partners.
This means that development effectivenessmonitoring and evaluation work within the Bankshould converge with similar efforts under waywithin the development community at large. Forall development agencies, monitoring and eval-uation remains the weakest link in the risk man-agement chain. The Evaluation Cooperation
2 0 0 2 A N N U A L R E P O R T O N O P E R AT I O N S E VA L U AT I O N
v i

Group of the Multilateral Development Banks(MDBs) has achieved considerable progress withrespect to retrospective evaluation methods atproject level. But little progress has been made inbuilding monitoring and evaluation systems withindeveloping countries. Nor has harmonization ofcountry program evaluation processes and meth-ods been achieved among MDBs, bilateral donors,and U.N. partners.
At the global level, the Bank has endorsed theMillennium Development Goals (MDGs). Theycommit the development community to specificaggregate targets based on agreed principles of de-velopment cooperation, but do not entail specificcountry and sector programs, nor commitmentsof resources or reform of developed country poli-cies on debt, aid, trade, and migration. While theMDGs should help to concentrate scarce aid re-sources on common priorities, the potential mis-match between ends and means involvesconsiderable risks.
To manage these risks, a collaborative approachto performance measurement along with com-mensurate capacity development efforts will haveto be deployed. The choice and implementationof cost-effective and credible approaches to mon-itoring inputs, outputs, and outcomes and evaluat-ing the results of development assistance havebecome strategically important for the whole de-velopment community. The Bank should reachout to partners to promote harmonization and ca-pacity development for performance measure-ment and management.
Internally, the recent focus at the highest lev-els of Bank management and the international de-velopment community on demonstrating resultsshould help overcome the obstacles that havestood in the way of the results-based manage-ment practices recommended by OED. In par-ticular, the time has come for the Bank to developpractical performance measures at a project, coun-try, and corporate level, for internal use, as wellas a recast Bank scorecard, to be used as an externalreporting vehicle.
RecommendationsResults-based management will be realized onlyif self-evaluation is strengthened at all levels, if in-
dependent evaluation contributes to improvingmethods and indicators for country, sector, andglobal monitoring and evaluation, and reliable datagenerated by countries are incorporated in mea-suring results. The agenda for improved moni-toring and evaluation includes providing guidanceon the overarching evaluation framework andfilling gaps in the tracking systems of lendingand nonlending services, grants, and partner-ships. More transparent Country Assistance Strat-egy (CAS) and Sector Strategy Paper (SSP)processes should be complemented by rigorousself-evaluation. Against this background, theAROE recommends that actions be taken on fourfronts, three by management and one by OED:• At the corporate level, senior management should
develop performance measurements that willenable management and the Board to trackBank achievements at project, country, andglobal levels in relation to the MDGs. It shouldimplement an integrated risk managementframework to facilitate the administration offinancial, operational, developmental, and rep-utational risks faced by the Bank. In this con-text, it should make explicit the strategic risksand rewards of operational policies and cor-porate strategies.
• Strengthen the evaluation and control frameworkfor sector strategies, partnerships, and grants. Theoperational shift to the higher plane of policyand sector strategies needs to be backed by ad-equate network accountability for sector per-formance measurement and management ofinstruments and services. Management andOED should develop a concise operational pol-icy that provides an overarching evaluationframework. Project-level monitoring should betreated as a fiduciary responsibility to ensure thatadequate monitoring is in place before Board ap-proval. The “evaluability” of grant-financed ac-tivities should be improved. For all partnerships,clearer distinctions in accountability and moreaccurate specification of quality assurance, eval-uation, and oversight should help to minimizeconflicts of interest and increase responsivenessto developing country needs.
• At the country level, risk assessment and learn-ing should be improved by developing a com-
F O R E W O R D
v i i

prehensive approach that incorporates fiduci-ary assessments into the Country AssistanceStrategy. The results should inform the Coun-try Assistance Strategy. Self-evaluation at thecountry level needs to be integrated into coun-try programs while CASs need to select veri-fiable indicators that are solidly grounded incountry processes.
• Finally, OED will need to improve and dis-seminate more widely its evaluation method-ologies for country evaluations and increase thetransparency of the evidentiary basis of its eval-uations. It should help Regions and NetworkAnchors incorporate self-evaluation in coun-try assistance and sector strategies, which would
improve the ability of the Bank to measure itsperformance without compromising the in-dependence of OED’s analyses. It should ad-dress the independent evaluation needs ofglobal and regional programs; better monitorand evaluate compliance with safeguards; tar-get more effectively the dissemination of sec-tor and thematic evaluations, and use a widerrange of dissemination tools.
ROBERT PICCIOTTO
DIRECTOR-GENERAL
OPERATIONS EVALUATION
2 0 0 2 A N N U A L R E P O R T O N O P E R AT I O N S E VA L U AT I O N
v i i i

i x
AAA Assessment of advisory activitiesACS Activity completion sheetAPL Adaptable Program LoanARDE Annual Review of Development EffectivenessAREC Annual Report on Evaluation Capacity DevelopmentAROE Annual Report on Operations Evaluation ARPP Annual Review of Portfolio PerformanceBP Bank procedureCAE Country Assistance EvaluationCAS Country Assistance StrategyCDF Comprehensive Development FrameworkCFAA Country Financial Accountability AssessmentCODE Committee on Development EffectivenessCOSO Committee of Sponsoring Organizations of the Treadway CommissionCPAR Country Procurement Assessment ReportCPIA Country Policy and Institutional AssessmentCPPR Country Portfolio Performance ReviewCSA Control Self-AssessmentCY Calendar yearDEC Development Economics Vice PresidencyDECRA DEC Research Advisory StaffDECRG DEC Research GroupDGF Development Grant FacilityEAP East Asia and Pacific RegionECA Europe and Central Asia RegionECD Evaluation capacity developmentED Executive directorERM Enterprise risk managementES Executive summary or evaluation summaryESMAP Energy Sector Management Assistance ProgramESW Economic and sector workFSAP Financial Sector Assessment ProgramFY Fiscal yearHD Human developmentHIPC Heavily Indebted Poor CountriesIAD Internal Audit DepartmentICR Implementation Completion ReportIDA International Development AssociationILI Intensive Learning ICRIMF International Monetary FundISDS Integrated safeguards data sheetLIL Learning and Innovation LoanMAR Management Action RecordMDBs Multilateral development banksMDGs Millennium Development GoalsMMR Monthly Management ReportM&E Monitoring and evaluationOD Operational Directive
ABBREVIATIONS AND ACRONYMS

OED Operations Evaluation DepartmentOP/BP Operational Policy/Bank ProceduresOPCS Operations Policy and Country ServicesPAD Project Appraisal DocumentPAR Portfolio at riskPATS Partnership Approval and Tracking SystemPCD Project Concept DocumentPER Public Expenditure ReviewPID Project information documentPIU Project Implementation UnitPPAR Project Performance Assessment ReportPPIAF Public-Private Infrastructure Advisory FacilityPRSC Poverty Reduction Support CreditPRSP Poverty Reduction Strategy PaperPSR Project Supervision ReportQACU Quality Assurance and Compliance UnitQAE Quality at entryQAG Quality Assurance GroupQER Quality Enhancement ReviewQET Quality Enhancement TeamRBM Results-based managementRSB Research support budgetSAP Accounting system (World Bank)SMART Safeguard Management and Review TeamSOE State-owned enterpriseSPRITE Social policy reform in transition economiesSSP Sector Strategy PaperSWAP Sectorwide approachS&T Sector and thematicTQC Trust Fund Quality Assurance and Compliance UnitWBI World Bank InstituteWDR World Development Report
2 0 0 2 A N N U A L R E P O R T O N O P E R AT I O N S E VA L U AT I O N
x

1
INTRODUCTION
This year’s Annual Report on Operations Evaluation focuses on both riskmanagement and monitoring and evaluation, which are closely related.Risk management involves identifying, assessing, mitigating, and
controlling the risks to development objectives and the Bank’s reputation.Monitoring and evaluation measure whether intended outputs, outcomes, andimpact are being achieved. A results-based management system needs riskmanagement, sound monitoring and evaluation, and reliable performanceindicators from client countries.
Over the past ten years, the way the Bank doesbusiness has changed substantially to take ac-count of its more demanding external environ-ment. New approaches include matrixmanagement, decentralization, new instruments,greater focus on broad partnerships, and greatertransparency. As a result, its risk profile has becomemore complex and demands on managing riskshave become greater. Because OED is concernedwith the Bank’s development effectiveness, this re-port focuses on the systems in place to manage therisks to achievement of development effectivenessand the associated reputational risks, and on themonitoring and evaluation systems in place tomeasure whether the development objectives havebeen achieved. This report does not deal with fi-nancial risks or business operating risks, nor withthe reputational risks arising from either of these.
In the early 1990s, the Bank tracked projectsand lending amounts as the primary measures ofsuccess. Management focused mainly on loan ap-provals, with less attention and few incentivesfor identifying and assessing risks, monitoringimplementation, or measuring outcomes. By theend of the decade, the Bank had become more fo-cused on measuring the quality of lending. Struc-tures and systems had been put in place to addressfiduciary, operational, and safeguard risks of lend-ing, and to assess the quality of some nonlendingactivities. Both self-evaluation and independentevaluation had improved. The internal culturebegan to shift toward managing risks and assess-ing progress toward goals. But an unfinishedagenda remains. The Bank has yet to develop asystematic approach to assessing risks at the coun-try level, or to establish links between inputs or
11

the quality of Bank operations and outcomes atcountry, sectoral, and global levels.
This year’s Annual Report on Operations Eval-uation (AROE) follows the mandate establishedfor OED twenty-six years ago to assess, on an an-nual basis, progress in monitoring and evaluatingthe development effectiveness of the World Bank.It does not report on the evaluation findings perse. These are the subjects of another OED flag-ship report: the Annual Review of DevelopmentEffectiveness (OED 2001a).
As in last year’s report and at the Board’s re-quest, this year’s AROE examines both risk man-agement and monitoring and evaluation, and usesthe COSO internal control framework as the or-
ganizing principle (box 1.1). The report also drawson reports from Operations Policy and Country Ser-vices (OPCS) and the Quality Assurance Group(QAG); OED evaluations, ongoing and completed;and interviews with staff in Regions, Network An-chors, Development Economics Vice Presidency(DEC), and World Bank Institute (WBI).
The AROE takes stock of how far the Bank hascome over the past ten years in developing bothrisk management and monitoring and evalua-tion. In particular, this report examines the extentto which the Bank has adopted the recommen-dations of recent AROEs, as well as the extent towhich OED has adopted recommendations per-taining to its own products and services.
2 0 0 2 A N N U A L R E P O R T O N O P E R AT I O N S E VA L U AT I O N
2
The main objectives of using the COSO process are to ensure:(i) Reliabilitiy of financial reporting; (ii) Compliance with ap-plicable laws and regulations; and (iii) Efficiency and effec-tiveness of operations.
The AROE focuses on this third objective and asks: to whatextent are the controls in place in the World Bank sufficient toensure both the efficiency and the development effectivenessof operations?
The five components of COSO are used as an organizingprinciple in the report:• Control environment establishes the foundation, the struc-
ture and incentives, for the internal control system, based onclearly articulated institutional objectives.
• Risk assessment involves the identification and analysis ofrelevant risks to achieving objectives and forms the basis ofhow risks should be managed.
• Control activities are the policies, procedures, and practicesthat ensure that management’s directives are carried out andthe institution’s mandate is fulfilled.
• Monitoring involves external oversight of the internal controlsor use of independent methodologies within the process tomeasure whether controls are adequate and the objectivesare being met.
• Information and communication support the other four com-ponents by communicating the necessary information in atimely, digestible way that enables staff to perform their func-tions.
Source: COSO 1994, pp. 3–5.
C O S O B o x 1 . 1
3
THE CONTROL ENVIRONMENT
This chapter reviews the evolution of the mandate, structures, functions,and internal culture of the Bank. All have an impact on the controlenvironment, which establishes the foundation for the internal control
system. Many positive changes have occurred in all four areas over the last tenyears. Remaining challenges are to improve the control framework for newknowledge activities and partnerships; develop a more coherent framework forevaluating programs and assessing risks; and ensure better monitoring to measureresults.
The mandate, structures, functions, and internalculture of the Bank have undergone profoundtransformations in the last decade. The 1992Wapenhans report commissioned by PresidentLew Preston sounded a wake-up call for theWorld Bank as well as other multilateral devel-opment banks. It reported a sharp decline in thequality of the portfolio and lending outcomes1
and recommended that the Bank: (i) emphasizethe quality of loans, focusing on quality at entryand risk analysis; (ii) focus more on portfolio per-formance management; (iii) emphasize a coun-try focus for project implementation issues; (iv)promote borrower commitment and accounta-bility; and (v) strengthen the role of independ-ent evaluation. Over the past decade, the Bankhas responded with new initiatives, procedures,structures, and resources (see box 2.1 for Mile-stones).
The Bank’s mandate has, since 1990, becomemore clearly focused on poverty reduction. TheBank has joined with the rest of the developmentcommunity in an ambitious venture: helping clientcountries reach the Millennium Development Goals(MDGs) by the year 2015 (box 2.2). Units through-out the Bank (operational, support, research, train-ing) have begun to realign their work programs toreflect this commitment to explicit development out-comes at the global level. The formulation of theMDGs offers the opportunity—only partially ex-ploited to date—to monitor and evaluate the out-comes of the Bank’s assistance in a context ofinterlocking development partnerships. This is a for-midable undertaking because the linkages betweenindividual MDGs and the sectoral and thematic pri-orities of the Bank are manifold and complex.
The focus on MDGs introduces challengesthat include aligning the MDGs at the country
2
level with priorities of client country and donorsand attributing results to individual partners. Im-proved aid coordination2 and effective use of theComprehensive Development Framework (CDF)processes and Poverty Reduction Strategy Papers(PRSP) can foster this alignment by puttingpoverty reduction at the center of the developmenteffort and establishing monitorable indicators tomeasure progress. This is connected to the drivetoward a Knowledge Bank and the increased re-liance on partnerships to implement new initia-tives, with client countries, with developmentpartners at the regional and global levels, andwithin the Bank. Both the control environmentand the evaluative framework for these activities,as previous AROEs have pointed out,3 remain un-derdeveloped. OED currently has two evalua-tions under way that address several of theseissues.4
Structures and functions have been introducedthroughout the Bank to identify risks, to assess
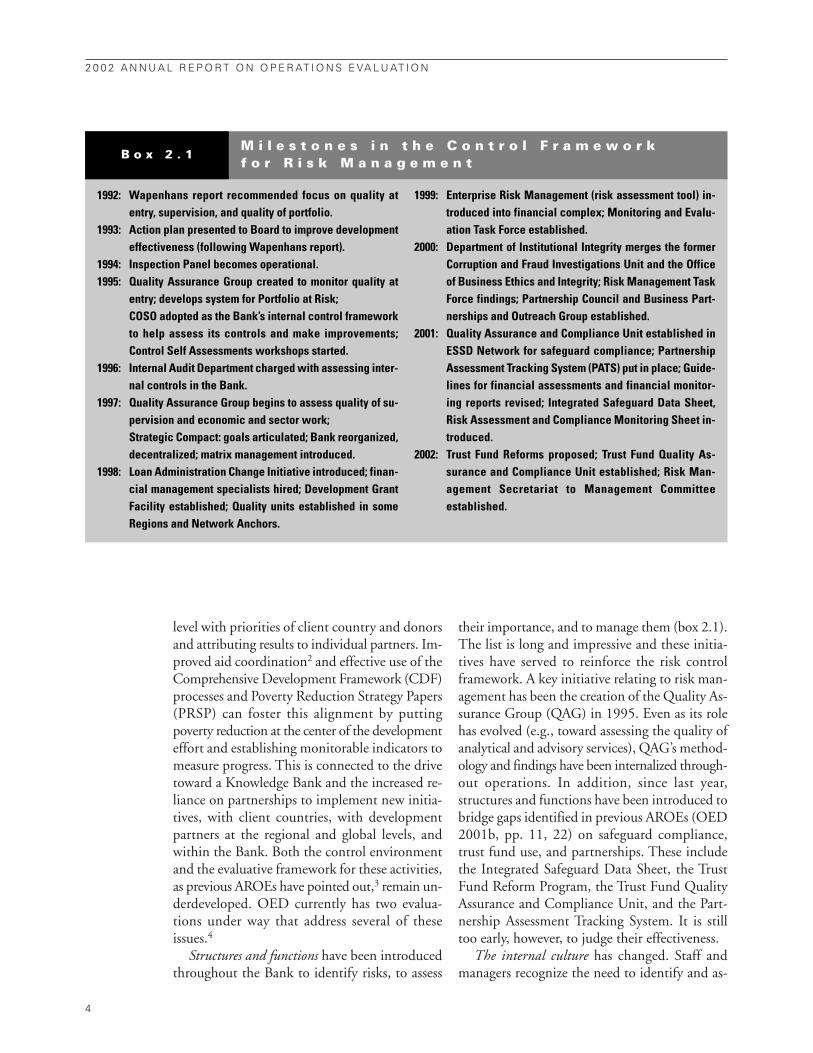
their importance, and to manage them (box 2.1).The list is long and impressive and these initia-tives have served to reinforce the risk controlframework. A key initiative relating to risk man-agement has been the creation of the Quality As-surance Group (QAG) in 1995. Even as its rolehas evolved (e.g., toward assessing the quality ofanalytical and advisory services), QAG’s method-ology and findings have been internalized through-out operations. In addition, since last year,structures and functions have been introduced tobridge gaps identified in previous AROEs (OED2001b, pp. 11, 22) on safeguard compliance,trust fund use, and partnerships. These includethe Integrated Safeguard Data Sheet, the TrustFund Reform Program, the Trust Fund QualityAssurance and Compliance Unit, and the Part-nership Assessment Tracking System. It is stilltoo early, however, to judge their effectiveness.
The internal culture has changed. Staff andmanagers recognize the need to identify and as-
2 0 0 2 A N N U A L R E P O R T O N O P E R AT I O N S E VA L U AT I O N
4
1992: Wapenhans report recommended focus on quality atentry, supervision, and quality of portfolio.
1993: Action plan presented to Board to improve developmenteffectiveness (following Wapenhans report).
1994: Inspection Panel becomes operational.1995: Quality Assurance Group created to monitor quality at
entry; develops system for Portfolio at Risk;COSO adopted as the Bank’s internal control frameworkto help assess its controls and make improvements; Control Self Assessments workshops started.
1996: Internal Audit Department charged with assessing inter-nal controls in the Bank.
1997: Quality Assurance Group begins to assess quality of su-pervision and economic and sector work;Strategic Compact: goals articulated; Bank reorganized,decentralized; matrix management introduced.
1998: Loan Administration Change Initiative introduced; finan-cial management specialists hired; Development Grant Facility established; Quality units established in someRegions and Network Anchors.
1999: Enterprise Risk Management (risk assessment tool) in-troduced into financial complex; Monitoring and Evalu-ation Task Force established.
2000: Department of Institutional Integrity merges the formerCorruption and Fraud Investigations Unit and the Officeof Business Ethics and Integrity; Risk Management TaskForce findings; Partnership Council and Business Part-nerships and Outreach Group established.
2001: Quality Assurance and Compliance Unit established inESSD Network for safeguard compliance; PartnershipAssessment Tracking System (PATS) put in place; Guide-lines for financial assessments and financial monitor-ing reports revised; Integrated Safeguard Data Sheet,Risk Assessment and Compliance Monitoring Sheet in-troduced.
2002: Trust Fund Reforms proposed; Trust Fund Quality As-surance and Compliance Unit established; Risk Man-agement Secretariat to Management Committeeestablished.
M i l e s t o n e s i n t h e C o n t r o l F r a m e w o r k f o r R i s k M a n a g e m e n t
B o x 2 . 1

sess risks and to put in place mitigation measures.Project appraisal processes and implementationprogress reporting reflect risk assessment andcompliance. Managers receive regular reports in-corporating risk assessments and have responsi-bility for managing the risks. At the same time,the increased focus on risk assessment (combinedwith inadequate support systems and mixed own-ership of institutional priorities among Regionalmanagers and borrowing governments) has fos-tered risk-averse behavior. The increased costs ofcomplying with environmental and social safe-guard policies are resulting in Bank and borroweravoidance of high-risk, high-reward operations.5
A shift to country-level risk management and at-tention to strengthening fiduciary and safeguard
processes at a country level may help to containthe cost of doing business in individual projectsand avoid enclave operations that cannot easily bescaled up. In addition, the tightening of mecha-nisms for safeguard compliance will have to bematched by adequate systems for mea-suring out-comes, mediating conflicts, and building bor-rower capacities to deliver socially andenvironmentally sustainable results. There is notyet a coherent approach to risk managementthroughout the institution, although senior man-agement has begun to develop an integrated ap-proach to address remaining significant gaps in theaccountability and learning system. Both the gapsand measures to address them are described inChapters 3–6.
T H E C O N T R O L E N V I R O N M E N T
5
The 1990 World Development Report (WDR) on Poverty was fol-lowed by a Policy Paper and an Operational Directive that ar-ticulated the Bank’s mandate to combat poverty. A decade laterOED found that this strategy had a significant and positive im-pact on the Bank’s operational work.
At a country level, Country Assistance Strategies (CAS) haveimproved their poverty focus; the second CAS retrospectivefound that the percentage of CASs with satisfactory or betterpoverty focus increased between FY96 and FY99 from 20 to 67 per-cent. In addition, the Poverty Reduction Strategy Paper (PRSP)introduced in 1999 is to provide the basis for a country-driven,results-oriented framework for assistance. As of end-2001, 52
low-income countries had completed either Interim PRSPs or fullPRSPs, and another 7 were under way.
At a sectoral level, the nine sector strategy papers pro-duced between FY97 and 01 had explicit links to poverty re-duction.
At a global level, the Bank published a second WDR on At-tacking Poverty in 2000. In the past two years, the Bank hasbeen refining its strategic framework to customize its assistancefor middle- and low-income countries and for low-income coun-tries under stress. In addition, DEC, working with Networks,has identified a set of indicators to measure progress in reach-ing the Millennium Development Goals.
I n c r e a s i n g F o c u s o n P o v e r t yB o x 2 . 2


7
RISK ASSESSMENT
Risk assessment is the identification and analysis of risks to achievingobjectives, to help determine how they should be mitigated and managed.This chapter finds that risk assessment for lending activities is more
advanced than for nonlending activities (such as trust funds, grants, andpartnerships), although recent progress has been made in these areas as well.Overall, risk assessment for individual lending and nonlending products andactivities is better than for country programs as a whole. At the corporate level, riskmanagement is still at an early stage.
This chapter has four sections. The first examineshow risks are assessed for lending operations in thepipeline (before Board approval) and during im-plementation. A section covering risk assessmentsfor trust funds, grants, and partnerships follows.The third section looks at risk assessment at thecountry level, and the final section covers risk as-sessment at the corporate level.
Lending: Risk Assessment for Projects inthe Pipeline and under ImplementationFor projects in the pipeline, risk assessments ten yearsago were addressed through quality controlprocesses, involving peer review and several lay-ers of managerial review. In projects for which eco-nomic rates of return were estimated, the impactof development effectiveness risks was expectedto be assessed through sensitivity analyses.1 Thesecontinue to be done where feasible, while greaterawareness of other, specific risks—fiduciary and
safeguard—has led to a more comprehensive ap-proach. For example, all investment lending musthave a financial management assessment, underguidelines revised in FY02, that identifies andcategorizes fiduciary risks and proposes mitigat-ing measures to be undertaken prior to or duringimplementation. Similarly, for safeguards, new sys-tems for ensuring compliance and for improvedrisk assessment were put in place starting in FY01.The risk assessment includes a safeguard risk re-view in each Region (box 3.1), with assistance fromthe Quality Assurance and Compliance Unit(QACU). Network Anchors support quality en-hancement on demand through Quality En-hancement Reviews. QAG assessment of theseprocesses in Quality at Entry (QAE) exercisesfound greatly enhanced quality in fiduciary aspects,and more modest progress on the quality of riskassessments and monitoring and evaluation sys-tems (table 3.1).
3
Some types of risks are normally assessed in ad-justment operations, such as ownership of policyreform, commitment, and capacity to complywith conditionality. Other risks are less consistentlyidentified and assessed, including the linkage ofpolicy reforms supported under the operation topoverty reduction; acceptance of the reforms bythe client country’s population; and fiduciary andsafeguard risks.2 All of these need further atten-tion. The revised guidelines under preparation foradjustment lending should consider how adjust-ment operations will deal more directly with thehigh-risk safeguard and fiduciary regimes thatshould be documented in the relevant CAS.
Monitoring and evaluation (M&E) are inte-gral to a robust risk management system but re-main a major weakness in project design. Withoutgood M&E, it is not possible to assess the linksbetween lending assistance and development out-comes and to assert that development objectiveshave been met. Project risk assessments would bemore reliable if they were based on past experi-ence and demonstrable results. Risk assessmentcould be further enhanced by a better apprecia-tion of the risks at a country level, including po-litical, social, technical, financial, and naturalrisks, where they are relevant to each operation.This is discussed below.
2 0 0 2 A N N U A L R E P O R T O N O P E R AT I O N S E VA L U AT I O N
8
Each Region has developed methods for assessing risks. EastAsia (EAP) pioneered the use of readiness filters, now used inboth the Middle East and North Africa (MNA) and Europe andCentral Asia (ECA) Regions, and has started a broader Coun-try Portfolio Performance Review, carried out quarterly, withparticular focus on safeguard and fiduciary risks and at-riskprojects. EAP carries out Special Operational Reviews to iden-tify issue- and country-based risks, such as child labor. InMNA, the readiness filter aims to reduce portfolio riskiness, im-prove quality of new projects, and accelerate implementa-tion, and consists of about eight indicators tailored to each
country. In addition, high-risk projects in the lending programhave a special review of the Regional Operations Committee.In the Africa Region, risk criteria include size of project, typeof project, country, and sector. ECA and the Latin America andCaribbean (LAC) Regions have a regional risk managementcommittee with representatives from within and outside the Re-gion to review all projects that are considered higher risk.LAC also reviews risks of ongoing projects twice a year as partof the portfolio review. South Asia Region, by contrast, is moredecentralized, with greater reliance on risk assessment bycountry managers.
R e g i o n a l A p p r o a c h e s t o R i s k A s s e s s m e n tB o x 3 . 1
Percent satisfactory or betterCY97 CY98 CY99 CY00-FY01
Overall quality 82 86 89 94
Fiduciary aspects 77 89 95
Risk assessment and management 72 72 73 78
Selected safeguards
Environmental assessments 94 92 91
Natural habitats 93 89 75
Forestry 75 100 89
Involuntary resettlement 90 78 87Source: QAG data.
Note: Safeguard percentages are based on small samples and differences over time are not statistically significant.
Q u a l i t y o f R i s k M a n a g e m e n tP r o c e s s e s
T a b l e 3 . 1

Projects under implementation. In 1992, theWapenhans Report recommended moving awayfrom a project-by-project approach to portfoliomanagement and adopting a country-based ap-proach. This was done with the introduction ofCountry Portfolio Performance Reviews (CPPRs),which look for countrywide systemic risks to de-velopment effectiveness of ongoing projects andmeasures to address them. CPPRs are still usedtoday and are supplemented by the Portfolio atRisk (PAR) system, introduced in 1996 by QAG.The PAR identifies projects at risk as well as theextent to which actions have been taken on riskyprojects. These data are now used not only at acountry level, but also by Regions, Network An-chors, and at the corporate level. The PAR hasthus served to sharpen the institution’s awarenessof development risk management. On the otherhand, the absence of quantitative performance in-dicators related to the weakness of project M&Elowers the credibility and increases the com-plexity of the Bank’s performance measurementapproach.
In turn, the reliability of the systems for assess-ing portfolio at risk may have decreased over timeas staff faced incentives to avoid signaling risk.3
QAG is proposing revisions to improve the reli-ability and realism of assessed outcomes. In ad-dition, monitoring of risk mitigation by theborrower during project implementation has notkept pace with risk assessment during the ap-praisal process. It was only in mid-FY02 (four yearsafter the Bank introduced guidelines for financialassessments of investment projects prior to Boardapproval), for example, that the Bank added therequirement to report on the status of financialmanagement in supervision reporting. OED, too,could enhance accountability by more systematicreliance on verifiable performance indicators in itsevaluations and more rigorous monitoring of fi-duciary and safeguard compliance in Bank oper-ations.
Grants, Trust Funds, and PartnershipsGrants have become increasingly important in theBank. Although they do not entail financial risksto the balance sheet, they do carry many of thesame development and reputational risks as lend-ing operations, as well as other risks (box 3.2). Over
the years, OED has highlighted weaknesses in thecontrol framework and evaluation of grants.4 Since1998, in particular, these aspects have beenstrengthened. The 1999 operational policy forgrants has made the eligibility criteria more trans-parent. The Development Grant Facility (DGF),also set up in 1998, has improved progress re-porting and introduced stricter guidelines for exitcriteria and periodic monitoring. In line withOED recommendations contained in a grantprocess review,5 evaluations of major programshave been carried out, which help ensure better ac-countability in the use of funds, although the de-gree of independence has varied substantially acrossthese evaluations.6 Further improvements are calledfor in four areas highlighted in the 1998 review.These include use of outside experts to enhanceobjectivity and strengthen technical expertise in theapproval process; strengthening further the arm’s-length relationship in programs that are substan-tially in-house to avoid real or perceived conflictof interest;7 strengthening and monitoring exitstrategies, to avoid indefinite dependence on Bankfunding; and uneven grant completion reporting,financial reporting, and evaluation to strengthenaccountability.
Trust Funds. In FY93, OED noted that fewtrust funds, apart from a few large ones, weresubjected to consistent procedures for approvals,reporting, or self-evaluation. Successive OEDstudies have traced incremental improvementsin these processes. But in the wake of internal re-views and audits, the Bank undertook a reformof trust fund management in FY02 to simplifytheir use and improve controls at all levels. Thereform includes: (i) integrating trust fund allo-cations better into resource planning of the Bank;(ii) simplifying and standardizing criteria for el-igibility and replacing ex ante approvals by donorswith more thorough and timely ex post report-ing; (iii) introducing an administrative fee. Theaction plan includes strengthening the monitor-ing and reporting on the use of the trust funds,a completion note, and more comprehensive anddetailed reporting to donors. A Trust Fund Qual-ity Assurance and Compliance Unit (TQC) hasbeen set up. Training and a certification procedurewill soon be put in place for staff responsible foruse of the trust funds. These initiatives are wel-
R I S K A S S E S S M E N T
9

come and should be monitored in the future bythe Internal Audit Department (IAD).
Partnerships have grown dramatically in thepast ten years. Reliable figures on the total num-ber of partnerships, the administrative funds in-volved, or the flow of managed funds throughpartnerships are not yet captured systematicallyin the Bank’s information systems. In recognitionof the risks involved (box 3.2), the control envi-ronment has been strengthened. In FY99 thePartnership Council was established to provide ad-vice and share information, and in FY00 theBusiness Partnership and Outreach Group was re-organized to provide guidance on partnershipswith private sector entities. In FY01, explicit cri-teria for new partnerships were established. InFY02, a pilot Partnership Approval and TrackingSystem (PATS) was put in place to integrate sev-eral processes into one, including grant applica-tion, a trust fund initiating brief, approval ofsenior management through a concept note, andrisk assessment for partnerships. The PATS will
also provide centralized information in real timeon the Bank’s regional and global partnerships.
Some gaps need further attention. Most part-nerships are open ended, lack clear performanceobjectives, and do not delineate precisely the dis-tinct accountabilities and obligations of partners.The lack of distinction between partnership andglobal programs, or among global, institutional,and regional partnerships, makes it unclear whencriteria for global and regional partnerships apply.Until PATS can capture all ongoing partnerships,senior management cannot have a complete pic-ture of aggregate or systemic risks of Bank part-nerships. Finally, although Network Anchors areresponsible for preparing new programs and over-seeing ongoing ones, accountability is diffuse forglobal strategy formulation and for “quality atentry” and other aspects of quality assurance cur-rently shared among Legal, Resource Mobilizationand Cofinancing, OPCS, and Strategy and Re-source Management. This fragmentation, in turn,clouds accountability for outcomes.
2 0 0 2 A N N U A L R E P O R T O N O P E R AT I O N S E VA L U AT I O N
1 0
Grants are resources provided out of Bank income for special pro-grams. They include country-based grants such as the InstitutionalDevelopment Fund; post-conflict support to particular countries;and grants made in partnership with other donors, such as theConsultative Group on International Agricultural Research.
Trust funds are resources provided by other donors or agen-cies, entrusted to the Bank for use in a wide range of modalities.They include the Heavily Indebted Poor Countries Trust Fundand the Global Environmental Facility; programmatic trust funds,such as Japan’s Policy and Human Resources Development Fund;consultant trust funds; and single-purpose trust funds.
In addition to development effectiveness risks, risks of bothgrants and trust funds include: dependency, using outside sup-port for activities that would otherwise make claims on Bankor client resources; strategic, arising from approving grants oradministering trust funds for purposes that may not align withthe Bank’s priorities; and cost-effectiveness, arising from thecosts of administering smaller grants or trust funds, with diverse
arrangements. In addition, grants may not be limited to situationswhere lending is not appropriate and no other source of fund-ing is available (subsidiarity principle). For trust funds, fiduci-ary and reputational risks can arise from a failure to fulfillagreements with donors.
Partnerships are operational relationships with other insti-tutions, entailing shared objectives but distinct accountabilitiesand reciprocal obligations. They may be partly funded throughthe DGF or trust funds. They bring important benefits, includingopportunities for mutual learning about development assis-tance, leveraging administrative resources and Bank financing,broadening reach, and facilitating delivery of regional and globalpublic goods. But they also carry significant risks, including de-velopment effectiveness, if partners prove ineffective or ineffi-cient in their role; reputational, if partners engage in activitiesinconsistent with the Bank’s mandate; and unfair advantagerisk (partners should accept limits to publicity of their partner-ship with the Bank).
G r a n t s , T r u s t F u n d s , P a r t n e r s h i p s : W h a tT h e y A r e , W h a t R i s k s T h e y M a y I n v o l v e
B o x 3 . 2

Risk Assessment at the Country LevelMany elements of risk assessment at the countrylevel have been carried out for years. These includecredit risk analysis (integral to decisions on lend-ing to IBRD countries) and the use of perform-ance assessments as a guide for allocating IDAresources. More recently, the Bank increased andimproved instruments for core diagnostics, ofwhich two are used to determine eligibility forPoverty Reduction Strategy Credits (PRSCs) (box3.3). The choice of instruments has broadened andcurrently provides a substantial tool kit for coun-try risk assessment.
Quality management of some of these instru-ments could be further improved and managementis taking actions: CPARs and CFAAs have beenmainstreamed as core ESW products, which shouldprovide greater management attention to theirquality and delivery, removing gaps in coverage,and their systematic use in preparation of Coun-try Assistance Strategies. Additional improvementsshould occur as guidelines are refined on the scopeand content of these exercises and Bank staff gainmore experience and learn from best practices.8 An-other area that needs attention is potential over-lap with other donors, including the IMF, who haverelevant diagnostic instruments, in order to avoidcreating a burden on client countries.9
The CAS, since its inception in FY91, has in-cluded a section on risks, although the assess-ments need further sharpening and coverage. The
CASs do not generally distinguish between coun-try risks and risks to the implementation of theBank’s strategy, and OED found in its CountryAssistance Evaluations that CASs often minimizerisks or fail to mention important ones (AnnualReview of Development Effectiveness [ARDE] 00,pp. 22–23).
Following up on the work of the Middle-Income Countries Task Force, Europe and Cen-tral Asia Region (ECA) has begun to integratepublic expenditure reviews (PERs), CFAAs, andCPARs into a single assessment, and East Asiaand Pacific Region (EAP), specifically in the Philip-pines, is trying to do this in conjunction with theCAS. In other Regions, welcome integrative effortsare also under way. Such integrated analysis willpermit a more comprehensive view of countryrisk and development challenges. A yet more com-prehensive approach is suggested in box 3.4.
Risk Assessment at the Corporate LevelSenior management is putting in place an inte-grated approach to risk management for Bank ac-tivities. In 2000 the Risk Management Task Forcerecommended that the recently created Manage-ment Committee address risks related to the Bank’sdevelopment effectiveness and reputation. AsOED pointed out, this is a critical and appropri-ate role for senior management. For risk manage-ment at the senior level to be effective, the strategicrisks of policies and corporate goals need to be de-
R I S K A S S E S S M E N T
1 1
Country Procurement Assessment Reports (CPARs) and CountryFinancial Accountability Assessments (CFAAs) are tools to di-agnose procurement systems and financial accountability sys-tems in client countries. CPARs have been carried out for manyyears as a fiduciary requirement for Bank lending. In 1998 newguidelines broadened them to serve a developmental objectiveas well. The first CFAAs were in 1998 and as of end-FY01, 22 hadbeen carried out; they have continued to evolve in scope and con-tent since their introduction.
Starting in FY01, the CFAA and CPAR are two of the five corediagnostic economic and sector work (ESW) elements for eachborrower. Public Expenditure Reviews are a third core diagnostic
report, which analyze the equity, efficiency, and effectivenessof public spending allocations and management (the other twocore diagnostic reports are poverty assessments and country eco-nomic memorandum/development policy review).
In addition, the Bank and Fund have a joint program for as-sessing the vulnerability of a country’s financial system. The Fi-nancial Sector Assessment Program (FSAP) was started towardthe end of FY99 as a response to the Asian crisis, and as of end-December 2001, 18 FSAPs had been completed and 18 wereunder way in client countries. The results of these assessmentsoften feed into Bank assistance strategies, operational work, andpolicy dialogue on structural reform.
R i s k A s s e s s m e n t T o o l s a t t h e C o u n t r y L e v e l
B o x 3 . 3
fined, priorities established for which control gapsand overlap need attention, and accountabilitiesclarified throughout the institution for risk man-agement at the country, sector, and project levels.In addition, better information flows in both di-rections (upwards about risks and downwardsabout priorities and tolerances) are needed.
The Board, through both the Audit Commit-tee and CODE, will need to provide oversight to
this system and to confirm its request for OEDand external auditors to attest to the adequacy ofrisk management arrangements. In particular,Board oversight bodies should ensure that thecontrol mechanisms (including audit, evaluation,and control) are properly designed, are allowed tooperate without interference, and are effectivelyconnected to day-to-day management through ap-propriate mechanisms.
2 0 0 2 A N N U A L R E P O R T O N O P E R AT I O N S E VA L U AT I O N
1 2
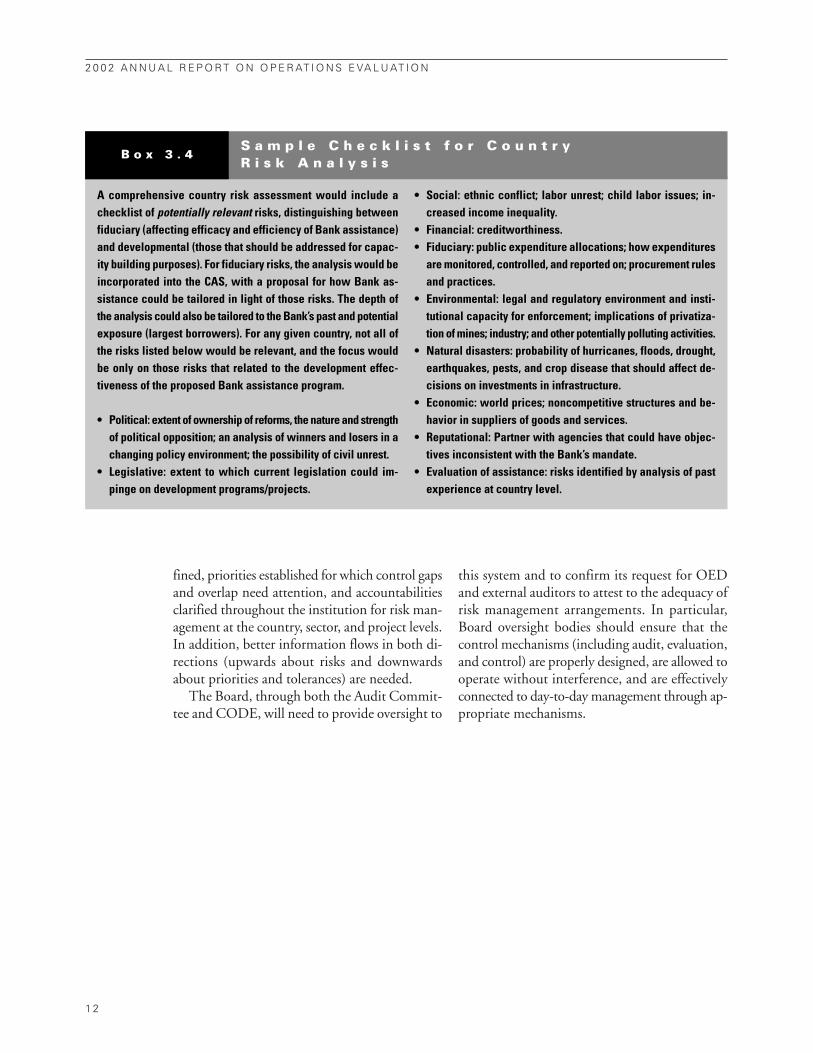
A comprehensive country risk assessment would include achecklist of potentially relevant risks, distinguishing betweenfiduciary (affecting efficacy and efficiency of Bank assistance)and developmental (those that should be addressed for capac-ity building purposes). For fiduciary risks, the analysis would beincorporated into the CAS, with a proposal for how Bank as-sistance could be tailored in light of those risks. The depth ofthe analysis could also be tailored to the Bank’s past and potentialexposure (largest borrowers). For any given country, not all ofthe risks listed below would be relevant, and the focus wouldbe only on those risks that related to the development effec-tiveness of the proposed Bank assistance program.
• Political: extent of ownership of reforms, the nature and strengthof political opposition; an analysis of winners and losers in achanging policy environment; the possibility of civil unrest.
• Legislative: extent to which current legislation could im-pinge on development programs/projects.
• Social: ethnic conflict; labor unrest; child labor issues; in-creased income inequality.
• Financial: creditworthiness. • Fiduciary: public expenditure allocations; how expenditures
are monitored, controlled, and reported on; procurement rulesand practices.
• Environmental: legal and regulatory environment and insti-tutional capacity for enforcement; implications of privatiza-tion of mines; industry; and other potentially polluting activities.
• Natural disasters: probability of hurricanes, floods, drought,earthquakes, pests, and crop disease that should affect de-cisions on investments in infrastructure.
• Economic: world prices; noncompetitive structures and be-havior in suppliers of goods and services.
• Reputational: Partner with agencies that could have objec-tives inconsistent with the Bank’s mandate.
• Evaluation of assistance: risks identified by analysis of pastexperience at country level.
S a m p l e C h e c k l i s t f o r C o u n t r y R i s k A n a l y s i s
B o x 3 . 4

1 3
CONTROL ACTIVITIES
This chapter reviews the Bank’s control activities, which comprise thepolicies, procedures, and practices ensuring that management’s directivesare carried out and the institution’s mandate is fulfilled. This chapter
reviews Bank guidelines, the processes of quality enhancement for lending andnonlending, monitoring and self-evaluation of projects, and the practices ofControl Self Assessments (CSAs) and Enterprise Risk Management. Overall,control activities have been expanded and improved considerably in the past tenyears. Management should continue its activities to address remaining weaknessesin project monitoring, control activities for economic and sector work, andaccountability for CSA.
Bank Policies and GuidelinesThe Bank’s operational policies form the basicguidance for Bank staff on implementation ofthe Bank’s development strategy. The process ofconverting the former Operational Directives(OD) to Operational Policies and Bank Procedures(OP/BP) has been ongoing since 1993, and as of2001, most had been converted (box 4.1), withthe notable exception of particularly complexpolicies. Of the five still in process (poverty re-duction, adjustment lending, indigenous people,involuntary resettlement, and cultural heritage),when last year’s AROE was produced, only theOP/BP for involuntary resettlement has beensent to the Board for approval. There remains aneed to streamline the public consultation and in-ternal review processes for policy review.
Quality Assurance/Enhancement of LendingQuality Assurance Group (QAG). Since its cre-ation in 1995, QAG has occupied a central rolein quality assurance related to Bank operations.Increasingly, quality assurance has been taken upby Regions and to a lesser extent the Network An-chors, using QAG criteria, data, and techniquesfor monitoring quality at entry, quality of super-vision, and quality of ESW. Quality enhance-ment reviews (QERs), introduced by QAG toimprove the quality of lending operations at anearly stage in their design, are now used by mostRegions and some Network Anchors. Both Re-gions and Network Anchors actively follow uptrends in QAG indicators. Analysis of QAG find-ings is in the next chapter.
4

Quality Assurance Activities in the Regions andNetwork Anchors. The Regions have taken up therole of quality assurance for lending, both pipelineand portfolio, although there are large differencesamong the Regions in terms of structures, focus,and functions (see Annex 2). Five Regions (exceptEAP) initiate QERs for projects in the pipelinefor between 5 to 20 percent of projects. All Re-gions monitor the riskiness of their portfolios(box 3.1); and all have processes for focusing onproblem areas, by country and by sector.
Network roles in quality enhancement vary.The Human Development (HD) Network is themost active, initiating them on request for roughly70 percent of HD projects in the pipeline. All Net-work Anchors monitor, usually on a quarterlybasis, the quality of their respective portfoliosand contact sector managers in the Region todiscuss problems.
Regardless of the formal accountability forquality, it is clear from interviews with staff in bothRegions and Network Anchors that, in practice,Regions bear the major responsibility for quality.Network Anchors provide quality enhancementon demand through cross support, peer review,and QERs. Although they monitor quality on aregular basis, staff in anchors and in sector “qual-ity units” do not “control” quality at entry orquality of the portfolio, but function instead asa support service. The extent to which networkmanagement can be held accountable for qualityassurance remains unclear.1
Support activities for safeguard compliance havebeen strengthened. It was only in 1997 that theconcept of safeguard policies was introduced, andten policies relevant to safeguards were identified.Prior to that, compliance with individual policieswas ad hoc and inadequately monitored. In FY01,
the Quality Assurance and Compliance Unit(QACU) was established in the Environment andSocially Sustainable Development Network withsubstantial resources to ensure appropriate risk as-sessment and facilitate compliance with guidelines.The Safeguard Management and Review Team(SMART) was set up in 2001 as a safeguard sec-tor board, with representatives of QACU, OPCS,the legal department, and the Infoshop: its mainfunction is to clarify guidelines and review issuesarising in Bank policies and practices on safe-guards.
In FY02, the Integrated Safeguards Data Sheet(ISDS) was introduced for use by task managers,identifying the safeguards involved in investmentprojects. The ISDS is to be part of the Project In-formation Document (PID), and thus availableto the public. In addition, for internal use, selectedprojects also must have a Risk Assessment andCompliance Monitoring sheet. IAD recently au-dited the ISDS and found that the system is per-forming adequately but its reliability and efficiencyhave not yet been tested conclusively.
Monitoring and Self-Evaluation at theProject Level Monitoring at project level is important for ensuringthat management’s directives are carried out and formeasuring whether the anticipated inputs, out-puts, and outcomes have been achieved. Self-eval-uation at the project level is critical to assessingcausality between inputs, outputs, and outcomes,and measuring to what extent the institution’smandate is being fulfilled through lending.
The system of monitoring in projects remainsweak, in spite of repeated OED and QAG rec-ommendations and episodic efforts over the lastdecade to strengthen it (box 4.2). This has been
2 0 0 2 A N N U A L R E P O R T O N O P E R AT I O N S E VA L U AT I O N
1 4
Although senior management and Executive Directors are reg-ularly provided with information on conversions under way, withexpected completion dates, further information is needed tostrengthen oversight of the process: (i) how many and which ex-isting ODs and their predecessors, Operational Manual Statements,
still need conversion to OP/BPs, and which ODs and their pred-ecessors are no longer valid and will not be converted; (ii) a listof all conversions in process, and their stage of conversion; (iii)a timetable for the conversion of those under way; and (iv) a listof OP/BPs needing an update and a proposed timetable for this.
C o n v e r s i o n a n d U p d a t i n g P r o c e s s o f O P / B P : P r o g r e s s R e p o r t i n g
B o x 4 . 1

attributed to a combination of lack of incentivesand guidelines for Bank staff, and limited borrowercapacity. To date, the Bank has responded with in-creased levels of training for Bank staff and a pro-gram of Evaluation Capacity Development inborrower countries (see Chapter 5, box 5.1), butas yet, there is no coherent framework, set ofguidelines, core staff, database, or thematic groupthat can guide these efforts. To provide an over-arching framework for both self-evaluation and in-dependent evaluation, a concise Operational Policy(OP) should be prepared. This OP would serve asthe logical and appropriate umbrella for subsidiarydocuments, including a Bank Procedure (BP) onthe “Generation, Dissemination, and Utilizationof the OED Findings,” and would also provide theframework for incorporating evaluation and self-evaluation policies and procedures into the up-coming OPs on the mainstays of operational work.
Project evaluation has seen better progress thanmonitoring, within the context of new guide-lines for implementation completion reports(ICRs) issued in 1995. OED reviews the qualityof the ICRs in terms of compliance with guide-lines and ratings (on outcome, sustainability, andinstitutional development impact). Out of 286FY01 ICRs reviewed as of end-February 2002, 92percent were satisfactory, compared to an his-toric average of about 95 percent. Rating changesbetween ICRs and OED’s evaluation summarieshave remained relatively constant for outcomein the last few years, with a net rating change (thepercentage of ratings downgrades minus upgrades)of around 4 percent (see Annex 1 for details).
In FY00, the Bank reformed the ICR processfurther, with the introduction of Intensive Learn-ing ICRs (ILIs); about 30 percent of the projectswere to have a more in-depth report. In FY00 and
C O N T R O L A C T I V I T I E S
1 5
The Bank has long recognized weaknesses in project-levelM&E and made efforts to address them. The 1992 Wapenhansreport pointed out weaknesses and a 1994 review by OED foundlax enforcement of existing guidelines and directives and rec-ommended enhanced staff training, recruitment of staff withM&E skills, and a focus on selected sectors. In 1995 OED notedsome improvement in the incorporation of key performance in-dicators in appraisal reports. In 1996, the logical framework (logframe) was introduced, to enhance the development of appro-priate monitoring indicators of inputs, outputs, outcome, and im-pact. A Bankwide Working Group on M&E was established in1999, which made further recommendations, including devel-oping evaluation capacity in client countries on a pilot basis.
In spite of these initiatives, OED found that monitoring sys-tems for implementation had been put in place in only 60 per-cent of projects that exited in FY01, the same level as four yearsago. The quality of the five components of the monitoring sys-tems (clear objectives; a set of indicators; clear responsibilityfor data collection and management; capacity building; andfeedback from M&E) has improved steadily over the last fouryears; in operations exiting in FY01, 59 to 78 percent of the com-ponents were judged to be high or substantial. QAG found in the
fourth Quality at Entry Assessment, covering operations throughFY01, that monitoring implementation progress had improved to91 percent satisfactory or better, but arrangements for measur-ing outcomes and evaluating impact remain, at 73 percent sat-isfactory or better, among the weakest aspects of quality. Perhapsmost critical, during implementation, OED rated the use of per-formance indicators and borrowers’ provision of M&E data assubstantial or high in only 40 percent and 36 percent (respec-tively) of operations exiting in FY01.
The M&E Improvement Program was launched by OPCS inFY01 to address some of these weaknesses, in Bank and bor-rower operations, including work at the national and sectorlevel, as well as at the project level. The program includes ef-forts to increase the Bank’s own M&E capacity, focused initiallyin two Regions (AFR and ECA) and two sectors (HD and Com-munity-Driven Development) and efforts to improve evaluationcapacity development in borrower capacity in seven pilot coun-tries, focused at a country and sector level, rather than a proj-ect level. If these efforts are successful, improvements shouldbe visible in QAG and OED evaluations in the future.
Source: OED and QAG data.
E f f o r t s t o S t r e n g t h e n M & E O v e r t h e P a s t D e c a d e
B o x 4 . 2

the first half of FY01, only 10 percent of theICRs were ILIs. OED found no significant dif-ference in quality between the ILIs and moreconventional ICRs (see Annex 1). Further im-provements in ICR guidelines are needed. For ex-ample, they should be tailored to AdjustableProgram Loans and Learning and InnovationLoans, as these are new products. In addition,more demanding standards for performance in-dicators should be introduced in order to en-hance the credibility of evaluation ratings.
Quality Assurance for Economic and Sector Work (ESW)Until FY97, there was little self-evaluation or in-dependent evaluation of ESW; the main forms ofquality assurance for ESW were peer reviews andmanagerial oversight. In July 1997, the Bank in-troduced Activity Completion Sheets (ACSs) inan effort to initiate systematic self-evaluation,but few ACSs are filled in. In 1998, QAG beganto assess formal ESW, based initially on method-ology proposed by OED, and later expanded toinclude dissemination and early indicators oflikely impact. Based on a sample of reports, QAGhas found an improving trend in overall quality,from 72 percent satisfactory in FY98 to 91 per-cent in the FY01 cohort.2
In the past, QAG has drawn its sample froma population that excluded informal or “un-scheduled” ESW and process activities, such ascountry monitoring briefs, economic modeling,risk assessments, and work on the Country Pol-icy and Institutional Assessment (CPIA). Theseactivities comprised about one-quarter of totalBank resources on ESW over the FY98-01 period.In addition, substantial analytic work financedthrough trust funds such as the Energy SectorManagement Assistance Program (ESMAP), Pub-lic Private Infrastructure Advisory Facility (PPIAF),and the Water and Sanitation Program, was not
part of the ESW population sampled by QAG forquality. These missing categories are expected tobe included in new guidelines to be issued byOPCS. In addition, QAG has an ongoing pilotto assess the country-level integration of all ana-lytic and advisory activities in three countries,with a plan to shift in this direction in FY04.
Control Self-Assessments and EnterpriseRisk ManagementIn addition to control activities that focus onspecific Bank products, the process of Control Self-Assessment (CSA), introduced into the Bank in1998, identifies risks within the control envi-ronment and cultural factors in business unitsthat can affect other controls, and develop actionplans to address the risks. Some 142 CSAs hadbeen carried out Bankwide as of March 2002 (ofwhich 111 were in FY98–00), under the leader-ship of Controllers. The tool has the potential tostrengthen risk management, but its confidentialityto the business unit level has made the account-ability chain for managing the risks and moni-toring follow up actions unclear. If systematicrisks emerged from CSAs, senior management wasnot able to assess them because of the confiden-tiality of the process. In addition, coverage byCSA of business units within the institution hasbeen uneven. These drawbacks are expected to beaddressed by reporting to senior management onCSA results and by a plan that has been formu-lated to achieve more representative coverage, aswell as broadening the scope of the CSA to includeoperational risks.
Enterprise Risk Management (ERM) is an-other control activity introduced into the finan-cial complex in 1999 to perform a more detailed,thorough risk assessment of business processes. Ithas been piloted in one country office in theSouth Asia Region in 2001, although results arenot yet available on its replicability.
2 0 0 2 A N N U A L R E P O R T O N O P E R AT I O N S E VA L U AT I O N
1 6

1 7
MONITORING
Corporate monitoring has been strengthened in the last five years throughQAG reviews; OPCS reviews of CASs, ESW, and Sector Strategy Papers;introduction and improved methodology by OED of country evaluations;
and strengthened evaluations within DEC and WBI. Nevertheless, aggregatemonitoring of inputs, outputs, outcomes, and impacts at a sectoral, country, andglobal level still faces significant challenges. With increased focus, both internaland external, on Bank performance, clear accountability for self-assessments andimproved monitoring at all levels will be required.
Within the COSO framework, monitoring is theuse of either independent methods or externaloversight to measure whether the internal controlsare adequate and the objectives are being met. Thisis distinct from project-level monitoring, whichwas discussed in Chapter 4 under control activ-ities. In this chapter, we review the independentmethods used within the Bank at an institutionallevel to determine whether the Bank objectives arebeing met at a country, sectoral, and corporatelevel, including training and research activities.
Monitoring Projects and ESW at the Corporate LevelThe past five years have seen the introduction ofimproved monitoring at the corporate level oflending operations. Portfolio performance hasbeen reported for over a decade, but QAG nowuses a more systematic and real time methodol-ogy (the Portfolio at Risk system), drawing on
country portfolio performance reviews for thecountry-level perspective. Because QAG findingsare presented to CODE and the Board at thesame time as OED’s ARDE, Board members cansee trends in both the active and closed portfo-lio. In FY01, QAG reported on the quality of ESWfor the first time.
As noted in Chapter 2, QAG has been instru-mental in improving aggregate monitoring of thelending and nonlending portfolios. For the last fiveyears, it has regularly reviewed and reported onthe quality at entry (QAE) of lending operations,the quality of supervision, and the quality ofESW. QAE ratings, which are based on randomsamples of projects, are aggregated and tracked bymanagement as indicators of trends in the healthof the overall portfolio. Are they a reliable lead-ing indicator of the project’s eventual outcome?Of the 42 QAE-rated projects that have nowclosed with outcomes evaluated by OED, 93 per-
5
cent were satisfactory or better at the time ofentry and 81 percent had satisfactory outcomes.Three hundred QAE-rated projects are still underimplementation: 86 percent of these projects weresatisfactory at entry and 83 percent are currentlyrated as “nonrisky” in the PAR system. OED rat-ings on outcome are historically some 10 per-centage points lower than final supervision ratings,and although PAR status is not identical to su-pervision ratings, it is determined primarily by im-plementation progress rather than by developmenteffectiveness considerations. Thus PAR ratingsmay also overstate the likely project outcome interms of development effectiveness (see Annex 3for discussion). Putting these factors together,QAE ratings are likely to be some 10 percentagepoints higher than final outcome ratings.
Now that the Regions have enhanced theirrole in quality assurance, QAG has shifted itsmonitoring focus to other areas. In FY02, for ex-ample, QAG focused its review of supervisionon risky projects; did a special review on the qual-ity of fiduciary ESW; and introduced a pilot as-sessment of advisory activities (AAA) on a countrybasis and a pilot assessment of sector board con-tributions to operational quality. This evolutionreflects a shift to a more strategic level. Manage-ment should now clarify its longer-term vision forQAG’s evolving mandate.
In the last five years, OPCS has carried out anumber of corporate-level reviews to examine,from an institutional perspective, the quality ofBank activities, including adjustment lending,ESW, Sector Strategy Papers, and CASs. Theseserve to review the extent to which these activi-ties have complied with the Bank’s strategy andguidelines, to examine strengths and challenges,and to make recommendations for improvement.
Finally, since its creation in FY94, the Inspec-tion Panel has played a critical role as an inde-pendent structure in monitoring compliance ofBank operations with safeguard policies. It was es-tablished to respond to complaints from externalclients or affected people. It reports directly to theBoard.1 As of end-December 2001, the Inspec-tion Panel had received requests to inspect 25lending operations, of which twelve were inves-tigated (the remaining were either ineligible or in-admissible claims). The resulting reports have
highlighted important control weaknesses, suchas ambiguous policies and overemphasis on lend-ing approvals at the expense of quality.
Sector and Thematic Monitoring and EvaluationWhen they were created in 1996, the Networkswere not given an explicit mandate to monitorsectoral or thematic inputs, outputs, or out-comes across their respective sectors or themes.Accordingly, few Sector Strategy Papers (SSPs)produced since 1997 have incorporated evalu-ative work to inform future directions (ARDE2000); none provided a baseline against whichto measure progress in implementing the strat-egy; and only one of the nine SSPs reviewed byOPCS discussed monitoring responsibilities.With the introduction of the MDGs, the Net-works have begun to work with DEC to help de-fine more detailed indicators relevant to theirdomain. These efforts have been reinforced fol-lowing the Strategic Forum in January 2002,which placed a high priority on monitoring theBank’s results on development. A special unit hasbeen set up under the control of the Bank’s sen-ior management to focus on putting a workablesystem in place, and efforts have been made toidentify—together with the Network Anchors—pilot countries and indicators for developingbaseline data against which Bank efforts and re-sults can be measured.
It is still too early to assess the results of thisinitiative. A corporate effort to develop sectoralperformance indicators was launched in the early1990s, but soon fizzled out. The proposals weretoo complex and the resources allocated for out-reach, capacity building, and training were inad-equate. Except for information required fortracking the MDGs, most Network Anchors donot yet have easily retrievable data on inputs,outputs, and outcomes in their respective sec-tors, subsectors, and thematic areas. They do nottrack quantitative outputs or outcomes of Bankassistance (except for noting percent of outcomesrated at risk or unsatisfactory by QAG and OED)and are far from being in a position to attributeimpact on indicators to Bank assistance. The con-straints to monitoring and evaluating sectoraland thematic assistance are due not only to the
2 0 0 2 A N N U A L R E P O R T O N O P E R AT I O N S E VA L U AT I O N
1 8
current system of sector coding, now being revised(Chapter 6), but also to an absence of clear mon-itoring methods, resources, and accountability.
Country-Level EvaluationSince the early 1990s, the country has becomethe focal point of the Bank’s strategy formulation.In parallel, the importance of country-level eval-uations has increased as well. The introductionof Country Assistance Strategies (CASs) in FY91was further reinforced by increased decentral-ization of Bank operations in FY97. But for mostof the 1990s, CAS documents were mainly for-ward looking, and largely silent on evaluating theoutcomes of past Bank assistance. In the lastthree years, steps have been taken to improveevaluation at the country level both within theBank and in client countries. Aside from ninepilot countries that were selected in FY98 for moreintensive CAS self-evaluation, a FY00 CAS ret-rospective found that only 16 percent had satis-factory self-evaluation. Starting in 1995, OEDhas carried out some 55 independent evalua-tions of assistance using the country as the unitof account (Chapter 7 has results of tracer stud-ies of these evaluations). On this basis, it has de-fined a methodology that, once adopted byRegional managers, should enable country unitsto carry out systematic self-evaluation, with QAGto check on their quality.2
The impetus to improve the Bank’s self-eval-uation has been mirrored by attempts to improvemonitoring and evaluation in client countries.The Task Force on Evaluation Capacity Devel-opment (ECD) recommended in 1994 that ECDbecome an integral part of the Bank’s public sec-tor management strategy in client countries. OEDhas long sought to help countries improve theircapacity for M&E, although until 1997, when itbecame an integral part of OED’s new strategy (seeChapter 7), the efforts were relatively modestand ad hoc. Since 2000 OPCS has provided op-erational support to the Regions for ECD, focusedmainly on seven pilot countries in the M&E Im-provement Program. Country-level ECD activi-ties are now under way in about 20 countries.However, many challenges remain (box 5.1).
Other initiatives may reinforce ECD in clientcountries. In FY97, the Heavily Indebted PoorCountries (HIPC) program was launched, whichrequires countries to monitor poverty-related ex-penditures. Few have been able to do so. In FY99,the CDF was piloted in 13 countries, which focusedon long-term, participatory development; one of itsfour main pillars was monitoring results. The PRSPthat was introduced in International DevelopmentAssociation (IDA) countries in FY00 also focuseson the identification of monitorable indicators.OED, in its recent review of IDA, argued that allIDA clients should be required to set monitorable
M O N I T O R I N G
1 9
OED’s first Annual Report on Evaluation Capacity (AREC) De-velopment in the Bank (June 2002) notes that in spite of dra-matically increased activity in the past five years throughout theBank to strengthen M&E both within the Bank and in clientcountries, a number of challenges remain. These include:
• The need to clarify definitions of monitoring and evaluation.Confusion still exists between M&E and monitoring financialspending and national development indicators (monitoring fo-cuses on inputs and outputs, and outcomes, and evaluationestablishes causality and attribution and assesses efficiencyfor the outcomes).
• Improving the consistency of Bank strategies, policies, andguidelines on country-based M&E. In the context of PRSPs,the guidelines recommend assessing countries’ M&E sys-tems, but do not have a formal instrument for doing this (sim-ilar to CFAAs, CPARs) and guidelines on PRSCs do not includeany mention of strengthening a county’s M&E system as a toolfor improving governance and accountability.
• Creating a fiduciary responsibility to strengthen both Bank andclient country M&E capacities.
• Better coordination within the Bank of both ECD efforts andtraining within the Bank for M&E, through building a data base,forming a thematic group, developing Regional approaches.
S t r e n g t h e n i n g E v a l u a t i o n C a p a c i t y i n t h e B a n k a n d B o r r o w e r C o u n t r i e s
B o x 5 . 1

performance targets and to produce publicly dis-closed reports on performance (OED 2002c, p.43), and a new initiative to improve results basedmonitoring of IDA’s development impact is underconsideration.3 All of these initiatives have high-lighted the importance of monitoring and evalua-tion for accountability and improved governance.
Monitoring and Evaluation in the World Bank Institute (WBI)Ten years ago, the WBI, then called EDI, mon-itored its training activities through the use of sur-veys administered on a voluntary basis by theinstructor to trainees at the end of the course; theresults were available only to the instructor. In ad-dition, external evaluations were carried out byconsultants. OED reviewed WBI’s evaluation sys-tem in 1996 and recommended that the trainingsurveys become systematic; that the results be re-ported and used to analyze cross-cutting issues oncore courses; that evaluation be expanded to coverex post and impacts, based on measurable re-sults; that WBI become proactive in enhancingevaluation capacity in partner institutions; and thatWBI should maintain close professional linkswith OED.
In 1997, WBI instituted a more formal systemof monitoring and evaluation, which continuesto be strengthened today. Four levels of M&E wereidentified. The first, which is mainly monitoring,is feedback from trainees, now required for allWBI-sponsored training activities and reportedquarterly to senior management. The second level
is focused on performance-testing participantsbefore and after the courses; results of Level 2 onWBI core courses in FY99–01 are in box 5.2. Thisyear Level 2 has been enhanced by focusing on thequality of testing and ensuring that all 15 core pro-grams are monitored by testing in at least 2 ac-tivities in each core program.
The third and fourth levels of evaluation, out-come and impact monitoring, were launched forthe first time in FY02 for five of WBI’s thematicprograms aimed both at participants in clientcountries and staff. These evaluations measurechanges in behavior of participants and changesin their organizations or institutions. WBI has alsocontinued to do impact evaluations of large ac-tivities such as Social Policy Reform in TransitionEconomies (SPRITE) and the World Links forDevelopment. In the future, the WBI evaluationunit intends to focus on evaluation of client train-ing and capacity enhancement at a country level.
Looking ahead, WBI should further strengthenmonitoring and evaluation of training activities.Level 1 monitoring could be better exploited byanalyzing results for patterns (by program, by Re-gion, by type of course—distance learning versusface to face). The coverage of Level 2 evaluationsshould be extended to illuminate differences acrosstypes of training and core activities; the results couldfeed back into strategic decisions on future train-ing. The planned country focus of evaluation ofWBI activities should be undertaken, to the extentfeasible, in conjunction with OED’s country eval-uations to take advantage of synergies.
2 0 0 2 A N N U A L R E P O R T O N O P E R AT I O N S E VA L U AT I O N
2 0
Over the FY99–01 period, WBI delivered 237 core course offer-ings. On some 60 percent of these, both Level 1 and Level 2 eval-uations were carried out. The results from Level 1 show that 85percent of respondents found the courses useful, with Regionaldifferences (AFR, LAC, and EAP had higher ratings). Level 2 eval-uation showed a significant difference in pretest and posttest av-erage scores. Interviews with Regional staff on these course
offerings indicated a need to improve collaboration with WBI. Be-cause the selection of core course offerings that were evaluatedwas not evenly distributed across core courses or offerings, thepositive results of these evaluations are not necessarily repre-sentative of all WBI core courses. This is being addressed in FY02.
Source: WBI 2001.
L e a r n i n g A c h i e v e m e n t o f W B I C o u r s e P a r t i c i p a n t s
B o x 5 . 2
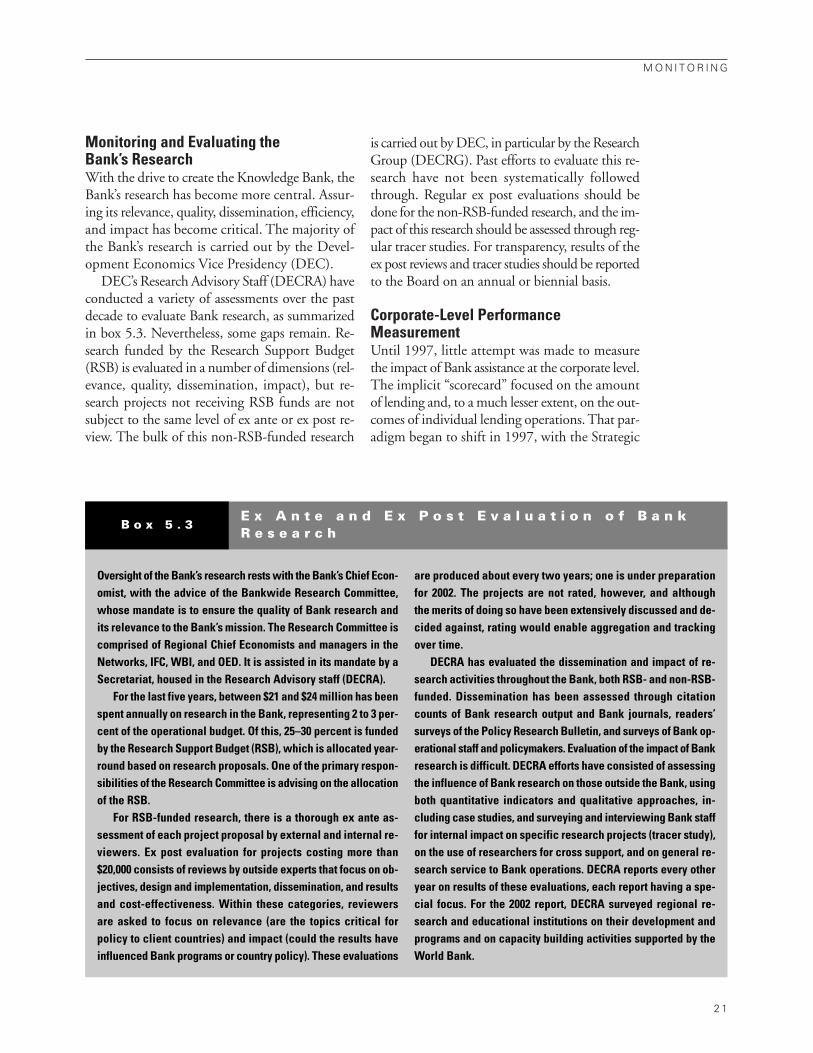
Monitoring and Evaluating the Bank’s ResearchWith the drive to create the Knowledge Bank, theBank’s research has become more central. Assur-ing its relevance, quality, dissemination, efficiency,and impact has become critical. The majority ofthe Bank’s research is carried out by the Devel-opment Economics Vice Presidency (DEC).
DEC’s Research Advisory Staff (DECRA) haveconducted a variety of assessments over the pastdecade to evaluate Bank research, as summarizedin box 5.3. Nevertheless, some gaps remain. Re-search funded by the Research Support Budget(RSB) is evaluated in a number of dimensions (rel-evance, quality, dissemination, impact), but re-search projects not receiving RSB funds are notsubject to the same level of ex ante or ex post re-view. The bulk of this non-RSB-funded research
is carried out by DEC, in particular by the ResearchGroup (DECRG). Past efforts to evaluate this re-search have not been systematically followedthrough. Regular ex post evaluations should bedone for the non-RSB-funded research, and the im-pact of this research should be assessed through reg-ular tracer studies. For transparency, results of theex post reviews and tracer studies should be reportedto the Board on an annual or biennial basis.
Corporate-Level PerformanceMeasurementUntil 1997, little attempt was made to measurethe impact of Bank assistance at the corporate level.The implicit “scorecard” focused on the amountof lending and, to a much lesser extent, on the out-comes of individual lending operations. That par-adigm began to shift in 1997, with the Strategic
M O N I T O R I N G
2 1
Oversight of the Bank’s research rests with the Bank’s Chief Econ-omist, with the advice of the Bankwide Research Committee,whose mandate is to ensure the quality of Bank research andits relevance to the Bank’s mission. The Research Committee iscomprised of Regional Chief Economists and managers in theNetworks, IFC, WBI, and OED. It is assisted in its mandate by aSecretariat, housed in the Research Advisory staff (DECRA).
For the last five years, between $21 and $24 million has beenspent annually on research in the Bank, representing 2 to 3 per-cent of the operational budget. Of this, 25–30 percent is fundedby the Research Support Budget (RSB), which is allocated year-round based on research proposals. One of the primary respon-sibilities of the Research Committee is advising on the allocationof the RSB.
For RSB-funded research, there is a thorough ex ante as-sessment of each project proposal by external and internal re-viewers. Ex post evaluation for projects costing more than$20,000 consists of reviews by outside experts that focus on ob-jectives, design and implementation, dissemination, and resultsand cost-effectiveness. Within these categories, reviewersare asked to focus on relevance (are the topics critical forpolicy to client countries) and impact (could the results haveinfluenced Bank programs or country policy). These evaluations
are produced about every two years; one is under preparationfor 2002. The projects are not rated, however, and althoughthe merits of doing so have been extensively discussed and de-cided against, rating would enable aggregation and trackingover time.
DECRA has evaluated the dissemination and impact of re-search activities throughout the Bank, both RSB- and non-RSB-funded. Dissemination has been assessed through citationcounts of Bank research output and Bank journals, readers’surveys of the Policy Research Bulletin, and surveys of Bank op-erational staff and policymakers. Evaluation of the impact of Bankresearch is difficult. DECRA efforts have consisted of assessingthe influence of Bank research on those outside the Bank, usingboth quantitative indicators and qualitative approaches, in-cluding case studies, and surveying and interviewing Bank stafffor internal impact on specific research projects (tracer study),on the use of researchers for cross support, and on general re-search service to Bank operations. DECRA reports every otheryear on results of these evaluations, each report having a spe-cial focus. For the 2002 report, DECRA surveyed regional re-search and educational institutions on their development andprograms and on capacity building activities supported by theWorld Bank.
E x A n t e a n d E x P o s t E v a l u a t i o n o f B a n kR e s e a r c h
B o x 5 . 3

Compact, which proposed the introduction of atable of indicators, which in turn became theCorporate Scorecard. The Scorecard was intendedto monitor progress toward goals and developmentoutcomes at the corporate level and was dividedinto three tiers: (i) final outcome indicators andindicators of country performance, including theinternational development goals (precursors ofthe MDGs); (ii) Bank performance, at country andsector levels, summarizing the quality of inputsand subsequent delivery in meeting objectives; and(iii) internal bank measures. The Strategic Com-pact Assessment found progress in filling in TiersIII and I, but Tier II remained largely empty(World Bank 2001b, Annex 9, p. 16). In addition,the links among the three tiers were not well de-fined. Measuring the impact of World Bank as-sistance is yet to be achieved and there is now someeffort under way to recast the Scorecard to enableit to reflect Bank performance.
The authorizing environment for perform-ance measurement is shifting. It is becoming a pri-ority at the highest levels of both the Bank andthe international community. Initiatives underHIPC since 1997 and the introduction of theCDF and PRSPs more recently have focused onmonitoring inputs and outcomes at the countrylevel. Experience with these initiatives has high-lighted the difficulties. The Strategic Forum in Jan-uary 2002 gave new impetus to measuring results,and the need to strengthen this aspect of aidmanagement was a major part of the developmentconsensus reached at the Monterrey Conferenceon Financing for Development in March 2002.
A new unit was established in February 2002,headed by a Vice President, tasked with puttingin place a system for measuring the Bank’s de-velopment effectiveness. It has focused on carry-ing out an inventory of ongoing initiatives inperformance monitoring; proposed piloting out-come-based CASs and outcome-based SectorStrategy Papers; and linked these efforts to im-plications of outcome-based approach for lend-ing and nonlending activities. The unit isconsulting broadly within and outside the Bank,and in June 2002 co-hosted with multilateral de-velopment banks (MDBs) an international round-table with representatives of the sponsoring MDBs,bilateral donors, other multilateral agencies, clients,and academia on measuring, monitoring, andmanaging for results.
These changes in the authorizing environ-ment should help the paradigm shift toward thecentrality of performance measurement, man-agement, and evaluation for accountability andbetter governance. These changes present newchallenges in methodology, in evaluative skills,and in the distribution of accountability forevaluation. Network Anchors and Regions willneed to carry out more self-assessment, incor-porating MDGs or MDG proxies into the M&Eframework, and central units will have to rely onthe Regions and Network Anchors to take onthese responsibilities. However, if the efforts inthis direction can be sustained, they should re-sult in major progress toward better country,sector, and corporate monitoring and evalua-tion in the medium term.
2 0 0 2 A N N U A L R E P O R T O N O P E R AT I O N S E VA L U AT I O N
2 2
2 3
INFORMATION ANDCOMMUNICATION
In terms of both information and communication, the Bank is a vastly differentinstitution than it was ten years ago. Information systems have been integratedand shifted to electronic form; new sector and thematic codes have been
introduced. Communications have been expanded and modernized; staff traininghas doubled; and the revised disclosure policy allows the Bank to provide betterinformation to partners. All of these changes, although not without problems, havehelped to strengthen the control framework and shift the internal culture of theBank toward better management.
Ten years ago, information systems were piecemealand fragmented. Data on projects in the pipeline,in the portfolio, on disbursements, on ESW, ongrants, on client countries were stored in some 60different data systems. Communication was largelypaper-based, filing systems were cumbersome.They provided good institutional memory, but in-boxes overflowed. New initiatives filtered slowlyand unevenly through the institution.
InformationAll of this changed dramatically over the pastdecade. Both SAP and the Business Warehousewere put in place to integrate the many sources ofinformation and to permit, in principle, efficienttracking information relevant to Bank activities andclient countries. The automated Dashboard, suc-cessor to Compass, is used by business units, par-ticularly in the Regions, as a rough and readymonitoring tool. The use of e-mail and the Intranet
has grown so that all Bank staff are now literallyon the same page when they turn on their com-puters. An Internal Communications Unit wasreestablished in 2001.
These changes have—after a period of dis-ruption—made reporting more timely and de-tailed, and information on Bank processes morereadily available across the Bank. Corporate pri-orities and strategic directions are communicatedto staff. Monthly management reports and quar-terly business reports provide information on theyear’s deliverables, budget use, and quality of theportfolio to Regional and Network managementteams. These improvements facilitate controlsand more consistent risk management. They donot yet capture significant aspects of Bank activ-ity, however. Information on partnerships, forexample, is not systematically captured by any sys-tem, and the Business Warehouse has no infor-mation on informal ESW or other AAA. The
6

reliance on e-mail has eroded institutional mem-ory, especially about the process and internal de-bates over preparing strategies and projects.1
New Sector and Thematic CodesA constraint to reliable reporting on Bank assis-tance across sectors and thematic areas is the cur-rent system of coding. Key initiatives in thematicareas such as private sector development, envi-ronment, and gender are incompletely captured.In addition, the current system is unable to reflectthe multisectoral nature of many operations. InSeptember 2001, the Bank began work on a newsystem that reflects the multisectoral and the-matic nature of Bank work and better reflectsthe corporate priorities. The new coding systemwill in principle enable the Bank to have betterinformation on its assistance, both lending andnonlending. The introduction of the new systemhas not been smooth, however. Some SectorBoards are concerned that the rapid recoding ofthe stock of operations and ESW resulted in anumber of mistakes that would need correctionbefore the system was made operational. The newsystem is more complicated than the former one(operations can be coded in more than one sec-tor and one theme; there are some 57 subsectorsand 68 subthemes). It will be vital for staff to re-ceive adequate training and for quality of dataentry to be assured.
Communication and DisclosureIn addition to the explosion in the use of the In-tranet and e-mail (connecting a decentralized andmatrix-managed institution), staff training hasexpanded. The Strategic Compact goal of doublingresources for training staff as a proportion of ad-ministrative costs was largely met, led by Networkdeliveries.2 Last year’s AROE recommended that
a comprehensive evaluation framework be devel-oped in conjunction with the New LearningFramework proposed in FY01, and this recom-mendation remains valid.
DEC and WBI have an important role to playin helping management to elaborate the Bank’snew strategic directions and the Regions and Net-works to adapt their processes to the MDGs. Itis particularly important to communicate bothwithin the Bank and externally that attainmentof these goals is dependent not only on the amountof aid but also on global and country policies.DEC and WBI can go further in engaging in anopen debate about all that is not known about thelinkages between governance, growth, good poli-cies, and poverty alleviation and encouraging fur-ther debate and research in these areas.
The Bank has revised its disclosure policy for thefirst time since 1993. The new policy provides forpublic release of a much wider range of docu-ments, including adjustment lending documentsafter Board approval; ICRs; QAG synthesis re-ports; and a wider range of OED evaluations (Per-formance Assessment Reports; process evaluations,including the AROE). This will promote greatertransparency. Past changes in the Bank’s disclo-sure policy required additional efforts by the Bankto comply with the changes. Progress reports in1995 and 1997 reported on the implementationof the policy, noting areas of progress and areaswhere further improvements were necessary, in-cluding making environmental assessment reportsavailable in a timely way. The 1999/2000 reviewof the disclosure policy found that disclosure hadfurther improved, including in the timely releaseof environmental assessment reports. The greaterdemands on disclosure will call for further efforts.Both the policy and its implementation should bemonitored and periodically adjusted in the future.
2 0 0 2 A N N U A L R E P O R T O N O P E R AT I O N S E VA L U AT I O N
2 4

2 5
OED’S AGENDA
This chapter reviews OED’s work program and evaluations carried out onits products and services over the past year. OED has continued toemphasize priority areas established in its 1997 renewal strategy:
evaluations at the country, sector, and thematic levels and resources devoted toevaluation capacity development and staff training. It needs to broaden itsevidentiary base for evaluation; strengthen and disseminate its methodologies,particularly for country evaluations; and ensure better dissemination of itsproducts and services.
For the first part of the 1990s, OED continuedto do project-level evaluation on the same basisas it had in the 1980s. It reviewed ICRs (and theirpredecessors), carried out Project PerformanceAudits on a portion (40 percent) of closed proj-ects and Impact Evaluations on a smaller pro-portion, evaluated broader themes and topics,and prepared annual reports on project outcomesand on monitoring and evaluation in the Bank.In 1997, OED adopted a renewal strategy, whichrefocused its priorities and remains valid today (seebox 7.1). As reported in last year’s AROE and re-flected by this year’s AREC, OED continues togive priority to the main objectives established inits strategy, particularly timely country, sector,and thematic evaluations; evaluation capacity de-velopment; staff training in M&E; and timely dis-semination.
Consistent with its role as independent eval-uator of Bank products and services, OED un-
dertakes each year to evaluate the quality, relevance,and efficacy of its own products and services.This year’s AROE reports on: progress on rec-ommendations in last year’s AROE; surveys ofBank and Executive Directors’ staff on OED’s re-cent products and services; and a tracer study onthe impact of Country Assistance Evaluations.
OED’s Outputs: The View from theCommittee on Development Effectiveness (CODE)OED reports directly to the Board of Directorsand CODE. It provides them with indicators ofits inputs, deliverables, and timeliness (foundhere in Annex 3, for the past three fiscal yearsthrough the third quarter of FY02). Toward theend of each fiscal year, CODE discusses future di-rections for OED and outlines areas for OED’sattention. At the April 2002 meeting, CODEendorsed OED’s proposed work program, agreed
7

with the areas of emphasis, and requested thatstudies on education and pension reform be ad-vanced. The OED work program has been ad-justed to reflect Board comments.
Recommendations from Previous AROEs Last year’s AROE highlighted four areas for at-tention, consistent with CODE’s guidance.Progress in these areas is described below.
Timeliness and relevance of OED’s productshave been strong. The majority of products pro-duced or under way in FY02 were linked to thepreparation of Sector Strategy Papers (e.g., RuralPoverty), to the revision of a Bank policy (e.g., In-digenous Peoples), or to an external review (e.g.,Extractive Industries). CAEs continue to be linkedto CAS preparation. The remaining major prod-ucts were carried out on request of the Board(such as Social Funds, Global Programs, HIPC,CDF). Last year’s AROE also suggested that OEDfocus on corporate priorities, particularly thepoverty orientation of Bank operations. CAEshave had stronger focus than in the past on povertyreduction, and most major sector and thematicstudies have as well (Rural Poverty, Social Funds,Indigenous People, and the Urban Review nowunder way, for example).
Methodology assessment has been carried outand development and dissemination have seen lessprogress than is desirable, as recent surveys haveshown. For evaluation of adjustment lending,there has been a pilot effort to group assessmentsof adjustment lending in countries and to focuson country context. OED is simplifying its proj-ect evaluation methodology and at the same time
enhancing the coverage of safeguards throughchanges ongoing in the Project Information Form.At the country level, OED has continued to re-fine the Country Information Form, as recom-mended last year, but Regional efforts to test it asa self-evaluation tool for country strategies havelagged.
Participation and communication have beenenhanced, and this year’s survey results point tothe need for further improvements. Evaluationprocesses have been more participatory and in-volved broader consultations (e.g., Social Fundssurveyed households; the CDF is a joint evalua-tion with other donors and involves extensive in-country consultations). Advisory Committees ofexternal and Bank staff are being used (e.g., Rus-sia CAE, Global Programs) and entry workshopshave become a regular feature of larger evaluations(Transition Study, China CAE). Internal mid-point workshops (Russia CAE) have also been usedto get early feedback on OED findings.
Dissemination has improved, but needs con-tinued effort. OED is putting its reports on theWeb more quickly than before and has begun pro-viding hot links to related products, but as sur-vey results show, there is further room forimprovement in disseminating sector and the-matic studies.
OED Outcomes and Impact
Client Surveys: ResultsSelf-evaluation has followed last year’s recom-mendations by continuing the annual survey ofits products and services. OED has also carried out
2 0 0 2 A N N U A L R E P O R T O N O P E R AT I O N S E VA L U AT I O N
2 6
Mission: To contribute to development effectiveness through excellenceand independence in evaluation.
Objectives: 1. Move to a higher evaluation plane, from projects to country,
sector, thematic, and global evaluations.2. Shorten the feedback loop to ensure relevance.
3. Build evaluation capacity within and outside the Bank to pro-mote self-evaluation.
4. Invest in knowledge and partnerships to maintain OED’s in-tellectual leadership and develop alliances as instruments ofstrategy.
5. Manage for results: evaluations add value if they influencebehavior and contribute to the overall success of the Bank’sstrategy.
O E D ’ s 1 9 9 7 R e n e w a l S t r a t e g y B o x 7 . 1
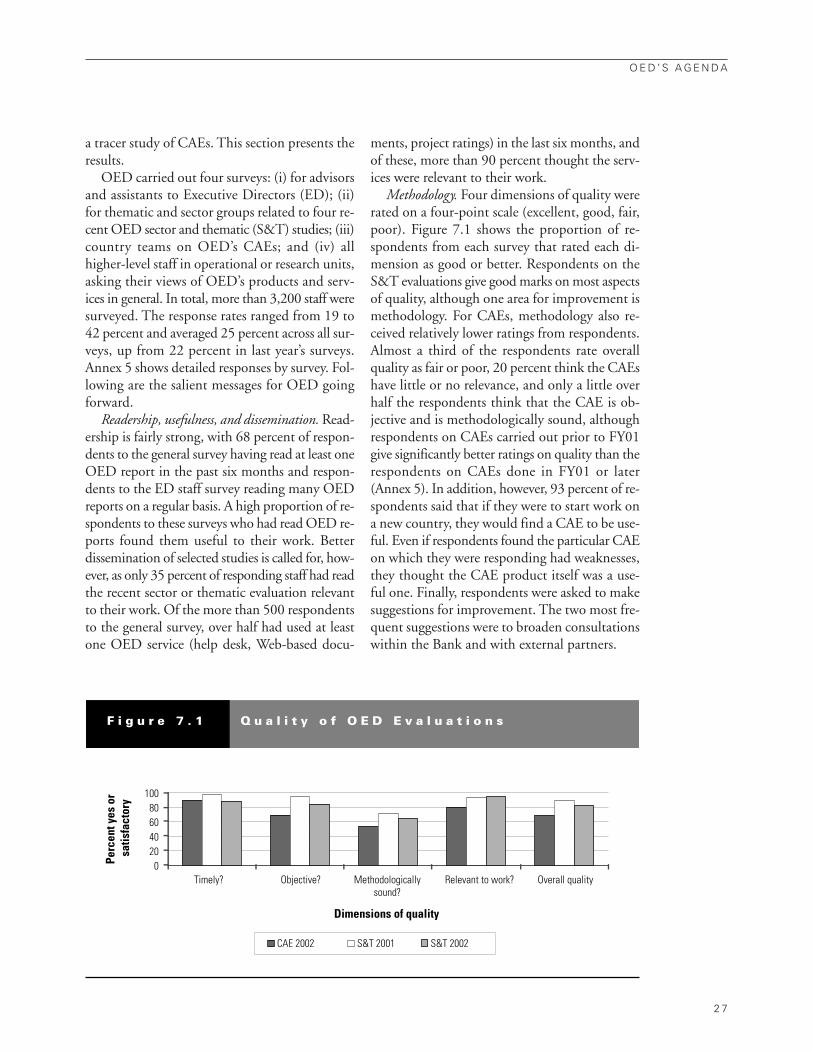
a tracer study of CAEs. This section presents theresults.
OED carried out four surveys: (i) for advisorsand assistants to Executive Directors (ED); (ii)for thematic and sector groups related to four re-cent OED sector and thematic (S&T) studies; (iii)country teams on OED’s CAEs; and (iv) allhigher-level staff in operational or research units,asking their views of OED’s products and serv-ices in general. In total, more than 3,200 staff weresurveyed. The response rates ranged from 19 to42 percent and averaged 25 percent across all sur-veys, up from 22 percent in last year’s surveys.Annex 5 shows detailed responses by survey. Fol-lowing are the salient messages for OED goingforward.
Readership, usefulness, and dissemination. Read-ership is fairly strong, with 68 percent of respon-dents to the general survey having read at least oneOED report in the past six months and respon-dents to the ED staff survey reading many OEDreports on a regular basis. A high proportion of re-spondents to these surveys who had read OED re-ports found them useful to their work. Betterdissemination of selected studies is called for, how-ever, as only 35 percent of responding staff had readthe recent sector or thematic evaluation relevantto their work. Of the more than 500 respondentsto the general survey, over half had used at leastone OED service (help desk, Web-based docu-
ments, project ratings) in the last six months, andof these, more than 90 percent thought the serv-ices were relevant to their work.
Methodology. Four dimensions of quality wererated on a four-point scale (excellent, good, fair,poor). Figure 7.1 shows the proportion of re-spondents from each survey that rated each di-mension as good or better. Respondents on theS&T evaluations give good marks on most aspectsof quality, although one area for improvement ismethodology. For CAEs, methodology also re-ceived relatively lower ratings from respondents.Almost a third of the respondents rate overallquality as fair or poor, 20 percent think the CAEshave little or no relevance, and only a little overhalf the respondents think that the CAE is ob-jective and is methodologically sound, althoughrespondents on CAEs carried out prior to FY01give significantly better ratings on quality than therespondents on CAEs done in FY01 or later(Annex 5). In addition, however, 93 percent of re-spondents said that if they were to start work ona new country, they would find a CAE to be use-ful. Even if respondents found the particular CAEon which they were responding had weaknesses,they thought the CAE product itself was a use-ful one. Finally, respondents were asked to makesuggestions for improvement. The two most fre-quent suggestions were to broaden consultationswithin the Bank and with external partners.
O E D ’ S A G E N D A
2 7
F i g u r e 7 . 1 Q u a l i t y o f O E D E v a l u a t i o n s
020406080
100
Timely? Objective? Methodologicallysound?
Relevant to work? Overall quality
Dimensions of quality
Perc
ent y
es o
r s
atis
fact
ory
CAE 2002 S&T 2001 S&T 2002

A clear challenge for OED is to continue tostrengthen and disseminate its current method-ology, particularly in CAEs, and to ensure thatboth the sources and limitations of the evidenceunderpinning the evaluations are based are pre-sented explicitly in the reports. The scope for im-proving evaluation methodology is constrained bya lack of knowledge about the ingredients neces-sary for rapid growth and poverty reduction anda lack of consensus on the role of the Bank in dif-fering country circumstances (e.g., with respectto conditionality or to social development). In ad-dition, there are different views within the Bankon whether and how to judge performance in re-lation to objectives.
Influence of OED evaluations on Bank policies andassistance. Respondents were asked to rate on afour-point scale (strongly, somewhat, little, not atall) the extent to which OED evaluations influencedtheir own views of development priorities in thecountry or sector and the extent to which the eval-uations influenced the Bank’s strategy or assistance(see table 7.1). A fairly high proportion of re-spondents this year think that the evaluations in-fluenced their own thinking and Bank strategy; asomewhat lower proportion think that OED hashad an influence on lending and nonlending as-
sistance. This is consistent with the findings fromthe CAE tracer study discussed below.
Results of the CAE Tracer StudyCAEs have become a major OED product and re-main the only consistently produced evaluationat a country level in the Bank. To date some 55CAEs have been completed. The process has beenboth challenging and controversial. As a result,OED has worked internally to strengthen, clar-ify, and disseminate its methodology and has sur-veyed Bank staff for feedback.
In addition to measuring staff perceptions onCAEs, OED carried out a tracer study this year toassess the extent to which CAE recommendationson a country were incorporated into the subse-quent CAS and were reflected in the assistance ac-tually delivered to the client country. The studyreviewed 15 CAEs that were completed in FY99 orearlier, to ensure that enough time had passed to per-mit a review of Bank assistance actually provided.1
Although determining causality is difficult, the de-gree of consistency between CAE recommenda-tions, the CAS, and actual assistance is a partialindicator of the impact of CAEs.
Consistency between CAE recommendations andthe CAS was strong. In most of the countries re-
2 0 0 2 A N N U A L R E P O R T O N O P E R AT I O N S E VA L U AT I O N
2 8
O E D I n f l u e n c e ( p e r c e n t s o m e w h a t o r s t r o n g l y )
T a b l e 7 . 1
ED staff General CAE S&TQuestion 2001 2002 2001 2002 2001 2002 2001 2002
Influence your view of strategy and development policy:
In the sector? 90 90 54 76 — 71 75
In the country? 84 85 — — 66 45 —
In the Bank as a whole? 79 88 — — — 56 —
Influence implementation of projects — 67 — — — — —or programs?
Influence the Bank’s:Sector/country strategy? — — — — 71 — 83
Lending services? — — 74 — 53 — 50
Nonlending services? — — 64 — 53 — 64
Note: — indicates the question was not asked for that particular survey.
Survey

viewed, there was good consistency between theoverarching recommendations in the CAE and thesubsequent CAS. This was the case in Albania, In-donesia, Kenya, Malawi, Morocco, Philippines,and Yemen and reinforces the message from thesurveys, in which 71 percent of respondentsthought that CAEs had influenced Bank policiesat a country level. In Mozambique, the 1997CAE came too late to influence the 1997 CAS,although the subsequent 2000 CAS was consis-tent with the broad CAE recommendations, lessso with the sector-specific ones. In Sri Lanka,there has not yet been a full CAS because of thepolitical uncertainty in the country.
CAE recommendations not found in the sub-sequent CAS include: (i) establishing monitoringindicators, which was considered by countryteams to be either unnecessary (the Albania CAEhad recommended early warning monitors ofcrises) or too vague to be useful; (ii) pace of re-form, where CAE recommendations were con-sidered unrealistic, such as for privatization inBangladesh and Ukraine; or the recommendationwas untimely, such as addressing devolution in SriLanka, where it first had to be pursued in the con-text of a political solution to the conflict; and (iii)specific lending or ESW activity, as in Sri Lankawhere the recommendation was considered tohave low relevance.
Consistency between CAE recommendationsand implementation was somewhat weaker. Onlyabout half of the number of recommendationstracked across all CAEs were fully or substantially
implemented. The reasons for weak—or a lackof—consistency (box 7.2) include: (i) limited ca-pacity or opportunity in countries, includingBangladesh, Malawi, and Sri Lanka; (ii) pressuresto lend, as in Kenya and Morocco;2 and (iii) in-ternal Bank incentives or expectations from gov-ernment and other donors that make selectivitydifficult, as in Mozambique. One implication ofthese findings is that CAE recommendationsneed to focus on what can realistically be ac-complished in the next CAS period, typically twoor three years, and which recommendations arefor the longer term.
Recommendations for OED In light of these findings, OED proposes to focuson the following areas:
Dissemination• Survey results indicate that last year’s recom-
mendation about more purposeful targeting ofBank audiences for its products is still valid.OED should engage the Networks in identi-fying how OED products can most effectivelyreach interested staff. A wider range of dis-semination activities should be used, includ-ing live presentations and workshops inaddition to paper and Web-based documentdistribution.
• Each major OED study should state early inits design who the study’s target audience is (inaddition to CODE and the Board) and howit will be disseminated.
O E D ’ S A G E N D A
2 9
Implementation of country strategies in Indonesia, the Philip-pines, and Yemen has been substantially consistent with CAErecommendations. Sometimes the consistency has come aboutwith a lag, as in Albania and Mozambique, where efforts to mon-itor poverty reduction and improve aid coordination werestepped up some years after the CAE as a result of the PRSPprocess. In Bangladesh, IDA assistance was limited becauseof government corruption and low commitment to reform, whichwas consistent with CAE recommendations, but it meant thatother specific recommendations (on state-owned enterprise
[SOE] reform, flood control) could not be pursued. A similar sit-uation existed in Ukraine. In Kenya the Bank moved from a no-lending scenario recommended by OED in FY98 and proposedin the FY99 CAS a program of emergency and adjustment lend-ing. In Morocco, contrary to the FY97 CAE, which proposedgreater selectivity in adjustment lending and a focus on fiscalissues, and the FY97 CAS, which proposed one small adjustmentloan for the base case and also focused on fiscal issues, overhalf of the Bank’s assistance was for adjustment lending, withfiscal issues still a major concern.
C A E R e c o m m e n d a t i o n s a n d I m p l e m e n t a t i o no f B a n k A s s i s t a n c e : A V a r i e d P i c t u r e
B o x 7 . 2
Methodology OED should: • Include an annex in each evaluation report
stating the methods and data sources used, in-cluding their strengths and limitations.
• Evaluate and report on compliance with safe-guard policies in each Project Performance As-sessment Review.
• Begin to align its evaluation of risk and sus-tainability to the Bank’s overall risk manage-ment framework.
• Continue to support the introduction of self-evaluation methods by management for coun-try programs.
• Continue the internal validation and calibra-tion of evaluation standards started in FY02,and use the results to design staff training andguidance to further improve the consistency oftreatment.
Participation and Consultation• Because the staff survey results point to a need
for greater consultation and participation withboth Bank staff and external partners, OED willneed to pay particular attention at early stagesof evaluations to ensure that plans are ade-quate for engaging partners, including betteruse of technology (video-conferencing).
• In cases of unresolved disagreement betweenOED and management on individual projectevaluations, OED should institute a transpar-ent procedure for discussing reasons for dif-ferences.
Self-evaluation• OED should continue regularly surveying and
reporting on the usefulness of OED productsto staff and Executive Directors, using thesame survey instruments as this year.
2 0 0 2 A N N U A L R E P O R T O N O P E R AT I O N S E VA L U AT I O N
3 0

3 1
CONCLUSIONS AND RECOMMENDATIONS
The last ten years have witnessed profound changes in the way the Bankdefines its mandate, acknowledges risks to fulfilling that mandate, and isinitiating efforts to measure performance in reaching its goals. At the same
time, the drive to become a Knowledge Bank has engendered new initiatives andnew processes, for which both the control environment and the evaluationframework have yet to be well defined. In 1997, the Strategic Compact highlightedthe importance of measuring results and the introduction of the CorporateScorecard pointed to a strong focus on country, sector, and thematic evaluations.
At that time, OED endorsed these initiatives andrecommended moving to a results-based man-agement (RBM) system, where evaluation find-ings would be linked to resource management.Limited progress has been made on filling in theScorecard, and still less on moving to RBM. Therecent shift in the authorizing environment on thecentrality of evaluation for accountability andlearning, however, may lead to more rapid progressin both areas.
Main FindingsControl environment. This review of the evolutionof the control framework in the Bank over the pastdecade has found that new structures and func-tions have been put in place and an altered internalculture has taken root with respect to risk man-agement. One issue that has emerged, however,is increasing risk aversion on the part of bothBank managers and borrowers, who seek to avoid
lending operations subject to heavier controls.This points to the need to scale up risk assessmentand seek mitigation measures at a country level.
Risk assessment has been strengthened at theproject level through increased fiduciary assess-ments and safeguard compliance requirements. Itis stronger for projects in the pipeline than for proj-ects under implementation, and stronger for in-vestment lending than structural adjustmentlending.1 Monitoring and evaluation need to bestrengthened at the project level to focus on re-sults, facilitate learning, and improve the feedbackloop to stronger risk assessments for the next gen-eration of assistance. Risk assessments for grants,trust funds, and partnerships, by contrast, haveseen only recent improvements, and it is still earlyto assess the effectiveness of the new controls.
Risk assessment at the country level has alsobeen expanded in the last decade to include newand stronger fiduciary reviews. These efforts could
8

be strengthened if they were combined into a co-herent risk assessment framework and reinforcedwith systematic evaluation of country-level resultsthat could inform future risk assessments. Risk as-sessment at the corporate level is still in the processof being set up; oversight at this level will restwith the Management Committee, but its man-date, priorities, or functions have yet to be defined.
Control activities depend on unambiguous andrelevant guidelines, which the Bank has been put-ting in place. In addition to the information pro-vided to the Board and senior management on thestatus of conversions currently under way, a com-prehensive timetable for policy conversions andupdating should be regularly provided to theBoard.
Control activities for projects were enhanced bythe creation of QAG, whose criteria and method-ology have now been adapted for quality assuranceby the Regions. Control activities continue to ex-pand to areas of vulnerability, including safeguardcompliance and trust funds, but it is too early tojudge their effectiveness. Monitoring of projectoutcomes remains weak, however, in spite of re-peated intentions over the years to strengthen it.
Monitoring inputs, outputs, and outcomes andevaluating the results of Bank assistance remaina challenge. The recent focus at the highest lev-els of the international development communityon demonstrating results has energized the Bankto strengthen its self-evaluation and monitoringsystem. Although progress has been made, im-portant gaps remain. More systematic monitor-ing and evaluation are needed for ESW, grants,and partnerships. At the country, sector, and the-matic levels, self-evaluation is largely absent.2
Information and communication improvementshave made the Bank a different place from adecade ago and have enabled rapid disseminationof guidelines and best practice; more effectiveuse of control mechanisms; and more timely riskassessments, particularly for the portfolio. The newsector and thematic codes will, in principle, per-mit better tracking of Bank assistance in line withcorporate priorities. DEC and WBI have an im-portant role to play in ensuring that the messageof the complexities involved in attaining theMDGs includes the quality of borrowers’ gover-nance and global policies.
For OED’s agenda, the messages from CODE,internal surveys, and a tracer study point to con-tinued challenges to improve and disseminatemore widely its evaluation methodologies forcountry evaluations; increase transparency of theevidentiary basis of evaluations; target better thedissemination of sector and thematic evaluations;and enhance OED’s monitoring of the Bank’sadoption of OED recommendations.
RecommendationsResults-based management will be realized onlywhen self-evaluation is strengthened at all lev-els, independent evaluation contributes to im-proving methods and indicators, and reliabledata are generated by countries. The agendafor improved monitoring and evaluation in-cludes providing guidance on the overarchingevaluation framework and filling gaps in thetracking systems of lending and nonlendingservices, grants, and partnerships. More trans-parent CAS and SSP processes should be com-plemented by rigorous self-evaluation. Againstthis background, the AROE recommends thatactions be taken on four fronts, three by man-agement and one by OED:• At the corporate level, senior management should
design performance measures to track Bankachievements at project, country, and global lev-els in relation to the Millennium Develop-ment Goals. It should implement an integratedrisk management framework to facilitate the ad-ministration of financial, operational, devel-opmental, and reputational risks faced by theBank. In this context, it should make explicitthe strategic risks and rewards of operationalpolicies and corporate strategies.
• Strengthen the evaluation and control frameworkfor sector strategies, partnerships, and grants.The operational shift to the higher plane ofpolicy and sector strategies should be backedby adequate network accountability for sectorperformance measurement and managementof instruments and services. Management andOED should develop a concise operationalpolicy that provides an overarching evaluationframework. Project-level monitoring shouldbe treated as a fiduciary responsibility to en-sure that adequate monitoring is in place be-
2 0 0 2 A N N U A L R E P O R T O N O P E R AT I O N S E VA L U AT I O N
3 2
fore Board approval. The “evaluability” ofgrant-financed activities should be improved.For all partnerships, clearer distinctions inaccountability and more accurate specificationof quality assurance, evaluation, and over-sight should help to minimize conflicts ofinterest and increase effectiveness.
• At the country level, risk assessment and learn-ing should be improved by developing a com-prehensive approach that incorporates theresults of fiduciary assessments (such as theCFAAs, CPARs) into the CAS. Self-evalua-tion at the country level, based on verifiableindicators grounded in country processes,needs to be integrated into country pro-grams.
• Finally, OED will need to improve and dis-seminate more widely its evaluation method-ologies for country evaluations and increase thetransparency of the evidentiary basis of its eval-uations. It should help Regions and NetworkAnchors incorporate self-evaluation in coun-try assistance and sector strategies, which wouldimprove the ability of the Bank to measure itsperformance without compromising the in-dependence of OED’s evaluations. It should ad-dress the independent evaluation needs ofglobal and regional programs; better monitorand evaluate compliance with safeguards; tar-get more effectively the dissemination of sec-tor and thematic evaluations, and use a widerrange of dissemination tools.
C O N C L U S I O N S A N D R E C O M M E N D AT I O N S
3 3


3 5
The Implementation Completion Report (ICR)is a self-evaluation instrument required for eachclosed lending operation and produced by the Re-gions. An ICR marks the transition from imple-mentation to exit from the Bank’s active loanportfolio. OED conducts an independent reviewof each ICR, called an Evaluation Summary (ES),to validate or adjust the ratings based on the in-formation provided in the ICR and other evidence.
This annex is divided into three sections. Thefirst provides a summary of ICR evaluations con-ducted by OED between FY96 and FY01. Thesecond describes the major findings on trends inICR quality for FY96–01 exits. The third showschanges in ratings at different stages of the proj-ect cycle for FY96–01 exits.
OED Evaluations, FY96–01Table A1.1 summarizes OED’s output of ICR re-views and Project Performance Assessments reports(PPARs) since FY96. Due to bunching of ICR de-liveries toward the end of the fiscal year, the num-ber of ICRs evaluated in some years can exceedthe number of ICRs received, as in FY98.1
Findings on ICR QualityOED ratings provide an independent assessmentof ICR quality and their consistency with ICRguidelines. Three dimensions of ICRs are assessed:(i) the analysis provided, which includes coverageof important subjects, soundness of analysis, ad-equate and convincing evidence, and adequacy oflessons learned; (ii) the future operation of the proj-
ANNEX 1: OED REVIEW OF ICRS
FY96 FY97 FY98 FY99 FY00 FY01
ICRs received 268 397 218 291 307 317Adjustment 43 65 24 45 36 42Investment 224 332 186 236 251 275
ICRs evaluated 249 313 284 268 270 286Adjustment 44 45 38 36 50 27Investment 204 268 246 232 220 259
PPARs 100 79 71 69 72 73Adjustment 17 13 13 14 14 14Investment 83 66 58 55 58 59Assessment ratio 40 25 25 26 27 26Note: Figures in table represent number of reports received and evaluated by OED in each FY. The annual distribution of these numbers before FY01 ignores late incoming reports that
were included in the previous year’s cohort. With the automatization of the ICR review and evaluation process this practice has now been eliminated.
O E D E v a l u a t i o n s o f I C R s , F Y 9 6 – 0 1T a b l e A 1 . 1

ect, including a plan for future project operation,the inclusion of performance indicators for the pro-ject’s operational phase, and plans for monitoringand evaluation; and (iii) borrower and cofinancierinputs. The evolution in the quality of ICRs by di-mension is in table A1.2.
Quality of ICR analysis is high. Almost all ICRscovered the important topics, were internally con-sistent, and drew appropriate lessons. The qualityof ex post economic analysis for those operationswhere it was relevant, at 85 percent satisfactory orbetter, remains one of the weaker aspects of the ICRanalysis, although it has shown marked improve-ment over the last six years. The extent to whichthe evidence presented in ICRs is complete andconvincing remains the weakest aspect, where inspite of some improvement several years ago, it re-mains at essentially the same level as in FY96 at
83 percent satisfactory or better. This reflects theweak quality of monitoring and evaluation, whichmakes it more challenging to pre-sent convincingevidence of results. Although the poverty analysiscomponent of ICRs remains weak, at only 65percent satisfactory, this quality dimension wasadded only in 1997 and has been rated only whererelevant, for a relatively small number of ICRs (inFY00, 46 out of 265 ICRs were rated, and for thepartial sample in FY01, 34 out of 169 ICRs, onthe poverty dimension). As the Bank internalizesthe Millennium Development Goals into its strat-egy and lending, it is hoped that a results orien-tation will be reflected through increased attentionto the measurable poverty dimension of lendingoperations.
Forward-looking orientation has improved, al-though it remains weak relative to the other dimen-
2 0 0 2 A N N U A L R E P O R T O N O P E R AT I O N S E VA L U AT I O N
3 6
E v o l u t i o n o f Q u a l i t y o f I C R s : T h r e e D i m e n s i o n s ( p e r c e n t s a t i s f a c t o r y o r b e t t e r )
T a b l e A 1 . 2
FY96 FY97 FY98 FY99 FY00 FY01a
1. AnalysisCoverage of important subjects 91 96 95 95 95 95Ex post economic analysis (if applicable) 71 78 73 88 86 85Internal consistency 92 93 96 94 95 95Evidence complete/convincing 82 84 89 86 87 83Adequacy of lessons learned 92 93 96 90 93 91Poverty analysisa n/a n/a n/a n/a 54 65
2. Future operationPlan for future operation 82 84 81 89 86 92Performance indicators for operational phase 63 74 72 76 81 85
Plan for monitoring and evaluation of future operation 69 63 66 70 73 75
3. Borrower/cofinancier inputsBorrower input to ICR 91 93 97 96 98 96Borrower plan for future project operation 81 84 83 86 89 91
Borrower comments on ICR 88 89 94 95 97 95Cofinancier comments on ICR (if applicable) 57 73 80 86 92 87
Overall quality of ICR 91 95 96 94 96 92* Partial sample.
ICRs exiting in following fiscal years

sions. ICRs are expected to report on a project’s an-ticipated results on the ground in the operationalphase, after disbursements. It is important to con-tinue monitoring after disbursements, to ensure thatthe planned benefits of the operation materializeand negative externalities, such as environmentalimpact, are minimized. Although descriptions ingeneral terms of the plan for future operation haveimproved to 92 percent satisfactory or better, theseratings were made on only about 70 percent of theICRs that were reviewed; the remaining ICRscould not be rated on this dimension because in-formation was not available on the plan for futureoperation. The other aspects of future operation ofthe project are less satisfactory, both in terms of theproportion of the ICRs that could be rated and thepercent satisfactory of those that were rated. Per-formance indicators for future operation were ratedin some 55 percent of all ICRs reviewed. Of thosethat could be rated, the proportion improved from63 percent satisfactory or better in FY96 to 85 per-cent in FY01. The plan for monitoring and eval-uation could be reviewed in only 42 percent of theICRs over the FY96–01 period, and of these, theproportion of satisfactory or better improved mod-estly from 69 percent to 75 percent.2 There isroom for considerable improvement in identifyingperformance indicators and planning for moni-toring and evaluation in the operational phase ofBank lending.
Continued improvement in borrower contribu-tions to the ICRs where such contributions wereavailable. ICRs are supposed to include contri-butions from borrowers, which encompass theborrower’s inputs to the assessment, specific com-ments on the ICR, and the borrower’s plan forfuture operation. Many ICRs lack one or moreof these components. ICRs included borrowers’comments about 65 percent of the time through-out the period, and the quality of these commentshas improved and now stands at a strong 95 per-cent. The plan for future operation was includedin about 55 percent of the ICRs, and of these,the proportion rated satisfactory or better im-proved from 81 percent in FY96 to 91 percentin FY01.
ICRs are also supposed to have cofinanciers’comments, and this has increasingly been thecase; in addition, the quality of these comments
has improved. Overall, the quality trend for bor-rowers’ and cofinanciers’ contributions suggeststhat the ICR process has become more partici-patory over time.
The overall quality of ICRs is high. As shown intable A1.2, ICR quality ratings over the last fourcompleted exit fiscal years have remained fairlyconstant at around 95 percent. The preliminaryresults for FY01 exits indicate a slight decline, to92 percent. The satisfactory ICR quality ratingsreflect the internalization of the ICR methodol-ogy by operational staff. Since FY98 the ICRtemplate has become part of the project documentsystem for all completed investment operations.
Intensive Learning ICRs (ILIs) were intro-duced to focus operational efforts to enhance thelearning of the ICR process. Although ILIs wereexpected to be 30 percent of the total ICRs, only10 percent of the 271 FY00 ICRs evaluated wereILIs. The ILI share remains the same for the par-tial FY01 sample. No significant differences arefound in ICR quality ratings by ICR type.
Ratings Changes3
At each stage of the project cycle, from imple-mentation through completion and indepen-dent evaluation by OED, projects are rated interms of their likely achievement of relevant proj-ect objectives (outcome). At completion and eval-uation, projects are also rated on institutionaldevelopment impact and sustainability. One in-dicator of the robustness of the ratings at each stageis the extent to which ratings are changed in sub-sequent stages. A second indicator of reliability isthe net change in ratings—that is, the percentageof ratings that are decreased minus those that areincreased. This shows the degree of overoptimism(if the net change is positive) or underrating (ifthe net change is negative) of the self-rating.
Table A1.3 shows these rating changes by exitfiscal year. They include rating changes on out-comes between: (a) the last Project Supervision Re-port (PSR) before the operation exits the portfolio,and the ICR, carried out by operational staff inthe Region; (b) the PSR, ICR, and OED’s ES; and(c) the ES and the Project Performance AssessmentReport (PPAR), if one is carried out by OED. Inany given year, about 25 percent of closed oper-ations will be assessed.
A N N E X 1 — O E D R E V I E W O F I C R S
3 7

Outcome rating changes are included here onlywhere the change is from satisfactory (highly sat-isfactory, satisfactory, marginally satisfactory) tounsatisfactory (marginally unsatisfactory, unsatis-factory, highly unsatisfactory) or the reverse. Thatis, rating changes within “satisfactory” and “un-satisfactory” categories are not included. Lookingfirst only at changes between the final PSR and theICR, there has been a slight downward trend in thenumber of total rating changes, but no discernibletrend in net changes, which have been consistentlypositive. This suggests that even at the time offinal supervision of operations, Bank staff tend tooverestimate development outcome. Next, totalrating changes on outcome are fewer between Re-gions and OED (ICR to ES) than within the Re-gions (PSR to ICR). Net changes have been eitherclose to those within operations or somewhat lowerand show no consistent trend over time. Thus, al-though OED has changed outcome ratings at theES stage from ICRs in a net downward directionevery year since FY96, its net changes have beenmore modest than those within the Regions.
The rating change between PSR and ES isshown here to indicate the degree and directionof differences between supervision ratings on out-come and OED ratings. This is relevant for pro-viding an indication of the extent to which PSRratings may be reliable predictors of outcomes.Given the magnitude of the changes in the samedirection (downward) at both the PSR to ICRstage and ICR to ES stage, it is not surprising thatthe largest total and net outcome rating changeshave generally occurred between PSR and ES.
The net rating changes are consistently downwardby around 10 percent over the period.
In addition, outcome rating changes madewithin OED—that is, between ES and PPAR—have been quite large. Between FY96 and FY99,outcome ratings were changed in about 14 per-cent of operations assessed in more depth byOED. In most of these years, the net change wasdownward, suggesting that a more intense as-sessment of operations by OED results in a morerigorous rating than the ES, which is based on adesk review of the ICR.
The rating changes in FY99 and FY00 show adifferent pattern on net rating changes from pre-vious years, but they are based on a relatively smallnumber of assessments carried out to date byOED, and this pattern may not hold in the future.In FY99, for example, the net change in outcomeratings between ES and PPARs is based on 36PPARs, and in FY00, it is based on only 23, com-pared to some 60 per year in FY96–98. In the fu-ture, the number of assessments for operations inthese exit years will increase as OED carries outadditional PPARs. The relatively large share ofrating changes for the 60 or so assessments carriedout each year by OED between FY96 and FY99raises questions about the robustness of the ESprocess alone to verify outcomes. It suggests thatin-depth assessments are needed to verify results,underlining the importance of OED’s PPAR pro-gram. This conclusion is strengthened by a re-view of other ratings—institutional developmentimpact, sustainability, and Bank and borrowerperformance. It shows a similar pattern to outcome
2 0 0 2 A N N U A L R E P O R T O N O P E R AT I O N S E VA L U AT I O N
3 8
Exit FYFY96 FY97 FY98 FY99 FY00 FY01
% % % % % % % % % % % % % % % % % % % % % % % % Change Down Up Total Net Down Up Total Net Down Up Total Net Down Up Total Net Down Up Total Net Down Up Total Net
Outcome a b a+ b a–b
PSR to ICR 8 4 12 4 9 2 11 7 11 2 13 9 7 3 10 4 6 2 8 4 8 1 9 7
ICR to ES 8 1 9 7 5 3 8 2 4 1 5 3 5 0 5 5 5 0 5 5 5 1 6 4
PSR to ES 16 4 20 12 9 0 9 9 14 3 17 11 11 2 13 9 10 2 12 8 13 1 14 12
ES to PPAR 10 3 13 7 9 0 9 9 8 7 15 1 6 8 14 –2 10 10 20 0 n/a n/a n/a n/aNote: The data for FY01 exits represent a partial sample and reflect the processing of all ICRs through February 2002. In FY01 only two PPARs were done on operations exiting that year.
S u m m a r y o f R a t i n g s C h a n g e s , a s P e r c e n t a g e o f T o t a l P r o j e c t s R e v i e w e d a t E a c h S t a g e , F Y 9 6 – 0 1 E x i t s
T a b l e A 1 . 3

rating changes between the Regions and OEDand within OED.
For example, the net rating changes on insti-tutional development impact between ICRs andESs in recent years (FY00 and 01) have been pos-itive (at 1 and 5 percent, respectively), suggestingthat the Regions are more upbeat on this dimen-sion than OED. Total rating changes are generallyhigher within OED’s own ratings (ES to PPAR)than between the Regions’ ratings and OED’s(ICR to ES), and net changes have generally beendownward, as with outcome rating changes. Onsustainability, as another example, the rating scalechanged in FY00, making comparisons with pre-vious years difficult, but for the FY96–99 period,net changes were consistently over 12 percent
each year, and at the PPAR stage OED changedratings downward at least 10 percent of the time.In FY00 and 01, after the change in rating scale,the pattern is similar to outcome ratings, with anet rating change of some 4 percent, in a down-ward direction.
Overall, these rating changes suggest that theRegions are more optimistic about developmenteffectiveness than OED and that the PSR/ICR/ESprocess may result in an overly sanguine pictureof development effectiveness. This emphasizesthe need for the independent assessments of op-erations carried out by OED and suggests that fur-ther efforts to carry out impact assessments areneeded as proposed under OED’s FY03–05 workprogram.
A N N E X 1 — O E D R E V I E W O F I C R S
3 9


4 1
Regions are at the center of risk management inthe Bank. To fulfill their mandate with respect tolending activities, most Regions have set up qual-ity units or teams, whose function it is to ensurethat risks are adequately identified and assessed,quality at entry is strong, the active portfolio ismonitored, and management is informed of issuesin a timely way. In the context of this year’sAROE, OED interacted with the Regional qual-ity teams to get an overview of their structure andfunctions. There are also substantial differencesin the size and scope of these activities.
The attached matrix captures similarities anddifferences. LAC has the most long-standing qual-ity unit, since 1996; AFR and ECA set up theirunits in 1999; and the MNA quality unit is themost recent, established formally in FY02. LACcovers up to 20 percent of loans through QualityEnhancement Reviews (QERs); ECA, as much asone-half to two-thirds (this latter figure includesthose initiated by Network Anchors). AFR coversabout 5 percent, which translates into a relativelyhigh number of QERs because of the large num-ber of credits/loans processed in that Region. Inaddition, the AFR quality unit is expanding theuse of QERs to cover supervision activities for se-lected projects. MNA covered about 10 percent inFY02 through QERs, while SAR covered 5 per-cent, and EAP did not initiate QERs.
The Regional quality units do not have a formalclearance function. In practice, however, they maybe heavily involved because it is difficult for an op-eration to be channeled to senior management forapproval unless the quality unit’s comments havebeen taken into account. In ECA, for example, thequality unit reviews most Project Appraisal Docu-ments (PADs), but they systematically review andclear “informally” all Adjustable Program Loans as
well as all Learning and Innovation Loans. AFR,ECA, and LAC are active in reviewing both Proj-ect Concept Documents and PADs.
AFR, ECA, and LAC quality units have adoptedcriteria for identifying risky projects, relying on self-assessments by country and sector managers, andalso using other criteria, such as size, complexity,or country risk factors. ECA has a risk managementcommittee, which includes fiduciary and safeguardstaff from within and outside the Region, chargedwith looking at a range of implementation issuesthat could have a (negative) impact on developmenteffectiveness. AFR has separate processes for proj-ects that are considered high risk for implementa-tion reasons or from a fiduciary perspective. LACdoes a systematic review of pipeline project risks,both reputational and developmental, once a yearand of active projects twice a year, as part of the port-folio review. It bases its assessments on inputs fromboth country and sector units, as well as fiduciaryand safeguard teams, civil society, the Regional ex-ternal affairs unit, and its own analysis. As in ECA,the resulting list of high-risk projects is presentedto a panel of experts from within and outside theRegion, to validate the risks and provide suggestionsfor mitigating or managing them.
The MNA quality unit has developed projectreadiness filters for each country, comprisingsome seven to nine elements, including factorssuch as ensuring availability of counterpart fund-ing for first year of project; designation of key proj-ect staff; compliance with fiduciary and safeguardaspects; and identification of appropriate moni-toring indicators of performance. As in the threeRegions discussed above, MNA reviews ProjectConcept Documents (PCDs) and PADs; it alsoreviews Project Supervision Reports of all at-riskprojects and all ICRs, and has a Monthly Man-
ANNEX 2: REGIONAL QUALITY TEAMSA COMPARISON ACROSS REGIONS

agement Report (MMR), which is disseminatedin the Region through the unit’s Web site and re-viewed monthly by the Regional ManagementTeam. The MMR includes a section highlightingcritical operational risks for management atten-tion. This report received high ratings in a surveyof MNA staff (see below).
EAP and SAR, the two most decentralized Re-gions (roughly 50 and 80 percent of operationsare decentralized, respectively), have a lighter cen-tral oversight function. EAP pioneered the use ofthe readiness filters and has also broadened theCountry Portfolio Performance Review and madeit a quarterly process, concentrating on safeguardand fiduciary issues, as well as projects at risk. TheCPPR in EAP now also includes projects in thepipeline. In addition, more recently, EAP hasconcentrated on training staff in a wide range ofissues on portfolio and pipeline monitoring andhas taken a somewhat different approach to riskassessments: for the past three years it has carriedout a Special Operational Review in countries toidentify systemic risks that could affect develop-ment effectiveness or the reputation of the Bank.In addition, both SAR and EAP have made proac-tive use of the Investigation Unit in the Depart-ment of Institutional Integrity in the Bank, to lookinto ongoing projects that are considered partic-ularly at risk for corruption.
South Asia had a Regional quality enhancementunit until FY02, when it was disbanded. In its
place, the Region has strengthened oversight inthe country units in the field by hiring operationaladvisors in each of the five country offices. Thisimplies a greater reliance on self-assessments bycountry directors who ensure that risks are iden-tified, assessed, and managed in both the pipelineand the portfolio. There is central oversight of fi-duciary risks by the chief financial officer, withextra resources available for riskier projects. TheRegional Management Team meets monthly to re-view the quality of the portfolio.
The Regional quality advisors have a monthlylunch meeting to share cross-regional experiences.They also interact to varying degrees with OPCS,QAG, and Network staff. One issue being ex-plored by OPCS is the consistency across Re-gions of criteria for identifying higher-risk projects.To the extent that the criteria differ, aggregationacross Regions is not reliable; developing a cor-porate view of systemic risks in lending is chal-lenging. OPCS plans to have a report on thisaspect soon.
MNA’s Operations and Country Services De-partment carried out a survey of its staff for feed-back on the quality unit’s services. Two of the unit’sproducts—the Monthly Management Report andthe Regional Guidelines and Business Processes—were among the highest-rated items in the survey.It would be useful for the other quality units toget similar feedback from task managers and sec-tor and country managers.
2 0 0 2 A N N U A L R E P O R T O N O P E R AT I O N S E VA L U AT I O N
4 2

4 3
AFR
EAP
ECA
LAC
MN
ASA
ROb
ject
ives
of Q
ET:
Yes,
RVP
De
cent
raliz
ed; n
o fo
rmal
fo
rmal
TOR
?an
noun
cem
ent
??Ye
sYe
squ
ality
uni
t in
HQ
Num
ber o
f HL
staf
f5
23
62
—
Repo
rt di
rect
ly to
Co
re S
ervi
ces
Unit
Core
Ser
vice
s Un
itOp
erat
iona
l Sup
port
Unit
Coun
try S
ervi
ces
Unit
—
Func
tioni
ng s
ince
19
9919
9819
9919
96Ju
ly 2
001
—
Qua
lity
assu
ranc
e fo
r pip
elin
eQE
Rs a
s %
of p
roje
cts
Abou
t 5%
N
oBe
twee
n on
e-ha
lf an
d Ab
out 2
0%
Abou
t 10%
Abou
t 5%
pa
st F
Y?tw
o-th
irds,
sys
tem
atic
in
cer
tain
sec
tors
Revi
ew P
CDs/
PADs
?Ye
s, a
ll PC
Ds, P
ADs
No
Yes,
bot
h PC
D an
d PA
D;
All P
CDs;
and
PAD
s th
at
All P
CDs,
PAD
sIn
fiel
dal
l PAD
s ar
e di
scus
sed
go to
ROC
at w
eekl
y CS
U m
eetin
gs
Crite
ria fo
r hig
h-ris
k Ye
s, c
ount
ry a
nd
By ty
pe o
f loa
n;
Yes,
impl
emen
tatio
n,
Yes,
bas
ed o
n in
puts
from
Ye
s, p
art o
f ROC
rule
s;
Mai
nly
on s
afeg
uard
s an
d op
erat
ions
? se
ctor
uni
ts id
entif
y, (P
RSC,
LIL
, etc
.);
safe
guar
d, fi
duci
ary
Bank
uni
ts, f
iduc
iary
and
in
clud
es a
djus
tmen
t, fid
ucia
ry,
iden
tifie
d by
pl
us a
pply
oth
er
also
thos
e id
entif
ied
safe
guar
d te
ams,
civ
il co
untry
fact
ors,
sp
ecia
lists
crite
ria: A
PLs;
by
sec
tor u
nit o
r so
ciet
y, th
e Re
gion
al
repu
tatio
nal r
isks
; PR
SCs;
size
; N
etw
ork
exte
rnal
affa
irs u
nit,
MN
A-Q
also
co
untry
; fid
ucia
ryan
d ow
n an
alys
isde
velo
ping
“pr
ojec
t re
adin
ess
filte
r”
Mon
itor h
igh-
risk
Thro
ugh
QER/
ROC
ROC
targ
ets
abou
t Ri
sk m
anag
emen
t Ye
s, th
roug
h an
nual
Ye
s, th
roug
h QE
R,
Mai
nly
base
d on
fidu
ciar
y, op
erat
ions
?25
% o
f ope
ratio
ns fo
r co
mm
ittee
set
up
risk
revi
ews
ROC,
and
the
safe
guar
d co
nsid
erat
ions
revi
ew, i
nclu
ding
PRS
Cs,
to c
over
revi
ew o
f Ex
cept
ions
and
SA
Ls, L
ILs,
APL
s, a
nd
high
-risk
pro
ject
s Ou
tlier
s re
port
of
othe
rs a
s id
entif
ied
the
MM
Rab
ove
Re
gi
on
al
Q
ua
li
ty
E
nh
an
ce
me
nt
T
ea
ms
(
QE
T)
,
as
o
f
Ma
rc
h
20
02
Ta
bl
e
A2
.1
(Tabl
e co
ntin
ues
on th
e fo
llow
ing
page
.)

4 4
Re
gi
on
al
Q
ua
li
ty
E
nh
an
ce
me
nt
T
ea
ms
(
QE
T)
,
as
o
f
Ma
rc
h
20
02
Ta
bl
e
A2
.1
(c
on
ti
nu
ed
)
AFR
EAP
ECA
LAC
MN
ASA
RPo
rtfo
lio m
onito
ring
Ye
s, u
se P
AR; a
nd
Coun
tries
use
CPP
Rs,
Yes,
use
PAR
, reg
ular
Ye
s, u
se P
ARYe
s, re
port
thro
ugh
Yes,
use
PAR
; Ope
ratio
ns
deve
lopi
ng c
riter
ia
plus
mak
e us
e of
m
eetin
gs w
ith s
ecto
r M
MR,
use
PAR
flag
ad
viso
rs in
fiel
d m
onito
r; fo
r hig
her r
isk:
in
vest
igat
ory
unit,
an
d co
untry
man
ager
s,
syst
em, a
nd C
PPRs
mon
thly
RM
T m
eetin
gol
der p
roje
cts;
IN
TIU
repo
rted
in M
MR
coun
try in
stab
ility
; us
e QE
Rs fo
r su
perv
isio
n of
se
lect
ed p
roje
cts
Sepa
rate
pro
cess
for
Yes,
sep
arat
e ris
k Ri
sk m
anag
emen
t Ye
sYe
s, R
egio
nal
Yes,
by
CFO,
ext
ra re
sour
ces
fiduc
iary
risk
?lis
t, m
onito
red
by
com
mitt
ee in
Reg
ion
guid
elin
es fo
r FM
A as
sign
ed fo
r hig
her-r
isk
CFO
incl
udes
fina
ncia
l and
an
d th
roug
h M
MR
proj
ects
safe
guar
d st
aff
Revi
ew E
SWN
oN
oN
oN
oA
few
; has
pla
ns to
N
ore
view
all
ESW
sy
stem
atic
ally
st
artin
g FY
03;
Revi
ew/tr
ack
Revi
ew IC
Rs; t
rack
N
oRe
view
s on
ly IL
Is;
Revi
ew IC
Rs; t
rack
??
ICR
qual
ity
ex p
ost q
ualit
y;
don’
t tra
ck e
x po
st
qual
ity e
x po
st,
ex p
ost
do c
linic
s on
qu
ality
usin
g OE
D da
ta(O
ED d
ata)
?m
etho
dolo
gy
Mon
itor o
wn
No
Thro
ugh
QAG
data
No
Yes,
how
???
Yes,
sur
vey
in 0
2 N
oef
fect
iven
ess?
on q
ualit
y un
itN
ote:
AP
L =
Adap
tabl
e Pr
ogra
m L
oan
LIL
= Le
arni
ng a
nd In
nova
tion
Loan
CFO
= Ch
ief F
inan
cial
Offi
cer
MM
R =
Mon
thly
Man
agem
ent R
epor
tCP
PR =
Cou
ntry
Por
tfolio
Per
form
ance
Rev
iew
PAR
= Po
rtfol
io a
t Ris
k CS
U =
Core
Ser
vice
s Un
itPC
D/PA
D =
Proj
ect C
once
pt D
ocum
ent;
Proj
ect A
ppra
isal
Doc
umen
tFM
A =
Fina
ncia
l Man
agem
ent A
sses
smen
tsQE
R =
Qual
ity E
nhan
cem
ent R
evie
wIL
I = In
tens
ive
Lear
ning
ICR
RMT
= Re
gion
al M
anag
emen
t Tea
mIN
TIU
= In
stitu
tiona
l Int
egrit
y an
d In
vest
igat
ive
Unit
ROC
= Re
gion
al O
pera
tions
Com
mitt
ee

4 5
Several years of QAG data are now available onquality at entry (QAE) ratings, and enough timehas passed since the first Quality at Entry As-sessment (QEA1) that a number of the operationsassessed by QAG have closed and been assessedby OED. This note examines the extent of agree-ment between QAG and OED on quality at entryas well as the extent to which the QAE ratings aregood predictors of outcome.
OED compared QAG’s QAE ratings, assessedjust after Board approval of the operations, andOED’s ratings on quality at entry for the sameprojects, assessed by OED at the time of exit.These projects are a partial sample, consisting of46 closed projects. Table 3.1 shows the results ofthe comparison for all four QAE exercises (CY97;CY98; CY99; and CY00-June 01). If there wereperfect agreement between QAG and OED on the
quality at entry of all the projects, the observationswould fall in the upper left and lower right quad-rants. Table A3.1 below shows that there wasagreement on 39 of the 46 projects, or in 85 per-cent of the cases.
How do QAG’s QAE ratings correlate with out-comes, as rated by OED at the time of exit? Theseare shown in table A3.2 for the 42 projects whoseoutcomes were rated by OED at the time of exit.1
Roughly 17 percent of the projects, or 7 out of42, have different ratings. This is similar to thelevel of accord on quality at entry found above.
Another way to look at these figures is to askwhat is the net difference in rating between QAG’sQAE and OED at exit? That is, of the 42 proj-ects now closed and rated by both QAG andOED, what percent was rated by QAG as satis-factory at entry and what percent had satisfactory
ANNEX 3: QUALITY AT ENTRY, OUTCOMES, AND PORTFOLIO AT RISKA COMPARATIVE ANALYSIS OF QAG AND OED FINDINGS ON LENDING OPERATIONS
OED: quality at entrySatisfactory Unsatisfactory
QAG: Satisfactory at entry 39 4
QAG: Unsatisfactory at entry 3 —
Q u a l i t y a t E n t r y : Q A G a n d O E D R a t i n g s , f o r C l o s e d P r o j e c t s
T a b l e A 3 . 1
OED: outcome at exit TotalSatisfactory Unsatisfactory
QAG: Satisfactory at entry 33 6 39
QAG: Unsatisfactory at entry 1 2 3
Total 34 8 42
Q A G ’ s Q A E a n d O E D R a t i n g s o n O u t c o m e , f o r C l o s e d P r o j e c t s
T a b l e A 3 . 2

outcomes rated by OED? Table A3.3 shows thesefigures by year of QAG’s QEA and for the totalsample. Thus, of the 42 operations that havebeen assessed by QAG for QAE and are nowclosed and rated on outcome, QAG found that93 percent had satisfactory quality at entry, while81 percent of these projects had satisfactory out-comes. Thus, the net change (decrease) in ratingsbetween QAG at entry and OED’s outcome rat-ings at exit is some 12 percentage points.
The analysis of closed projects is a modest pro-portion of the total number of operations rated byQAG for QAE, as 87 percent of the projects ratedby QAG for quality at entry are still active. TableA3.4 shows a comparison of QAE ratings and thelatest portfolio at risk status. “At risk” signals thatthe project has at least three flags and is either con-sidered “potentially risky” or “risky.” Of the 300operations rated by QAG for QAE and still active,79 percent have a Portfolio at Risk status consis-tent with the QAE rating (satisfactory at entry andnonrisky, or unsatisfactory at entry and at risk). Thegross change in ratings is thus fairly substantial, at21 percent.
On a net basis, however, the difference in rat-ings is much smaller, because projects with bothsatisfactory and unsatisfactory quality at entryratings have moved into a different status during
implementation. Table A3.5 shows the net changesin ratings by QEA vintage and for all 300 proj-ects. For QEA1, for example, of the 69 operationsrated by QAG and by the Portfolio at Risk, 80 per-cent were rated satisfactory at entry and 80 per-cent were considered nonrisky in the most recentPortfolio at Risk, showing no net difference in rat-ing (although they weren’t the same projects: 9projects were considered satisfactory at entry butare not at risk, and 9 projects were considered un-satisfactory at entry but are not at risk). Overall,the net change in ratings between QAE rating andPAR status for the 300 projects assessed by QAGand still active is 3 percentage points.
There has been a historic net disconnect ofsome 8 to 10 percentage points between the lastsupervision rating and OED’s outcome ratings,as reflected in Evaluation Summaries. Thus, al-though the Portfolio at Risk status is not identi-cal to supervision ratings, it too may overestimatethe extent of satisfactory outcomes, as its pri-mary focus is on implementation progress ratherthan on development effectiveness (except forthe one flag that relates to development effec-tiveness). This suggests that the 3 percentagepoint net difference between QAG’s satisfactoryQAE figures and Portfolio at Risk figures may un-derstate the differences that will emerge in out-
2 0 0 2 A N N U A L R E P O R T O N O P E R AT I O N S E VA L U AT I O N
4 6
QEA1 QEA2 QEA3 QEA4 Total
QAG: percent satisfactory at entry 90 92 100 100 93
OED: percent satisfactory outcome 70 85 100 100 81Note: QEA1 covered operations approved in CY97; QEA2 in CY98 ; QEA3 in CY99 ; and QEA4 covered operations approved from January 2000 through June 2001.
R a t i n g D i f f e r e n c e s b e t w e e n Q A GQ u a l i t y a t E n t r y a n d O E D R a t i n g so n O u t c o m e
T a b l e A 3 . 3
Portfolio at riskNonrisky At risk Total
QAG: Satisfactory at entry 223 36 259
QAG: Unsatisfactory at entry 27 14 41
Total 250 50 300
Q A E a n d P o r t f o l i o a t R i s k f o r A c t i v e P r o j e c t s
T a b l e A 3 . 4
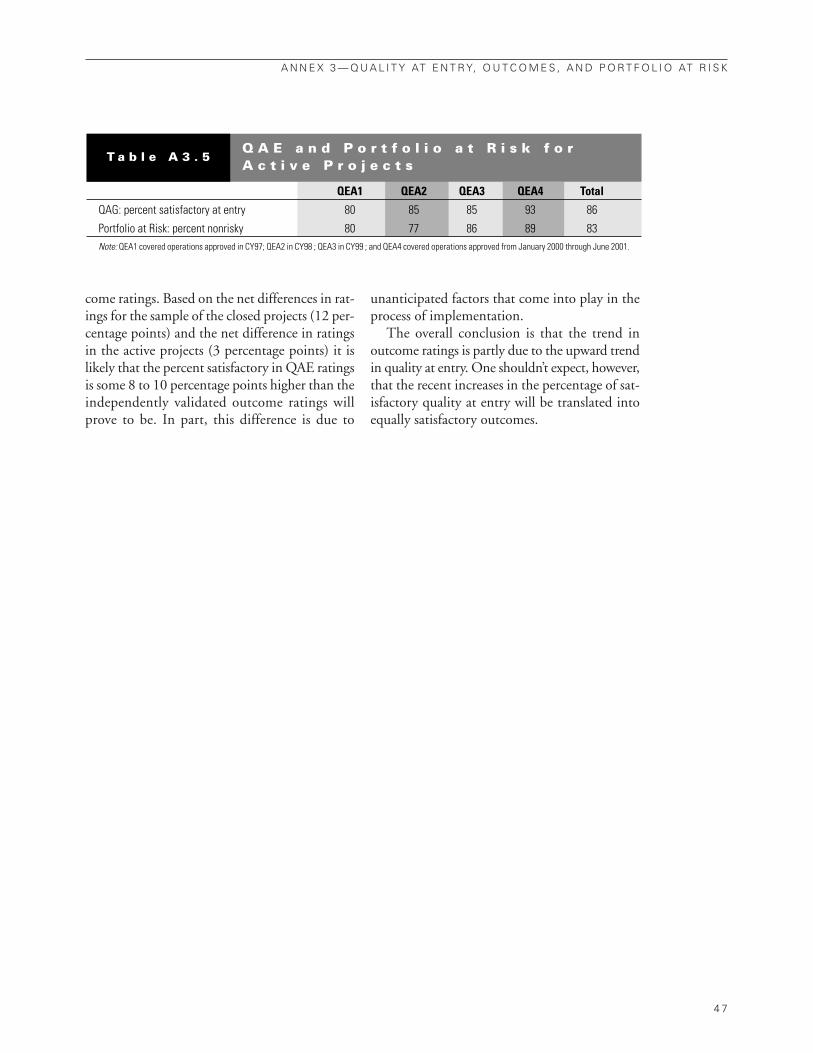
come ratings. Based on the net differences in rat-ings for the sample of the closed projects (12 per-centage points) and the net difference in ratingsin the active projects (3 percentage points) it islikely that the percent satisfactory in QAE ratingsis some 8 to 10 percentage points higher than theindependently validated outcome ratings willprove to be. In part, this difference is due to
unanticipated factors that come into play in theprocess of implementation.
The overall conclusion is that the trend inoutcome ratings is partly due to the upward trendin quality at entry. One shouldn’t expect, however,that the recent increases in the percentage of sat-isfactory quality at entry will be translated intoequally satisfactory outcomes.
A N N E X 3 — Q U A L I T Y AT E N T R Y, O U T C O M E S , A N D P O R T F O L I O AT R I S K
4 7
QEA1 QEA2 QEA3 QEA4 Total
QAG: percent satisfactory at entry 80 85 85 93 86
Portfolio at Risk: percent nonrisky 80 77 86 89 83Note: QEA1 covered operations approved in CY97; QEA2 in CY98 ; QEA3 in CY99 ; and QEA4 covered operations approved from January 2000 through June 2001.
Q A E a n d P o r t f o l i o a t R i s k f o r A c t i v e P r o j e c t s
T a b l e A 3 . 5

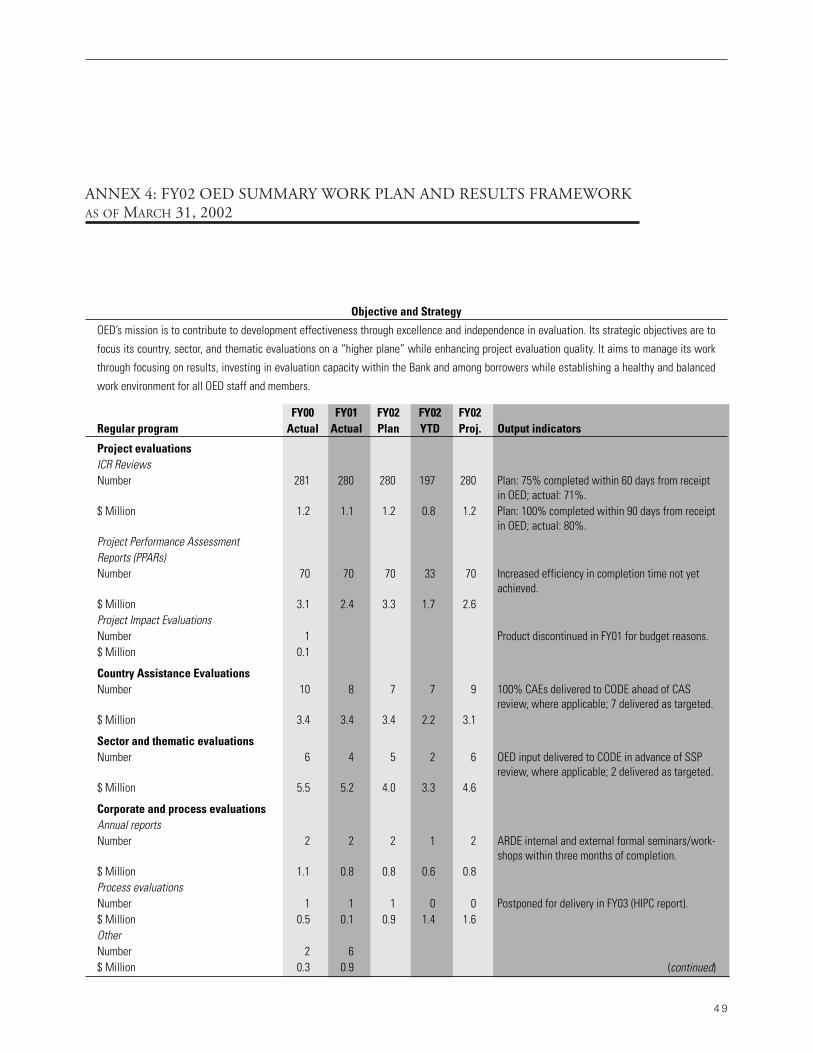
4 9
ANNEX 4: FY02 OED SUMMARY WORK PLAN AND RESULTS FRAMEWORKAS OF MARCH 31, 2002
Objective and Strategy
OED’s mission is to contribute to development effectiveness through excellence and independence in evaluation. Its strategic objectives are to
focus its country, sector, and thematic evaluations on a “higher plane” while enhancing project evaluation quality. It aims to manage its work
through focusing on results, investing in evaluation capacity within the Bank and among borrowers while establishing a healthy and balanced
work environment for all OED staff and members.
FY00 FY01 FY02 FY02 FY02Regular program Actual Actual Plan YTD Proj. Output indicators
Project evaluationsICR ReviewsNumber 281 280 280 197 280 Plan: 75% completed within 60 days from receipt
in OED; actual: 71%.$ Million 1.2 1.1 1.2 0.8 1.2 Plan: 100% completed within 90 days from receipt
in OED; actual: 80%.Project Performance Assessment Reports (PPARs)Number 70 70 70 33 70 Increased efficiency in completion time not yet
achieved.$ Million 3.1 2.4 3.3 1.7 2.6Project Impact EvaluationsNumber 1 Product discontinued in FY01 for budget reasons.$ Million 0.1
Country Assistance EvaluationsNumber 10 8 7 7 9 100% CAEs delivered to CODE ahead of CAS
review, where applicable; 7 delivered as targeted.$ Million 3.4 3.4 3.4 2.2 3.1
Sector and thematic evaluationsNumber 6 4 5 2 6 OED input delivered to CODE in advance of SSP
review, where applicable; 2 delivered as targeted.$ Million 5.5 5.2 4.0 3.3 4.6
Corporate and process evaluationsAnnual reportsNumber 2 2 2 1 2 ARDE internal and external formal seminars/work-
shops within three months of completion.$ Million 1.1 0.8 0.8 0.6 0.8Process evaluationsNumber 1 1 1 0 0 Postponed for delivery in FY03 (HIPC report).$ Million 0.5 0.1 0.9 1.4 1.6OtherNumber 2 6$ Million 0.3 0.9 (continued)

2 0 0 2 A N N U A L R E P O R T O N O P E R AT I O N S E VA L U AT I O N
5 0
FY00 FY01 FY02 FY02 FY02Regular program Actual Actual Plan YTD Proj. Output indicators
Evaluation developmentEvaluation capacity developmentNumber 6 7 7 9 9 ECD program with high-intensity support in 9 $ Million 0.4 0.6 0.7 0.5 0.7 countries and low-intensity support in 9 addi-
tional countries; ECD diagnosis supported in 4 countries; 2 new Bank loans with substantive ECD; support for the establishment of IDEAS, draft report on ECD to CODE.
KM, outreach, and learning$ Million 2.4 3.6 3.3 2.5 3.3 10 KM lessons papers; 29 information
syntheses packages; 8 knowledge sharing events; 871 help desk queries; 30 queries disclosure-related; 400 new documents added to the Gate-way; 353 contributors to the Gateway; 2 papers on “Evolution of the Evaluation Function in the Bank”; 45 Précis/FTBs; 4 books; 30 Working Papers; 2 Proceedings, Multilingual and external Web site content management. Training: 18 Work-shops; 11 BBLs; 2 courses on “Rapid and Econom-ical Evaluation Methods” and “Sampling Methods for Evaluation”; 2 core programs delivered to ACS staff; 120 attendees at Workshops; 145 attendees at BBLs; Delivery of “International Program on Development Evaluation Training.”
Methods and staff development$ Million 0.9 0.9 1.3 0.5 1.0 Revised PIF and audit procedures; input to OP/BP
and ICR guidelines for adjustment operations; simplified project evaluation instrument; inputs to ICR guidelines for APLs, LILs, and guarantee-financed operations; tested and refined Country Information Form.
Total for regular program 18.9 19.2 19.2 13.4 19.0
ANNEX 4: FY02 OED SUMMARY WORK PLAN AND RESULTS FRAMEWORK(CONTINUED)

5 1
Each year OED undertakes an evaluation of thequality, relevance, and efficacy of its own prod-ucts and services as background for the AnnualReport on Operations Evaluation. Since 1999,OED has surveyed clients about the quality andoutcomes of its evaluations. The 2001 and 2002surveys sought views from four sets of clientgroups:
(i) Advisors and assistants to Executive Direc-tors (EDs)
(ii) Members of country teams in countrieswhere a CAE has been undertaken
(iii) Staff in the sector/thematic area on foursector and thematic (S&T) evaluations
(forestry, gender II, rural development II,and environment)
(iv) Bank staff in Regions, Network Anchors,DEC, and WBI.
The design of surveys, selection criteria forspecific OED products to be included in thestudy, and procedures for sample selection areavailable on request. The following is a synopsisof the results. This year’s results are compared toresults from previous years where appropriate.1
Response RatesThe surveys were administered to a total of 3,237staff over a 15-day period in February 2002. The
ANNEX 5: OED SURVEYS
0
20
40
60
80
100
ED staff General S&T evaluations
Forest Gender II
Rural II
Environment CAEs CAEs until FY00
CAEs: FY01
and after
TOTAL
Survey
Resp
onse
rate
(p
erce
nt)
2001 2002
F i g u r e A 5 . 1 R e s p o n s e R a t e s
Note: OED surveyed respondents on four S&T evaluations: forest, gender II, rural development II, and environmental sustainability. The results of the survey onCAEs are presented in two sets: CAEs undertaken on or before FY00 and those undertaken since.

response rates ranged from 19 percent to 42 per-cent and averaged 25 percent across all four sur-veys compared to 22 percent for the comparablesurveys in 2001.2 The better response rate may bedue to the use of an external tabulation firm andthe assurance of anonymity.
Readership and Usefulness3
ED staff and Bank staff were asked about thetypes of OED evaluations they had read in the past6 months. The list included country evaluations,sector evaluations, thematic evaluations, projectaudits, and corporate studies. The results are sum-marized in figure A5.2. Among ED staff who re-sponded, all had read OED studies, a comfortingfinding, as the Board is the primary audience forOED reports.
Of the respondents to the general survey ofBank staff, 68 percent had read at least one OEDproduct in the previous six months, of which 47percent reported having read project audits, 35percent CAEs, and 24 percent corporate studies.Of the respondents who hadn’t read OED re-ports, 44 percent noted lack of time. Another 40percent of the respondents noted that they werenot aware of them or did not know where to find
them. Several new staff member respondentsmentioned their lack of knowledge of OED.
Among Network members surveyed about theS&T studies relevant to their work, 35 percent ofrespondents reported having read the respectivestudy, similar to findings last year. An additional9 percent noted familiarity with the main find-ings of the S&T evaluations. Of respondents whohad not read the report, 61 percent said theywere not aware of it (compared to 40 percent ofrespondents in 2001) and a further 9 percentcould not obtain a copy of it. Given that all theS&T studies that were the subject of the S&T sur-veys were available in ImageBank, OED mayneed to be more proactive in the disseminationof studies. Lack of time was a reason for not read-ing the reports for another 28 percent (35 percentin 2000–01).
Respondents who read OED evaluations wereasked to rank usefulness, on a binary scale of use-ful or not useful. ED staff respondents that readOED reports continued to find them useful. Thesame is true of general survey respondents (figureA5.3).
Respondents were asked to comment on thequality of OED evaluations: timeliness, objectivity,
2 0 0 2 A N N U A L R E P O R T O N O P E R AT I O N S E VA L U AT I O N
5 2
0
10
20
30
40
50
60
70
80
90
100
Projectaudits
CAEs Sectorstudies
Thematicstudies
Corporatestudies
Other(specify)
None
Types of evaluations
Perc
ent r
ead/
awar
e of
find
ings
ED staff 2001 ED staff 2002 General 2002
F i g u r e A 5 . 2 R e a d e r s h i p o f O E D E v a l u a t i o n s
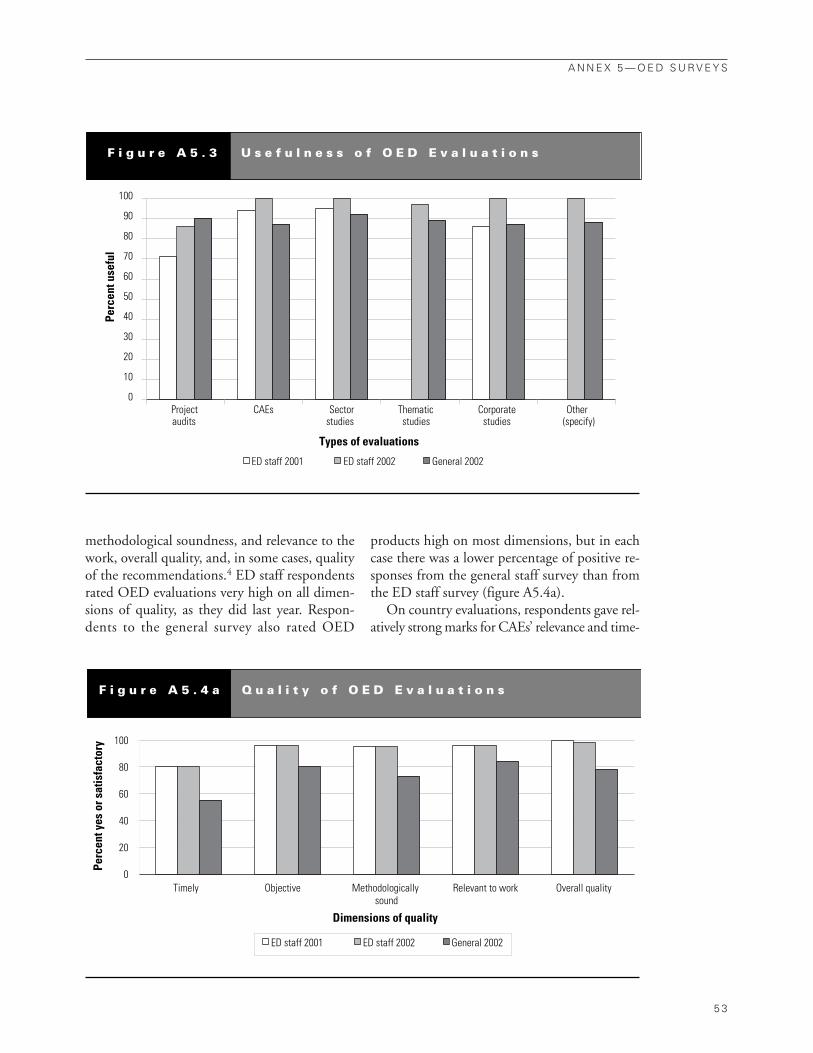
methodological soundness, and relevance to thework, overall quality, and, in some cases, qualityof the recommendations.4 ED staff respondentsrated OED evaluations very high on all dimen-sions of quality, as they did last year. Respon-dents to the general survey also rated OED
products high on most dimensions, but in eachcase there was a lower percentage of positive re-sponses from the general staff survey than fromthe ED staff survey (figure A5.4a).
On country evaluations, respondents gave rel-atively strong marks for CAEs’ relevance and time-
A N N E X 5 — O E D S U R V E Y S
5 3
0
10
20
30
40
50
60
70
80
90
100
Projectaudits
CAEs Sectorstudies
Thematicstudies
Corporatestudies
Other(specify)
Types of evaluations
Perc
ent u
sefu
l
ED staff 2001 ED staff 2002 General 2002
F i g u r e A 5 . 3 U s e f u l n e s s o f O E D E v a l u a t i o n s
0
20
40
60
80
100
Timely Objective Methodologically sound
Relevant to work Overall quality
Dimensions of quality
Perc
ent y
es o
r sat
isfa
ctor
y
ED staff 2001 ED staff 2002 General 2002
F i g u r e A 5 . 4 a Q u a l i t y o f O E D E v a l u a t i o n s

liness, but they found room for improvement re-garding objectivity and perceived clarity of method-ology (figure A5.4b). About one-fifth of the 45respondents to the questions on CAE qualitythought the CAE was of little or no relevance, one-third rated overall quality as fair or poor, and onlya little over half of the respondents thought theywere methodologically sound. Yet 93 percent of re-spondents said that if they were to start work ona new country, they would find a CAE to be use-ful. On the S&T surveys, over 80 percent of the75 respondents thought the studies were timely,and relevant, while 64 percent thought the stud-ies were methodologically sound (figure A5.4b).
To find out whether views of a CAE improvedover time, OED compared the views on “old”CAEs undertaken before FY01 and “new” ones un-dertaken in FY01 or later. Comparing resultsfrom the surveys on CAEs carried out prior toFY01 to the more recently completed ones revealsdifferences that are statistically significant. CAEscompleted before FY01 received more favorablefeedback (table A5.1). It seems unlikely that themore favorable results on older CAEs are due tobetter quality or less controversial CAEs; if any-thing, OED has recently strengthened its CAEmethodology. A more likely explanation is that astime goes on, staff either accept more readily theCAE findings, or with staff and manager turnover,
the new staff and managers look at the evaluationfrom a less personal perspective.
Influence of OED EvaluationsThis year, the surveys asked whether the OEDevaluation(s) read by the respondent or its rec-ommendations influenced the respondent’s viewof development priorities and strategy and whetherthey influenced the Bank’s strategy, lending ser-vices, or nonlending services. Respondents wereasked to rank influence on a four-point scale:strongly, somewhat, little, or not at all.
Among ED staff who responded to the survey,over 85 percent reported that their own views wereinfluenced either somewhat or strongly by OEDevaluations, in the concerned sector, country, orin the Bank as a whole (table A5.2). Two-thirdsof ED staff respondents also said that OED eval-uations influence the way Bank programs andprojects are implemented. Some 75 percent of re-spondents to both the general survey and theS&T survey told us that OED evaluations influ-enced either somewhat or strongly both theirown views of strategy and development policy atthe sector level. Over two-thirds of CAE surveyrespondents reported that the CAE influencedboth their own thinking on country strategy as wellas that of the Bank. The percentages of S&T andCAE survey respondents who reported that the
2 0 0 2 A N N U A L R E P O R T O N O P E R AT I O N S E VA L U AT I O N
5 4
0
20
40
60
80
100Pe
rcen
t yes
or s
atis
fact
ory
CAE 2002 S&T 2001 S&T 2002
Timely Objective Methodologicallysound
Relevant to work Overall quality
Dimensions of quality
F i g u r e A 5 . 4 b Q u a l i t y o f O E D E v a l u a t i o n s

evaluation influenced Bank lending and non-lending operations was lower, at 50 percent to 64percent.
Findings on Annual Flagship Reports This year’s surveys sought feedback on OED’sapex reports: the Annual Review of DevelopmentEffectiveness (ARDE) from the ED staff andBank staff (general survey) and on the Annual Re-
port of Operations Evaluation (AROE) from EDstaff alone.5 Among ED staff respondents, thereadership or awareness of the AROE (68 percent)is lower than for the ARDE (84 percent), al-though almost all ED staff who read these docu-ments rated them as somewhat or very relevantto their work. Among general survey respon-dents, readership of the ARDE is low, at 29 per-cent. But of those who have read it, 89 percent
A N N E X 5 — O E D S U R V E Y S
5 5
Old CAE New CAE
No. of respondents 20 25
Timely? (Yes) 95 84
Objective? (Yes)a 85 56
Methodologically sound? (Yes)a 80 32
Relevant to work? (very/somewhat)a 95 68
Very relevant 45 24
Somewhat relevant 50 44
Of little relevance 5 28
Not relevant at all — 4
Overall quality (good or better)a 85 56a. Statistically significant at the 5% level.
Q u a l i t y a n d I n f l u e n c e o f C A E ( p e r c e n t )
T a b l e A 5 . 1
ED staff General CAE S&T 2001 2002 2002 2002 2001 2002
Number of respondents 56 49 358 45 125 75
Influence your view of strategy
and development policy
In the sector? 90 90 76a — 71 75
In the country? 84 85 — 66 45 —
In the Bank as a whole? 79 88 — — 56 —
Way Bank projects/programs are
being implemented? — 67 — — — —
Influence the Bank’s
Sector/country strategy? — — — 71 — 83
Lending services? — — — 53 — 50
Nonlending services? — — 64 — — 64a. The question in the general survey asked about influence on the respondent’s own view of strategy/development policy in the sector/country.
O E D I n f l u e n c e ( p e r c e n t s o m e w h a to r s t r o n g l y )
T a b l e A 5 . 2

thought it somewhat or very relevant to theirwork (table A5.3).
OED Services The general survey also aimed to measure theawareness and usefulness of OED’s various eval-uation services: project ratings, the OED HelpDesk, summary information such as Précis, les-sons learned, evaluation summaries, and otherOED Web-based documents. Fifty-eight percentof the 551 respondents had used at least one ofthe services, and of these, 94 percent found themto be relevant to their work. Of the respondentswho reported not using OED services in the pastsix months, 44 percent said they were not awarethat such services existed and another 41 percentsaid they had no need of them.
Results by Demographic ProfileOED thought there might be differences in per-ceptions of OED work by staff level, particularlyfor CAEs, and possibly by headquarters versusfield-based staff. Although demographic infor-mation was asked on all the surveys except the EDstaff survey, the numbers of respondents by cat-egory are too small to draw valid conclusions. Theresults by demographic characteristic are availableon request.
Recommendations from RespondentsAll surveys asked respondents how they would sug-gest OED improve the quality of its productsand were provided a list of recommendations the
respondents could check. Table A5.4 presentstheir responses. The most frequently checked rec-ommendations among all respondents were forOED to broaden both internal and external con-sultations and to carry out wider dissemination.Views were more mixed on whether OED shouldemphasize ratings more. Over 40 percent of re-spondents among ED staff and 28 percent ofS&T survey respondents said that more empha-sis should be put on ratings, while among re-spondents to the general and CAE surveys, fewerthan 20 percent of respondents thought thatmore emphasis on ratings was desirable.
Implications for OEDThese survey results point to two areas of im-provement for OED—dissemination and method-ology.
To improve dissemination, OED should work to:• Engage the Networks in identifying how OED
products can most effectively reach interestedstaff.
• Develop a plan for dissemination of majorproducts in the approach paper, which shouldinclude a statement about the target audienceand what the dissemination strategy will be.
• Enhance the range of dissemination activitieson which live presentations and workshopsare conducted in addition to paper and Web-based document distribution.
• Increase publicity for new evaluation reports. • Enhance awareness of OED and products and
services at orientation for new employees.
2 0 0 2 A N N U A L R E P O R T O N O P E R AT I O N S E VA L U AT I O N
5 6
ARDE AROEED staff General ED staff
No. % No. % No. %
Have read it 40 80 105 29 29 58Have not read it but aware of its findings 2 4 5 10Have neither read nor are aware of findings 8 16 16 32Relevance (% very or somewhat): 42 100 95 89 34 97
Very relevant 57 50Somewhat relevant 43 47Of little relevance — 3Of no relevance — —
F i n d i n g s o n A R D E a n d t h e A R O E T a b l e A 5 . 3

To improve methods, OED should:• Include an annex in every study, stating the
methods, data sources used, and possible short-comings and biases in the data.
• Improve the consultation process within theBank. With field office staff, OED shouldmake greater use of technology such as videoconferencing.
• Improve consultation with stakeholders outsidethe Bank, with an explicit plan for focus groups,surveys, structured interviews, and other ap-propriate instruments.
• Continue to work on OED methods for eval-uation, at the project and country level in par-ticular.
A N N E X 5 — O E D S U R V E Y S
5 7
ED survey General survey CAE survey S&T survey
Number 51 373 51 75
Percent responding
Broader external consultation 73 56 36 39
Wider dissemination 51 42 18 44
Broader consultation with Bank staff 41 67 49 59
More emphasis on ratings 41 19 11 28
Less emphasis on ratings 16 21 17 9
Introduce new type evaluation 12 14 —
Track a particular sector/theme 4 9 —
Other 16 40 15
R e c o m m e n d a t i o n sT a b l e A 5 . 4


5 9
Introduction This annex provides an assessment of the impactof a sample of OED country evaluations on coun-try strategies and Bank operations. The findingsare based on a study conducted to trace the im-pact of specific Country Assistance Evaluation(CAE)1 recommendations on country strategyand Bank operations. The study included a struc-tured review of CAEs and CASs and interviewswith CAE and Country Assistance Strategy (CAS)task managers, country team members, and sec-tor specialists. The interviews provide lessons toenhance the CAE process and will supplementfeedback on CAEs obtained from the staff surveyconducted for the AROE.
MethodologyThere were two components to the study. The first,a “tracer study,” identified CAE recommenda-tions and tracked their application in countrystrategies and Bank programs. It is based on a re-view of CASs, active country portfolios, and struc-tured interviews with key Bank staff. The secondincluded countries that have had more than oneCAE: this study reviewed the extent to whichCAE recommendations have been incorporatedinto Bank assistance based on the assessment of“follow-up” CAEs.
The tracer study had two phases. First, CAEswere reviewed to distill key lessons and recom-mendations. This included, where available, in-terviews with CAE task managers to validate keypoints. Each of the CASs that followed was thenrated for consistency with OED recommenda-tions. The second phase analyzed the extent towhich CAE recommendations have been reflectedin actual assistance. This involved a review ofcountry lending and nonlending programs and in-
terviews with a sample of country team mem-bers, based on a questionnaire tailored to eachcountry.
SampleFifteen countries were chosen from the 52 coun-try evaluations produced by the OED CountryEvaluation and Regional Relations Unit. Tencountries were chosen from the sample of coun-tries that had CAEs in FY98 and FY99 to ensurethat sufficient time had elapsed for some imple-mentation of the assistance program to have oc-curred. The CAEs were chosen to ensure that allRegions were included with at least one country,and no more than two. These ten countries were:Albania, Bangladesh, Bolivia, Indonesia, Malawi,Mozambique, Philippines, Sri Lanka, Ukraine, andYemen. The other five were selected on the basisof having follow-up country assistance analysis byOED on that country several years later. These fivewere: Argentina, Ghana, Kenya, Morocco, andZambia. In all cases, the CAEs analyzed werefrom 1998 or 1999; for the five countries that hadfollow-up country assistance analysis or a secondCAE, the focus was on the earlier CAE; the morerecent analysis was used as a reference only.
A total of 25 Bank and OED staff were inter-viewed for both components of the study. This in-cludes CAS and CAE task managers, countrycoordinators, country officers, country econo-mists, and sector and thematic specialists.
CASs Are Highly Consistent with CAEsOverall, CASs are highly consistent with recom-mendations in OED CAEs. Of the 140 recom-mendations identified and tracked for the tenCAEs, only about one-fifth were not reflected inCASs.2 The level of consistency between OED
ANNEX 6: CAE TRACER STUDY

recommendations and Bank strategy was highacross most countries. In Yemen, for example, theFY99 CAE was said to have prompted efforts toreduce the autonomy of Project ImplementationUnits (PIUs) and to reduce the scope and com-plexity of projects. In Indonesia, the shift in thefocus of assistance to direct poverty alleviation wassaid to have been prompted by the FY99 CAE.The consistency between OED recommenda-tions and country strategies is rated moderate inonly one case, Sri Lanka, mainly because no fullCAS has been produced since the FY99 CAEdue to the political situation (a progress report wasproduced, however, in FY99). A full CAS wasdrafted but was initially on hold pending a reso-lution to political uncertainty in the country andis expected to be finalized once the new govern-ment has prepared a Poverty Reduction StrategyPaper. According to the country team, CAE rec-ommendations will become more relevant withimplementation of a full CAS in a less constrainedoperating environment. Thus, in most countriesin the tracer study, the CASs were strongly con-sistent with CAE recommendations.
The tracer study tried to determine why someof the recommendations were not reflected inCASs, to see if there were any patterns that couldprovide lessons for future CAE recommenda-tions. A number of reasons were cited by Bankstaff, including disagreement about overall rele-vance, or specific recommendations considered ei-ther too vague and nonactionable or too specific.CAE recommendations were not addressed inthe following areas:• Monitoring: CAE recommendations for in-
creased monitoring were not adopted by CASsin a number of instances. This included es-tablishing indicators to serve as early financialcrisis warning systems (Albania, Indonesia);poverty monitoring; environmental monitor-ing; and setting quality indicators for social ser-vices. The recommendations were consideredby country teams to be either unnecessary ortoo vague to be useful.
• Pace of reform: In some cases, CAE recom-mendations were considered to be unrealisticor premature in terms of the proposed pace ofreform. This was particularly the case with rec-ommendations on privatization in Bangladesh
and Ukraine and devolution in Sri Lanka (wheredevolution had to be addressed in the contextof a larger political solution to the conflict).
• Specific instrument or specific ESW. CAE rec-ommendations for specific pieces of ESW orspecific instruments were not consistentlyadopted by the CAS. For example, in Sri Lankaa range of CAE-recommended nonlendingwas not addressed.In some cases, recommendations not men-
tioned in CASs were later implemented. In twoinstances, specific OED recommendations on se-lectivity were not taken up in the CAS producedclose to the CAE, but were subsequently adopted(Mozambique, Philippines). In Mozambique, theCAS went to the Board one month before theCAE, and although the draft CAE was availableto Bank management, its recommendations mayhave been too late to be fully adopted. In the 1997CAS for Mozambique, the principle of selectiv-ity was accepted, for example, but it was arguedthat it would take some time to implement withrespect to Bank financing because both govern-ment and donors looked to the Bank to be in-volved in many sectors. Following a donor strategyretreat in FY99 and by the time of the next CASin 2000, selectivity was further advanced. ThePhilippines CAS in FY99, although building onthe FY98 CAE’s recommendations and incorpo-rating most of them, diverged from a specificOED recommendation to discontinue lending inthe social sectors, given the riskiness of the port-folio and the availability of donor funds. Thecountry team noted that the recommendation,considered contentious at the time, was lateradopted as no lending in either health or educa-tion was approved.
Implementation Has Been LessConsistent with CAE Recommendationsthan with CASs Implementation varied either somewhat or con-siderably from the proposed strategy or time-frame in most of the countries. Implementationof 45 percent of the recommendations tracked wasweak or absent.3 The most commonly cited rea-sons were low country capacity and commitment,and shortfalls on the Bank’s part. In some cases,unanticipated changes in the operating environ-
2 0 0 2 A N N U A L R E P O R T O N O P E R AT I O N S E VA L U AT I O N
6 0

ment and, therefore, in country priorities reducedthe relevance of CAE recommendations or pro-posed CAS programs.
Country Factors: • Overestimation of country capacity or commit-
ment (Bangladesh, Philippines)• Unforeseen deterioration in the operating envi-
ronment (governance, Bangladesh; conflict, SriLanka)
Bank factors:• Shifting priorities impact nonlending programs. In
Albania, the FY99 CAE recommendations forsome nonlending activities taken up in the FY99CAS were not implemented given changes in thepriority and allocation of country resources, aswell as activities of other donors.
• Pressures to lend result in deviations from strat-egy. In Kenya the Bank moved from a no-lend-ing scenario—recommended by OED in itsFY97 CAE and proposed in the FY97 CAS—to a program of emergency and adjustmentlending. This higher lending scenario was im-plemented without some of the key gover-nance-related triggers having been met. InMorocco, although the FY97 CAS incorpo-rated many recommendations made by OEDin its FY97 CAE, and some of them were fol-lowed (for example, a Resident Mission was es-tablished and ESW has been betterdisseminated), there were important devia-tions between the FY97 CAS and subsequentlending. In particular, OED recommendedgreater selectivity in adjustment lending and afocus on structural aspects of fiscal problems;the FY97 CAS base case called for one relativelysmall adjustment loan, and focus on fiscal is-sues was prominent in the CAS. During the pe-riod covered by the FY97 CAS, however, morethan half of the lending commitments were foradjustment lending, the triggers to reach thehigh-case lending scenario that included higheradjustment lending were not met, and fiscalproblems were not adequately addressed andcontinue today to be a serious concern.
• Internal Bank incentives inhibit selectivity. In-ternal Bank incentives were cited as a con-straint to greater selectivity in lending and
nonlending activities. Examples includestaff/sector units rewarded for projects andnot for nonlending, and mandatory ESW re-quirements taking up an increasing share of re-sources, regardless of priorities in the countryconcerned (Malawi, Mozambique). A number of country officers/coordinators
would have liked more specific guidance on howthe Bank could/should implement CAE recom-mendations as opposed to strategic goals. For ex-ample, the country coordinator for Malawi foundthat the CAE presented an excellent agenda of thepriorities for government action, but the challengethe team faced was to find ways the Bank couldeffectively support this agenda in the prevailingcountry conditions.
In several cases (Albania, Mozambique), PRSPsor SWAPs were cited as playing an importantrole in enabling the Bank to overcome constraintsand making it possible to implement CAE-CASproposals relating to consultation, participation,donor coordination, and country ownership. ThePRSP/MDG process is also noted for highlight-ing the importance of setting indicators thatcountry teams hope will assist both CAS M&Eand evaluation in the country (Albania,Bangladesh).
Country Team Views on the CAEsThe tracer study included a structured interviewwith country teams to obtain feedback on the CAEprocess as a whole. Bank staff were asked to com-ment on both the country evaluation process andproduct, including the level and nature of inter-action between OED staff and the Region and thestructure of CAE recommendations.
Perceived OED impact is mixed. Overall, staffreported that CAEs provide useful input for theCAS process and for incoming country directorsand country officers/coordinators. Dialogue withthe country team in preparing the CAE was saidto have been useful in stimulating new approacheswithin the team. In other cases, however, CAEswere said to have reinforced conclusions the Bankhad already arrived at (Bangladesh, Philippines,Ukraine).
Timeliness. Almost one-third of respondentssaid that CAEs needed to be scheduled to allowsufficient time for lessons to be incorporated into
A N N E X 6 — C A E T R A C E R S T U D Y
6 1

Bank strategy. One country economist noted thatthe high level of interaction with OED during CASpreparation had proven “somewhat taxing.” Onlyin the case of Mozambique was the CAE thoughtto have come too late to influence the CAS.
CAE recommendations should be actionable butnot restrictive. According to respondents, the typeof CAE should vary depending on the type ofcountry. For countries with an established historyof engagement with the Bank, strategic direc-tions are considered clearer and detailed sector-specific recommendations more useful. In-depthsector analysis was also said to be particularly rel-evant for big countries with large lending pro-grams. Many CAE recommendations were foundto be too generic to be useful, or lacking internalconsistency. For example, recommending greaterselectivity without identifying activities to be cutback, or advocating the mainstreaming of envi-ronment or gender in the CAS without evidencefrom the CAE.
Overly detailed sector recommendations wereseen as inhibiting the flexibility needed by the Re-gion to respond to changes in the implementingenvironment. One example of overly compre-hensive recommendations is the MozambiqueCAE, which includes sector-specific recommen-dations in each chapter as well as overall recom-mendations for country strategy. Identifyingindividual potentially monitorable elements fromeach recommendation leads to hundreds of in-
dicators, without any clear guidance from theCAE itself on prioritization. In addition, manyof its recommendations endorsed existing ap-proaches.
Implications for the CAE ProcessThe tracer study highlights the need for greaterconsistency in both the structure and purpose ofCAE recommendations. Based on the review con-ducted, suggestions to improve the structure ofCAE recommendations include:
i. Include more specific guidance on how rec-ommendations are expected to be imple-mented.
ii. When the CAE is linked to a new CAS, en-sure it is completed before the CAS is due.
iii. Limit or exercise greater selectivity in thenumber of recommendations.
iv. Separate recommendations from endorse-ment of existing approaches that are alreadyinternalized by the country team.
v. Specify indicators where relevant.
Changing country conditions and institutionalpriorities are liable to make specific recommen-dations less relevant over time. It is the spirit ofrecommendations or the strategic direction ofthe CAE that is most important. This points tothe need for self-monitoring and self-evaluationand the value of follow-up CAEs.
2 0 0 2 A N N U A L R E P O R T O N O P E R AT I O N S E VA L U AT I O N
6 2
6 3
On July 17, 2002, the Committee on Develop-ment Effectiveness (CODE) met to discuss thefindings and recommendations of the 2002 An-nual Report on Operations Evaluation (AROE),along with the draft Management Response to theAROE, prior to their both being discussed at theBoard on August 1, 2002.
Background. CODE and the Board review theOED AROE on an annual basis, as part of theiroversight function to assess, the adequacy of andprogress in the Bank’s control, monitoring, andevaluation processes. The FY02 AROE providesa ten-year perspective on developments in riskmanagement and monitoring and evaluation. Itconfirms that solid advances have been made inM&E and development risk management. Butsubstantial gaps also still remain. Key recom-mendations to enhance the Bank’s evaluation andcontrol framework are that: (a) the Bank designperformance measures to track achievements inrelation to the MDGs; (b) strengthen the evalu-ation and control framework for sector strate-gies, partnerships, and grants, including developingan operational policy for evaluation; (c) improveself-evaluation and risk assessment at the coun-try level; and (d) improve and widely disseminateOED’s evaluation methodologies.
Conclusions and Next Steps. The Committeecommended OED for an impressive report andwelcomed its focus on risk, monitoring and eval-uation (M&E), and results-based management(RBM). The Committee endorsed in generalthe findings and recommendations of the AROEand felt that it raised a number of important anddifficult issues, but cautioned that the Bank mustbe clear about the limits of outcomes measure-
ment. The committee stressed that the focus onmeasuring results will inevitably be complex andexposes the Bank to risks. Members stressed theneed for evaluation to support better the Bank’smove toward results-based management, espe-cially in an environment where accountability ofinternational institutions has greater visibility.Management agrees with the overall thrust ofOED’s recommendations. The Board will discussthe report on August 1, 2002. The revised Man-agement Response will be shared with the com-mittee prior to its adoption into the FY03 MAR.
Committee members discussed a number of is-sues, including risk assessment and mitigation; out-come measurement and the MDGs; links betweenassessment and results; M&E capacity and OEDevaluation methods; and the management re-sponse to the report. The following specific pointswere raised:
Risk Management. The committee asked to hearmore about how management is proceeding in thisarea, including the status of the Risk AssessmentCommittee. Management noted that risk man-agement and better risk taking were now widelyaccepted as key to securing good development re-sults and that the challenge was to integrate themany control mechanisms already in place acrossthe Bank into a more coherent framework. Mem-bers would have appreciated a broader focus onrisk beyond development and operational risks.The DGO noted that while this report focusedon development risk, other aspects of risks werebeing addressed in other committees. The com-mittee agreed with the AROE’s recommendationthat an integrated risk management frame-work was essential to address all aspects of risksfacing the Bank. The committee stressed that it
ANNEX 7: CHAIRMAN’S STATEMENT, COMMITTEE ON DEVELOPMENTEFFECTIVENESS (CODE)

would be essential to look more carefully athow to align incentives and processes to improverisk management, and to avoid layering heavy andcostly controls onto Bank operations.
Outcome Measurement and the MDGs. Thecommittee recognized the limited collective abil-ity of the Bank and its partners to measureoutcomes and address attribution issues at thecountry level. The committee stressed the needfor the Bank to be clear about the limits of out-comes measurement, including with respect to theMDGs, to avoid unrealistic expectations andheightened reputational risk. It also stressed theimportance of moving quickly to develop someintermediate indicators to allow the Bank to trackprogress. OED said that the next AROE willfocus on the MDGs and that it would benefit frommanagement’s ongoing work on measuring for re-sults.
Links between Assessments and Results. Thecommittee said it would like to hear more aboutthe links between results and OED’s evaluationapproaches. The DGO highlighted that evalua-tion had demonstrably improved the Bank’s per-formance, especially at the project level, and thatit was now crucial to fill the evaluation gaps at thecountry and the global levels. Some speakers saidit would have been helpful if the paper had high-lighted more strongly where OED feels internalarrangements are resulting in better outcomesfor borrowers, and how best to address concernsabout gaps in the methodology. OED pointedto prior evaluations dealing with various aspectsof the question and concluded that areas in theBank’s programs with weaker risk assessmentprocesses tended to have poorer outcomes and per-formance. Speakers noted that accountabilitywithin matrix management, including with re-gard to the role of the Regions and networks inquality assurance, remained a challenge and theysuggested that it would be useful for CODE torevisit this issue.
The committee noted that programmatic lend-ing presented particular challenges to evaluationand to tracking results and asked for further workby OED about the relative merit of investmentversus programmatic lending. The committee
agreed with OED’s proposal to strengthen the con-trol and evaluability of grant-funded Bank activ-ities. Some also supported applying the samecontrol and evaluation standards for tradi-tional investment loans to grant funds, as away of increasing accountability and results. OEDinformed the committee that it is working withmanagement on addressing the challenges pre-sented in evaluating programmatic lending, givenits longer time frame and objectives.
M&E Capacity and Evaluation Methods. Thecommittee was cautious about supporting OED’srecommendation that monitoring and evalua-tion (M&E) be made a fiduciary requirement.OED noted that there is a statutory requirementto undertake an evaluation on every lending op-eration at completion and that M&E is man-dated as a requirement as well. Members requestedmore information on the implications of rigorousimplementation of such a requirement for theBank and for its clients. Members raised other is-sues related to M&E, including the importanceof the Bank as a knowledge Bank makingdemonstrable progress in its efforts to buildcountries’ capacity for M&E. It would be im-portant to encourage country ownership andmanagement of M&E systems, but at the sametime to avoid building institutional enclaves.Members also stressed the urgency of OED andmanagement agreeing on an approach to coun-try evaluations. The committee encouraged ef-forts to incorporate the views of clients and theexpanded use of tracer studies into OED’s self-as-sessments. Management informed the committeethat it, with OED’s advice, was well advanced inthe development of an umbrella operational pol-icy for evaluation.
Board and Committee Review of Annual Re-ports. A member suggested that in the future itwould be useful for papers coming for Commit-tee and Board review, including the Annual Re-ports on Evaluation, to state clearly in the paperthe reasons for Board consideration; areas inwhich Board comment was being sought; thechoices open to the Board; and the actions ex-pected of the Board. OED noted the committee’srequest for more specificity in its reports on what
2 0 0 2 A N N U A L R E P O R T O N O P E R AT I O N S E VA L U AT I O N
6 4

was being sought from the Board and also notedmember’s requests for more detailed recommen-dations. OED underlined that CODE and theBoard were the main clients for the apex reports.
Management Response. The committee wel-comed the alignment of the management re-sponse with the AROE’s recommendations butwould have appreciated more specificity withrespect to the actions management planned to
take to address the AROE‘s recommendations.It was agreed that management will update its re-sponse to OED’s recommendation regarding per-formance measurement in the context of theBoard’s discussion of the report and the Devel-opment Committee’s review of the paper BetterMeasuring, Monitoring, and Managing for Devel-opment Results in September 2002.
Pieter Stek, Chairman
A N N E X 7 — C H A I R M A N ’ S S TAT E M E N T: C O M M I T T E E O N D E V E L O P M E N T E F F E C T I V E N E S S ( C O D E )
6 5


6 7
Chapter 21. Over ten years up to FY89–91, the propor-
tion of unsatisfactory outcomes of lending oper-ations had increased from 13 to 34 percent andthe share of problem projects in the portfolio,from 10 to 17 percent.
2. OED’s Review of Aid Coordination and theRole of the World Bank, Report No. 19840, Octo-ber 1999, found that survey respondents (Bankstaff, government officials, and donor representa-tives) thought that aid coordination was highly rel-evant for poverty reduction, but were neutral tonegative in their assessment of the impact of aidcoordination on poverty reduction (pp. 9–16).
3. AROE 2000–01, pp. 11, 21–22.4. Evaluation of the World Bank’s Knowledge
Services and The World Bank’s Approach to GlobalPrograms: An Independent Evaluation.
5. Bank research found evidence that IBRD bor-rowers prefer other sources of financing (domes-tic, bilateral, Regional) to Bank funding forinfrastructure such as dams, slum upgrading, trans-portation.
Chapter 31. For example, if benefits were delayed by a year,
if costs went up or output prices declined by 10percent, etc.
2. Management notes that appropriate and con-sistent identification, mitigation, and managementof risks are just as important in investment proj-ects as in adjustment operations, with the recordshowing no significant difference in the treatmentof risks between the two lending instruments.
3. AROE 2000–01, p. 11. 4. An OED study of grant programs made five
specific recommendations (see Précis 224, “GrantPrograms: Improving Their Governance”). OED’songoing evaluation on Global Programs reviewsprogress on each of them.
5. “The World Bank’s Approach to Global Pro-grams: An Independent Evaluation,” March draft,p. 36.
6. This applies equally to partnerships. Someprogress has been made recently by DGF guide-
lines on in-house secretariats, but DGF still needsto strengthen the arm’s-length relationship withprograms that are essentially carried out within theBank, such as the Public-Private InfrastructureAdvisory Facility.
7. To establish a baseline for the ongoing qual-ity improvement effort, QAG, at the request ofmanagement, reviewed the quality of CPARs andCFAAs carried out between January 2000 andJune 21 (prior to their being mainstreamed asESW products) and found, as expected, that thequality was lower than for ESW, when measuredagainst the same standards.
8. Relevant IMF instruments are the Code ofFiscal Transparency, Safeguard Assessments (re-lating to central banks), and Red Cover Reports.In December 2001 the Bank and several partnerslaunched the Public Expenditure and Financial Ac-countability Program to reduce transaction costsborne by client countries from potentially over-lapping diagnostics. The program will inventorydiagnostic instruments and develop a compre-hensive approach to their use.
Chapter 41. Management believes that this conclusion
neglects the fact that Regional sector managers re-port to both Network and Regional sector man-agement.
2. In an attempt to compare OED and QAGfindings on ESW, we found only 13 reports that hadbeen assessed by both OED and QAG out of a total265 examined by QAG. OED looks at ESW pri-marily in the context of country, sector, and thematicevaluations, and often relies on QAG evaluationsfor assessment of quality. For the 13 products thatOED had reviewed, there were few disagreements,and they focused mainly on likely impact (assessedby QAG) versus actual impact (assessed by OED).
Chapter 51. Inspection Panel Reports are simultaneously
distributed to the Board and senior management.2. Management notes that although manage-
ment and staff have considered the OED method-
ENDNOTES

ology in some detail, there is no consensus that it isthe tool needed for more consistent self-evaluation.As noted in figure A5.4b of Annex 5 of this report,the quality of Country Assistance Evaluation method-ology is an issue. To address the challenge of im-proving self-evaluation in country assistance strategies,management will focus on this topic in its on-goingwork on better measuring, monitoring, and man-aging for results; a report is scheduled for discussionby Executive Directors in September 2002.
3. “Measuring Outputs and Outcomes in IDACountries,” Board paper prepared in context ofIDA13 replenishment process.
Chapter 61. Even in a performance-based evaluation sys-
tem, it is useful to have background documentationof the process by which a given strategy was arrivedat, or a project design put in place, to learn fromsuccesses and mistakes. Such documentation has be-come scarcer since decentralization and email.
2. “Building Staff Capacity for Development:A New Learning Framework,” May 2001, p. 2.
Chapter 71. The tracer study was a desk review of Bank
documents, supplemented with interviews of Bankstaff. Several of the countries mentioned here havehad more recent CAEs; the period reviewed wasbetween the earlier CAE (FY98 or 99) to De-cember 2001. A more detailed presentation ofthe tracer study is in Annex 6.
2. Management does not concur with this in-terpretation of events. The lending in question wasin response to opportunities to assist clients in areasof strategic priority.
Chapter 81. Management notes that the record shows no
significant difference between adjustment and in-vestment lending instruments in the extent towhich risks are appropriately and consistentlyidentified, mitigated, and managed.
2. OED has been carrying out sector-, the-matic-, and country-level evaluations for over five
years, but for purposes of an operational scorecardthat measures performance in a consistent andregular way, and to enhance organizational learn-ing, self-evaluation at all levels must be strength-ened.
Annex 11. The drop in the assessment ratio after FY96
reflects the agreement between OED and theBoard to reduce the percent coverage to allowOED to focus on evaluations at a country, sector,and thematic level.
2. For FY96, this translates into a total of 63ICRs with satisfactory or better performance in-dicators for the future out of a total of 180 ICRsreviewed, or a rate of 35 percent satisfactory; forFY01, the corresponding number is 53 percent.For the plan for monitoring and evaluation, a totalof 53 ICRs were rated satisfactory or better outof 180 ICRs reviewed for FY96 exits, for a rateof 29 percent; the corresponding figure for FY01exits is 34 percent. The projects themselves mayhave had such indicators or plans for monitoringand evaluation, but the ICR did not reflect this.
3. QAG uses the term “net disconnect” to de-scribe differences in rating changes between op-erations and OED. This term is defined as, “thedifference between the percentage of projectsrated as unsatisfactory by OED and the percent-age rated by the regions in the final PSR as un-satisfactory for achieving their developmentobjectives.” The term “net disconnect” applies toonly one of the four instances for “rating change.”
Annex 31. Four of the 46 closed projects were not rated
for outcome. They were: (i) Mexico’s Federal RoadsModernization Loan, $475 m, never signed, with-drawn 18 months after Board approval, with-drawn because of lack of counterpart funds anddifficulties in implementing resettlement; (ii) Mex-ico’s Aquaculture Loan, $40 man, cancelled afterthree years with only $1 man disbursement; Min-istry of Finance did not agree with project; (iii) In-donesia’s Maluku Regional Development Project,$16.3 man, cancelled after about two years due tocivil unrest; and (iv) Russia Second Highway Re-
2 0 0 2 A N N U A L R E P O R T O N O P E R AT I O N S E VA L U AT I O N
6 8

habilitation and Maintenance Loan, $400 man, al-lowed to lapse nine months after Board approvalbecause conditions for effectiveness (PIU) were notmet. All four of these were considered satisfactoryby QAG at the time of entry.
Annex 51. In 1999, OED piloted very short surveys on
S&T evaluations and CAEs, PPARs, ICR Re-views, and Outreach. The following year the sur-veys were substantially changed. This year, samplingwas somewhat different than last for the CAEsurveys and the wording in some questions was alsochanged to make the meaning clearer. In both1999 and 2001, the number of responses to someof the surveys and some questions was low. Com-parisons of this year’s survey results with previousyear’s survey results are therefore valid only for cer-tain questions in some of the surveys, and theseare presented here.
2. The response rate in 1999 for CAEs was 39percent (n=41) and for S&T evaluations was 46percent (n=59).
3. In 1999, the survey targeted the variousOED publications products: working series, FTBs,précis, evaluation reports, etc. No individualbreakup of the evaluation reports was undertaken.Hence results from 1999 are not comparable.
4. Respondents also rated the evaluation onquality overall using a 4-point scale: excellent,good, fair, and poor. A scale of highly satisfactory,satisfactory, unsatisfactory, or highly unsatisfactorywas used in 2000–01.
5. The AROE reviews the control and evalua-tion frameworks in the Bank and is not directlyrelevant to operational staff.
Annex 61. For the purposes of this note, the term CAE
refers to all OED country evaluations, includingearly evaluations entitled “Country Assistance Re-view” and “Country Assistance Note.”
2. Recommendations are not weighted for sig-nificance.
3. Recommendations are not weighted for sig-nificance.
E N D N O T E S
6 9


COSO (Committee of Sponsoring Organizationsof the Treadway Commission). 1994 “InternalControl—Integrated Framework.” New York.
OED (Operations Evaluation Department). On-going. “The World Bank and Global PublicPolicies and Programs: An OED Evaluation.”http://www.worldbank.org/oed/gppp/#1
———. 2002a. “Grant Programs: ImprovingTheir Governance,” OED Précis No. 224,Summer 2002. Washington, D.C.
———. 2002b. Annual Report on EvaluationCapacity Development. Washington, D.C.
———. 2002c. IDA’s Partnership for Poverty Re-duction: An Independent Evaluation of FiscalYears 1994–2000. OED Study Series. Wash-ington, D.C.: World Bank.
———. 2001a. 2001 Annual Review of Devel-opment Effectiveness: Making Choices. OEDStudy Series. Washington, D.C.: World Bank.
———. 2001b. 2000–2001 Annual Report onOperations Evaluation. Washington, D.C.
———. 2000. 2000 Annual Review of Develop-ment Effectiveness: From Strategy to Results.OED Study Series. Washington, D.C.: WorldBank.
———. 1999. Aid Coordination and the Role ofthe World Bank. Report No. 19840. Washing-ton, D.C.: World Bank.
World Bank. 2001a. “Building Staff Capacity forDevelopment: A New Learning Framework.”Washington, D.C.
———. 2001b. Assessment of the Strategic Com-pact. Washington, D.C.
———. 2000. World Development Report2000/2001: Attacking Poverty. New York: Ox-ford University Press for the World Bank.
———. 1990. The World Development Report1990: Poverty. New York: Oxford UniversityPress for the World Bank.
WBI (World Bank Institute). 2001. “The Per-formance of WBI’s Core Courses, FY99–01.”WBI Evaluation Brief. Washington, D.C.
7 1
REFERENCES
