world bank document - documents &...
TRANSCRIPT

RETURN TOREPORTS DE tSK
WITHINONE WEEK
DOCUMENT OF INTERNATIONAL BANK FOR RECONSTRUCTION AND DEVELOPMENTINTERNATIONAL DEVELOPMENT ASSOCIATION
Report No. 472
FILL UmP
RAILWAY TRAFFIC COSTING
April 1974
Transportation Projects Department (CPS)Prepared by: Frederick Sander, Consultant
IThis report may not be published nor may it be quoted as representing the views of the BankGroup. The Bank Group does not accept responsibility for the accuracy or completeness of thereport.
Pub
lic D
iscl
osur
e A
utho
rized
Pub
lic D
iscl
osur
e A
utho
rized
Pub
lic D
iscl
osur
e A
utho
rized
Pub
lic D
iscl
osur
e A
utho
rized

Pro-forma Analysis of Operating Expenses 109
J, r'o ,'n for Separation of Mainline Locomouive Cre-Expenses Between Services 115
R, FrmulUa for Separation o' Mainline Locooio e ?uelE.xoenses Between Services 117
.In'rest Charges on Capital 118
Freight Traffic Unit Costs 119
Fo. F(orula for Calculating Carload Shunting andMarshaling Costs 120
1. nalysis of Freight Traffic Unit Costs - AnAczual Case 124
.J. Er?y R-eturn Haulage C asts xnd Com,modity Costsfrom Average Round-Trip Costs 125
K. Freight Traffic Cost Sheet for Carload Traffic ,28
L. F'reight Traffic Cost Sheet for Trainload Traffic 130
Freight Traffic Cost Sheet for Calculation ofLong-Run Variable Cost at, Varying Lengths of Haul 132
N. Pro Forma Separation of Costs of Passenger, Mail andExpress Traffic 133
0. Analysis of Long-Thrn Variable Costs for a Railway -An Actual Case, 1971 136

Chapter I
INTRODUCTION
A. THE NEED FOR AND PURPOSE OF TRAFFIC COSTING
1.01 It is axiomatic that accurate knowledge Cf production costsis essential for the success of any enterprise and that in the face ofintense competition any enterprise lacking such knowledge will find itextremely difficult to survive.
1.02 The objective of costing is to provide data essential fora wide field of management decision, and, particularly in the case ofstate-owned railways, for the formulation of national policy in thetransport field. In summary, the principal purposes of costing are:
(i) Setting of realistic prices (rate-making).
(ii) To provide data for profit analysis of existing andpotential business, which in the case of a railwaywill include not only rates and fares but also line,station, and service profitability.
(iii) Cost control.
(iv) To permit evaluation of economies to be secured fromoperating and technological changes.
(v) To provide data needed for comparison of costs betweenthe different transport modes required in the con-sideration of alternatives.
(vi) To provide data for evaluation of further capitalinvestment.
1.03 The primary objective of railway construction in the under-developed areas of the world was to stimulate economic growth and togenerate for the railway as much traffic as possible. To achieve thisend, export commodities, products of agriculture, and other items ofdomestic production were often carried at very low rates, whereashigher-valued imports and other desirable but less essential goods werecharged at higher rates. The intent of these policies was in the earlydays of development generally fully justified by tne results achieved,viz., the stimulation and development of productive capacity in areasremote from centers of consumption or overseas markets.
1

1.C4 The principal guide for setting rates was the old basicDr4nciDle of "charging what the traffic w-ll bear." Rates establishedin accordance with this principle, except by coincidence, bore littlere'ation to the actual cost of transport. As long as railways wereable to operate in monopolistic or quasi;-monopolistic conditions theycontinued in practically all cases to charge on this value-of-servicebasis rather than a cost-of-servicz basis, and in certain cases wherecompetition from other modes of tr.ansport has not developed o- isrestrictively controlled by Goverrment decree, they continue to do so.However, in most countries the emergence of competion from other trans-port modes, particularly from. the roads, over progressively increasingdistances, has forced the railways to adjust tariffs closer to a cost-of-service basis.
1.05 Unfortunately rmany railways have not yet established acosting system, and their rates therefore may not be set so as toatract all the traffic that the rail-ay can carry at lowest cost, ormay not fully compensate in areas of high railway costs. The economicsof rai and road transport are ver-y different. For freight traffic thera.-ilway is best suited to the movement of large volumes over longdistanoes. It cannot compete with the roads for small quantities oftraffic or where the distance is so short that its lower line-haul costscannot offset its higher terminal costs. WiTithout a rate structurerelated to costs it is likely that the railway will continue to handletraffic that could be carried more cheaply by road, while traffic thatcould more economically be carried by rail is moving by road. In bothcases the railway loses, but more importantly there may be duplicationof investment in the transport sector, which is undesirable in countriesw,jhere investnent funds are a very scarce resource. For passengers,essential services are provided by the railway in many urban areas,although usually at the cost of large investment in equipment, much ofwhich is underutilized except at peak periods; for long-distance travel,trains are generally too slow to compete witlh air travel at\higher-classfares, and although, by comparison with road transport they miay havedistinct advantages of safety and comfort, rail service is usua.lly ableLo compete only at low fares because of the higher frequency and speedof road service. In many countries railway managements allege thatpassenger services operate at a loss, but rarely can the allegation beproved oy facts and figures.
1.06 For these reasons, which are related to items (i) and (v)in-para. 1.02, it is clear that an adequate traffic costing system shouldbe maintained or developed. In addition the evaluation of furthercapital investment is particularly important, ar.d this cannot be donewithout sound costing infonmation. The same infornation is essentialfor the identification and evaluation of losses, if any, that may beincurred on particular sections, stations, or services, or of the benefits
2

that may accrue from changes in cperatLag and technical methods..Vinally, adequate control of expense is not possible unless -t isclosely integrated with an adequate system of cost determination. Aknowledge of costs is essential to a wide range of managerial decision,and a sound costing organization should be an indispensable element ofthe administrative structure.
B. HIS'ORIC CO6T
1.07 It should be emphasized that future costs are the onlymeaningful costs f'or purposes of pricing, investment evaLuatioln, orother decisions affecting the progress of thre railways. However, inorder to determine what future costs are likely to be, it is necessaryto begin by analyzing past costs on the basis of the mosti recent account-ing and statistical records.
1.08 Every element of administrative, operating, repair, andmaintenance expense should be studied, first to determLine whether thee*nense incurred in the accounting period was normal. For- ex n_e, didit include extraordinary costs for overtaking deferred maintenance, orwages of staff made redundant by technological change but kept inemploynent in anticipation of increasing traffic? Conversely, was work-shop and other repair output adequa.te to maintain the plant and equipmentin good condition at existing levels of operation?
1.09 It will then be necessary to consider the degree of vani-nbility of each element of expense in response to changes in trafficlevels. This is a subject that is considered in detail in tne followingsections, but here it is necessary to point out that a close relatione:ists between expense variabilituy and the existing and potential capa-city and utilization of the railway's plant and ecuipment. To makepossible a realistic projection of future costs the present level ofutilization of track, yards, locomotives, cars, workshops, running sheds,and other plant should be related to their potential capacity, asexpressed in terms of repair output, train-km, net ton-km, or otherrelevant measurement. With these data it will then be possible toproceed to the assessment of future costs.
1.10 The value of historic costs will depend not only on thespeed and promptness with which the accounts are made available butalso to a greater degree on the consistency of the primary classificationof expense with the data required by the cost office. It is too oftenthe case that, in the interests of simplicity and economy, expenses arelumped into broad accounting descriptions that were not designed with:costing in mind. To take an example, many railways maintain a singleexpense classification for Maintenance of Permanent Way, which includesno't only running and yard track maintenance, but also repairs to theslopes of bawnks and cuttings, drainage, bush and grass clearance, and
3

.ree felling. The costs of maiLntaining tihe track are determsined to someext:ent by weatcher and tiime but more significantly by physical wear and
'-.emnent caused by the passage of trains. A degree of cost variabilityrelaLlve to the volume of traf'ic car the:-e'fore De shown. The costs of
D.e othe :-!ork mentioned above are due entirely to weather and time andc7rn be considered as fixec at any level of traft-fc. Yet in rarlj areas,narticularly in tropical rain forest, TIey co,.prs e the greate- part ofa;aiLntenance of Permanent a,ay costs. Fuor cos g purposes, therefore,
it is necessary to differentiate between track maintenance and maintexi-ance of the remainder of the right of way. A revrised form o" CLassi.Vicationof Operating Erpense that will give a more -.meaningfui breakdowun of costsin this and other context is -proposed in apnedix A. Cenerally it isfound that, existing classifications do not provide this amount of detail,but experience has sho,mr that sufficient background information can usuallybe extracted from satistics and establisnhment lists to enable reasonablyaccurate cosL data to oe determined. The process may be time-consuming.Appendix A proposes a method of reducing the amount of this supp'lementaryaccounting analysis. The suggested format should of coursa be r-efinedand adapted to suiu local needs.
C. FUT rI.Pp4 COSTS
1.11 After thus analyzing the normal expenses incurred during thenOeVious accounting period and their degree of variability in responseto charges in traffic 'evels, it next becomes necessaxy to translate theminto future costs, after 6etermining:
(i) Traffic forecasts for, say, the next five years.
(ii) Potential capacity and present utilization of plantand equipment.
(iii) Projected technological and operational changes.
(iv) Probable changes in wage and price levels.
(v) Economics of projected renewal and rehabilitationprograms.
12),' .hcduzed to the very simplest terms, if it should be possible!;Wo h:inKIe the traffic forecast within the capacity of existing plant andeouLpment, if wages and orlces were expected to be completely stable andito cechrnoogical iTrmrovements were to oe foreseen, then variable expenses
_ uo, incre.--se proportionately to traffic growth while fixed expernses

would remain unchanged. In other words the variable cost per unit ofoutput would remain the same while fixed expenses would be spread overmore units and the total cost per unit would be proportionately reduced.
1.13 Such an excessively simplified state of affairs is neverlikely to occur. Whereas many rail'ways may find that4 capacity of thetrack and structures is ample to cone with the g-owth of traffic in theforeseeable future, it is rost likely that, if t1he g:-outh rate isreasonably healthy, some additional locomotives. rolling stioc), and plantwill be called for, while some existing equipment will no doubt need tobe replaced. The new locomotives and rolling stock, whether additionsor replacements, will almost certainly be more efficient and of greatercapacity than the oldest or the average units of the existing fleet. Theaverage trainload may therefore be expected to increase, and conseouentlythe projected increase in locomotive and train-Iaa will be less than pro-Dortionate to the forecast increase in traffic0 In certain cases it maywell be that the additional traffic can be handled with no incnease oreverl a decrease in train-km. In these circumstances many elements ofexpense that might normally be considered to be variable costs aillremain static during the period of the traffic projection. Thev becoiae,in effect, capacity costs, i.e., the cost of purchasing capacity to movetraffic whether or not that traffic is actually moved. Up to the limitof their capacity they are neither truly fixed costs nor direct'ly variablecosts. In the specific case in question they will include workshop,running shed, locomotive, and train crew expenses.
1.14 To secure the benefits described in the previous paragraph itmay be necessary to undertake substantial investnent, e.g., lengtheningcrossing loops to accommodate longer trains even though line capacity maybe otherwise sufficient to handle the traffic projection. Drawgear onexisting stock may require strengthening. Interest and depreciation onthis investment, and on any other additional investment that may benecessary, will become an element of future costs.
1.15 The benefits likely to be derived from any technologicalimprovement, such as the introduction of more efficient forms of traction,mechanical track maintenance, Central Traffic Control, etc., should becarefully and realistically assessed, either from comparative historiccosts, if available, or from reliable estimates prepared by technicalofficers. Similar attention should be given to possible savings in repairexpense that might be expected to result from replacement of old assetsby new, even where no operating or technical improvement may otherwiseaccrue.
1.16 WJhatever reduction in expense mav be secured from improvedtechnology, it is necessary also to look at the other side of the equationand consider what changes are likely to take place in the levels of wagesand other staff costs, and of material prices. For tnis purpose, a stuadyshould be made of past trends, over a period p2 at least 7 years, first

Wa:-.es and salaries, and then of other staff' and social secuLrity costs.r.- average annual emolaments and other costs per man employed should be
-~o.?-.rc with the trend of the consux;er p-rice index during the period.is often found that real wages and sala-ies have increased aT; a reason-
ao':y steady pace arnd that there is a corre'ation beteer salaries and.;i-es on the o%ie hand and other staff cosAs, including retireeant andsocil'. secuai=t benefits on the other, exceDt, of cou-rse, ;ae:re new -rulesnr le-islation may have altered the bases of calculation of' the latter.For the future, a projection of the .ossible trend of consu-mer prices(which usually reflects the inflationary -rend) is gener-ally a usefu_starting point for assessment of prospective wage levels. This ard anyother 'Imown local factors, such as policy of either allowin- increasesin wages in real terms or of limiting increa.,3es, should be kept in1 viewand future wage levels, etc., posvulated. In the case of .material pricesthe Purchasing or Stores Department should be able to advise the trend ofprices of major classes of consurable materials and give a consideredopinion of future prospects. Reference should also be made to nationallymaintained price indices.
D. VAI3CYING LFEVEL OF CAT
1.17 It is a misconception -to assume tnat on any railway there isa single cost of movinc a ton of freight or a passenger over a specificdistance. It is of course a simple process to divide total cost by totaltraffic and so produce a cost per traffic unit, but this is nothing morethan a statistical presentation of accounting history. The resultantfigure is not likely to be valid for the future or for any specific trafficexcept a negligible minority that approximates in all characteristics tothe average. In an industry so complex as a railway an average fullydistributed cost has little value, except possibly as a statistical indexof trend. The varied objectives of cost determination have been summarizedin para. 1.02. Each of these will involve a different concapt of cost.
1.18 The cost characteristics of railway operation show a. ratioof fixed to variable cost that is higher than for other modes of trans-portation except pipelines. Fixed costs are those which do not changein magnitude when the quantity of output varies. It is therefore im-rossible to assign any specific portion of these costs to a particularunit of output, e.g., a particular ton-km of traffic. Rather, fixedcosts must be imputed to the entire supply of the type or types ofservice with which they are associated. Any attempt to apportion themnmong particular services or commodi ty movements in order to producefull (i.e., "fully distributed" .or "fully allocated") costs must of.neces ity be arbitrary. It falsely assumes that all costs carn be traced1 prnrticular kinds or quantities of output and can rationally enter
directly in-o pricing decisions. The guide for setting a "minimum" oriceter any railway service should rather be the relevanrt, variable cost of
6

providing the service. The produzt of all prices must, if trhe railwayis to reria-.n viable, exceed variable costs by a .argin sufficient toccier fixed costs, but it is essential that t'he burdern of fixea costsshould be spread over as large a vol'Ume of traf-ic as can be developedzith attractive rates in excess of the relevant variab_e costs.
1.19 Other elements of' railway cost, refe^red tG as 'capacityccsts," are costs of providing capaciLy of one kTind or another inexcess of present utilization and may be considered -to be tempo rarilyfixed until such time as that specific capacity is absorbed by increas-ing traffic. It is clear therefore that the cost of movLng an additionalton, or car, or train will be substantially lower tharn the average fullcost of moving similar units of existing traffic. The first obZectiveof costing -would be to determine prospective variable costs, either inthe short run or in the long run. The definition of these ter-s, andtheir significance, particularly in the field of rate-making, will bediscussed later.
1.20) The financial advisability of abandoning or curtai_ng
railway lines, stations, or services is a subject of increasinglYfrecuent discussion at present. In this context the costing offLiceris concerned with avoidable, i.e., decremental, costs that, accorcingtc the circumstances surrounding the problem, may be less than 'cng-rin variable cost and in extreme cases may be no greater than short-runvariable cost. The discontinuation of one passenger train out ofseveral on a particular line is, for example, unlikely to result in aproportionate reduction in station staff, permanent way labor, signalmen,or terminal shunting costs on the line over which the train has previouslyoperated. The savings in fact will probably be no more than the directrunning ccsts of the train, plus repair material for the locomotive androlling stock. The number of maintenance staff employed in workshops and -
rwnning sheds is not likely to be affected by the withdrawal of one trainfrom service. If, however, all passer;ger trains are withdrawn from aparticular section or a large number of trains are withdrawn on aselective basis throughout the system some saving in station and repairstaff costs and track maintenance and depreciation will accrue. If theultimate decision is made to discontinue all services on a particularline, it should be possible, in the absence of external constraints, toavoid all costs, fixed and variable, of operating that line. It ismost likely, however, that constraints will exists to delay realizationof total savings. For example, it may not be in the interest of ther'ailway or the nation to lay cff skilled railway workers, whose servicesmust therefore be retained for a time until they can be absorbed inalterniative work created by normal staff attrition or increased operating;ictivity. Total savings will ultimately be achieved, and the time-ph;ising of their realization should be assessed.
1.21 For the other purposes of costing summarized in para. 1.02,long-run variable costs wil1 generally be appropriate, and the definitionand method of assessment of such costs will next be considered.

E. SHORT-RUNF AND LONG-1RUN VARZIABLE COSrTS
1.2 2 Short-run variaable costs may be defined as costs associatedw;.'th changes in traffic volume that, do not necessitate any change inthe size or cost of the existirg plant wd equipment. Long-run variablecDsts are those associ.ated w-ith changes _n traffic volume that Lavolvechanges In the cost and size ol' the plan- and equipmient. The expectedrate o' sustained increase in tvhe level of traffic will normally have animportant influence in deciding when capacity of trhe plan must beex?panded, and the required investment must be recog.._zed in computing_onC-run costs.
1.23 Although for pricing purposes short-run variable cost issignificant in special cases, such as ob-aining back-loading for emptycars or carloads for trains traditionally running underloaded (e.g.,mixed passenger/freight trains rurning to public schedules), it shouldbe resorted to generally only where flexibility in pricing exists.
l.2h AS a general rule the length of time over which long-ruacosts should be projected and used as a guide for minnimUm pricinc, shouldbe related to the expected duration of the proposed tariff cnanges.in cases where inflationary cost increases are frequent, adjustments ofcosts and prices would need to be made often, as necessary.
1.25 The purpose of determining long-run variable cost is toestablish a minimum level below which (except in special cases whereshort-run cost may be relevant) no rate, fare, or other charge shouldbe set or allowed to fall. It is a cost reference of uniaue importanceas a guide in determining the specific rates that will provide themaximum contribution to fiXed costs and overhead. The margin abovelcng-rur. variable cost that maximizes this contribution will depend onthe price elasticity of demand, and this in large measure will bedetermired by the alternatives available to shippers. Where competitionfrom other transport modes is severe, the greatest total contribution tofixed costs will for many conmodities and hauls result from a low unitmargin above long-run variable cost and a large volume. Estimating thevolume of traffic that might move at different levels of rates and theresultant effect on net revenue is a key aspect of pricing, a subjectthat is considered in Chapter IV.
F. ESTA¶ISHING A COSTING ORGANIZATION
1.26 In countries where the Bank operates, most railways maintainmanufacturing and repair job costing in their mechanical and civilengineering workshops, but few have established traffic costing systems.prior to the advent of long-haul road competition railway rates were.Jflmost univerally based on the principle of charging "what the trafficwill bear," and as long as revenues were sufficient to cover operatingexpenses and financial charges the determination of traffic costs was
8

generally regarded as an Lunnecessary refirnement. As competition hasintensified, rates have been reduced extemporarily, first on one high-rated commodity, then on another, in anticipation of competitiveencroachment or, more frequently, to try to regain traffic already lost.Rates in the lower scales hAtve usually remained unchanged, and on somerailways, it is likely that a significant number a-e below long-runvariable cost or are making a negligi'ble contribution to fixed costs,although they may include comrmodities representing a large proportionof total railway freight traffic.
1.27 Management has in many cases been reluctant to instituteany new activity, including the establishment of a traffic costingsystem, that would tend to increase expenditure at a time of financialstringency. Traditionally, of course, costs have not been foundessential, and in some cases a belief still persists that what was donesuccessfully in the past can be made to work equally successfully infutare. Those very members of the staff who shouild best be able toinformL management of the value of costs are possibly inhibited fromdoing so by unjustified fears of the intricacy of the oroblem and anapparent shortage of staff with sufficient expertise to handle it.Such trepidation is largely unjustified; on practically every railwaythere are staff capable of establishing a costing system, with, insole cases, advice and guidance of experts from other railways thath ve developed sophisticated costing systems.
1.28 Certainly the costing of every phase of railway opera-ionon every section, at every station and for every cornodity movementtwi.11 require a costing system of great detail and intricacy. Suchdetail is, however, relevant only to the setting of special rates forspecific movements for specific customers. For many railways the mosturgent need is for a systemn of less sophistication that will makepossible the assessment of costs in relation to existing tariffs andrates. This will show which rates may fail to cover long-run variablecost or to make an adequate contribution to fixed cost. When such asystem has been established and the staff employed on it have appreciatedall the problems involved, they should be able to introduce the refine-ments needed to subdivide the all-line costs by section, station, andtrain.
1.29 To establish the basic system, averages have to be used, butbhese will be averages that are specific for each type of operation.Ynrd marshaling costs per car handled, for example, will need to becalculated in the first instance on an all-line basis, as it is doubtfulif any railway maintains separate costs, or an accurate record o-f carinovemenUs in each individual yard. The unit cost of marshaling in eachyard may be expected to vary from the average, but in ordinary circu.ra-::I;nces bhe variation should be insignificant in relation to the generalcost structure. If in any yard it should be found that the' variation isver.y great (and this will be ascertainabLe only from special studies
9

di.ring the later process of ref-.i-nement cof the costing system) then itl.y we'll be a matter for cost control to investigate3 rather than aa>;Jf -icat-on for charging some customers more than others for the
sa.e service.
1.30 7r the follow-ng chapte2s, guide_lnes are suggested for thees: abl 4.shme-t of a basic traffic costing system on these lines, Thismet,hodolo-r has been app'ied on a number of raIlways and has produeeduseful comparisons of long-run variab'le costs with existing rates andrevenues. I-t should, however, be mentioned that a mere routine comput.a-tcn o f costs using the details of the r.method indicated withoat. takingacctmr,t of the special featunes and circumstances of the particularrailway is not recommended. For the implementation of the suggestedmelLhodclogy, except on railways operating very large and complex systerms,additionai staff requirements would be modest, say, one to three persons.
is necessary that every railway should have a good cost accountiingoranizario,n staffed w.Tith capable people and placed organizationally sotha., they can work mosv effectively.

Chapter II
DETEI0INA2ION Or' COS':c
A. METHOD OF APPROACH
2.021 Before beginning a traffic costing exercise it is advisablec,o decide wihether the railway system for which costs are to bedetermined can be treated as a single entity for purposes of extractingbasic cost data on the basis of the characteristics of operation andequipment used being reasonably homogeneous throughout. On the majorityof railways in the developing countries, where the track is laid to onegauge only, it will be found that costs may generally be extracted iathe first instrance on an all-line basis. Wnere, however, parts of thesystemn were construciced or are used for specialized purposes, or areoperated by specialized equipment, or are built to different gauges itnay be necessary to extract certain costs separately for differentDarts of the system. To illustrate this point, an actual case may becited. On this particular railway, part of the system is used almostexclusively for high-density mineral traffic, moving in heavy trainloads;track is standard gauge, and the major part of the traffic is hauled byelectric traction. Most of the remainder of the system is standardgauge and diesel operated, almost equally divided between passengerand freight. There are also a number of 3-ft 6-in and meter-gaugebranch lines with relatively light traffic. As far as available datapermit, it is clearly advantageous in such a case to extract costs forthree clearly demarcated operations separately. In the majority ofcases less detail will be needed. In the following example, asillustrated in Appendix C, a railway of reasonably homogeneous charac-teristics is assumed. For comparison a pro forma cost analysis for thespecial case mentioned above is shown in Appendix 0.
2.02 Progressive stages in the determination of traffic costn areproposed as follows:
(i) Tne expenses of the most recent accounting period areto be separated between fixed, capacity, indirectlyvariable, and directly variable costs. (Directlyvariable costs are those which may be expected to varyin direct proportion to changes in traffic volume.Indirectly variable costs are those which will vary insome degree but less than proportionately to changesin traffic volume). For determining the variability
11

c: cer.ain expenses ana arrivinpg at a formula-6hat will best explain variability and providemore reliable projections, statistical correlatior.(e.g., regression rialysis) techniques m,ay be used..n t>he followiing section, h-owever, a simle basiswhich can be easily adopTed boy most raihiays andgives genera2lly sat2sfacvor:y results is indicated.(This can oe r-1ined later, using the analytical;.echniques r^eferred to, es-peciaMly where computersare available). The faczors used and the extentof variability indicated here are based onexperience; further study/investigatior. and adaptationwith reference to the particular circumstances of arailway are desirable.
(ii) Capacity and variable costs are to be separatedbetw;een freight and passenger services.
(iii) Freight costs, capacity and variable, are to beseparated between line-haul and terminal costs.Line-haul costs shouldbe subdivided into track,train, locomotive, and car costs, anca terminal costsinto documentation, handling, collection and delivery,transshipment, marshaling, terminal and intermediateshunting, and any other costs (e.g., port charges)that do not vary with lengtlh of haul.
(iv) Historic costs are to be translated into future costs,having- regard to the factors enumerated in paras. 1.08,1.11 and 1.15.
(v) Future costs are to be translated into unit costs mostappropriate to the measurement of the relevant activity(e.g., car, ton or train-km, car-day, net or gross ton-
(vi) Costs of specific services or transporting individualcommodities are to be calculated and compared withrevenue earned at existing rates.
12

B. THE COSTING SYSTEMIA-DKEAILED ANALYSIS OF Et-PElNSLS
Superintendence (All Departments)
2.03 TLhese expenses are indirectly variable. Experience hasshown that there is a tendency for superintendence costs to rise asthe volume o, work increases, but the rate of increase should be muchless than directly proportionate to changes in the volume of traffic.Muchl will depend on the range of officer grades encompassed withinthe meaning of "Superintendence," which varies widely as between onerailway and another. Where the accounting rules follow the UniformSystem of Accounts prescribed by the Interstate Commerce Cornrission(ICC) of the US, superintendence includes all officers from the gradeof departmental chief to general foreman and inspector, together withtheir clerks and other office employees. Other railways considersuperintendence to comprise only the departmental head, his tmmediateassistants in charge of the overall activities of the department, andofficers in headquarters, such as architects, draftsmen, and researchand personnel officers, together with the clerks and other employeesdirectly supervised by such officers. In the latter case, foremen,inspectors, shop clerks, timekeepers, etc. are excluded from "super-intendence," ana their salaries are charged to the respective directheads of expense, e.g., locomotive, freight-car or passenger-carworkshop repairs, engine-house (running shed) maintenance of locomo-tives, track maintenance, etc.
2.04 Under this more restrictive concept of superintendence itis reasonable to assume that, within the limits of possible trafficincrease over a comparatively short period of time, cost will notsignificantly increase. Where, however, superintendence as definedincludes grades such as foremen, master mechanics, and inspectors itwill be necessary to analyze costs to determine the relative propor-tions of fixed and variable cost comprised in the total expense underthis head. This will probably require reference to staff schedulesor payrolls and the segregation of fixed and variable expense accordingto the grade and nature of duties of the men employed. It may beassumed that salaries and other costs of inspectors, foremen, and mastermechanics will have the same cost variability as the main labor forceemployed on the specific activity involved.
2.05 The variability of superintendence expenses will be greaterin some departments than in others. Where, for example, accounts andpersonnel records are maintained manually the number of staff and re-sultant costs of these departments are likely to react in greater degreeto increased output than those of, say, the Civil Engineering Department.
13

-Rst trends should be studied and regression analyses made to determnine-unzi- of oucut (e.g., train--m,, consignrents, tons or ton-!<na) or
-n-ut. xe.g., num.ber of employees) or combination thereof that bestexrLains t'ne cost variations. If a co-rrelation car be establishedbe weer. cost variabilivy and that of some uniu or combination of unitscl' input or output, the problem of dividirg variable saxper-ntendencecosv between freight and passenger services will be simplified.
2 C06 Experience indicates that superintendence costs as a wholeare unlikely to vary more than 10 percent with varying traific volume,exr,essed in traffic units (ton-kon plus passenger-km) or train-kIn,.id that the variable best explaining superintendence expense is train-
km .
Yainte-ance of Way and Structures--General Comment
.~7 TIe allocatio- of civi]. engineering maintenance costs gives-r,e to some of the more difficult problems in railway traffic costing,i`rst in deciding the degree of cost variability in relation to changing-raffic levels and second in assigning the respective proportions of
cc;st tLo freight and passenger service.
c.08 Present consideration :s directed to a definition of fixed-ind va-iable cost, and in the following paragraphs it will be assumed
hoat the railway under stidy has a sufficient reserve of track capacity,termns of train paths, to meet increasing traffic demands within the
*oreseeable future. If this should not be so then substantial additionalconstruction may be needed to increase capacity, by track doubling,-inproved communications, signals, and yard extensicns. In the lattercase the addi-tional cost of operating and maintaining the new works,together with depreciation and interest charges on the new investnent,will need to be taken into account in assessing future traffic costs.
(a) Pennanent Way Maintenance--Labor
2.09 The cost of permanent way labor varies with traffic volumebut in considerably less than direct proportion. In the Western Hemis-phere most railways follow the method used in the US of dividingpermanent way labor costs between (a) maintenance of the roadbed andearthworks and (b) track repairs and surfacing. The former might beconsidered as fixed cost and the latter as variable, although again itis almnost certain that variability will not be in direct proportion to:riffic volume. In rnany other parts of the world all permanent wayl -'-or cost.s are included undera single head of expense. It is necessary-o establish for each such railway the cost on one hand of earthworks
114

m.-A.nta,ance, grass anrn weeud control, b,'-sh clearance1 ana other worksderende.nt on C-irrlmate and the nassage cfv time, and on the ote- heanQt,he cost cf track maintenance, which will vary in some degree with.,r-ffic density and speed of trains. In most cases t1he only availablemeens of doing this will be to seek the considered opinion of experi-enced track maintenance officers as to the relative -rorortions o- theworking day that track gangs spend oGr the track on the one hand andthe roadbed and right of way on t'ne ot-h;er. On a railway irn junglecount-,>y, for e,cample, it was stated that the nornal pr^actice -was hatthe mornings would be spent- on trac'.k, maintenance and the aftern.oornson repairing formation, clearing site-drains , weeding and brushclearance, etc; in other words the ratio of indirectly variable costto fixed costw-ould be approximately 2L/20 (allowing for 8 hours worke.-ch day Monday to Friday and 4 on Saturday).
2.10 It is next necessary to determine to what degree the cost4 track maintenance is likely to vary in response tc traffi c charnges.
. tudv o- this question would be desirable, to take account cf thnez!:rticular circumstances of the railway. On a large railway the degreeS ccst. va-iability can be estimated by comparing track labor costs on
. series O' sections of the line of comparable condi-tion, age, andrhVsical characteristics, but with varying traffic density, from the].ightest to the heaviest. On a small railway this may not be possibleor at best proride results of doubtful validity. In Mexico, where therail network is extensive, a study showed that perm.anent way labor costson lines of the lightest traffic density were not less than 5G0 percentot sirmilar costs on the most intensively used lines, the figures-ndicating an approximately h0 percent variability relative tc tuhea.verage traffic vo'ume at that time. In a study of costs on the KoreanNational Railways it was found that track maintenance costs varied inratio of 3:2:1 among the most intensively used sections of the line,those of average density, and those of lightest traffic density. Thecomparable ratio of daily train density was 10:4:1, indicating that athli.-hly interisive levels of utilization t}here is an approximately 334percent variability of track costs relative to traffic density. InCanada, where extensive studies have been made, the variability of trackmaiatenance costs relative to increases in traffic dmsity was found to bebe about 34 percent.
2.11 It would appear safe to assume in projections of probableftLure costs that the labor cost of track maintenance will increase atno!, more than 1O percent of the rate of traffic growth. in this case'ralfic growth is measured in terms of either train-km (on ra-waysw-here the relative speeds and axle-loading of freight and passengertrains are not materially different) or gross ton-km.> includirU h.cco-motive gross ton-km. Weighting for speed may or may not be done, asanrrears desirable under the prevailing circumstances of operaVicn.ALi assessment has to be made taking accGunt of the circumstances onthe railwaay, the rate of growtth of traffic, etc.

2.12 On t-Uh majority of rai:.ways a problem will arise in dividingvariable track maintenance costs between mainline rtunning tracks,i.ncludirg crossing loo-ps, and yard tracks i- depots and terminals. The1CC ruIes o the 3US recuire ',.at a ernses ci%arged to m;antLriance of wayp.rmiary accounts s'iou-iLd seuaraue. betseer "ya_^d sirt;chr.g tracks,"'way Swi, tchLng tracks," aid ';rz-ini racks" and zhat all source doctne-atsshould be nia-rkCed so as 'tC povide t^n-s separa-ion. Thsiis urifocunatelya lrue that is far from universally applicablAe. In most cases recoursewill be needed to the expert cpinion of t'he Chie-' Civil h- Lngineer and hisofficers to evolve a formula for ecuating kilomeuers of plairn track plusnumber of turnouts in yards to kilometers of' mainline track plus turnoutsin crossLng stations. In a nuiber of' known cases the peraanent wayinstructions of the railway prescribe tne standard workload of a trackgang in terms of mainline track or yard track plus turnouts. Assumingthat the instructions are observed, Qhe relative numbers of men employedon, and hence the cost of, mainline and yard track maintenance should bereadily ascertainable. The assets registers -will provide the details oftra;-,.k-ar and numbers of turnouts.
2.13 Variable track maintenarnce costs having thus been separatedbetween mainline and yards, the mairnline cost will naxt ba separatedbetween freight and passenger services on the basis of either train-Ianor gross ton-kn, according to whichever unit it has been decided toadopt for the purpose (para. 2.11).
(b) Permanent tAay Maintenance--Rails
2.14 On railways where the decrease in value of track throughwear and tear is accounted for by mvaking provision for depreciation(see para. 2.21) or by contributions to a Renewals Fund, tne only railswhose cost will be charged directly against revenue under the subheadfor Rails will be those required for spot replacements on curves and inother localities where the wearing-out rate is substantially higher thanthe normal rate assumed for depreciation purposes. The cost of suchspot replacenents should be considered as variable costs of mainlineoperation and should be separated between freight and passenger serviceson whatever basis may be adopted under para. 2.11.
2.15 On railways where no provision is made for depreciation, allrail renewals wil' be charged directly against revenue under this subhead.ln this case the expenditure under this subhead should be disregarded forcosting purposes, and in its place use-depreciation should be substituted,as calculated in accordance with para. 2.23(i).
16

(c) Permanent Way Maintenance--Sleepers
2.16 The same principles apply as for rails. If spot replacementsonly are charged to this subbead the cost should be vraated as mainlinevariable cost and separated between services in the same mannar as forrails. If all sleeper renewals are charged to thlis sub1head the costshould be disregarded and replaced by use-depreciation as in para. 2.23(ii).
(d) Permanent Way Maintenance--Ballasb
2.17 This expense is more fully considered in para. 2.23(iii), inwhich it is proposed that ballast renewals should be treated as a fixedcost.
(e) Permanent Way Maintenance--Other Track Material
2.18 This will include mainly rail and sleeper fastenings, suchas clipE,, spikes, bolts, fishplates, and rail anchors. Exactly the sameprinciples should be applied as for rails and sleepers.
(f) Permanent Way Maintenance--Smal.l Tools and Supplies
2.19 It is logical to assume that the variability of cost underthis subhead, and the separation of such variable cost between mainlineand yards, and between passenger and freight service, will follow thesame pattern as the wages and other costs of the labor who use the toolsand supplies. In other words the proportionate allocation of labor costsdetenmined under paras. 2.09 to 2.13 should be repeated here.
(g) Permanent Way Maintenance--Track Machines
2.20 This subhead records the cost of repairing machines used formaintenance of the permanent way. The proportion of cost likely to varyin relation to traffic changes can logically be assuned to be the sameas for track labor, as calculated in para. 2.11. Track machinery is un-likely to be employed in yards, and expenditure under this subhead maybe treated as a mainline cost and separated between passenger and freightservices as in para. 2.11.
17

(h) Dezreciation of Track
2 .21 iVost railway a&airinstrations make provision for the physicalwear and tear of track, resulting, from use ad e:coosure to the elj-mrts,by charging against incomrie an arziual prov_szon. or daorecfatior.. Z.isis based so-metimr.es on historic ccst but mnore a6ua;ly orL CrLre-ant rolace-ment values, divided by the engnleers' assess.aent of Ife _i-e of t'hatrack in yars, at existing tra`i c levels and unrder ̂ :ea ng oJeratirLgconditions. Other administratiorns p-refer to uneaae a :*egriUar nmualprograni of track renewals and to charge the cost against Lnco.i3 as andwhen the renewals are made. For depr^eciation. tLare are uz; a l l esfor revision of the anniual provision at prescribeda intearva s o ;ahecare of changing traffic volum.es and also inflation if dep^eciation iscalculated on replacement cost.
2.22 Whatever method is used the objecTive is usually to equalizeinscfar as -oss`ble the annual charge to income account (over the esti-mated lives of the assets, in depreciation). Because of this iti issometimes wrongly assumed that depreciation is a fixed cost. The accuratedetermination of variable cost requires that the value of all the resourcesconsumed in carrying traffic at any given future level should be quanti-fied. It is clear that an additional train, ev n an additional carload,will cause some additional rail wear and may have some effect, althoughto a lesser extent, on sleepers and ballast. This element of tha costof moving additional traffic must therefore be evaluated.
2.23 The princi-pal causes of track depreciation are (a) phnysicalwear and tear resulting from use and (b) deterioration from exposure tothe elements, essentially a function of timne rather than use. For railsand turnouts, cause (a) is generally all-important; for sleepers andballast cause (b) has by far the greater effect, altho-agh (a) cannotalways be entirely disregarded. The following method is proposed forcalculating use-depreciation of track as an element of variable cost andfor separating it between freight and passenger services.
(i) Rails and Fittings. It is proposed that, for costing purposes,depreciation of rails and fittings should be based on their esti-matedcapacity in terms of millions of gross tons, and not on their assessedlife in years. The records and statistics of most railways will provideinform,ation on which to assess the total gross tons carried over eachsection of mainline ruiLning track between tha dates of original layingand first relaying, or between t-wo successive relayings. Tna capacityo: the rail, in terms of gross torOs, will varLy according to weight ofrail and the differ-ing characteristics of the various sections of' tha

system. Much will also depend on the condition of the replaced railsat the time they were lifted: for example, they nay have been wornboth sides to the limit of their usefulness for any purpose exceptsale as scrap metal, or they may have been replaced uhen they had furttheruseful life in order to provide matarial for relaying a lin2e of lesserimportanca. The objective of tha inctuiz7 is to make a reasorabluestimate of the total capacity of rails of varying weight from firstlaying to eventual scrapping, by section of the line where there arewide variations of grade and curvature, or on an all-line basis wheretrack charactersitics are generally compa^able throughout the system.The following example is of a railway of xeasonably homogeneous charac-teristics throughout:
Rail and fittings, 80 lb/yd--US$20,000 per km, at current replace-ment costs, including labor.
Estimated service capacity--l'I0 million gross tons.
Depreciation--US¢0.0133 per gross ton-km (including l3comotives).
Service, Year 1970 Millions of gross ton-km Depreciation, US dollars
Passenger 1,500 200,000Freight 4,000 533,000
Total 5,500 733,000
It is therefore suggested that depreciation of rails and fastenings betreated as an element of variable cost in both the short and the longrun, and that it be separated between freight and passenger services onthe basis of gross ton-km, as in the above example.
(ii) Sleepers. Steel and concrete sleepers have a long life, andthere is little evidence that, under the axle-loadings and generalcharacteristics of train operation in developing countries, the lifespan of such sleepers is significantly affected by traffic volume.Depreciation of steel and concrete sleepers may therefore be consideredas fixed cost. (Circumstances of the particular railway and a carefulstudy of this matter may, however, indicate a somewhat differentpicture in regard to fixed and valuable costs on that railway). Wgoodansleepers, on the other hand, which, particularly in the tropics, have acomparatively short life, are affected more by climate than trafficvolume. Engineering opinion, which has been sought in a number of
19

countries, usually supports the view that var.iations of about 10 percentabove or below the all-s'rsterat averz.ge life o, wooden sleepers will occuaron sections of the lowest and higchest t-rain den_sity res;pectively. Ineach case, thneref'ore, the o-oinion of -uha en_xnee:rs rogarding the lifeva;--iab litv- of wooden sleeaer_ ralativae to vaiia-iono in traffic vo'hneshould be sought in order t,o arrive au a ratio of' cost va-iability ofdepre ciation. Depi-actai- `Lon should De calculaued at current replacementvalues, including -he labor cost of plac-ing seexers ir. the track.Sleeper depreciation that varies in relation to traffic volume shoualdnext' be separated between passengear and freightn service ir. proportuonto the gross ton-kai (including loco•aotives) of each respect,ive service.
(iii) Ballast. Renewal of ballast is normally undertaken on anannual program of sufficient magnitude to maa ntain the track in goodcondition at all times. There is no evidence to show that on any rail-way the life span of ballast on light traffic lines is different fromthat on tracks of higher traffic denc-ity or on the railway as a whole.The volume of ballast per meter of tr-ack will of course be greater onhigh-density lines than on those of Lower density. If traffic shouldLncrease substantially on a low-density lirne the amount of ballast mightneed to be increased to the maximur width and deptQh prescribed for high-density lines. The cost of the added investment (cost of capital andrenew.al) would of course be included in prosDective variable costs. Sofar as ballast is concerned, the recurrent cost of renwal may be takenas a fixed cost, but ari engineering opinion should be sought as towhether, in the even of the traffic forecast being realized, any addi-tional ballasting would be needed to raise the track to a higher standardcoimmensurate with the higher traffic density. Any added cost to beincurred in this context would, of course, be apportioned to freight orpassenger service in proportion to the relative projected growth of eachservice, in terms of gross ton-km over the lines requiring improvement.
(iv) Points and Crossings. These have a relatively short life,anid their depreciation can be considered as directly variable with thevouLŽne of traffic passing over them. Renewals of turnouts are normallycharged to income account as and when they are made, usually on thebasis of a regular annual program. Engineer's records should -provideinformation from which separation can be made batween turnout renewalsin the mainline, running sheds, passenger and freight stations, andmarshaling and shunting yards. It is suggested that as a general rulethe cos-t of renewing turnouts in the mainline, running sheds, passengerand freight stations, and marshaling and shunt-ng yards should be
20

separated between freight and passenger service on the basis of t-ain-km run in each service. Those in passenger and freignt s .ations shouldbe allocated directly to the respective services, and thoe in marshal-ing and shunting yards should be allocated as detailad under YardOperation (para. 2.67).
2.24 It will be notea that track dep:eciation, as al elamsnt of'variable cost, has been mentioned in relation. to,-yard operation onlyunder the heading of points and crossings. At the slow speoed of trafficmovements in yards it is not considered possible to measure variationsin the rate of depreciation of rails, fastenings, sleepers, or ballastin response to changes in traffic volume except in the ve.y long run.At this point, of course, all costs would tend to become variable. Forpurposes of a "long-run" period related to the duration of proposedtariff changes it is suggested that yard track depreciation, other than-for points and crossings, should be conside;^ed as fixed cost excentwhere additional investment is needed to enlarge the capacity of exist-ing facilities. in this case depreciation and intera3t on the addedinvestment would necessarily become part of future variable cost.
Maintenance of Works
2.25 The majority of the maintenance works included in thiscatecory (items 1.20 to 1.39 of Appendix A) are common costs of passengerand freight traffic, and none of them is likely to vary directly inrelation to traffic volume. In fact it would be safe to say thatnormally they are either fixed or capacity costs. In the case of capacitycosts it would be necessary to determine whether current capacity providesa sufficient reserve to handle the projected growth of traffic within theperiod of the projection. For example, if the signals and telecommunica-tions facilities are considered adequate to cope with the increasadtrain and car movement, the overall level of expense for maintenancewould remain fixed within the relevant period while the cost per unit ofoutput would fall. If an exceptional growth of traffic were to be fore-seen, or the period of the projection were to be substantially extendedin, e.g., investment evaluation, some increase and improvement offacilities might be needed. Hence maitenance of signals and communicationsmight become a variable cost, although variability would in any case beconsiderably less than in direct proportion to the increase in traffic.
2.26 A number of maintenance of works costs, e.g., maintenanca ofpassenger stations and passenger-car workshops, are directly assignableto one or another of the services. Although they may well be taken asfixed costs for purposes of assessing the financial effect of normallyforeseeable changes in traffic volume, they have vital significance in
21

the context o0 det rmining the overa7' profitability of the particul.rservice. in the event of to alj. abandonc)iant of the servica, for example,such direczly assignable costs would be avoidable, w.hereas common costswould be unlikely to be avoidable except in some less-than-porportionatedegree.
2.27 In general, then, it may be asumzed that maintenance of workson the majority of railways ntay be consLdered to De a category of costsunlikely to respond except to an insigfnificant exten-- to normal changesin traffic volame. In the t-im.e period i-alevant to tr7affic costing forprice-fixing, normal changes in trafic volime may be assum.ed to be therule rather than the exception.
General--Social Security and Pensions
2.28 In countries where social le-isi½tion prescribes certainbenef its by way of bonusas, retirement, redical and health benefits, andthe like, it is usual to record the total cost of each benefit bycreating a separate series of primary expense accounts for each depart-ment of the railway (see items 1.40 to l1.43 of Appendix A). Pensions,whether charged to revenue as and when paid or provided for by contribu-tions to a pensions fled, are normally segregated in a separate primaryaccount at the end of the classification of expenses (see item 7.01 ofAppendix A).
2.29 For both social security benefits and pensions the costingoffice will be faced with the problems of separating the costs betweenfixed, capacity, and variable cost on some logical basis relaGed to thenumbers, pay, and eligibility of the staff included ander each categoryof cost. W'here pensions are provided for by contributions to a pensionfund, such contributions are usually calculated as a percentage ofqualifying emoluments, determined after actuarial investigation. Theassignment of the contributions in proportion to the relevant subdivisionof costs is thereby simplified. Where pensions are charged to revenue asand when paid, the calculation of the accruing liability to serving staffis made more difficult, but some relation between salaries of pensionablestaff and current pensions payments can usually be established. Othersocial security benefits may be of diverse character but normally can berelated to the grades, salary scales, or emoluments of the staff concerned.They are therefore susceptible of proportional separation between fixed,capacity, and variable cost, once the wages bill has been analyzed.-
2.30 Hospital, medical, and health benefits are of a peculiarlypersonal nature and are usually extended to the families of railwayemployees as well as to the employees themselves. Costs may vary widely
22

between one section of railway work and another, but for purposes ofprjecting operating costs it would seem that there is no alternativebut to calculate an average per capLta cost and tc apportion totalprojected costs between fixe6, capacity, and vEriabla cost Lr. proportionto the number of staff whose pay anu allowances have been assigned vothese cost categories. it must always be clearly borne in rn nd vhatthe purpose of the exercise is to dete;-rane as nearLy as possible theeffect on expense of any projected chan£ge in traffi3 volume and thatevery aspect of costs, indirect as well as direct) r.ust be considered.If additional men are required to handle additional traffic theirfringe benefits, including pension entitlement where this is applicable,will increase just as surely as the wages bill.
equipment Maintenancel/
(a) Superintendence (See paras. 2.03 to 2.06)
(b) Workshops Maintenance of Locomotives
2.31 In conformity with the ICC Uniform System of Accounts, whichhas been adopted on many railways outside the US, primary expense accountsare provided for each type of traction (steam, diesel, electric, andrailcars) and separately for mainline and yard locomotives of each type(Appendix A, items 2.02 to 2.08). Yard locomotive maintenance in thiscontext would normally refer to workshop repair of locomotives designedspecifically for yard shunting duty. It is, however, common practiceon many railways to employ maintenance locomotives on yard shuntingduties whenever the exigencies of the service so require. For costingpurposes it will be necessary to determine the total cost of locomotivemaintenance whether of regular shunting locomotives or of mainline loco-motives involved in yard shunting operations. It is also necessary todetermine the maintenance cost of locomotives employed on wayside stationshunting, normally classified in statistics as "train-locomotive shun-ting." To make a closer estimation of costs in this and other contextsit is essential that adequate and comprehensive operating statisticsshould be maintained. In Appendix B a detailed list of statistics isproposed, with definitions.
/ This Classification of Expense assumes an organization under whichthe Mechanical Engineering Department is responsible for workshopsmaintenance of locomotives and workshops and line maintenance ofpassenger and freight cars. Paunning shed mainTenance of locomotivesis the responsibility of the operating, i.e., Transportation Dapartment.
23

2.32 Frori the statistics so p^oduced, it should be possible tomake an acceptably accurate separatlion of mainline locomotive workshopsrepair costs between line-haul, yard shurb3ing, and train-locomotiveshunting on the basis of' mainline locoir.otfve-km rn on each re3pactiveduty. The unit of locomotive-kma is u5sea -rn tas conte-;t because _t zsnormal wo-rkshop practice to prescri'b in T.h- iLnterval between any twoscheduled repairs in terns of kilome.eris lun by the locomotive dur-ngthe relevan-' period.
2.33 Many railways do not follow tne ICC Uniform System. cf Account'sand do not differentiate in the accountirtg classification between main-tenance of mainline and yard locomotives, altUhough costs in all kno-wncases are maintained separately for all locO;daotives of differing typesof trac-ion. In such cases reference will oe necessary to the individualjob costs maintained (with rare exc&ption) in the workshops cost office.Where particular classes of locomotive are designed for or are solelyemployed on yard shunting duties their maintenance costs can be s3gre-gatedL he maintenanc3 cos;s of all oIhe- locc.-Lotiv-es should bs separatedbetween line-haul, yard shunting, and wayside station shunting on thesame basis as in paras. 2.31-and 2.32. On railways where locomotives arewidely interchanged between services and where statistics or costs arenot otherwise available, "locomotive-hours" or "fuel consmied" have beenfound to provide a reasonably accurate basis for distribution of work-shops maintenance cost.
2.34 In the normal course of everts it can be assumed that work-shops maintenance of locomotives expense is a long-run variable cost.(The formula for the variability of maintenance with the factor ofengine-kmn may be "refined" by analysis, as some part of workshop repairexpenses Tay be time related). Certainly materials used for workshopmaintenance will represent variable cost, both in the short and in thelong ran. It is usual also to find that labor costs will vary in thalong run and that training schemes are geared to provide the additionalskilled staff needed to provide an increase in workshops output comnen-surate with the projected growth of traffic. In certuain circumstances,however, and particularly during periods of conversion to more efficientforms of motive power, a surplus of labor that can be absorbed only bythe combined effects of attrition and increasing workload may well existin the workshops. In such a case it will be necessary to compare thepresent workload with the assessed capacity of the shops (the capacityutilization factor). Then, with due regard to projected traffic growthand the probable rate of labor attrition, reduced by the output fromexistin-g training courses, it will be necessary to forecast the pointat which the capacity utilization factor will reach 1.0. From thesedata tne variability of workshops maintenance cost within the period ofthe projection may be calculated. T"he methodology is discussed later(para. 2.102).
24

2.35 At the present stage the pu:pose of the exercise is toseparate the variable costs of locomotive maintenance between line-haul,yard shunting, and wayside station shunti:ng on an all-line basis.Clearly there will be ditferences in the relative costs of maintainingsteam, diesel, and electric lccomotives, ar.c withLn eacr. type oa' motivepower there will be substantial differences lbeteen locorPotve,s ofvarying design, e.g., between a conventional steam locomctive and oneof Beyer-Garratt or Mallet design. Althougfh com-paring costs of loco.-o-tives of varying types is essential in other contexts (e.g., evaluat_ronof future investments), for price-fixing the only relevant cost is thefuture cost of operating under the best technological standards likelyto be achieved on all operations on the particular railway underconsideration (see para. 4.03) in the relevant time frame.
(c) Workshops Maintenance of Freight Cars
2.36 In normal circunstances it raay be assuied that tha wholeof the expenses under this head will vary in direct proportion to thenumber of freight cars in use, and this will depend on projected improve-ments in technological and operating stancards. For example, where alarge program is under way for replacement and expansion of the existingfleet by cars of greater capacity, the increase in workshops maintenancewill consequently be less than proportionate to the increase in traffichandled, because of the expected improvement in the average carload.Detailed analysis of all the elements of workshops maintenance expensesmay furthermore indicate that the variability of some elements is lessthan directly proportionate to car utilization, although the magrnitudeof such indirectly variable elements is not likely to be of greatsignificance in relation to overall total expenses. On the other hand,if the ratio of cars under or awaiting repair is excessive (say over 5percent) then is present repair output inadequate beause of insufficientlabor and material inputs or alternatively because of excessive age andpoor condition of existing cars or inefficient use of existing capacity?The effect of expected technological improvements should also be con-sidered, such as the replacement of friction by roller bearings or theuse of dynamic braking on diesel locomotives, which can dramaticallyreduce expenditure on brake blocks especially on mountain sections.However, where doubt exists it would be well to assune direct variabilityof workshops car maintenance cost to car-days in use. It is preferalJ-1to overstate long-run variable cost slightly rather than to underst-ate it.Similarly it may be argued that workshops maintenance of freight care ismore a function of the number of times a car is loaded than the kilometersit runs or the days it is in use and that most damage is caus&d by roughshunting. If, therefore, because of expected improvements in oparating

practice it is projected that the n-mber or car loaoings will increasefaster than car-days, the varia-bi-.tv of ;Lorkshuos maintsnance costsmay be related to changes in the ruamber of cars loaded.
2.37 T"_e nex-L ste- is to 3e0&ra -.kl va;aole C03v of freight-car repairs between passenger and 'reig>ht service. This is necessaryDecause freight cars are used foi- -zhe cazrage of not only publicfreight> but also railway fuel and mwaterials that- are essential 'or
passenger as well as freight transport. A smaall nu_rmtber of railwaysmaintain statistics of carloadings of railway fuel and materials andrelated car-am. Wihere this is done t'he apportionment of expensebetween public freight and railway service freight can be made on thebasis of the relative car-Icn or carloading, as appropr1ate. Ihererecords of carloadings and car-la of service and public freightare noc separately recorded (and this applies on the large majorityof railways) the only available basis of apportionrnent of car repairexoe-l_e between public anr service freight is the net ton-lan of eachciass ol freight. Such statistics are aLmost universally maintained.
2.38 Having separated freight-car repair expenses between publicand service freight it is then necessary to apportior, a relevant partof service freight expenses to passenger service. lxperience indicatesthat the unit that best explains variability of service freight isthe train-lkn. It is therefore on the basis of the relevant train-kma4n passenger and freight service that railway service car repairexpense should be apportioned.
2.3'Q On railways where private owners' cars are operated andhere the repair costs of such cars are borne by the owners, the car-
on and net ton-la cariied in such cars must of course be excluded fromthe formula for separating works repair expense between public andrailwair service. On railways having interconnections with othersvsteins all foreign cars should also be excluded.
.. 40 Finally, as shall become more evident when considering unitcosts, the workshops cost accounts should be analyzed to determlnevariations in repair cost between the various types of freight car,e.g., tank cars, livestock cars, boxcars, gondolas, etc.
(d) Line Maintenance of Freight Cars
?.ll .Running repairs of freight cars are carr_ed out as and whenrequired. Although it is likely that much of the wear and tear of thebory takes place during shunting operations, it is usually found that
2o

the car-kIa best explains variability of line maintenance expenses, whichare generally related to bogies, w.neels, and runring gear. The wholeof these expenses should be taken as directly variable unless extra-ordinary circumstances exist to indicate otherwise.
2.42 Separation of experi3es betw.3en ?ubLic and railway freigght,and between passenger and freight services, should follow the sama patte-rnas for workshops maintenance expenses.
(e) Workshops Maintenance of Passenger and Related Cars
2.43 Expenses should be separated between passenger-carr1in'vehicles (by class of travel), restaurant and canteen cars, and express.,mail, baggage, and brake vans. In normal circ-mLstances tney should betaken as directly variable in relation to car-cn and allocated topassenger, express, and mail service respectively.
(f) Line Maintenance of Passenger and Related Cars
2 .44 These are directly variable expenses and should be treatedas in the previous paragraph.
(g) Maintenance of Ballast Cars
2.45 In the earlier discussion of ballasting expenses (para. 2.23(iii)) it was indicated that in normal circumstances such expenses werefixed except where increased capacity of the ballast section might berequired. The same principle should be applied to ballast-car mainten-ance expenses. Maintenance of the existing fleet should be taken as afixed cost; cost will vary only when and to the extent that additionalinvestment in ballast cars is projected.
(h) Maintenance of Inspection (Business) Cars
2.46 On most railways inspection cars are not intensively used,and in the time period relevant to rate-making it would be safe to assumethat expenses of their maintenance would be a fixed cost. If an expansionof the fleet is contemplated some costs may vary but in any case thedegree of such variability should not, normally exceed that of super-intendence expenses (para. 2.06).
27

(i) Matntenance of Other Works Eq'uiprient
2.47 >xca-t where it is -proposerd to extend -ahe use of mechanicalworks eui-psmrer. the exo:ei.se of main ni tha- eELdstirq; eoui-,pment maybe taken as .:iXed casvt Tf addi,ional techanical 'Mpea-nt is to beintroduced) -he additiofnal coSt of its maintsnance shoulQ presimably beoffset Dy savLngs on other sbheads of labor cost.
(j) Depreciaztion of Locoam-otives and Rolling Stock
2.4& Provision is normally made for thu wear and tear of locomrlo-tives and roi1 ling stock by charging against revicnue an annual suLm fordepreciation. This is based usually on currentu re,_acoioent values butoccasionally an original cost, divided by the engineer's assessmrent ofthe line of -he equipme.nt ir. years, the objectie 'being to equalize asfar as -ossible t'he annual charge to inco.ae acoo'=t over t,he estimatedlI-fe of the assets. !3ecause of ti-s, depecdiataon is sometimes w.onglyassumed to be a fixed cost. The accurate dete mination of variablecost rec.aires that the value of all the resources consumed in carryingadditional t-raffic should be quantified. It is clear that by runningan additional traffic should be quantified. It is clear that by runningan additional train or carload some additional wear and tear of thelocomotive and rolling stock will be caused.
2.h9 The princiDal causes of depreciation of locomotives androll-ing stock are (a) physical wear and tear resulting from use and (b)obsolescence. Equipment that is intensively operated -will have a shorterlife than that which is underutilized and is less likely to becomeobsolescent. For costing purposes it is proposed that depreciation asshown in the accoints, based on prescribed lives of tne assets in termsof years should be discarded, and replaced by use-depreciation based onthe engineers' estimates of lives in terms of kiclcometers, as indicatedin the example shown in Appendix C, Table C3.
2.50 Depreciation calculated in this manner should bae treated asdirectly variable cost (the difference between this and any accountingdepreciation may be considered as fixed cost) and should ba separatedbetween jassenger arid freight services in the following manner:

Locomotives
Passenger--line-haul )Passenger--yards ) allocate directlyFreight--line-haul ) on basis ofFreight--yards ) Locomotive-IcnFreight--wayside statLon shunting )Departmental-allocate to passenger and freight on
basis of respective train-km.
Freight cars
Allocate between public and railway freight as inpara. 2.37; railway freight proportion is to beallocated to passenger and freight services in theratio of respective train-1aa.
Passenger and related cars
Allocate to passenger, mail, and express.
(k) Maintenance of Wlorkshops Machinery
2.51 This is an indirectly variable costi influenced by theintensity of use of the plant, and the degree of its variabilityshould be ascertained by study of past trends. The variable cost soascertained should be separated between passenger and freight serriceand between line-haul and terminals, in the same proportions as thetotal variable costs previously determined for maaintenance of locomotivesand rolling stock.
(1) Maintenance of Power Plant
-52 This may normally be taken as fixed cost unless extensionsto the plant are projected.
(mi) Maintenance of Water Supply Machinery
2.53 On railways converting from steam to diesel operation thisitem of expense may be expected to decrease. An engineer.s estimateof the potential savings within the period of the projection should beobtained. On fully dieselized railways maintenance of water supplieswould normally be a fixed cost.
29

(n) Depreciation of Machinery
2.54 The degree of variability and the allocation of variablecos: to tha respective services should follow the pattern of tiedis-;ri.uti3n of costs unrder the pirecedilng thrree par^agraphs 2.51 to 2.53.
(o) Ojfice Supplies, Miscellaneous
2.55 Allocate in proportion to total expenses on equipmantmaintenance.
(p) General--Social Security and Pensions
2.56 See Maintenazce of Way and Wtorks, paras. 2.28 to 2.30.
Traffic (Cammercial) DeDartment
2.57 Experience ind^icates that the expenses of this department,which in most cases are relatively insignificant, should vary directlywith traffic volume if commercial and market research activities are tobe adequately maintained. This may not be so in a minority of caseswhere a large department has been established, capable of looking afterall present and prospective customers and conducting adequate marketresearch. A decision on future costs of the department should be basedon administration policy.
Transportation
(a) Superintendence
2.58 See paras. 2.03 to 2.06.
(b) Dispatchers
2.59 Irn nonmal circumstances, expense under this head might beexpected to vary in ratio to the number of trains rur, ard this, as aconsequence of improved technology, should be less than proportionateto traffic growth. Separation of expense between freight and passengerservices snoula be made on the basis of train-km in eacn respectivese-rvice.

(c) Station Staff
-.5C Tn the proposed classification of expenses presented inAppendix A (items 4.03 to 4.C5), separate allocations are su-gest-ed2cr staff employed solely on passenger or freighat dutias or on dutiascommon to both services. At present the genera± practica is to allocateall station staff salaries, allowacss, ar. otner solents to a snglaitem of expense. It will therefore be neces3say to undartzke consider-able investigation of establis;hment rolls to seParate expanses in thefirst place between those allocable either to fznaight and passengerservice directly or to operations conmnon to botoh services, and in thasecond place to separate them between directly variable, indirectlyvariable, or fixed cost raspectively. However, analysis of the functionsof the staff will in most cases indicate whether the expenses of theiremployment are variable or fixed costs. Passenger or freight bookingstaff, for example, may reasonably be assumed to represent directlyvariable cost on the grounds that the number of staff employed shoaldbe no more than sufficient to handle existing traffic. In any locationwhere booking uduties do not constitute a full day's -work the staffL willbe employed part time on other duties and will therefore fall withinthe category of operations common to both freight and passenger services.It is in this connection that the chief difficulty will arise indetermining the relative proportions of fixed and variable cost. Atmost wayside stations, for example, booking of freight and passengersis a relatively minor part of the day's work. On single-line railwaysin particular, the'clearance and crossing of trains and relatedoperational duties are the main preoccupat,ion of the staff. For suchpurposes staff is normally provided in sufficient numbers to man thestation throughout the 24 hours of each day. They should therefore becapable of handling traffic up to the maximum capacity of the line interms of train paths. Within that limitation, therefore, staff expensesat wayside stations may be taken as fixed costs except insofar as freightor passenger traffic at any particular station is suffic'iently large tojustify employment of staff spocifically for freight or passengerbooking. Examination of the station staff rolls will normally providethe requisite information.
2.61 For larger stations, as much analysis as possible should beundertaken from the station staff rolls. Thereafter, whenever douabtexists as to the capacity and future variability of staff strength inresponse to changes in traffic volume, the matter should be discussedwith experienced operating officers in order to deteramine tne probabilityand magnitude of any prospective variation.
31

2.6/2 Wherever possible, variable costs should be allocateddirectlv to the service for wnich they are Lwcu:-red. Variable coststtat cannot be allocazed to freight or passenger services directly,but w:hich ai-, cofar,on to 'both, so,LCul De sesarated between tUhe respect-iveservices in propo-ticr. to the operatin_g uni (e.g., train-tn) tnatappears to explain best the variability of cost.
2.63 In this discussion it will be n3ted that the proposecanalysis is based on station staff rolls, which nill produce results,n terms of numbers of men, not in terns of money. Nuumbers of manshould oe translated into equivalent expense by raultiply-Lg therm bythe average emoluments of the relevant grades. Because of the inte--changeability of staff this method will produce a more representat~ivefigure for costing purposes than the actual emol-umernts of individualstaff occupying specific posts at any specific time, a figure tha- inany case would require excessive work and time to produce.
(d) Station Supplies
2 .64 Expense under this head should be separated between fixedand variable cost, and between passenger and freight services, in thesame proportions as determined for station staff.
(e) Yard Staff
2.65 V-ith the exception of yardmasters, their assistants, andclerical staff, the number of men employed in yards will be governed bythe number of yard locomotive shifts oparated. In the very long irLnthe number of yard locomotive shifts will be adjusted to traffic volumeso as to produce a cost variability of close to 100 percent. In thetime period relevant to rate-making or tariff adjustbrent it may well befound, however, that in certain yards, because of the indivisibility ofa locomotive shift or a worker's turn of duty, there is surplus capacityof both locomotives and yard staff. In small yard, for example, theremay be sufficient car movement to require a yard locomotive, and itsattendant yard staff, although the amount of work to be done may besubstantially below the potential output of the locomotive and staff ina normal day's work. Similar'Ly in a large yard a point will be reachedwhen the capacity of the existing shifts of locomotives and staff hasbeen fully absorbed. An additional shift must -.-hen be introduced, andthis in tunri will. provide surplus capacity for a significant perioduntil traffic voliLme increases to the point at which one more shift- austaga-in be introducec.
32

.66 To determine the situatior in each yard and the tirme takento DerformL individual movements oetween the various locations servedthrough the yard will require exhaustive field studies. As was suggestedin the introductior. (para. 1.28) this task should be undertakern in theprocess of refining the ccsting system. in the initial stage cf costingfor general rate-making purposes it is suggested tha- a s uf-icierf tyrealistic assessment of yard capacity u-` liz-aion can be .made on an all-line basis by assuming that all locomot_ve shifts except the last oneintroduced in each yard are worked to capacity and that the last locomo-tive shift introduced in each yard is worked, on averare, to 50 percentcapacity. To take an actual example, where 80 yard locomotlve s;^iftsare operated in 12 yards, then 68 shifts nay be assuimed to be fullyutilized and 12 utilized to 50 percent capacity--in other words tha all-line capacity utilization ratio is 74:80 or 0.925. For simplicity ofcalculation 92.5 percent of yard expenses can be treated as dir^ectlyvariable cost, the balance being unused capacity cost that will beabsorbee wihen traffic volume, measured in terms of cars oadings a<d car-k,n.has increased by about 8 percent. In theory, when traffic volunmeincreases to 101 percent of capacity (assuming that the increase isspread evenly over the railway system) one additional shift will needto be introduced in each of the 12 yards. This is equivalent to anincrease of 15 percent in overall yard operations, involving an equivalentincrease in yard expenses. In practice this situation is unlikely toarise.. The bulk of the increase in traffic volume is usually concentratedin those parts of the system which already carry the highest density oftraffic. The excess yard capacity, which is absorbed much more quicklyin large bu;sy yards than in small yards, is not likely to depart sub-stantially from the average (7.5 percent in the example cited above).A study of trends over a period of past years should confirm or modifythis assumption.
2.67 In Appendix B, paras. 2.02 and 2.03, a proposal is made thatyard locomotive hours should be separated between freight and passengerworking. Unfortunately this separation is rarely if ever made at present.Therefore the separation must be made on the basis of either specialstudies of those yards where passenger trains are marshaled, or on theadvice of experienced operating officers having intimate knowledge ofthe working of each yard.
(f) Yard Locomotive Crews
2.68 In Appendix A, items 4.09 to 4.28, it is proposed thatseparate primary expense accounts should be established nor yard locomo-tives. This is in accordance with the ICC Uniform System, slightlyelaborated to provide a breakdown between passenger and freight service.
33

Where the ICC rules are foIloved (-mainly -n certain countries of thewestern Hei-iisphere) yard locomotive costs are readily available. Inmost countries, however, all locomotive crew costs, mirnline and yardscombineed, are included in a single expe-.se acco.nt. As a first step,therefore, it i s necessa-r to separate yar2d c-svs from l'ine-haul costs..L is often fo-and that this separati-n ca- be done or tha basis ofstaff 'rades. For example, yard locomotive ir_vers -ray ba Sraded as"Fireman, passed driver" or "D.river, Grade TV,"1 and their pay andallowances can be calculated on this basis. Alternativaly locomot-ivehours in use, mainline and yards, can be related to average pay andallowances of drivers and firemen in the resoecTive duties as ascertainedfrom studies of the payrolls. In practice it is usually found that adependable method of separating line-haul frXrm yard locomotive crewexpenses can be devised, but nonetheless it is strongly reconomanded that,on railways where they dc not already exist, separate primary expenseaccounts for yard locomotives should be introduced.
2b.- After the cost of yard locomotive cr has been determir.ed,the variability of such cost and its separation between passenger andfLreigh-t working should then be determined in the same manner as yardstaff costs, discussed in paras. 2.65 to 2.67.
(g) Yard Locomotive Fuel
2.70 On railwayS that follow the ICC rules, Tuel expenses will berecorded separately for yard and mainline locomnotives. On other railwayswhere a single expense account is maintainied for all locomnotive fuel,fuel consumption by class and type o- locomotive may be calculated byreferring to the statistics generally maintained in the office of eitherthe Chief Operating Superintendent or the Chief Mechanical Engineer.These quantity statistics can be translated into separate expense totalsfor yard and mainline working by reference to the unit prices ol' eachform of fuel consumed.
2.71 Yard locomotive fuel expenses should be treated as directlyvariable cost and separated between passenger and freight working inthe samLe manner as yard staff and locomotive crew costs.
(h) Yard Locomotive Water
2.72 If locomotive water consumption is not separately recordedfor yard and mainline locomotives and for steam and diesel traction,a formula to achieve this must be evolved, on the basis of either special
34

studies or statistical analysis of any available records maintained iDythe Mechanical Engineering or Operating Departments. Attention shou:Ldfirst be directed to separating water expenses between steam and dieselworking. After that, if a positive record of quantitative consumptionis not available, it may be assumed that within reasonable limits ofaccuracy separation ot cost betwreen yard and mainline working, and be-tween passenger and freight services, may be prorated to fuel consumption.Water expense for steam locomotives will cf course greatly exceed thatfor diesels, although the latter may not be insignificant and must beknown in order that future costs may be appropriately adjusted on rail-ways where conversion from steam. tc4 diesel traction is under way.
(i) Yard Locomotive Lubricants
2.73 The same probleris will arise, and the same action must betaken to resolve them as for yard locomotive fuel. Lubricant consunptionand cost per locomotive-ian will, of course, be substantially higher fordiesel than for steam locomotives (see also Appendix B, para. 10.02).
(j) Sundry Materials for Yard Locomotive
2.74 In the absence of any separation in the primary accountsbetween mainline and yard locomotives, it is suggested that expenseunder this head should be allocated to yards and mainline haulage, andto passenger and freight service, prorated to locomotive-hours in use.In Appendix A, items 4.09 to 4.28, it is recommended that for this arndall other locomotive running expenses separate primary expense accountsshould be created for yard locomotives, follo-wing the example set bythe ICC Uniform System of Accounts.
(k) Running Shed Maintenance of Yard Locomotives
2.75 on railways whose expense classifications conform with theICC rules, there will be one primary account for yard locomotive mainte-nance and another for mainline locomotive maintenance in running sheds(engine houses in North American terminology). In such cases theseparation of yard and line-haul costs is sim.plified. On many otherrailways there is usually only one accounti for ranning shed maintenanceof locomotives (mainline and yard) of each type of traction (steam,diesel, etc.). In these cases difficulty will arise in separatingrunning shed maintenance costs between yards and line-haul, and thedegree of difficulty will depend on the relative accuracy and detail

of time recording and invent ory contr-l. Deter-mination of yard loco-motive maintenance expenses in ruLning sheds will probably requira aspecial study during a representative -iod of noa.al wojicing in eachrunnir.g shed. There are instances, however , wher-e °ob costing nas beenextended to uniryg sheds, and as a result- tV.he res-n)ective co_ts of yardoperation aEnd -hnline wor.ing may b3 ceter.ed with relati4ve ease.Ex-perience shows that there is no great d-if.f-icLulty in accountingseparately for running shed maintenance of yard and imainline loco.aotives.tWhere this has not been done in the -oast it is recowrnended trat it s1iouldbe stsrted inmmediately as shown in Anp&efdix A, item;rs 4.26 to 4.28 and4.-3 to 4;.66.
2.76 In normal circumstances rurnning shed maintenance of yardlocomotives should be taken as a directly variable cost. Certainlythe cos-t of consumable stores will vary in direct propertion to thenumber of locomotives requiring attention in the sheds, and the latter.'Li -.k:ill in turn tend to increase in response to higher carloading.sand car-km. -where the use of existing types o-° traction is expected tocontinue, the number of staff employed in the sheds may also be expectedto increase in proportion to the number of inspections and repairs to beundertaken. If.a changeover from one type of traction to a more efficienttype is contemplated, some reduction, retraining, and redeployment ofstaff will be involved, and it will be necessary to adjust future costsaccordingly. The underlying principle of direct variability of cost ofmaintaining each type of traction will, however, remain valid. For anexample of the suggested method of estimating future variable cost ofrunning shed maintenanca, adjusted for projected conversion from steam todiese-L traction, see Appendix C, and Tables 2.1 and 2.2 in paras. 2.105-6.
2.77 Separation of costs of running shed maintenance of yardlocomotives between freight and passenger servicas should follow thenattern adopted for yard staff and locomotive crew costs.
(]) Mainline Locomotive Expenses--General Comment
2.78 The difficulties likely to arise in separating yard frommainline locomotive expenses have been discussed under each of therelevant headings of yard locomotive expenses. In the fo'llowing para-graphs it will be assumed that the appropriate separation has been madeand that mainline locomotive expenses are known in total. Thereforethe only problem remaining will be to separate mainline locomotiveaexpenses between freight and passenger services. (Passenger servicein this context will be assumed to include such ancillary services asexpress, luggage, parcels, and mail that are noznally hauled on passengertrains. The breakdown of passenger train expenses between passengersof each of the ancillary services will be made at a later stage.)
36

2.79 In Appendix A, items 4.3C to 4.50, it is proposed thatmainline locomotive crews and fuel expenses should be broken down inthe primary accounts between each of the services involved, viz.,passenger, freight, mixed, and depart-mental. (For definitions seeAppendix B, paras. 1.03 to 1.06). ln all known cases -his willinvolve refinement of the allocation, of locomotive crews' pay andallowance vouchers and of fuel issues. Although there would a?pearto be no great difficulty in introducing, such a refi^aerv of ex-oenseallocation, in the ensuing paragraphs io will be assumed that theinformation is not currently available and thati an alternative ba;ai sof separating expenses between the relevant services must be found.
(m) Mainline Locomotive Crews
2.80 In many cases it will be found that locomotive crews aregraded according to exoerience and degree of responsibility and thatdriving of certain classes of trains is restricted to particulargrades of crew. This will provide the basis for allocating the relevantpart of locomotive crew expenses. For the rest a subdivision of expensesshould first be made between those which are time-related (salaries,overtime allowances, etc.) and those which are distance-related (e.g.,mileage or kilometrate allowances). Time-related expenses should beseparated between services according to the ratio of the respective trainlocomotive-hours plus train locormotive shunting hours (Appendix B, para.2.02) worked for each service. These hours are reduced as necessaryfor multiple-heading of trains with a single locomotive crew, i.e., bythe exclusion of assisting locomotive hours when such assisting locomo-tives are not manned. Distance-related expenses should be separated onthe basis of mainline locomotive-Ion run in each service (again exciudingassisting locomotive-Ian when not manned).
2.81 After separation of locomotive crew expenses between passenger,freight, mixed, departmental, and wayside shunting services, it nextbecomes necessary to reallocate mixed train crew expenses to passengerand freight services in proportion to the respective passenger and freightvehicle-km run on mixed trains. Similarly departmental train crewexpenses are reallocated to passenger and freight services, by proratingto passenger and freight train-km (including proportion of mixed in bothcases). A formula for the allocation of mainline locomotive crew expenses,with figures representing a hypothetical case, is proposed in Appendix D.
2.82 Mainline locomotive crew expenses of all categories should betreated as costs directly variable, relative to passenger and freighttrain-km or train-hours as appropriate.
37

(n) .>:.;ir.liTie Locomotive Auel
2.83 rn tne Absence o' direcr al'ocation to the various services-r, the primarv accounts it will be necessary to find a dependablestarti stiZal b'siS for analysis of fiedl erCpenrsas3 n later stages o-fref-i:nement, o_ tha cos-Ling system., speciaL studies c-a-n be undertaken todeterine comparative levels of fuel consu.I,-.0io.., in 71opposinag direcvionsOil diIferent sectio-ns of the line, and by various classes of 'rain. Forgeneral rate-making purposes, howeve-_r, on all railways exce-t thoseconstructed in exceptionally mountainous country;, it is generally foundthat fuel consu-xxtion per 1000 gross trailing ton-icr is a reasonablyconsistent measure, both as an all-line average Lnd by revions orsections. For example, on a railway of Dver 3000 route-icZ.n, wit'h anundulatingr line rising no more than 70G0 neters above sea level at anypoint, fuel consumption per 1000 gross tra-ling ton-kRm in any districtof the system, did not vary from the all-line average by rore than 2 per-cent. On the other hand, in Pera 'or examole, where tha line rises toalmost 5000 meters above sea level in a relatively short distance, itis obvious that there will be considerable directional variation in fuelconsumption. There should be little difficulty in determining themagnitude of variation in such exceptional circumstances. In moreordinary cases the suggested measure of fuel consumed per 1000 grosstrailing ton-kc should provide a dependable basis for expense allocationby line-hatl services.
2.84 An exception will arlse on all railways in determining theamount of fuel consured by train locomotives shunting at. waysidestations. In this context it is sug-ested that fuel consumption peryard locomotive-hour in use (a figure that should be readily available)should be used as a multiplier of train locomotive shuiting-hours toarrive at the total fuel consLmed in wayside station shunting. If, inthe engineer's opinion, it is necessary to inflate fuel consuruption oftrain locomotives, vis-a-vis yard locomrotives, because of their greaterpower, a factor to reflect the difference can no doubt be readilycalculated.
2.85 Having determined the consumption of fuel in wayside stationshunting, the balance of mainline locomotive fuel expense should innormal circumstances be separated between passenger, freight, andaeDartmental services on the basis of g:^oss trailing ton-. (ln thiscontext "passenger" and "freight" w-ll inc-;Lude vheir respective propor-tions o;F "mixed"). Finally, departme.entai; fuel e:-o&nses will be allocatedLo passegre-r ind frei h-' sesrices inr proportic.n to the train-kcm run ineaci-I reszective service. A form;la fcr allocm.ting naainline locomotive.. el e:,spenses, A-ith ,igures re-presenting a hypothetical case, isproposed in A-opendix E.
38

(o) Water for Mainline Locomotives
2.86 Water expenses should be separated between the variousservices in the same proportions as fuel expenses.
(p) Lubricants for Mainline Locomotives
2.87 Lubricant expenses should be seoarated between the various-services in proportion to the total mainmlne locomotive-kn run in eachservice. Separate calculations wiLl of course be made in this as inall other items relating to locomo;ive operations for each type oftraction-,-steam, diesel, electric, and railcars. Mixed train fuelexpense will be allocated to passenger and freight serviceis in propor-tion to the respective passenger and freight vehicle-kma run on mixedtrains. Departmental train fuel expensas will be reallocated inprcptortion to total passengor and freigh;t train-icn, including therespective proportions of mixed.
(q) Sundry Materials for Mainline Locomotives
2.88 Expenses under this head should be separated betweenpassenger, freight, mixed, departmental, and wayside station shuntingin proportion to locomotive-hours in use for each respective service.Expenses for mixed and departmental trains should then be allocated topassenger and freight services in the same Tmanner as in previousparagraphs.
(r) Running Shed Maintenance of Mainline Locomotives
2.89 In the absence of running shed maintenance costs relatedto the service performed by the individual locomotives that come in formaintenance, it is suggested that the separation of expenses betweenservices should be prorated by locomotive-km. In this context thelocomotive-kmn is selected in preference to the locomotive-hour becauseit will almost invariably be found that the locmotive roster providesthat a locomotive trip shall consist of a journey between certainlocomotive-changing stationss on arrival at its destination the loco-motive will be inspected and will normally receive the same degree ofmaintenance, regardless of the time taken to travel from the previouslocomotive-changing station.
2.90 Running shed maintenance expenses of mainline locomotivesshould be taken as a directly variable cost. The same considerationsapply as in the case of yard locomotives (para. 2.76).
39

(s) Train Crews
2.91 Reference in most cases will need to be made to staffestablishmrent lists in order to separate -assengc,er and freight crews.Or the r.ajori-ty of railwa-s, f'eight trains wi" carry only one guard,who w>_1 usually be of the lowest paio ca-pegry of trairn crew, -whereaspassenger trains may have a hQead guard (conductor), ai assistant, oneor more traveling ticket insoectcrs, and pe2taps baggage handlers. Insomre countries, particularly in. mountainous areas freight trains raaycarr, a number of brakemen irn addition to the head brakeman or guard.The separation of expense betweer. the serrices shou'ld not cause muchdifficulty, but it is recommended, as shown i_n Appendix A, items 4.67tc 4.69, that the expense classification should provide separateprimary accounts for passenger, freight, and departmental train crews.In the final allocation, departmental train crew expenses should beseparated between passenger and freight services in proportion to theti':iiC. 'un. in eachn service. Train crew e,penses should be treatedas a directly variable cost relative to projeced train-kma.
(t) Sundry Train M-aterials
2.92 Expenses under this head for a representative period shouldbe analyzed; reference to material requisitions or issue vouchersshould provide a reatr means of assessing tChe relative proportions ofexpense incurred for the vanrous train services. It is recormnended, asin Appendix A, items 4.71 to 4.73, that separate primary expense accountsshould be introduced for passenger and freight services. The whole ofthis expense will vary directly with train-En.
(u) Signalmen and Level Crossing Keepers; Telecommunications
2.93 In the time period normally relevant to rate-making ort.ariff revision it is probable that expense under these headings willrepresent fixed,cost. Costs would vary only if it were intended toextend the signaling and telecommunications systems, in which casemaintenance and operating expenses,would increase proportionately, andthe cost of providing capital for the added investmant would need to betalcen into account in assessing future costs.

(v) General Expenses
2 .94 General and office expenses may be expected to vary in somedegree in response to traffic growth and resulting higher activity inthe departnent. It would seem reasonable to assume that the degree ofvariability would reflect the average of the department as a Whoia andtha; its allocation between services shoould be proportional to tnsrespective totals o1 all other variable expanses of the department.
(w) Derailments and Accidents
2.95 Assuming that the condition of track and equipment is goodand that operating rules are being observed, expenses under this headmay be assumed to be a directly variable cost, relative to train-ki, to be separated between passenger and freight services in proportionsindicated by recorded experience over a representative number of pastyears.
(x) Claims and Losses
2.96 The greater part of this expense will refer to freighttraffic and should be treated as directly variable with traffic voltme.In the further analysis of commodity costs, the value of the consignmentwrill be the major consideration.
(y) Social Security
2.97 See paras. 2.28 to 2.30.
Express
2.98 The whole of the expense recorded in this section of theexpenditure classification refers only to terminal costs--of collection,documentation, handling, dispatch, receipt, and delivery. The cost ofproviding and hauling express cars by passenger train is not includedat this stage. In the initial costing phase, therefore, express exoensosshould be classified under passenger service. at a later stage passengerGrain costs will be separated between passengers, express, and mail,allocating to each service all the costs properly incurred for itsprovision.
41

>.9 The ten-,l "ex-pess" is used main ly irn the Weste-rn Hemisphere,re -s usual to Drovide for the traffic specially designed vehicles
for nA'-ssenger train wo-king. In other parts of lvhe world such terms as"oacceis traffic" or "nrande vitesse" are com:aonly used in the samecontext. ;he traffic is rnoLcLally carried eitvher by passenger trarLn in-hrnb orake or baggage c_r or ±-n freigh-ht cars at-uced -- noxraa'y Lo passengeI;r .a-ns ut also on occasion to f&ast -reiht t-rain. Cor-iuson raay there-i :-e arise as to whezher the reven-ue deri-ecd froi the traff c, arnd thecost of' carryi.n it, are t,o be classi.fied as Lisser.ger, freight, orspecific vo the traffic itself. Local conditions should be carefullysbudied so that revenue and expenses can be appropriately ;related. Thiscan best be done after unit costs of operation have been developed, andthis is considered in Section E of this chapter.
Adninistration
2 .'.3O The circumstances applying i'_n the case of de-par-tnentnisuperintendence (paras. 2.05 and 2.06) are generally applicable togeneral administration, and the same procedure should be adopted toassess the degree of expense variability in response to traffic growthand resultant higher leve-Ls of activity. It is suggested that theseparation of variable administrative expense between ser-vices andbetween line-haul and terminals should be prorated to the total variableexpense allocated thereto.
PensioL:s, Gratuities. etc. (See paras. 2.28 and 2.29).
C. THE COSTING SYST&M--FREIGHT TRAFFIC--PREJI 10TION OF FuTURE COSTS
2.101 The factors to be considered in the projection of futurecosts have been outlined in para. 2.02. In Appendix C an examp'le isrersented of a suggested method of making the initial analysis thatwill provide the basis for giving effect to each of the relevant factors.The example assumes a railway in the course of conversion from steam todiesel working. F'reight traffic is expected to increase at a rate ofabout 5 percent per year, and passenger traffic about half as fast.Much cf the increase in freight will corsist of bulk commodities -thatwill tend to improve car-oading. A program of freight-car replacementshould enable arrears of maintenance to be undertaken, with a resultantreduction in the ratio of cars under or awaiting repair. These factors,combined with other opera-sional improvements arising from technologicalchanges, are expected to reduce car -vurnaround to the extent that it
42

should be Dossible to handle an overall increase of 22 percent infLreigh- traffic in the years 1971-1974 with only a marginal increasein the number of freight cars on line. Wages ar.d salary levels areexoected to increase by 33 percenv during the four yaars of theprojection, accompanied by a possible rise of 22 perzant in the costcf imnorted goods, capital and consuraable, in. the sarme pe-riod. Theunderlying factors, together vith other projected statist-cs ofoperation, are detailed in Appendix. C, Table C2. It is further assiunedthat the costing study is based on the financial results for 1970(after normalization - refer para. 1.08) and uhat costs are beingdeveloped in 1971 to provide a basis for a rates revision expected tobe effective from 1972 to 197T.
2.102 Reference has been made earlier to capacity costs, and atthis ocint it is necessary to explain how these have been dealt, within the example shown in Appendix C. Wherever an expense item isconsidered to be a capacity cost it is identified by the letter C, andag.-ains3 it is indicated the current capacity utilization factor, asassessed by the appropriate technical officer. If, for example, thepresent capacity utilization factor of any specific facility is 0.80,and the increase in the particular units absorbing the output of thefacility (e.g., train-km in the case of sigrnals) is expected to be 15percent during the period of the projection, no increase in expensewill be incurred. The expense item may therefore be taken as tenporarilyfixed for the purpose of the projection. If, however, the increase intrain-km were expected to be 30 percent there would presumably be a 4percent increase in operational and maintenance costs of the facility(0.80 x 1.30 = 104). Where a lc,ng-term investment program has beenprepared the inclusion of additional (not replacement) investment in anyfield will confirm that the capacity of the facilities is expected tobecome inadequate within the near future, and this will provide an addedguide to probable trends of operating and maintenance expense.
2.]03 In this context the special case of locomotive water suppliesshould be mentioned. If steam locomotives were to be operated indefi-nitely over a particular line the operation and maintenance of waterpuaping stations would represent a capacity cost, with perhaps substantialreserve capacity. In the example shown in Appendix C, however, where anextensive program of conversion to diesel operation is in hand, watersupply expenses become negatively variable, i.e., decremental costs,and are so treated. As for the remainder of the expense accounts, thesuggested method of assessing their degree of variability in responseto changing traffic levels has been considered under the relevant paras.2.03 to 2.100.
43

2.10l After long-run variable costs in terms oL 1970 prices andperfo.naace have been deternined it next becomnes necessary to convertthe ficures into future costs, first by applying factors for estimatedwaues and maaterials price increases and second by adjusting for savingsthat; can be effected by dieselizatior. and other technological improve-me.nts. Thre first of these processes, viz., the conversion of 1970 wanes-evels and or;ces tc 1974 forecast levels, has been done concurrentlywmth the analysis of 1.970 expenses, as shown in Appendix C, Table Cl.Tne factors on which the conversion was made are given at the end ofTable C2.
2.105 The position has now 1been reached at which the cost ofnoving the 1970 volume of traffic, at current operating standaids and withthe eq,uipment available at the time, has been calcul'ated at coE!ts expectedto prevail in 1974. It now remains to assess tihe effect on future costsof pro,5ected changes in operating standards and the type of equipment inuse. As a first step to this end it is necessary to analyze cost inrelation to is causes, as showvn in Table 2.1.

Table 2.1
FUNCTIONAL ANALYSIS OF LONG-RUN VARIABLECOSTS--HYPOTHETICAL CASE OF XYZ RAIIWAY
(In thousands of dollars)
Costs influenced mainly by: Passenger Freighti Total
Gross ton-km (mainly track cost anddepreciation) 2,553 3, 077 5,630
Train-km (dispatcher, train crews, etc.) 5,825 3,8614 9,689Freight car-km (line maintenance of cars,
depre ciation) - 6,1426 6, 426Freight car-day (workshops maintenance) - 1,952 1,952Locomotive-km (workshops and linemaintenance)Mainline, diesel 3,074 3,522 6,596Mainline, steam 3,355 5,599 8,954Shunting, diesel 123 1,582 1,705Shurting, steam 155 2,116 2,271
Railcar-km (maintenance, operation,depreciation) 1,1481 - 1,1481
Passenger car-km (maintenance, operation,depreciation) 5,030 - 5,030
Car movements in yards (yard costsexcluding locomotives) 78 2,577 2,655
Freight traffic volume (documentation, handling) - 3f,849 3,849
Total long-run variable cost 21,674h 34,5614 56,238
2.106 Completing the projection of future freight traffic costsis considered first. This consideration will be based on the hypothesis,already outlined, that there will be significant traffic growth and thatthere will be substantial shift from steam to diesel traction and theintroduction of freight cars of greater capaeity. The speed of trainsand the tonnage they carry and the net load of each freight car willconsequently increase. There will be marked differences in the rate ofgrowth of ton-kmn, train-km, car-km, and locomotive-km. In fact, steamlocomotive-km will be substantially reduced. To reflect the dispro-
45

7ortionate growth rate of each of the individual units of output, aseries of factors is applied, expressing the projected output in 1974as a multiple of the actual output iri 1970. For example, freight car-kmin 1'974 are projected at 285 million: as compared with 240 million in1970. The factor for multiplying 1970 costs that vary in response tcchanges in car-kIn -ill therefore be 1.19. The resultant projection cffreight long-run variable costs to 1974 is shown in ^'able 2.2.
Table 2.2
FREIGHT TRAFFIC COSTS--ADJUSTMENT OF LOlNG-RUN VARIABLE COSTSTO TAKE ACCCJNT OF TECfNOLOGICAL AND OPERATING CHANGE--HYPO-
THhrICAL CASE OF XYZ RAILWAY(In thousands of dollars)
1970 costs Output 1974 174Costs influenced mainly by: converted to compared projected
1974 prices with 1970 costs
Gross ton-km 3,077 1.21 3,723Train-km 3,864 1.11 4,289Freight car-km 6,426 1.19 7,647Freight car-day 1,952 1.04 2,030Locomotive-kmMainline, diesel 3,522 1.71 6,023Mainline, steam 5,599 0.50 2,800Shunting, diesel 1,582 2.07 3,275Shunting, steam 2,116 0.50 1,058
Car movements in yards 2,577 1.19 3,067Number of consignments 2,797 1.22 3,413Tons ol less-than-carload traffic 1,052 1.22 1,283
Total 34,564 38,608
Net ton-km, million 3,600 4,400Long-run variable cost pernet ton-km, cents 0.96 0.88
46

2.107 Apart from the primary objective of the costing exercise inproviding a basis for rate-making, the results may also be used to showthe savings in operating expenses that may be expected to accrue frominvestment in more efficient equipment. On the assumption that, if noinvestment in diesel locomotives and freight cars of higher capacitywere to be made, all costs would increase proportionately to trafficgrowth, i.e., by 22 percent in the period of the projection, a simplecalculation will indicate that operating expenses in 1974 would begreater to the extent of $3,559,000. Savings of this anount will bemade possible by investment in:
Diesel locomotives (freight traffic) $3,250,000Freight cars of higher capacity $ 309,000
2.108 To return, however, to the primary purpose of the exercise,it is now possible to begin to calculate projected unit costs ofoa eralon, in order to permit determination of the long-run variablecost of carrying specific commodities, either on an all-line basis,according to average characteristics of the specific traffic and itsaverage length of haul, or for specific movements.
D. INTEREST ON CAt-ITAL
2.109 Before proceeding to the calculation of unit costs, however,it is necessary to introduce into total variable costs an element forthe cost of the additional investment needed to handle the growth oftraffic. The cost of capital required to increase capacity or to renewexisting assets is as much a part of long-run variable costs as is use-depreciation of the assets, already incorporated in operating expense.A calculation of interest on capital is shown in Appendix F, whichassumes that the cost of future borrowing will be 7 percent. Consider-ation is still restricted to the assessment of long-run variable cost,and the calculation of interest in this context should not be confusedwith assessment of a return on the investment, the latter being afunction of rate-making and not of costing. The interest calculationsin Appendix F are then carried into the calculations of freight trafficunit costs as in Appendix G. Each of the unit costs calculated inAppendix G will now be discussed.
47

E. ri-B C0oJriG 6Y6TM--FR.EOIGH. TRAFF,FG--UNXT-^ CGSTS
2 .110 From an examination of the categories of cost shown innable 2.?, the definition o-f the unit of outa-ut to be used as the basiscf calculatirng unit costs will in all cases be evident, and in mostcases the number of units will be kcwn-; by reference to uhe opera'ingstatistics of the railway. There are exceptions, however., and thesemay give rise to considerable diifficu:l-ty Ln determining the number ofoutput units involved in a specified area of operations and the ho,Lo-geneity or variance of such units. The case of carhandlings inmarshaling (classification) yards and industrial sidings is most likelyto give rise to such difficulties. in Appendix B, para. 12.02, it issuggested that records of the numbers of cars handled in each yardshould be maintained. Bat even if this were to be done it might notprovide a full solution to the prcblem, because there sight be substantialdifferen^.es in the amotunt of wor' involved in particular movements becauseof differences in yard layouts and in distances betWeen sidings se:ved byeach yard. This problem has faced all railway cost analysts and was wellsummarized by W.19. Stenason, Director of Economic Research, CanadianPacific Railway,J in the following words:
When the cost analyst has succeeded in analyzing the behavior ofrailwar operating expenses in an account, he is only half way to his goal.He then faces what is, in many cases, the equally difficult task ofcount4i ig the output untrits which attach to the category of traffic underanalysis. To do this in respect of yard operations requires exhaustivefield studies.
In the case of Canadian Pacific, Yard Studies are done by a groupconsisting mainly of operating personnel headed by an assistant super-intendent with some familiarity in economics and cost analysis. All ouryards were stratified into several groups--large yards, medium-sizedyards, small yards with permanent engine assignments, and small yards inwhich the work is done by road engines.
Yards in each of these groups were selected for study on the basiscf operating knowledge as to which yards would be representative of eachclass of yard. For example, all of the large yards were studied. Thesample coverage declined through the medium-sized and smaller yards.
1/ "Econoipic Costing of Railway Operations," RaLlway SysteTsand Management Association, Chicago, Ill., USA, Dec. 1960

Overall, about 70 percent of all yard switching time was accountedfor in the studies. A four-day sample period was selected. Tne yardijas zoned by operating men who were familiar with its operation. Tnesezones were called elements of yard work. They were designed to reflecta homogeneous operation. Thus, if thiere were three classification areasin a yard, there would be three elements of reclassification work. Eachyard transfer was treated as a separate element of switchinv, and eachindustrial area was treated as a separate element.
In our Vancouver yard study, for example, we have over 50 elementsof yard swi-zching. The procedure, then, was to count the engine timein a particular element of switching, and cars handled in that larticularelement during the period of study. From this, a unit time for theelement involved was derived. We are then in a position to develop forany category of traffic, once we know the routing of that category oftraffic through the yard, the yard engine time which is required.
WJe also tested the variability of yard expenses by relating yardengine time to cars handled in classification wozk in each of the yardsstudied. With these studies, we again have the data required for.across-section analysis, and we found that yard engine time on a cross-section basis in classification was completely variable with the traffichandled in classification. This cannot be appropriately done for otherelements of yard work, since there are major differences betweendifferent yards in regard to distance from classficiation area, physicallayout, and characteristics or the length of industrial sidings.
2.111 To institute special studies of yard operation in the detaildescribed by Stenason may take a long time. For a more immediateapproximation of yard unit costs a formula is suggested in Appendix H.It is believed that this formula will provide a unit cost of yardhandling of acceptable accuracy for costing for general rate-making.For costing a specific consignment a more detailed study of specific carmovements at origin and destination would of course be necessary. Inthe initial stages of costing for general rate-making it is suggestedthat the Appendix H fonnula should be adopted and that costs be refinedlater after special studies have been made along the lines describedabove.
2.112 A second problem may be involved in determing the number oforiginating consignments for purposes of calculating the unit cost ofdocumentation in freight booking offices. In this case the difficultymay be overcome without much trouble. If no statistical record ismaintained the figure should be calculated by reference to the numberof machine-numbered invoices (waybills) issued by the accounts office

or u,ed at stations during the relevant period. The cost until willin all cases be one consignment, the cost involved being, for allp;^actical nurposes, the same for all consignrments, irrespective ofsize. Therefore, for example, if the cost of' docur.entation is $1 perconsiginrwent, a carload consignment of 4i) nelsric tons will on an averagecost 2.5 cents a metric Ton, whereas a lez s-than-cdrload (LCL) consign-ment of 20 kilos will cost $50 a metric ton equivalent (costs fo;increments in output could be different from the average). This verywide variation will have an important bearing on the relative rates,particularly oOr LCL traffic and all traffic over short hauls.
2.113 Another item of operating expense that figures largely inthe accounts classification of most railways is the cost of handlingfreight traffic at terminals. This cost usually comprises loading andunloading of freight cars and handling in fraigh't warehouses on receiptfrom and delivery to customers. Normally the service is restri cted toLCL traffic, but, where road collection and/or delivery services areoffered by the railway, carload traffic may be involved as well. Afurther complication can arise where the railway provides railway-paidlabor at cer-tain major stations only, whereas at other stations licensedcontractors supply the labor and collect fees directly from customersfor handling their goods. The ciY-cumstances of each case must beestablished, and the tonnage of traffic handled at railway expense mustbe determined. The cost unit will be per ton handled at origin ordestination.
2.114 In the particular circunstances of particular railways,other terminal costs may arise, and costs that do not vary with lengthof haul, as follows:
(i) Collection--per ton
(ii) Delivery--per ton
(iii) Port charges--per car (This charge arises where theport authority provides locomotives andother facilities in the port area andcollects a fee from the railway inconsideration thereof.)
(iv) Repacking of LCL traffic--per ton (On some railways anumber of stations in a particular areamay dispatch partly loaded cars to acentral point where they are repakeedaccording to destination station and re-forwarded as fully loaded as possible.)

(v) Transshipment--per ton (This expense arises at break-of-gauge stations on railways operatingover more than one gauge.)
2.115 Turning next to line-haul costs, i.e., those costs whichfluctuate according to the distance the goods are carried, the units-;o which the costs are related are clearly indicated, and the numberof output units of each category will be readily ascertainable fromoperating statistics. The unit costs so calculated will provide thebuilding blocks with which to construct the long-run variable costs ofcarriage of specific commodities according to their loadability and totheir varying lengths of hav.l. The unit cost in each case will be anaverage for the specific function, calculated on an all-line basis oron a sectional basis, as may be considered more appropriate (see para.2.01).
2.116 To enable the unit costs to be updated more ea:4ily theyshould be divided between labor, material, fuel, general expenses,depreciation and interest charges in the manner shown in Appendix I.Costs so analyzed may be adjusted from time to time to take account ofchanges in wages and material price levels. By further adjusting themfor anticipated increases in prices they become invaluable tools forprojecting future operating expenses.
2.117 In the process of determining the long-run variable cost ofcarrying a specific traffic it may be found that, in order to simplifythe calculation, two or more of the unit costs may be amalgamated.Freight car-km and freight car-day costs must, however, always be calcu-lated separately and specifically. The two reasons for this are (a)because on many railways some or all of a particular traffic may becarried in private owners' or foreign railwuays' cars, the repair andcapital costs of which are borne by the owners, and (b) there may besubstantial cost variations between different classes of the railway'sown cars--e.g., tank cars, hopper cars, livestock cars, boxcars,gondolas--each of which should be costed separately.
2I.118 The remainder of line-haul costs consists of track, locomo-tive, and train costs. In developing countries the scarcity of fundsfor investment usually means that equipment availability should neverbe much greater than adequate to handle the traffic offering and that,at least in the direction of greater traffic flow, each locomotive shouldbe loaded as nearly as possible to maximum permissible capacity for theparticular section of the line over which it is to operate. Thissituation, which would be the general rule rather than the exception,provides a convenient basis for simplifying the calculation of costs

-that vary in relation to train, locomotive, and gross ton-km. Assuming,as an example commonly encountered, that thte direction of greater trafficflow is from inlanLd areas of agricaltural, forestry, and mining produc-ticn Lo tne ports, then the total .Vreigat tri-hm will be governed by.ne average capacity, in terms of gross tr^ailing tons, of t'he locomo-ivesavailable to move traffic to the ports. In othar words the unit thatexplains the variability of trairn, locomotive, and track costs is thegross trailing ton-km in the direction of greater flow. If, for example,the tare weight of each boxcar is 16 tons, then line-haul costs (exclu-dcing car costs) will be the same (within measurable linits) for one car.Loaded with 40 tons of traffic as for two cars each loaded with 12 tons.ln each case the gross load is 56 tons. Therefore, if all train, loco-motive, and track costs are totaled and divided by gross trailing ton-kri,.i unit cost is derived that will give full weight to loadability and willsubstantially reduce the number and complexit of cost cal culations. Toshow how the unit cost per gross trail-ing ton-kn may be applied inrmeasuring the cost differential per net tcn-lzn a niuber of hypot'heticale-.amples are presented in Table 2.3.
Table 2.3
C(MPARIs0N OF COSTS OF CARRYING MCI4ODITIES OFVARYING LOADABILITY
(Assumed line-haul costs (excluding car costs) per gross trailington-km, 0.226 cents, as calculated in Appendix G)
Aluminum Hides andi tem hollow ware skins (dry) Groundnuts
Freight-car capacity, tons 35.0 35.0 35.0Loadability, tons 3-5 765 35.0Freight-car tare weight, tons 16.0 16.0 16.0Gross weight per car, tons 19.5 23.5 51.0iatio of gross to net tons 5.57 3.13 1.46Line-haul, cost per net ton-km,
cents 1.26 0.71 0.33
2.119 If statistics of train and traffic density are maintainedseparately for each section of the railway system, it then becomes a sim-ple process to calculate specific costs for each section in eachdirection, as in the hypothetical cases presented in Table 2.4.
52

Table 2.4
FREIGHT LINE-HAUL COSTS (aCCLUD.LNG CAR COSTS)BY SECTION AND DIRECTION
Section A-B Section B-CItem 6C 0 km 300 Ian
(mainline) (branch)
Up Down Up Down
Average net trainload, tons 240 L80 150 300Ave rage gross trainload, tons 510 750 350 500Average gross load (including
locomotives), tons 600 840 430 580Cost per train-kmLocomotive costs, dollars 0.721 0.721 0.721 0.721Train costs, dollars 0.322 0.322 0.322 0.322Track costs, dollars 0.348 0.487 0.249 0.336
Total, dollars 1.391 1.530 1.292 1.379
Cost per gross trailing ton-kzm,cents 0.273 0.204 0.369 0.276
2.120 With these unit costs per gross trailing ton-lm thecalculation of locomotive, train, and track costs per net ton andper net ton-km can then be effected in one operation instead ofthree separate calculations. For example, let it be supposed thata boxcar of 16 tons tare weight is used to carry 35 tons of groundnutsfrom C to A and on the return journey to carry 15 tons of textiles fromA to C. The calcalation of line-haul cost (excluding freight-car costs)would be as shown in Table 2.5.
53

Table 2.5
FHiiGtfT LI.NE-HAUL COST6 (.KxCLUD::IG CAP, CUSTS)FŽR $FECiFIC CFc Xi(DT=S5
Items Groundnuts Texutiles
Net carload, tons 35 15Gross load, tons 51 31Aross ton-km1.ainline 30,600 (down) 18,600 (up)-3ran ch 15,300 (domm) 9,300 (up)
Line-haul costL'ain*' i' e, c1 o.lLars 6 .L2 50.78
3ranch, dollars 42.23 34.32
Cost per carload, dollars 'G4.65 85.10
Cost per net ton, dollars 2.99 5.67
2.121 For the sake of simplicity it has been assumed in the fore-go4ng examples that traffic, -n terms of carloads, is evenly balanced;in other uords, that there is no empty haulage of cars. This is anoversimpliciation of the general situation. In the great majority ofcases some haulage of empty cars will be involved, before or after theloaded haul. The use of the gross trailing ton-k-m unit of costs isdesigned to cover the cost of empty haulage, but it can do this only ifthe amrcunt of empty haulage involved in the mLovement of a specificconsignment or comrmodity can be assessed with reasonable accuracy. Onrailways maintaining origin and destination statistics of carloads andtonnages received at or dispatched from each station to all otherstations on the line, the balance or imbalance of any particular flowof traffic can be accurately assessed. Unfortunately such detailedinfonmation is not generally available. Therefore in the majority ofcases some difficulty will arise in determining the amount of emptyhaulage directly related to the movement of a particular commodity,except avhen such commodity requires the use of specially constructedcars. The movements of special cars, loaded and empty, can be determninedby analysis of operating statistics. Normally, 100 percent empty returnnaulage of specialized cars will be involved, although in certaininsta.nces freight cars designec particularly for-one traffic may be

adapt.ed to other uses, e.g., livestock cars for carrying kola nuts,or coal hopper cars for gypsum and limestone to cement and steel works.The major part of the vehicle fleet will, however, be open for coveredfreight cars designed for the carriage of a wide variety of generalgoods.
2.122 Nearly always it will be found that the volume of trafficin one direction measured in terms of carloads over the whole railwayor any part of it will exceed the vclume in the opposite direction andthat the direction of greater flow may change from season to season.it will also be found that, even where there is a marked imbalance oftraffic, resulting in a high proportion of empty haulage in the direc-tion of less traffic volume, there will always be a proportion of emptyhaulage in the direction of greater flow. This may be caused by anumber of factors, such as the reluctance of shippers of export produceto accept on the back-haul during the rainy season open cars that havebeen used on the forehaul for the carriage of such iterms as stracturalsteel, pipes, etc., or the arrival of large quantities of, say, materialsfor road construction at wayside stations with little to export. Afurther factor making a realistic appraisal of empty haulage costs _difficult is that, when the number of freight cars arriving under loadat a particular station is far in excess of the demand for cars to cleartraffic origina±Ang at that station, there is a tendency to reload themto less than capacity on the return journey in order to speed up turn-around and get the cars back quickly to areas where they are moreurgently needed. The resulti may be, therefore, that although there isno noticeable increase in empty car-km there is a significant drop inthe average carload.
2.123 For general rate-fixing the best practical solution will befiist to take the statistics of freight car-km, loaded and empty, upand down, on each of the main sections of the railway. Then extractfrom them those figures referring to specialized commodity car movementsin both directions, loaded and empty, and the movements of standard-typecars allocated to the transport of specific commodities (e.g., boxcarsfor the distribution of cement from a large manufacturing plant). Fromthe remainder calculate the proportion that empty car-km in one direc-tion bears to the loaded car-km in the opposite direction. This propor-tion should thenbe assumed to represent the average empty return haulageinvolved in the transport of all commodities other than those for whichmore specific data are available.

,. .;ilte rnatiely, it 1wi1l f recuently De found that, by-:csv tzg the i.oundtrip of a typical train or type of train employed on
-. rzuc.ilar section of the railw,ay,, a sound basis can be established2cr detenrining 'he ratio and the cost of mptr ha-alag-e involved in,he movement of traffic in eitler directio2L. An a second stag-e thecosr, of enipty ha-ulage cen 'oe allocated to each cor,.odity carried over.he secuion according to the type of car used for ivs carriage and-he suitabil4ty of such cars for the speci-'ic cormmodites carried onthe back-haul. To illustrate the method an example is presented inTables J1 and J2 of Appendix J.
A. FREIGhT TRA.FKEC--CCIM4ODITY COSTS
2.125 Epty return haulage will influence both freight-car andline-haul costs in the final calculation of the overall cost of carly-.nlg indi-v*id co.r;modi.t: es. A suggested form, of Traffic Cost Sheetis given in Appendix K to indicate how this and all other factorsorev-iously considered mright. be applied in arriving at the total variablecost of transporting individual ccmmodities in carload lots. A secondcos t sheet for trainload traffic (in "block" or "unrit" trains) issuggested in Appendix L. To complete the series of cormmodity costcalculations a pro forr.a cost sheet to determine costs at any lengthof haul for a particular cormnodity is shown in Appendix M. The figuresproduced by this calculation will provide the mrinimum basis for a ratestructure for the commodity under consideration.
G. PASSENGER TRAIN C'OSTS
2.126 The methodology for assessing the long-run variable costof passenger train operation has been outlined concurrently with thediscussion of freight terminal and line costs. The pro forma analysisof historic cost and its adjustment to take account of future priceincreases are shown in Append x C, Table Cl, and a summary of costsrelated to functions is presented in Table 2.1. Now it is necessaryto adjust costs to take account of projected traffic growth and techno-logical change. In the hypothetical case that has been adopted forpurposes of illustration, passenger traffic in terms of passenger-kmis expected to increase at a rate of about 2½ percent per annum, andit is assumed that the additional traffic can be carried by existingservices. The only major change 'Likely to affect costs will be thecomplete phasing out of steam haulage of passenger trains. The appro-priate adjustment of long-run variable costs of passenger trainoperation, including interest charges on capital, is made in Section Iof Appenzdix N.
56

2.127 Insofar as passenger train operation is concerned theobjective of the costing exercise is to separate long-run variable costsbetween passenger travel of each class and between mail and expressservices. Certain costs can be allocated directly to individual services,e.g., provision and maintenance of cars (first, second, and third class,express, and mail) or sleeping car attendants (first class only), butmany costs are common to some or all of the services. A logical basiSfor allocation of such costs must be established. Locomotive costs, forexample, are common to all services, and the most equitable basis fortheir allocation would appear to be on a car-km basis or, if there aremajor variations in the weight of cars designed for particular services,on a gross trailing ton-km basis. As a geneial rule, however, the loadshauled by passenger locomotives are well within their maximum capacity,and a car-km division of locomotive costs has the advantage of simplicity.The cost of guards and conductors would also seem most logically to besesarable between services on the basis of car-km, as their duties andresponsibilities extend to the safeguarding of the whole train. Ticketcollectors and examiners on the other hand should be cnarged againstpassenger travel only and separated between classes of travel proratedto passengear-km of each class. Track costs should be divided in pro-portion to car-km or, if there are significant weight variations betweencars for different purposes, in proportion to gross trailing ton-km.
2.128 After track, train, and locomotive costs are allocated toeach of the categories of cars on the trains, the problem remains ofallocating the cost of those cars which are provided for the common andjoint benefit of more than one service, e.g., brake and baggage vans andrestaurant and canteen cars. Brake-van (caboose) costs are incurredfor the general safeguarding of the train and should most logically beallocated in proportion to directly allocable car-km in each service(passenger, mail, and express). Baggage vans are provided for passengerservice only, and their costs should be separated between classes oftravel prorated to passenger-km, weighted in proportion to the baggageallowance for each class of travel prescribed in the tariff. Insofaras the provision of restaurant cars is concerned, experience indicatesthat in developing countries lower-class travelers prefer to take theirfood with them or to buy it from vendors at stopping stations. Restau-rant car facilities are utilized only by upper-class travelers, and thecost of the cars may be allocated accordingly. Many railways providecanteen cars that cater for the needs of lower-class travelers, althoughthese cars may also be patronized by first- and second-class passengers.Costs should be allocated on the basis of dependable observation ofexperienced catering or operating personnel. In this connection it isnormal practice to maintain a separate account for catering receipts and
57

expenses on trains, but in all knowr cases catering expenses in thiscontext exclude the provision and operating costs of restaurant andcanteen cars. In other words they comprise only the cost of providinganci se;^vicing meals, refreshrments, drinks, and other associated services.The profi- or loss on catering serv-ices should be taken as a credit ordeoit to the costs of car operation before the lac.ter costs are allocatedto the appropriate class or classes of -travelers who use themi. In thiscontext it is assumed that restaurant and canteen cars are provided forthe convenience of passengers, as part of the service that attractspassengers tc rail, and that the cost oI' providing them should becovered by revenue from fares, rather than from meals and refreshments.To attempt to recover car provision and operating costs through theprice of meals and refreshments would doubtless inflate prices to alevel that would effectively extinguish demand.
2.129 A pro forma allocation of passenger train costs is shown inAppendi d . Is .
H. REFINSMENT OF THE CUSTING SYSTrEM-
2.130 Having determined functional unit costs on an all-line basis(or on a regional basis to the extent that statistical and accountingdata will allow) the costing office should next concentrate on a studyof variations in costs as between individual sections, stations, andyards. This will entail special studies of local conditions of operation,yard layouts, train schedules, seasonal demand, traffic flows, and otherconsiderations. A primary objective should be to ensure that, wheresignificant variations from average costs occur, these are not due toinefficiency or inadequate cost control.
2.131 AL interesting problem is raised, for example, by trafficoriginating at, or destined to, wayside stations. A method of assessingthe cost of shunting such traffic has been suggested in paras. 2.80 and2.8h, and this will be representative of the cost incurred if the trafficin and out of the station is reasonably constant and evenly balanced.Where, however, underload running is involved from or to the nearestmarshaling or remarshaling point a more complicated costing exercisemust be carried out. The evaluation of the cost of underload trainoperation should presumably be based on a comparison of the gross train-load, before traffic has been set down or after it has been picked uxpat the station in question, with the average trainload in the samedirection on days when no traffic is consigned to or from the stationin question. The application of the unit cost per gross trailing ton-Ian(as calculated in the example in Table 2.)4) to the resultant difference

in the trainload should indicate the cost of' undarload running relevantto the carloads and tonnage picked up or set down at the station inquestion.
2.13 The foregoing example is presented to indicate tnat theproblems involved in traffic costing can be solved by analysis of thecirciunstances on the railway. If the cost analyst knows his railwaywell he should have no difficulty in solving the problems raised byany combination of circumsetances relative to any particular trafficmovement.
2.133 Projected costs should be continuously compared with actualcosts and the causes of variations should be determined and analyzed.These causes may be:
(i) A simple over- or underestimation of wages and materialprice increases in the cost projection.
(ii) Cost variability proving to be greater or less thanprojected. It may be that costs assumed to be 100percent variable contain in fact an element of fixedcost, e.g., in the case of workshops repair ofequipment, or that the causes of variability aremore complex than had been assumed. Here regressionanalysis may enable the derivation of a formula thatwill best explain variability and provide reliableprojections. The combination of such techniques withthe use of the computer will produce dependableresults more rapidly. Extreme refinement should notbe attempted until reasonably accurate costs have beendetermined and their character and application is fullyappreciated.
(iii) Actual costs having been inflated by deviations fromoperational performance projected or lack of adequatecost control. In this context the figures evolved bythe traffic costing section could be used to identifyunnecessary expense in the form of excessive use ofmaterial or expansion of the labor force.

Chapter -- II
U NE'C ON -Ci C Ll; A_D Sz E.ICs$
301- ln this context the observaticns already made in paras.and 2.25 should be borne i-. nric-. Trhe cost analyst is concerned
h.ere *.ith avoidable or decremental cost, which will differ from long-run var,able cost in several ways, and particularly where common(Joint product) costs are concerned.
3.02 To illustrate this point, a study of the profitability orunprolitability of passenger train oparation is of interest. In thehypothetical case presented in Appendix N it will be seen that thefuture long-run variable cost of passenger train operation is estimated^t $26 million. Assume that total revenue from passengers, mail, ande:-ress services is e!xcec:ed to meet this cost and provide a maroinalcontribution to fixed costs, but that first-class passenger revenue isexpected to be only $3.6 million. This is compared with long-ravariable cost of providing the services, estimated at $5.3 million, asshown at the end of Appendix N. Consideration should of course firstbe given to an increase in fares, but, if these are already at a levelarbove wlich any further increase would merely turn away customers, itbecomes necessary to consider what the financial effect would be iffirst-class accommodation on trains were to be abolished. A majorsaving would resulti from, the elimination of maintenance and operationcosts of first-class passenger cars, and of restaurant cars, which areoften provided mainly for the benefit of first-class passengers. Ina.dditioon some savinon in track costs might be expected to result fromthe reduction in gross trainloads. However, locomotive costs wouldnot be affec-ted by the elimination of first-class cars, except to theextent of a small saving in fuel consumption. Similarly, train costswould be reduced only to the extent of sleeping car attendants and otherstaff specifically provided for first-class passengers. Guards,conductors, and ticket inspectors would continue to be employed whetherori not first-class service were to be continued. Locomotive, train,h)rake and baggage car and terminal costs are in effect joint productcosts that would be unaffected except to the minor extent mentionedearlier. 'The avoidable cost of the withdrawal of first-class servicewould therefore be:
60

Type of cost Amount, thousands of dollars
Track costs 731First-class car costs 1,504Restaurant car costs 640Locomotive costs (fuel only) 107Train costs (sleeping carattendants only) 103
Total 3,09*
* Plus or minus any loss or profit on restaurant carservices.
3.03 In this case (which is typical of experience on a number ofrailways) it will be seen that the withdrawal of first-class servicewould result in a reduction in the net revenue of the railway, althoughon any normal basis of allocation first-class revenues are substantiallybelow long-run variable cost. In such circumstances the continuation offirst-class travel can be justified only by applying the principle ofmarginal-cost pricing on the grounds that the primary purpose of runningthe trains is to carry the preponderan.t bulk of second- and third-classpassengers, together with mail and express traffic. Indeed, on manyrailways where the major part of the contribution to fixed charges andthe whole of the return on the investment ar- provided by freight traffic,maintenance of the passenger side of the business as a whole can bejustified financially only if it is accepted that the prime purpose ofthe railway is to move freight and that marginal-cost pricing of thepassenger service is therefore admissible. There are, of course, rail-ways where passenger traffic is predominant, and on some of these it hasbeen alleged that passenger traffic is profitable and that freighttraffic loses money. This statement is presumably based on "fullyallocated costs," fixed costs and overhead being distributed in somearbitrary manner. The costing of freight traffic on a predominantlypassenger-carrying railway should, however, be no different from thecosting of passenger traffic on a predominantly freight-carrying rail-way.The point is--what would be the savings to the railway if the servicewere to be discontinued?
3.011 The crucial test will come when the line, or any sectionof it, approaches saturation in terms of train paths. To avoid ordelay the large investment needed to increase line capacity, and theincrease in operating and maintenance costs the additional facilitieswould entail, the obvious course in the example quoted would be totake off first-class services, substitute additional second- and third-class cars, and proportionately reduce the number of passenger trains,thereby providing room for more freight trains. An actual example maybe cited of a railway where line capacity was nearing saturation andan emergency arose requiring a massive increase in freight movemant.
61

.-n increase of 100 percent in passenger fares nad the expected resultof halving the number of passerngers and the recuired number ofpassenger trains. Freight trair paths on the critical section of theline were increased boy 1r percent--a Grastic buu effective solutiontnat incidenta-ly resulted in a sigi`ficant 4mproveme.-nt in net earn-ings of the railway. Th7is fs, Gi course, a short-ran decision tomeet an unioreseer. emergency. The long-run solution must be based ona comparison of intermodal economic Oos us.
3.05 Consideration has so far been given to cases whereavoidable ccsts can be less than long-ran variable cost. In thestudy of the costs of specific sections of the railway the conversemay be true. In branch-line operation, costs Tiill include, inaddition to variable costs, the cost of maintenance of thie right ofway (grass cutting, tree felling, drainage, weeding, repairs to banksand cuttings, etc.), level crossing keepers, operation and maintenanceof signais and telecom"munications, bridg>e painting, building mainte-narnce, station staff, sanitation E d conservancy, and- many other costsso far classified under the heading of fixed cost. Reference to thepayrolls and accounting record of section officers should readilyprovide the information on which to determine the costi of all theseservices. The unit costs of train, car, and locomotive operation overthe line concerned will already be known. With these data and adequateoperating statistics for the branch line an accurate total cost ofoperation and maintenance should be available. This total cost, which,subject to certain constraints previously considered, will becomeavoidable cost should the branch line be closed, may substantiallyexceed any previously determined lona-run variable cost.
3.06 The next step should be to compare the cost of operatingand maintaining the line with the revenue earned from the carriage offreight and passengers over the line itself (i.e., excluding for themoment any consideration of the costs incurred and revenue earned onthe mainline from traffic originating on or destined to the branch-line).In this context the costs have been ascertained, but determination ofthe appropriate revenue attribut.able to the branch-line may be difficultif there is a sharp taper in the rate structure and the branch-line isdistant from the source or destination of traffic. In such cases itwould appear equitable to assess branch-line revenue at the averagerate per ton-hn for the complete haul. In the final outcome, however,the Justification for the line must inevitably be based on economicrather than financial considerations, and in this context costs aremore significant than revenue.
-.07 The origin ancl clestination on rail of all the traffic tofnH fr-m the branch line must be known in order that the revenue and
.s;tn o moving the traffic over the mainline of the railway may be
6?)'

c5alcLlated. In this context, revenue earned on the mainline should be'-icw-: from statistics. Costs should be calculated on the basis of2cn--nrn variable cost, in accordance with the formula proposed inlab7e . A considered judgment must then be made as to what proportionof the traffic to or from the branch line would remain on the mainlineif the branch should be closed.
3.08 'With these data the ef.ect on the rail^ay's finan.ees ofbrainch line closure can be calculated. However, even though -t may befiinancially advantageous to the railway to close the branch line, thecos..s of the alternative, e.g., constructing a new highway or upgradingan existing highway, together -ith the mraintenance and operating costsof road transport should be considered.
03

(Blank)

Cnapter IV
RATE-MAKING
4.01 To be economically justified, freight rates must be setbetween two limits. The lower limit is the cost of providing theservice, represented generally by long-run variable cost but in certainspecial cases by short-run variable cost. The upper limit is the costto shippers of equivalent service from some alternative mode of trans-port or, in the case of a monopoly, "what the traffic will bear" (seepara. 4.05). It is of the greatest importance to observe that, wherecoinmetition exists, the services to be compared must be equivalent.It may be that for a particular haul or traffic one or another of thealternative modes will have a service advantage, by way of superiorspeed, door-to-door delivery, safety from loss and damage, dependabletimes of arrival, etc. In order to assess the practicable limitswithin which a rate can be set, it will be necessary to quantify thevalue to the shipper of the relative advantages or disadvantages of thealternatives available to him.
4.02 It is probable that in the case of door-to-door service therailway suffers the greatest disadvantage. Whereas speed of transitand dependable arrival dates are of importance for high-value goods witha quick turnover, in the case of bulk exports it is probable that asteady, dependable flow of traffic from the producing areas to the portis of paramount importance. In the case of high-value minerals, suchas tin and copper, the railway may be able to offer greater security oftransit. The quantification of these and many other factors must enterinto the assessment of the limits within which rates may be set.
h.03 It cannot be stressed too strongly that in the context ofrate-making the only relevant costs are future costs, not historicalcos-ts. For this purpose it is suggested that future costs should bedetermined on the basis of the best technology available to the railwayand likely to be achieved within an appropriate time frame. To take asimple and frequently encountered example, where high-cost steam opera-tion is being converted to low-cost diesel operation, future costs forrate-making purposes may be based on dieselization in a relevant timeperiod. This, however, is a matter of commercial strategy. Thus thecosting would serve two concurrent purposes:
(i) Determination of system profitability after cost-reducing investment, i.e., finding whether trafficcould be handled profitably after investment in newtechnology.
(ii) Determining, by comparison with aggregate operatingcost of present technology, whether the indicatedinvestment is justified (see para. 2.107 for-example).

L .Oi4 Assuming that the railway is able to detemine it., own tariffs,.,es should oe set at the points between tne aforementioned limitsTha r, will maximize the contribution to fixed costs, and this implies thein;roduction of the principle of charging whnat the traffic will bear."t
Clearly there will be many commodities of comparable loadability that,at.thou,h their long-run variable costs of transport nay be very similar,ir.ay have widely different elastici`tie-s of demar.d. Taking, for example,tin, copper, lead, and zinc, either as reLined metals or concentrates, arate that might successful y be applied to tin or copper might, if appliedto lead and zinc, severely dampen or even extinguish demand if the haulfrom, mine to port should be very long. The cost of providing the servicemerely sets the lower limit and, although the long-run variable cost ofcarrying a number of cosnnodities may be the same. The objective of rate-m Xking should be to charge such rates above the rminimum of the relevant-an variable cost (keeping in view the competitive situation and elasticity
ot demand) that would, taking into account all traffic together, recover,he fixed costs and secure an adequate return on investment.
4.05 Estimating the volume of traffic that might move at ary givenzevel of rates and the effect on net income is a key aspect of pricing.This vital function should be primarily a managerial responsibility, sub-ject only to regulation as to maximuw rates and to legal rules against
unjust discrimination. In certain circumstances, however, it may be inthe overriding interests of the economy of the country that certain ratesshould be set so as to maximize the volume of traffic moved rather thanthe contribution to fixed costs. In general rates should not be belowthe apptopriate long-run or short-runi vari-able cost, except for soundeconomic reasons, wshen Government might provide specific subsidies.
4.06 The basic essentials for sound rate-making are therefore:
(i) Market research, writh the objective of assessingthe potential market for rail service.
(ii) A thorough knowledge of the characteristics of railservice and of railway costs.
(iii) Even more importantly, a thorough knowledge of theservice characteristics and costs of the railway'scompetitors.
66

APPENDICES
Page No.
A. Proposed Classification of Operating Expenses 68
B. Proposed Statistical Presentation 80Operating Statistics 85Traffic Statistics 98
C. Railway Traffic Costing of XYZ Railway, Convertingfrom Steam to Diesel Locomotives 109Table Cl. Pro Forma Analysis of Operating Expenses 109Table C2. Projected Statistical Data to 1974 113Table C3. Depreciation of Fixed Assets, 1970 114
D. Formula for Separation of Mainline Locomotive CrewExpenses Between Services 115
E. Formula for Separation of Mainline Locomotive Fuel ExpensesBetween Services 117
F. Interest Charges on Capital 118
G. Freight Traffic Unit Costs 119
H. Formula for Calculating Carload Shunting andMarshaling Costs 120
I. Analysis of Freight Traffic Unit Costs 124
J. Empty Return Haulage Costs and Commodity Costs fromAverage Round-Trip Costs 125
K. Freight Traffic Cost Sheet for Carload Traffic 128
L. Freight Traffic Cost Sheet for Trainload Traffic 130
M. Freight Traffic Cost Sheet for Calculation ofLong-Run Variable Cost at Varying Lengths of Haul 132
N. Pro Forma Separation of Costs of Passenger, Mail andExpress Traffic 133
0. Analysis of Long-Run Variable Costs for a Railway -an Actual Case, 1971 136
67

Appendix A
PROPOSED CLASSIFICATION OF OPERATING EXPENSES
iOT_: Under each primary head of expense three subheads should bemaintained for staff costs, materials, and general expenses,resoectively. Heading numbers do not correspond to paragraphnumbers in text; there is no relation.
I Maintenance of Way and Works
(Civil Engineering Department)
1.01 Superintendence (Civil engineers, draftsmen, quantity surveyors,and the like, and their office staff)
Maintenance of Permanent Way
1.02 Supervision (inspectors and foremen)
1.03 Irack maintenance--labor
1.04 Maintenance of roadbed and right of way--labor
1.05 Rails
1.06 Sleepers
1.07 Ballast
1.08 Other track material
1.09 Maintenance of track machinery
1.10 Small tools and supplies
1.12 Depreciation, write-off, and amortization of track-
Maintenance of Works
1.20 Supervision (inspectors and foremen)
1.21 Bridges, culverts, and tunnels
1.22 Offices, stores depots, and general buildings
1/ On many railways depreciation of all fixed assets, including track,is segregated in a separate head of account at the end of theclassification of operating expenses.
68
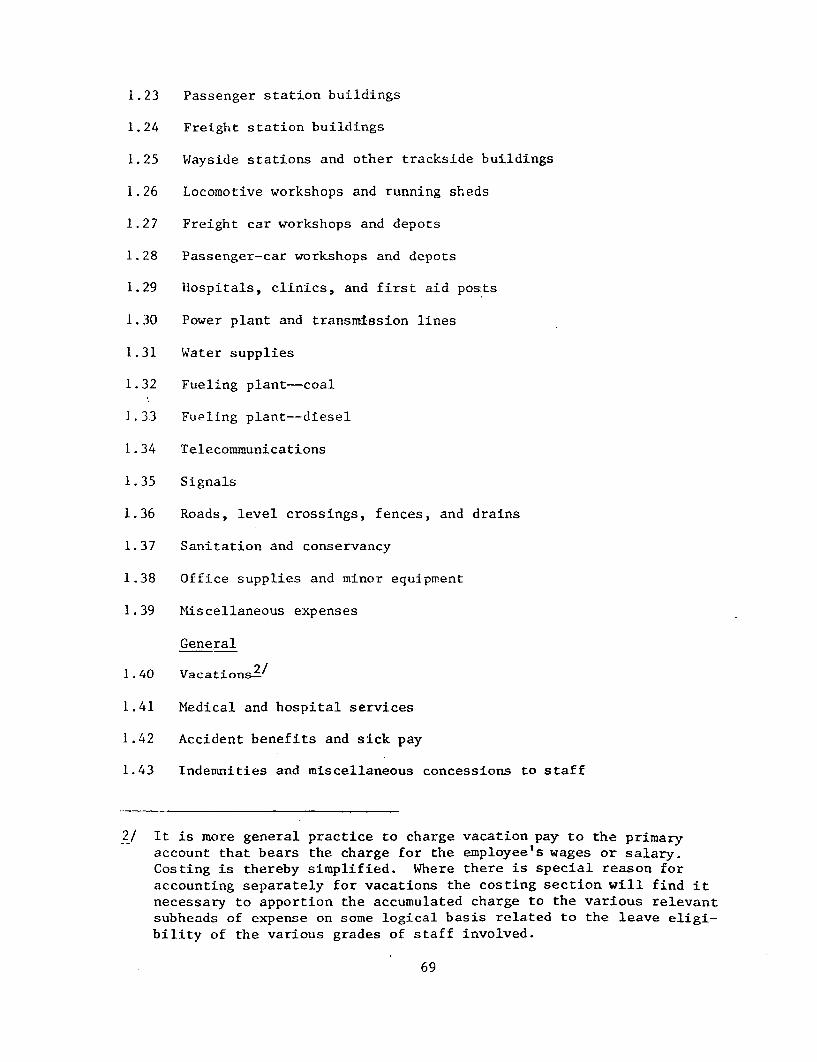
1.23 Passenger station buildings
1.24 Freight station buildings
1.25 Wayside stations and other trackside buildings
1.26 Locomotive workshops and running sheds
1.27 Freight car workshops and depots
1.28 Passenger-car workshops and depots
1.29 Hospitals, clinics, and first aid posts
1.30 Power plant and transmission lines
1.31 Water supplies
1.32 Fueling plant--coal
1.33 Fueling plant--diesel
1.34 Telecommunications
1.35 Signals
1.36 Roads, level crossings, fences, and drains
1.37 Sanitation and conservancy
1.38 Office supplies and minor equipment
1.39 Miscellaneous expenses
General
1.40 Vacations2/
1.41 Medical and hospital services
1.42 Accident benefits and sick pay
1.43 Indemnities and miscellaneous concessions to staff
2/ It is more general practice to charge vacation pay to the primaryaccount that bears the charge for the employee's wages or salary.Costing is thereby simplified. Where there is special reason foraccounting separately for vacations the costing section will find itnecessary to apportion the accumulated charge to the various relevantsubheads of expense on some logical basis related to the leave eligi-bility of the various grades of staff involved.
69

Ii Equipment Maintenance_!
(Mechanical Engineering Department)
2.01 Superintendence (mechanical engineers, works superintendents,and the like, and their office staffs)
2.02 Locomotives--Steam--Mainline
2.03 Locomozives--Steam--Yard
2.04 Locomotives--Diesel--Mainline
2.05 Locomotives--Diesel--Yard
2.06 Locomotives--Electric--Mainline
2.07 Locomotives--Electric--Yard
2.08 Railcars--powered units
2.09 Freight cars--workshops repairs
2.10 Freight cars--line maintenance
2.11 Passenger cars--workshops repairs
2.12 Passenger cars--line maintenance
2.13 Railcar trailer units--workshops repairs
2.14 Railcar trailer units--line maintenance
2.15 Ballast cars
2.16 Business and inspection cars
2.17 Other works equipment
3/ This Classification of Expense assumes an organization under whichthe Mechanical Engineering Department is responsible for workshopsmaintenance of locomotives and workshops and line maintenance ofpassenger and freight cars. Running shed maintenance of locomotivesis the responsibility of the operating, i.e., Transportation Department.
70

2.18 Depreciation, wit rawal, and amortization of locomotives
and rolling stock-
2.19 Workshops machinery
2.20 Power plant machinery
2.21 Wlater supply machinery
2.22 Depreciation, withdrawal, and amortization of machineryk
2.23 Office supplies and minor equipment
2.24 Miscellaneous expenses
'.2' VacationsA/
2.26 Medical and hospital services
2.27 Accident benefits and sick pay
2.28 Idemnities and miscellaneous concessions to staff
4/ See footnotes to Maintenance of Way and Works.
71

i1.1 Traffic
(Co-mnerc::al Department)
3.01 SuDerintendence--freight
3.02 Superintendence--passenger
3.03 Co-mmercial agencies--freight
3.04 Commercial agencies--passenger
3.05 Publicity--freight
3.06 Publicity--passenger
3.07 Market research--freight
3.08 Market research--passenger
3.09 Office supplies and minor equipment--freight
3.10 Office supplies and minor equipment--passenger
3.11 Miscellaneous expenses--freight
3.12 Miscellaneous expenses--passenger
3.13 Vacations--freight-/
3.14 Vacations--passenger5/
3.15 Medical and hospital services--freight
3.16 Medical and hospital services--passenger
3.17 Accident benefits and sick pay--freight
3.18 Accident benefits and sick pay--passenger
3.19 Indemnities and miscellaneous concessions to staff--freight
3.20 Indemnities and miscellaneous concessions to staff--passenger
5/ Soo footnote 2/ to Maintenance of Way and Works.
72

IV Transportation
(Operating Department)
(See note under heading II Equipment NMaintenance)
4.01 Superintendence (all grades above statioranaster or agent,
locomotive running shed foremen, and the like, and theiroffice staffs)
4.02 Train dispatchers
4.03 Station staff--passenger
4.04 Station staff--freight
4.05 Station staff--common passenger/freight operations
4.06 Station supplies
4.07 Yard staff--passenger
4.08 Yard staff--freight
4.09 Yard locomotive crews--steam--passenger
4.10 Yard locomotive crews--steain--freight
4.11 Yard locomotive crews--diesel--passenger
4.12 Yard locomotive crews--diesel--freight
4.13 Yard locomotive crews--electric--passenger
4.14 Yard locomotive crews--electric--freight
4.15 Yard locomotive fuel--steam
4.16 Yard locomotive fuel--diesel
4.17 Yard locomotive power--electric
4.18 Yard locomotive water--steam
4.19 Yard locomotive water--diesel
4.20 Yard locomotive lubricants--steam
4.21 Yard locomotive lubricants--diesel
4. ' Yard locomotive lubricants--electric
73

4.23 Sundry materials for yard locoino-ives--steam
4.24 Sundry materials for yard locomo.ives--diesel
4.25 Sundry materials for yard locomotives--electric
4.26 Running shed repairs, yard locomotives--steam
4.27 Running shed repairs, yard locomotives--diesel
4 28 Running shed repairs, yard locomotives--electric
L'4.29 Sundry materials for yard oreration
4.30 Mainline locomotive crews--steam--passenger
4.31 Mainline locomotive crews--steam--freight
4.32 Mainline locomotive crews--steam--mixed
4.33 Mainline locomotive crews--steam--departmental
4.34 Mainline locomotive crews--diesel--passenger
4.35 Mainline locomotive crews--diesel--freight
4.36 Mainline locomotive crews--diesel--mixed
4.37 Mainline locomotive crews--diesel--departmental
4.33 Mainline locomotive crews--electric--passenger
4.39 Mainline locomotive crews--electric--freight
4.40 Mainline locomotive crews--electric--mixed
4.41 Mainline locomotive crews--electric--departmental
4.42 Mainline locomotive crews--railcars
4.43 Mainline locomotive fuel--steam--passenger
4.44 Mainline locomotive fuel--steam--freight
4.45 Mainline locomotive fuel--steam--mixed
4.46 Mainline locomotive fuel--steam--departmental
4.47 Mainline locomotive fuel-diesel--passenger
4.48 Mainlinte locomotive fuel--diesel--freight
74

4.49 Mainline locomotive fuel--diesel--mixed
4.50 Mainline locomotive fuel--diesel--departmental
4.51 Mainline locomotive power--electric
4.52 Railcar fuel
4.53 Water for mainline locomotives--steam
4.54 Water for mainline locomotives--diesel
4.55 Lubricants for mainline locomotives--steam
4.56 Lubricants for mainline locomotives--diesel
4.57 Lubricants for mainline locomotives--electric
4.53 Lubricants for railcars
4.59 Sundry materials for mainline locomotives--steam
4.60 Sundry materials for mainline locomotives--diesel
4.61 Sundry materials for mainline locomotives--electric
4.62 Sundry materials for railcars
4.63 Running shed repairs, mainline locomotives--steam
4.64 Running shed repairs, mainline locomotives-diesel
4.65 Running shed repairs, mainline locomotives--electric
4.66 Running shed repairs, railcars
4.67 Train crews--passenger
4.68 Train crews--freight
4.69 Train crews--departmental
4.70 Restaurant, canteen, and sleeping car attendants
4.71 Sundry train materials-passenger
4.72 Sundry train materials-freight
4.73 Sundry train materials--general
4.74 Signalmen and level crossing keepers
75

4. 75 Telecomrmunica.ions
4.76 General office expenses
&.77 Miscellaneous expenses
4.78 Derailments and accidents
4.79 Claims and losses--passengers and baggage
4.80 Cla:Ims and losses--freight
4.81 Vacations-6/
4.82 Medical and health services
4.83 Accident benefits and sick pay
4.84 Indemnities and miscellaneous concessions to staff
6/ See footnote 2/ to Maintenance of Way and Works.
76

V Express
(Parcels, Collection, and Delivery Services)
5.01 Superintendence
5.02 Booking and handling staff
5.03 Commissions
5.04 Train staff
5.05 Operation of equipment
5.06 Maintenance of equipment
5.07 Depreciation and withdrawal of equipment-7/
5.08 Office supplies
5.09 Claims
5.10 Miscellaneous charges
5.11 Vacations8/
5.12 Medical and health services
5.13 Accident benefits and sick pay
5.14 Indemnities and miscellaneous concessions to staff
7/ See footnote 1/ to Maintenance of Way and Works.
8/ See footnote 2/ to Maintenance of Way and Works.
77

vi Administration DEpartrr.ent
The form of this abstract or classification should be designed in
such detail as besc suits the need of the administration concerned.It may, for example, be desired to separate the different depart-
ments, e.g., general management, finance, purchasing and store-
keeping, personnel, etc. Che following list is suggested as a
minimum.
6.01 Officer grades
6.02 Office staff and workmen
6.03 General office expenses
6.04 Data processing
6.05 Audit
6.06 Legal
6.07 Police
6.08 Traini:Lg
6.09 Welfare
6.10 Maintenance of motor vehicles
6.11 General charges
6.12 Vacations-:-
6.13 Medical, hospital, and health services
6.14 Accident benefits and sick pay
6.15 Indemnities and miscellaneous concessions to staff
9-/ See footnote 1/ to Maintenance of Way and Works.
78

VII Pensions, Gratuities, and Provident Fund
7.01 Pensions
7.02 Gratuities
7.03 Provident Fund
7.04 Other retirement benefits, not accounted for elsewhere
79

Appendix B
PROPOSED STATISTICAL PRESENTATION
The determination of traffic cost is often made more difficultby inadequate statistics of operating standards, equipment utiliza-tion, and traffic patterns and flows. The problem may ba furthercomplicated by confusion as to the meaning of certain statisticalterms, for example, train locomotive-hour and train-hour. ThFe follow-ing list has been prepared as a guide to the optimum provision of datasuitable generally for traffic costing purposes and also as a test ofoperating performance and efficient equipment utilization. Definitionsare included where experience has shown that doubt exists regarding theinterpretation of certain statistical tenns.
The value of statistics depends on their quick and regular pre-sentation. The objective should be to complete then within the monthfollowing that to which they refer. They should provide comparativefigures for the various regions, divisions, districts, or sections ofthe railway's organization, so that regional differences might beclearly indicated and corrective action be taken where necessary.Distribution of statistics should therefore be wide enough to reachall supervisory officers on the line to enable them to assess therelative effectiveness of their efforts and to engender a competitivespirit between regions. Statistics should be concise but in suffi-cient detail to indicate suddan changes or definite trends in operat-ing and traffic characteristics. Determination of the detailed causesof such variations may well require reference to supporting data inthe statistical office but the fact of their existence should beestablished by the summnary presentation, which, it is suggested, mighttake the following form:*
A. Operating Statistics
1. Definitions
1.01 Train
1.02 Light locomotive
* The outline presented is also a complete table of the contents ofthis appendix.
80
1.03 Passenger train
1.04 Mixed train
1.05 Freight train
1.06 Departmental train
2. Basic Statistics
2.01 Train-hours
2.02 Locomotive-hours
2.03 Locomotive-lat
2.04 Net and gross trailing ton-km
2.05 Train-km
2.06 Vehicle-km
2.07 Passenger-km
2.08 Number of freight vehicles loaded
3. Derived Statistics
3.01 Train-km per train locomotive-hour
3.02 Train-km per train-hour
3.03 Freight net t6n-km per train locomotive-hour
3.04 Freight net ton-km train-hour
3.05 Gross trailing ton-km per train locomo-tive-hour
3.06 Net freight trainload
3.07 Gross trainload
81

3.08 Ratio of gross trailing ton-km to netton-kmn, freight traffic only
3.09 Average number of vaehicles per train
3.10 Percentage loaded to total freightcar-km
3.11 Average load per loaded freight car
3.12 Average number of seats and passengersper train, and seat occupancy ratio
B. Traffic Statistic;3
4. Basic Statistics
4.01 Commodity tomnages, net ton-km, andrevenue statistics
4.02 Revenue-earning and service traffic
4.03 Number of passengers and passenger-km
5. Derived Statistics
5.01 Average length of haul
5.02 Average revenue per ton-km
5.03 Average passenger journey
C. Equipment Utilization Statistics
6. Basic Statistics
6.01 Locomotives in stock, under repair,and in use
6.02 Freight cars in stock, under repair,and in use
6.03 Passenger cars in stock, under repair,and in use
82

6.04 Locomotive failures
6.05 Freight car hotboxes
6.06 Passenger car hotboxes
7. Derived Statistics
7.01 Locomotive-km per day per mainlinelocomotive in stock
7.02 Locomotive-km per day per mainlinelocomotive in use
7.03 Locomotive-hours per day per mainlin6locomotive in use
7.04 Percentage of locomotives under orawaiting repair
7.05 Locomotive availability and utilizationratios
7.06 Locomotive-km per locomotive failure
7.07 Percentage of freight cars under orawaiting repair
7.08 FrAight car-km per freight car-day
7.09 Net ton-km per freight car-day
7.10 Freight-car turnaround days
7.11 Number of hotboxes per million freightcar-km
7.12 Percentage of passenger cars under orawaiting repair
7.13 Passenger car-km per vehicle-day
7.14 Number of hotboxes per million passengercar-km
83

D. Staff Statistics
8. Basic Statistics
8.01 Number of men enployed
8.02 Staff costs
9. Derived Statistics
9.01 Productivity in traffic units perman en-ployed
9.02 Staff costs per man employed
9.03 Indices
E. Fuel and Lubricant Statistics
10. Basic Statistics
10.01 Fuel consumption and cost
10.02 Lubricant consumption and cost
11. Derived Statistics
11.01 Fuel consumption and cost per locomo-tive-km
11.02 Fuel consurption and cost per 1000 grosstraining ton-km
11.03 . Lubricant consumption and cost per 100locomotive-km
F. Miscellaneous Statistics
12.01 tmwnber of consigments
12.02 Number of freight cars shunted
12.03 Other statistics

A. OPERATING STATISTICS
1. Definitions
1.01 TraiLn. A train consists of a conventional locomotiva attachedto one or more freight- or passenger-carrying vehi cles, with or withoutbrake van. In the case of passenger railcars, a single powered-carwith passenger accommodation is th3 snallest train unit.
1.02 Light locomotilve. A light locomotive is a locomotive zrmningwith or without brake van but with no passenger or freight-carr-irngvehicle attached.
1.03 Passenger train. Any tra-n booked in the Working Timetable tospecifically as a passenger train shall be allocated in the basicstatistical data to passenger service. in the event o 7reight orrailway service vehicles being attached to passenger tra-ns, the finalanalysis should reallocate passenger train-km and hours to passenger,freight, and departmental service in proportion to the vehicle-l-n runon passenger trains for the benefit of each respective service.
1.04 Mixed train. Any train booked in the Working Timetable to runas a mixed passenger and freight train should be allocated in the basicstatistical data to mixed service. In the final analysis Lmixed train-km and hours should be reallocated to passenger, freight, and departmnentalservices in proportion to the vehicle-km run on mixed trains for eachrespective service. This formula should be adopted only for generalcosting purposes and is only valid for application in tne costing ofspecific trains on those railways where in the normal course there issufficient freight traffic available to make up all mixed trains to thepermissible, or at least average, load for the particular class oflocomotive used. On most railways it will be found that mixed trainsare run on sections where passenger demand is too small to justify anentire passenger train and where there is occasional, but possibly small,freight traffic. When costing such services, freight costs should moreappropriately be calculated on the basis of the marginal cost of addingeach freight vehicle up to the maximum permissible load of thelocomotive.
1.05 Freight train. Any train run specifically for the carriage ofpublic freight. Freight trains will on occasion carry vehicles loadedwith railway service traffic. In the final analysis freight train-lmoand hours should be reallocated to freight and departmental servicesin proportion to the vehicle-km run on freight trains for each respectiveservice.

1.06 Departnental train. Any train run exclusively for railwayservice, e.g., ballast train, breakdown train, or train loaded exclu-sively with railway fuel or materials. On many railways the train-kmand locomotive-km run by ballast trains are calculated at some nominalprescrioed rate, say 15 kph for each hour durin whic1h thi train is insection. This somewhat arbitra-ry metho6 can be misleading, as on manyoccasions the traLi will be stationary at ballast quarry or on the siteof reballasting. On railways where such a 'asis is used, train-hoursor locomotive-hours, where appropriate, afford more depandable costingunits than train-km or locomotive-kRm.
2. Basic Statistics
2.01 'rrain-hours. A period of 1 hour during- which a train is on line,the total hours to count from the time the train starts from itsoriginating station to the time it comes to a stop at its destination,but excluding any time spent by the train engine shunting at waysidestations, as required and authorized by the local stationmaster andsupported by his signed authorization.
It is suggested that the basic statistical data for computingtrain-hours should be extracted from the drivers' record, to whichshould be attached the Operating Department's authority for waysideshunting and other delays en route. In this way a comprehensiveanalysis of locomotive usage can be obtained. Alternatively, train-hour data can be extracted from the guards' or conductors' traindocuments, but in this case the results should be reconciled with thelocomotive-hour statistics provided by drivers' records in order toassure that documents are received for all journeys and that none isomitted. As driverst records are normally required to be submitted insupport of claims for mileage and overtime allowances, it is unlikelythat any of these will fail to be prepared and submiitted.
Train-hours should be classified by type of traction and service,as follows:
Type of traction Service
Steam PassengerDiesel MixedElectric FreightRailcars Departmental
86

2.02 Locomotive-hours
(a) Train locomotive-hour. A period of 1 hour spent in trafficby one powered unit when assigned to train-haulage duty, the totalhours to count from the time the locomotive leaves tne locomotive shedat the originating station to the time it arrives at the locomozi:veshed at its destination, but excluding an- tLme spent by the locomo-iveshunting at wayside statIons under Traffic Depar;anent authority (seeTrain-locomotive shunting, next section).
Data should be extracted from the drivers' work r-ecords andshould be classified as follows:
Type of traction Service Function
Steam Passenger Principal train-engineDiesel Mixed Assisting requiredElectric Freight Assisting not recuiredRailcar Departmental
The difference between train-hours and train locomotive-hours will,of course, consist of the following elements:
(a) time spent by the train locomotive (or locomotives) intraveling from locomotive shed to passenger station orfreight yard at originating station and from station oryard to shed at destination station,
(b) time that may be lost if loading and marshaling of thetrain has not been completed prior to arrival of the trainlocomotive or locomotives,
(c) time required for coupling up and examination of train,and
(d) in the case of double or onultiple heading there will betwo or more train locomotive-hours to each train-hour.
Even where there is little double heading of trains the differencebetween train-hours and train locomotive-hours can be corsiderable,particularly if there is slack or inefficient working in depot svations
87

and te=rminais. Statistics 7i' idC`cat,; thn r.ee_ foa investigation-nto such cases. (See also Derivec StaalstiCs, e.g., net ton-kil pe-train-hour, net ton-han per train locomotive-hour).
(b) Shunting locomotive-hour. There are tw^o categories ofshunting operations, viz.:
(i) Yard (permanent) shunting. Yard shunting locomotive-hourswill count from the time the locomotive leaves the shaduntil it returns thereto. For traffic costing purposesit is essential tc determine the propo--tion of yardlocomotive-hours employed respectively on freight andpassenger service. Experience indicates that thls deter-mination will nornally req-wire a soecial study of operatiorsat each yard. It is recokmended that, wherever practicable,the yard locomotive driver should be required to indicateon his work record the tines during which the locomotiveis employed handling freight and passenger vehiclesrespectively.
(ii) LTra n- I _ :r'tie ^hunUn. u0 r.an-r rai ways it is cormonpractice for the train-locomotuive of a mixed or freighttrain to pick up or set down vehicles at wayside stations.Time so spent, in excess of either the time allowed forthe station in the Working Timetable or a prescribedminimum, e.g., 10 minutes, is classified as "train-locomo-tive shunting-hours" and deducted from train-locomotive-hours and train-hours. The entry in the driver's recordis usually supported by a form of authority issued by thestationmaster. Train- locomotive shunting-hours will, inall but exceptional cases, be allocable to freight service.
(c) Other locomotive-hours. Other locomotive-hours are generallyincurred by light locomotives, as defined, for purposes of balancingpower, proceeding to the site of accidents, returning from banking duties,etc. WJherever possible they should be classified by the service(passenger, mixed, freight, or departmental) for the benefit of whichthey were incurred.
(d) Total locomotive-hours. These should be summarized as follows:
Passenger) Train engine hours, includingMixed ) assisting required andFreight ) assisting not .requiredShunting - permanent (diVided if possible
between passenger and freight)Shunting - train locomotivesOther locomotive-hours -
Total

2.03 Locomotive-km. A distance of 1 kIn run by one powered uxit underits own power. In the case of mainline operation the number of kilo-meters run should be the actual measured distance from origin todestination, including the distance between locomotive shed and stationor freight yard at each end of the run. In the case of yard operation,or of a train locomotive shunting en route at a wayscde station, shur.ting-locomotive-km should normally be calculated at a nomLnal rate, forexample, 10 kph. In a few cases, where locomotives are fitted withrecording instruments, actual shunting-km are shown in statistics.Whichever method is used should be indicated clearly in statisticalpresentation.
Locomotive-km should be classified in the basic statistical recordsby type of traction, service, and function as follows:
Type of traction Service 2unction
Steam Passenger Principal train-locomotiveDiesel Mixed Assisting requiredElectric Freight Assisting not requiredRailcars (power units only) Departmental Light running
Shunting Yard shuntingTrain-engine shunting
Difficulty usually arises in allocating yard shunting to indivi-dual services. Only in exceptionally large stations would yard loco-motives be allocated specifically to passenger train marshaling.Generally the yard locomotives would be employed mainly on freightduties and would shunt passenger vehicles only as required. Experienceindicates that special studies of terminal operations may be needed todetermine the relative proportions of yard shunting time that should beallocated to the various services. It is recommended, however, thatwhere possible the yard locomotive driver should be required to indicateon his work record the hours spent on handling vehicles of each service.
The basic documents should be the drivers' tickets, or workrecord, by whatever name it may be called locally. Reconciliationshould be made at the end of each statistical period to ensure thatfor each mainline driver's record there is a corresponding guard's orconductor's record, and vice versa.
89

2.04 Net and gross trailing ton-km. For the purposes of operatingstatistics, as distinct from traffic and commodity statistics, thebasic document should be the train records maintained by the guard orconductor of each train. These documents in all observed cases showat the head the date, train nrumber and designation, locomotive numberor numbers, locomotive and train crews' names, maximun pen'mIssibleload for the section and locomotive(s), and a-y othae data relevant tothe specific train. The body cf the document provides a separate linefor each vehicle on the train, as follo-ws:
Number and code of the vehicleStation of originDestinationBrief description of contentsNet loadTare weight of vehicleGross weight
Totals show the net, tare, and gross -4eicrht of the train.Vehicles cut off at intermediate stations are so indicated; vehiclespicked up at intermediate stations are added; and in either case thetotal weight of the train is amended accordingly.
These documents provide the simplest a:nd quickest means ofdetermining net and gross freight ton-knm, up and down, by districtand section, by freight or mixed trains, and by type of traction(steam, diesel, or electric). Passenger train gross ton-km and thepassenger proportion of mixed train gross ton-km. are similarlydetermined, including the assessed weight of passengers and theirbaggage, according to the formula evolved by each particular railway.
The same documents provide also the data for determining train-kmand vehicle-km, as follows:
2.05 Train-km. A distance of 1 km run by one train. Total kilometersrun should be the actual distance between stations of origin anddestination and should not include any shunting movements in terminalsor at wayside stations en route.
Train-km should be classified by type of traction and service,as follows:
90

Type of traction Class of Service
Steam PassengerDiesel MixedElectric FreightRailcars Departmental
The basic document should be the guard's or conductor's journal,or train document, by whatever name it is called. To ensure that allbasic documents have been received and recorded, a reconciliationshould be made at the end of each statistical period with the train-locomotive-km extracted from drivers' records.
2.06 Car-Im. A distance of 1 km run by one nonpowered vehicle. Onsome railways where the vehicle fleet is composed of large proportionsof four- and eight-wheeled vehicles, the unit employed is the vehicle-unit-km, a bogie vehicle being classified as two units, a four-wheeleras one unit.
The classification of car-km by type of vehicle is a matter fordecision by individual administrations. The degree of detail is oftendecided by the need for basic data for future investaent decisionsrelative to the intensity of use of each type of existing stock. Onrailways having computerized car control the basic statistical datawill include individual car numbers. For purely traffic costing pur-poses the aim of satistics should be to produce separate figures forall classes of vehicles having differences in operating and maintenancecosts, ;.nd in operating characteristics, such as variations in capacityand versatility of use.
The following classifications of car-km is suggested as a minimum:
Coaching stock Freight stock
Passenger-carrying cars Tank carsMail cars Hopper carsExpress cars Livestock carsRailcar trailers Other special user carsOther public-traffic vehicles GondolasService vehicles Boxcars
Brake vans
91

Where private-owners' and foreign railways' cars are operatedover the administration's lines, separate statuistics should bemaintained for such cars.
The basic car-km records should also include an indication ofthe type of traction, service involved, wnether loaded or empty anddirection of travel, as follows:
Type of traction Class of service Status Direction
Steam Passenger Loaded UpDiesel Mixed Empty DowinElectric Fre-ghtRailcar Departmental
2.07 Passenger-km. Passenger-hm statistics are probably the mostneglected of all railway statistics. On some railways they are notmaintained at all; on the great majority of railways passenger-km aredetermined on an all-line basis, but not by district or section. Itfollows therefore that, whereas it should be possible to compare costsand revenue o' passenger services on an all-line basis, the profitabilityor nonprofitability of particular passenger services or sections cannotbe ascertained except as a result of special studies and samplings,because of the lack of any basis for geographical allocation of revenues.
The ultimate simplcity in ascertainment of total passenger-km isfound on railways where fares are calculated at a basic fare per km;in such cases all that is necessary to determine total passenger-km isto divide total revenue for each class of travel by the basic fare perkm for that class of travel. Where, however, there is a distance taperin the fare structure this simple method cannot be used. On the majorityof railways in developing countries it is usual to require stationmastersto submit, in support of their station accounts, a statement (daily,weekly, or monthly) of passenger tickets issued, showing openingand closing numbers of each series, the number of tickets issued to eachstation, the fare, and total revenue. These statements should providethe data for determining total passenger-km and, when appropriatelyanalyzed by route and direction, for preparing a passanger trafficdensity and flow chart similar to that prepared on most railways forfreight traffic. The infonmation so provided would be important foroperating as well as costing and commercial decisions.

2.08 Number of freight cars loaded. Figures are compiled from tele-communicated advices from stations. On railways having connectionswith other lines it is essential that loaded freight cars received atinterchange stations should be included in the statistics of freightcars loaded for purposes of calculating turnaround time.
3. Derived Satistics
3.01 Train-km per train locomotive-hour. Figures should be presentedby district or section for each type of traction and by services asfo'lows:
PassengerMixedFreightTotal--all public traffic services
The equation is as follows, taking passenger service as anexample:
Passenger train-km i passenger train locomotive-hoursincluding assisting required andassisting not required
The resultant figure represents the productive work, expressedin kilometers traveled by one train, performed on average during everyhour by one train locomotive assigned to the relevant service.
3.02 Train-km per train-hour. This figure represents the averagespeed of trains of each service, from originating station to destination,excluding only time spent in authorized shunting en route.
Figures should be presented by district or section for each typeof traction and by services as follows:
PassengerMixedFreightTotal--all public traffic services
There may be substantial differences between these figures andthose of para. 3.01, for the reasons outlined in para. 2.02(a). Thecauses of the difference should be analyzed and understood.
93

3.03 Rreight net ton-km, er train loco-a:ctive-hoar. This figurerepresents the productive work, expressed in terms of net tons movedthe equivalent of 1 kn, perfonmed on average in the course of everyhour by one locomotive assigned to freight or mixed service. Althoughno single statistic read in isolation can 'oe depended on to provide avalid conclusion, it is probable that, in the circumstances of mostrailways in developing countries whe-re there is reserve line capacityand where freight Js the pi-edcminant traffLic, the iire o -net ton-kmper freight train locomotive-hour is the most vital of statistics.
Figures should be presented by district or section for each typeof traction and by services as follows:
FreightMixedi'reight and freight proportion of mixed
Mixed train locomotive-hours should be proportioned to freight inthe ratio that freight car-lr. hauled on mixed trains bears to totalcar-hr hauled on mixed trains. The figure for freightt trains is themost important and, except on railways having a relatively large numberof nixed services, and where mixed trains are not well used for freight,there is unlikely to be a significant difference betw-een the first andthird of tuhe figures indicated above. It is important, however, toindicate clearly in any specific context whether the figure being usedis for freight trains only or for freight plus freight proportion ofmixed trains.
3.04 Freight net ton-km Der train-hour. These figures should bepresented by district or section, by type of traction, and for freighttrains, mixed trains, and freight plus freight proportion of mixedtrains in similar meanner to freight net ton-km per train locomotive-hour as outlined in the previous paragraph.
In the present case the figures, which are, of course, a functionof average train speed and net load, will assume prime importance onrailways where line capacity is intensively utilized. Within the con-straints imposed by load, speed, drawgear, and train-length limits theobjective should be to achieve that combination of power, speed, andload that will optimize net ton-km per train-hour, even though this mayresult in a reduction in other efficiency statistics, such as train-kmper train locomotive-hour or average net trainload. Taking an examplefrom actual experience, a reduction of 15 percent in average trainloadon a certain railway made possible a 25% increase in average train.speed,thereby theoretically increasing the capacity of the line by 6.25 per-cent. As a further illustration the following hypothetical comparisonof the effects of single or double-heading trains is submitted:
94

No. of Net train- Train-km Train-km Net ton-km Net ton-kmlocomotives load, tons per train per train per train- per trainper train hour loco-hour hour loco-hour
1 300 20 18 6,000 5,h002 400 25 20 10,000 4OOo
On such a railway, if it should be important to increase linecapacity and there should exist a sufficient reserve of locomotivepower, the decision would be to double-head, thereby increasing linecapacity by 6 2 percent, other things being equal. On the other hand,if the track should have ample spare capacity but the locomotive fleetbe inadequate to meet demand, it might well prove preferable to single-head and thereby obtain 35 percent more output per locomotive. In-Dractlce -there would be several other factors o-L a technical, operatingr,and financial nature to be taken into consideration, but for simplicity'ssake these will not be discussed at this point.
3.05 Gross trailing ton-Ian train locomotive-hour. Whereas in the lasttwo paragraphs the figures have been concerned with the measurement ofwork done for the movement of freight traffic, in the present contextthe purpose is to measure the output of locomotives in terms of grosstonnage moved, including the weight of the vehicles themselves, whetherloaded or empty, passenger or freight. The figures should be calculatedby dividing gross ton-km by train locomotve-hours, by district orsection, for each type of traction, and by each class of service, asfollows:
PassengerMixedFreightTotal--all public traffic services
The significance of the figures is discussed further in para. 3.08.
3.06 Net Freight trainload. Figures are derived by dividing total netton-Ikn by train-km. They should be presented by district or section,for each type of traction, and by services as follows:
FreightMixedFreight and freight proportion of mixed

If possible, without excessively complicating the presentation,figures should be given separately for each direction, up and down,particularly for sections having a marked imbalance of traffic.
3.07 Gross trainload. Figures are derived by dividing total grosstrailing ton-km by train-km, by district or section, for each type oftraction, and boy services, as follows:
PassengerM-ixedFreightTotal--all public traffic services
3.08 Ratio of gross trailing ton-km to net ton-km, freiaht traffic only.This figure is derived by dividing total freight gross trailing ton-km(freight and freight proportion of mixed trains) by total freight netton-km. The resultant ratio is of course a function of:
(a) Average net load per loaded freight car.(b) Average tare weight per freight car.(c) Percentage loaded to total freight car-km.
A ratio in the region of 2.0 is frequently encourntered indicatinga ratio of net load to tare weight of loaded cars of about 1.5 and ofloaded to total freight car-km of about 70 percent. Any reduction inthe ratio that can be achieved will indicate a reduction in the pro-portion of unrroductive deadweight tonnage, with consequent reductionof costs and/or increase in earning capacity per unit of wor]k done.
3.09 Average number of cars per train. Figures should be presentedfor passenger, mixed, and freight trains separately, as follows:
(a) Passenger trains:
Passenger-carryingOther coaching carsFreight cars (if any)
Total
For costing purposes it would be desirable to subdivide passenger-carrying cars between the various classes of travel and other coachingcars between mail, parcels (i.e., express), restaurant cars, brake andbaggage vans, etc. Such a breakdown can usually be made from the traincomposition t-ables in the Working Timetable and for purposes ofswnmarized statistical presentation need not necessarily be included.
96

(b) Mixed trains:
Passenger-carryingOther coaching carsFreight cars--loaded
-- empty
Total
These figures Will provide the basis for detemnining the relativepassenger and freight proportion o± mixed train-kla and hours.
(c) Freight trains:
Loaded carsElapty carsBrake van
Total
3.10 Percentage of loaded to total freight car-km. The calculationshould exclude brake van-km.
A low ratio (say of the orcer of 60 percent) usually indicatesa high preponderance of bulk mineral, agricultural, or forestrytraffic emanating from areas of low population density and littleother economic activity, leading to a high imbalance of traffic. Onthe other hand a high ratio does not necessarily indicate a well-balanced traffic flow. It may, for example, result from a situationin which freight cars are arriving at a port or other center ofbusiness activity with heavy loads and in exceptionally large numbersand are being returned lightly or part loaded to speed turnaround andincidentally provide better service to customers. Such a situationwould be characterized by a high percentage of loaded to total car-kand a relatively low average carload. In practice it may frequentlybe found that exceptionally high average carloads coincide with lowratios of loaded to total car-km, and vice versa.
3.11 Average load per loaded freight car. The figure is derived bydividing total freight net ton-km by total loaded freight car-kmnThe alternative method of dividing total originating tonnage by totalfreight cars loaded, the latter figure of which depends in largemeasure on telecommunicated messages, has been found to be less accurate
97

and to ''ail to account properly for road vans loaded and unloaded enroute from mixed trains and local freight trains.
To continue tuhe line of inquiry started in para. 3.10 it wouldbe useflul "or both operational &nd costing purooses to state averagecarloads separately in each direction, up and down, by district orsection, and even more so to break the figures down into c2'asses ofcars as previously outlined in para. 2.06.
3.12 Ayerage number of seats and passengers per train, and seatoccupancy ratio. It is unlikely that basic train documents will providesufficient data to calculate tne average number of seats per train.Reference will need to be made to train composition tables in theWorking Timetable and to tables of rolling stock types and capa:city;from these a standard table of seat-Ian based on the current timetablecan be calculated, to be amended if and when changes are made in thetimetable. The average number of passengers per train is of coursethe prnduct o'l total passenger-1an divided by passenger train-k. pluspassenger proportilon of mixed train-baa; the seat occupancy ratio isof course the ratio that the average number of passengers per trainbears to the average number of seats per train. As is pointed out-inpara. 2.07, passenger statistics are often a neglected field. If theycould be established by districts or section, or better still, by indi-vidual service, a major step would have besn taken toward providingadequate data for management decisions in both the operating andfinancial fields.
B. TRAFFIC STATISTICS
1. Basic Statistics
It.Ol Commodity tons, net ton-kmn, and revenue statistics. Basic datashould be extracted from the audit or accounts office copy of freightinvoices or waybills received from stations and should be coded toprovide the following information:
Date RateStation from Haulage chargeStation to Other charges (siding,Distance in kilorneters terminal, local haulage,Vehicle class or number port charges, etc.)Commodity Net ton-kmWeight of consignment
98

On railways where computers are used,the computer should checkthe rate and charges against the entries made by station staff; inthis way the costly and time-consuming processes of the revenue auditoffice, which is a feature of so many railway accounts departments,can be avoided. The computer will also, of course, calculate net ton-Ian.Ln the latter context it is to be observed that the statistics underconsideration are primarily intended for analysis of traffic and revenuepatterns and flows. A quicker and more direct method of determining netton-Ikn for operating purposes has been considered under OperatingStatistics, para. 2.04. Normally it will be found that the operatingstatistics will show a slightly higher figure for net ton-"a than thetotal cf net ton-km by individual commodities extracted from the waybillsor invoices. The latter documents show the actual weight of each con-signment to a fraction of a ton, whereas the train documents will usuallystate the weight of the contents of each vehicle to the nearest higherround figure in tons. If, for example, the average load per loadedvehicle is 20 tons, it is likely that the net ton-Inm extracted from thetrain documents will be about 2½ percent than the comDarable figuree:ctracted from the waybills or invoices. The difference is withinacceptable limits of statistical variance and is of no practical signi-ficance as long as the contexts in which the figures are used are notconfused.
Commodity statistics should be prepared as speedily as possible(it is suggested within 30 days of the end of the month to which theyrefer) and in a sufficiently summarized form to make them easilyassimilable. On smaller railways -~here statistics have been and inmany cases still are prepared manually, simplicity of presentation isessential. With the advent of computers a tendency has developed towardexcessive detail--the list of commodities has been extended and eachcommodity is analyzed by dispatching and receiving stations. Althoughsuch information is essential for an understanding of long-range trafficpatterns, flows, and densities, and the consequential demands foroperational facilities and commercial action, the amount of detail istoo confusing to enable management to observe and react quickly tosudden changes or persistent trends. A summary, quickly produced inthe form of an abbreviated list of principal commodities, should be anessential feature of a sound statistical program.
The summary should show carload and less-than-carload trafficseparately.
4.02 Revenue-earning and service traffic. In this context the terms"revenue-earning" and "service" traffic are used on the assumption thatall railway material and fuel are carried free-of-charge to the railwayitself. It is appreciated that a small number of adminis trations charge
99

nominal rates to tneir o,rn user departments for the earriage of railwaymaterials, more commonly where such materials are for new constructionor Lor capital works generally, but also in a few instances for revenue-account fuel and material also. WIhatever the situation may be, railwayservice traffic should be segregated, in terms of both tons and ton-km.The basic accounting forms should enabla this to be done w- thoutdifficulty.
L.03 Number of -assenger and passenger-km. The number of passengerscarr-ied is a basic statistical figure, universally published. So faras is known., however, the figures refer only To paying passengers anddo not include railway staff traveling on free passes with their familieso;n leave, transfer, duty, etc., nor dc they normally differentiatebetween public traffic and railway staff traveling at substantiallyreduced fares. It should be a simple matter to include this additionalanalysis.
'The problear of deterinIinig passenger-hk has al;*eady been discussdin para. 2.07.
5. Derivated Statistics
5.01 Average length of haul. The figure is derived by dividing netton-ham by originating tonnage and should be stated for revenue-earning(public) traffic and railway service traffic separately.
5.02 Average revenue per ton-kom. The figure is derived by dividing totalrevenue from mainline haulage (i.e., excluding terminal, siding, localhaulage, and other miscellaneous charges) by total net ton-km. Commoditystatistics will show a separate figure for each principal category;general statistics will show the average for all freight, excludingrailway service freight.
5.03 Average passenger journey. The figure is derived by dividingpassenger-km by number of passengers, for each class of travel and forall classes combined.
C. EQUIF4ENT UTILIZATION STATISTICS
6. Basic Statistics
6.01 Locomotives in stock, under repair, and in use. Statistics willbe maintained in as much detail as to class and type of locomotive as
100

management may consider desirable, but an syim.arr they sho-C.1 be pres3ated
by type of traction as follows:
SteamDieselElectricRailcars
Steam, diesel, and electric locomotives should further be subdivided
-n-o mainline and shunting services wherever the locomotives are specifi-
cally designed for one or other of such services.
The statistical presentation is suggested as follows:
Number Percentage
Locomotives in fleet 100.0
Under workcshops repair:For scheduled repairsFor miscellaneous repair
Stored in bad repair
Loc-omotives in trafficUnder repair in running sheds
Locomotives available for lseSpareStored in good repair
Locomotives in use
The number of locomotives in use should be further subdivided
between operating districts or sections of the railway.
On some railways the status of each locomotive is recorded on an
hourly basis; on. others the basic unit is a day of 24 hours. In the
latter 6ase if, for example, a locomotive is released from workshops at
any time during a particular day it is classified as "in traffic" and
not "in -workshops" for that day. Similarly if it is employed on train
or shunting duties during any period of a particular day it is classed
as "in use" for that day. It will be classed as "spare" for one day
only if it remains on the shed from 0.00 to 24.00 hours. Availability
and utilization ratios are based on the percentage that the days avail-
able or in use bear to the total days in the month. The mathod has the
advantage of simplicity and has been shown from experience to give a
fair picture of the efficiency or inefficiency of locomotive utilization.
Although it is usual on most railways to find a small reserve .margLn
of locomotive power held to meet emergencies, which reserve consequently
gives rise to some "spare" locomotivesfrom time to time, the classification
"stored in good or bad repair"l will be applicable only on railways witr.
recurrent and exceptional large peak traffic, or where a railway .s Lr,the course of conversion from one type of traction to another, when there
101

rfmay oe a - 7 oar,;- surDlus oi' zlie re;la ced -ype, which, because o'e,pected traffic growth, it may aot oe coas-oaered desirable to disposeof ixrnnediatelv.
6.02 Freight cars in stock, under re-air, and in use. The repairoosition is normally advised to headquarters by telephone or telegraphat a specified time each morning by all workshops and line maintenancedepo-s (sick lines). The monthly average is the mean of all the days.in tihe :nonth and uhe average for the year is the mean of all the daysin the year. On a railway haaving no interconnections witL other linasthe presentation becores simply:
Nmiiber- ?ercentage
Tlotal cars in fleet 100.0Under or aw.aiting repair
Total cars in traffic
In all cases, figures should be inclusive of both railway-ownedcars and private owners' cars (if any).
In the case o;- aL railway stith int>erchange traffic the positionshould be shown as f ollows:
Number Percentage
Railway-owned cars on line (a)Private owners' cars on lineForeign railway cars on line _
Total cars on line 100.0Under or awaiting repair
Total cars in traffic on ownlines
Railway-owned cars on foreignlines (b)
Total railway-owned cars infleet (a) + (b)
6.03 Passenger cars in stock, under repair, and in use. Statisticsshould be the same as for freight cars.
6.04 Locomotive failures. The total number of failures for the monthshould be advised by the Mechanical Engineering Department, withseparate figures for each type of traction, as follows:
S team
DieselElect.ricRailcars
102

6.C$5 Freight car hotboxes
6.06 Passenger car hotboxes. These figures should be advised monthlyby the Mechanical Engineering Department.
7. Derived Statistics
7.01 Locomotive-km per day Der mainline locomotive in stock. One figureshould be calculated for each type of traction as follows:
SteamDieselElectricRailcars
The calculation should of course be carried out as in the follow-ing fraction, taking steam as an example:
Total stema ma-nline locomotive-._cn(Average number of mainline steam locomotives in stockx number of days in month)
7.02 Locomotive-km per day per mainline locomotive in use. In thiscase figures should be calculated for each type of traction and onrailways where locomotives are assigned to specific districts orsections, for each district or section separately, as well as for thewhole railway.
7.03 Locomotive-hours per day per main-line locomotive in use. Main-line locomotive-hours will normally be total locomotive-hours lesspermanent shunting-hours, except in cases where shunting locomotivesmake occasional trips on the mainline, for which adjustment of loco-motive-hours should of course be made. Locomotive-hours per day inuse should be calculated for each service (passenger, mixed, freight,departmental) and, where lo6omotives are assigned to specific districtsor sections, for each such district or section separately. The lattermay be possible in respect of steam-operated or electrified sections,but in the case of diesels it is usually more economical and efficientto run the locomotives through more than one district on the same day,so that geographical statistics may not be feasible.
7.04 Percentage of locomotives under or awaiting repair
103

7, 0: Locomc,ive availability afid rati.zaaon rawos. Bh-,h of thesefig ures can be otaiaLJned directly from the statis-ics of locomotivesin stock, under repair, and in use (see para. 6.01). Locomotivesunder or awaiting repair shDuld include those "stored in bad repair,"it any.
7.06 Loc c &i-i u7r Ier locoMotive 2afureI. iguxes should be presentedfor each type of tractio., by district or section, for mainline ardshunting locomotives separately.
7.07 Percentage of freight cars un"der or a-.stin, repair. This figareis obtained directly fro.m -che statement of' 1reight cars in stock, underrepair, and in use (see para. 6.02).
7 .038 Freight car-l!n per fre-ght car-day. Two figures should be pre-sent-e4 on an all-line basis for freight cars in stock and -in use. Tnef:``ference between them will of course reflect the ratio of cars under
. >:.a: ..L. grenaiz- as ca tcuati:ed underL para. 7.07. Tie a-verage car-!; per car-day will be the average ci WiGely diff'eren`t periorances Dyeach of the various classes of freight vehicles in the fleet. Forexample, an average of 80 car-km per day per freight car in use wasfound to be compounded of figures as low as 20 km per day for cars indepartm ental service and over 200 km per day for specialized cars suchas tank cars and cattle cars. For purposes of costing and estimationcI future car requirements it would be extremely useftul to maintainstatistics separately for each class of freight vehicle suggested inpara. 2.06.
7.09 Net ton-ki -Der freight car-day, Two figures should be calculated,on an all-line basis, for freight cars in stock and in use. The cal-culation should of course, be as follows:
Total freight net ton-Ion(1) Average number of cars (a) in stock) x number of days
(b) in use ) in the month
As a cross-check on the accuracy of the various statisticsinvolved, it is suggested that the following calculation should alsobe made:
(2) (car-kI. per) (average carload,) (percentage loaded to)(car-day ) x (loa&ed cars only) X (total freight car-kr.)
(para. 7.08) (para. 3.11) (para. 3.10)
whLcn should, of course, produce the same result as in (1)
104

7.i1C Freight-car turnaround days. An all-line figure should becalculated as follows:
Average number of freight cars in use (para. 6.02) xnamber of days in monthNumber oL freight cars loaded in montb (pa-a. 2.08)
If it should be possible to 1egre,gate carloadings intio thevaricus classes of' freight car suggested in para. 2.06, the resultant
turnaround times for each class of car woulc pro-vide valuable operating
and costing information.
7.11 Number of hotboxes per million freight car-km. The method of
calcu'lation of this indicator of maintenance standards is self-evident.The figure will be greatly influenced by the relative proportions ofvehic'es fitted with friction and roller bearings.
7.12 Percentage of passenger cars under or awaiting re'air
7.113 Passenger car-hm per vehicle-da,y
7.2L4 Number of hotboxes per million passenger car-Im. The sane con-
siderations and calculations will apply as in the case of :'reight cars.
D. STAFF STATISTICS
8. Basic Statistics
8.01 Niumber of men employed. Because staff costs represent so largea proportion of total railway operating costs it is essential that
accurate staff statistics should be maintained in order that past trendsof productivity and costs should be clearly understood and that thereby
the probability of future trends might more dependably be assessed. Un-
fortunately it is too often found that staff statistics are preparedinaccurately and illogically, possibly by staff who are unaware of the
purpose and meaning of the work. For example, the staff strength maybe quoted as the number of approved posts in the establishment insteadof the number of persons holding those posts, or as the total numberof names on the payroll, even although many of the persons named there-in may have been employed for only part of the payroll period. Theaverage number of men employed during any period should be the total ofall personnel employed throughout the period plus the appropriatefraction of the period in respect of all staff who worked for only partof the period.
105

Having determined the total numoer of rien employed, the nextstep is to differentiate between staff employed on normal operationsand maintenance ard those employed on capital works, whose wages,salaries, and allowances are charged to suchr capital works. It isThrther necessary, on railways cperawrig a.ncillary services, to sub-divr ce the labor ftrce as between the variou.s activities cf theen-rerprise, as foll ows:
Nmnber of men emplcyed:Adr,-nistration, operations, and maintenance:
RaLlwayRoad transportHotels and cateringInland water transportFerriesDocks and harborsetc. etc.
Capitai develotiment (and rene-alschar.geld to capital acc3t-out)
Total ____a_1
8.02 Staff costs. Costs should be analyzed according to their aature.They should refer to revenue account charges only and should be sub-divided between cash remuneration for services rendered (take-home pay)and costs of other benefits such as medical, health, and hospitalservices; accident and life insurance; pansions and provident fuindcontiibutions; and the like. Costs should be given for the railwayservice in the following suggested form:
Wlages and salariesOvertime mileage and other allowances
paid in consideration of work performedHouse and other allowances paid in cashBonuses (Christmas and national holidays),
vacations, and other cash benefits _
Subtotal, "take-home" pay
Medical, health, and hdspital servicesAccident pay and insuranceEducation and welfare servicesPensions and provident fund contributions,
indemnities, and other retirement benefitsOther items
Total staff costs
106

9. Derived Statistics
9.01 Productivity in traffic units per man employed. Total trafficunits are the sumi of total net ton-kIn, revenue-earning and service(para. 2.04), and passenger-kIm (para. 2.07). It is sometimes contendedthat a case exists for weighting 'the net tonr-kmn as against the passenger-km, but experience has adduced no evidence in suppo. of this view; infact on many railways it would seem that the additional worik involvedin freight train operation, as ccmpared with passenger train operation,after making full allowance for work in freight terminals, is _ess thanproportionate to the much higher load of freight trains (in terms olnet tons) as compared with passenger trains (in terms of passengers) andthat a case may well exist on some railways for weighting passenger-inas against net ton-km. Taking an overall view, however, the definitionof traffic units as the sum of net ton-kon and passenger-km should makepossible a fair indication of productivity -rends on any specifiedrailway.
In this context the figure will, of course, be derived by dividingtctal traffic units by the nuLnber of imen employred on rail-way adrninistra-ticn, operation, and maintenance only (see para. 8.01).
9.02 Staff costs per man employed. Figures should normally be calculatedfor take-home pay, other staff costs, and total staff costs separately,but where any individual and important element of cost tends to fluctuatedisproportionately to other costs it should also be shown separately.
9.03 Indices. In order to facilitate aDpreciation of the relativetrends of staff costs and productivity it is suggested that indices beestablished for a past period of at least five, preferably more, years,and on the basis of a particular year of normal operation. By suchmeans it can be observed if productivity growth has kept pace withincreased costs. If, as is probable, this is not the case, a furtherseries of indices should be introduced, by applying the consumer priceindex as deflator, to show the increase in real wages and other staffcosts relative to the increase in productivity. In this comparison, itis to be hoped, productivity will show the higher growth rate.
B. FUEL AND LUBRICANT STATISTICS
1(. Basic Statistics
10.01 Fuel consumption and cost.e Figures should be prepared for coal,fuel oil (for diesel locomotives and railcars separa7cely), and electricpower.
107

IC.C2 ILubricant consumsption and cost. As there are so many types of. ibricar,t hard and soft greases and oils for various purposes) a listof equivalents will need to be established by technical officers forquantitative comparisons of stear, dciiesel, and electric traction.
11. Derived Statistics
11.01. Pu3 con-suxm-tion and cost per loco.m.otive-krm. F,gures should bepresented by type of tractiion, for mainline and shunting locomotives,and by district or section.
11.02 Fuel const2mption and cost per 1C00 gross trailing ton-km. Tnesefigures should refer to mainline operation only and should be preparedfor steam, diesel, electric, and railcars and by district or section.
11.03 LubDricant consvnmotion and cost per 100 locomotive-km. Figgures5'nou I r,r es*:snted by trpe of traction, :or manine and shuntingseparately, and by district or section.
F. MISCELLNTEOUS STATISTICS
12.Q1 Number of consigrment. This is not normally a figure includedin statistical presentation, but at least one railway publishes theinformation, which is of great value for costing freight office salariesand expenses. The cost of documenting one consignment will be the same,whether it consists of a nunmber of full carloads or a fraction of a ton.
12.02 Number of freight cars sh-anted. This is a figure not maintainedon any known railway in any country in which the Bank operates, but onethat would be of inestimable value for the costing of yard expenses.Some railways record the number of cars received at and dispatched fromdepot stations, but except at dead-end terminals it must be assumed thatmany cars move through intermediate depots in trainloads requiring noremarshaling or shunting. Daily advice from stations, of cars handledin the yard, could probably be introduced without difficulty on mostrailways. If this could be done, other statistics such as "cars handledper shunting locomotive-hour" would provide useful costing and operatingefficiency indicators.
12:.03 Other statistics. The foregoing list omits some statisticsmaint.iined to suit local conditions and is not intended to be exclusive.
108

A -'I' F. F.FA
2al,,toFiAtlOr of Flit- an( FlarIc ~ ~ ~ ~ ~ ~ ~ ~ ~ ~ - d, d"I
SiFpc.clntr.cd..occ 1,012 '0 .10 1) 16 - 72 13
247 I (1 ' ' 32 i
ntrrsnc,---(atoy (.93 5 V04 ~ 1 .13 3'.7 LI t 11
(FlIt 206 0 ~ ~~~~ ~ ~~~~ ~ ~~~~~ ~~~~~~~~~~~~~~ 20, '.(2' 7)
Small tools cod sapplist 04 0t FF - ,
I i Id I I,~~~~~~~~~~~~IA 3II (
ci'flao.: of aok, sooro' 'iIi la0
2.Ftl.clop' -td t('oc(311 0 ,88.
14i"ling plant 'ill,00 D I0 00 I 40 -
Sita 100, 10 ogvai,ntto,,..,-1, 310 0 V8 --
trout, Itiral croon 'r,~o~ Iro-iFli'. 'to. ISO
t.vlThiV di-t y -) .bl-a IVi-o'Ja-toc '4i,la C.-- y-F .d

1020 -- 1070 n~~~~~~~~~~~~~~~~~~~~~~~~~~~~~~~~~~~~~ I1,
etrnanr.t'l ('Ont nnCAlt'Il:a..'(!l 60 3,213 nOD 3'.? 'jI 1''~~~~~~~~~~~~~0i . 403% '6
...las car. 100 F -
lIasierns and jonpec tint car: ~~~~~~~~~30) IV 20'ic roorks eqalnneni ~~~ ~~~ ~~~~~ ~~~24 54 1 00 05 IF
4~~~~~57n SarA ~~~~~~~~~n&re ~~~500 IV 0 4,J0 5 9441723
l'al,orp20'~~~~~~~'. n~~~nl nort 2~~~~0 11'40 72
l4
'tor -ippl, alnr 70 17'0 4
o1- OrtiA ' Of ia 't, '. no,
''1,I me .selr 'I. 30 4I2
Snprrincnn0.'nce ~~~~~~ ~~~~ ~~~~~~40 IV .75 34 20
loal-1 area 93 5
an Mp t iA
tnporincc'ndennn ~~~~~~~~ ~~~ ~ ~~~1,210 0v .10 I IL 3 -23 '.12 2I
tra Inn nrpl 542 ;I V , ,, ` 0 2. , 'l.7 I'S.
tar'. pal2 1200 ~ ~ ~ ~~~~~~~~~~~~~~ 7 1 .0' 1 1.''
tic'In, -trts' I Iii' I 4rt1
A:',nr far r,. I t,,r!nntIo" -tlI' 1 .1) llt I'2I
Ia,I,riraets Ia? yard ioooa--'tlenrl I~~~~~~~~~~~ l~4 I1.00 'I
I ,~~~eonaiiae,, -'Ar.'t ~ ~ ~ ~ ~ ?22 C .::0 ?2 (Il 239 241I
Ilninline laerns,n,nei-reo,--dleas.I ~~~~~1,500 3 :'('a I, s .) ~ 00 1.100 20)
Ia,, L,.,i fr--r' 14.1.1 AI,t 304 ,0 133' 1340 .114 2,1090 313 2.071 900
II IIe I tn,letI A' 'i' Ie 1 ' oar lIr C., e , tin I , l int0ed.

Il)* A t gl t 'A
it H 1 I I0 1 0
~~ _> _ ;_ ; - ; -- - - ' ~~~~~~~~~~~~~~~~~~~~~~I', ; 1111 'll 'l ; ,,l OIl ,,,',,.tl y-. IPI.)'.',rlE
--
II0IIVIISIbIIAPV~~~~~~~~~~~~~~~~~~~~~~~~~~~~~~~~~~~~~~~~~~~~~~~~~~~~~~~~~~~~~~~~~~~~~~~~~~~~~~~
(1.1. I t IIIll IILW
'hI O'I I/ Al Oll lr
i0i "I -It it) 1)01 Ll DII I'l: I 'It. I. IL Alk 001' I S IT'' 01)4l'0"" 1(111'
it ol,~~~~~~~~~~~~ . OM llt A Il.1,'.d1.k11.UUl''
0 1 1 1 9 0) 00 01. ill 01 09! l's'~~~~~~~~~~~~~~~~~~~~~~~~~~~i'" '0~~~~~~Jll IslaudArRJlbrP
rl.l. /'1 .. g 1 ' 16 ( t10t1 t {.SS t . 1.4 i " f 1% .11," ' .' ..... '/. '11bl ............ 1i/l tA9001 AAllitT4 li!'l .J.I ,V1.1 (IlV lPllll*11I,61 tt
WIAt lt ; t1. lI-t 001 OI 100 z (l il 1 I.JDVl;
I OAt) tl~~~~~~~~~~~~~~IC ''It 01)1 All '1011~~~~~~~~~~~~~~~~~~~~~~~~~I -- - tAt Alt 'Hlo li. (ll; T All L") II-llI
ALA 11110' I 0: I Wi %, Al 001 I
1 1 1 0~~ ~ ~~ ~ ~ ~ ~~~~~~~~~~01 IA I IillU ..,
'IA 7 -.1 t111 I. A 1 09I '1 I
J 4L~~~~~~101)Tl I(II liln'1IIUl
- III ~ ~ ~ ~ ~ ~ q tOl tA'l Cls 111I All 1019s retuz l ue*s!r:-lr
11| z5S .fIC 1% t001' I AtSW Ill) srSl11lJ015
0!i1 illil I11 1 1 All OI r r -t '''A. I A
(10, qb~~~~10
z itC r1 /1' ,i> All CYt I I5T
79~~~~~~~~~~~~~~~~~~~~~~~~~~~~~O' PU If 1: A P: AM IRW1I;
! L b IIU ' £ \c; 9 nzr l 'e-~~~~~~~~~~~~015 II5(
,~~~~~~~~~~~~~~~~~~~~~~~~~~~~~~~~~~~~~~~7 t. .F ea1sO30'i Al; OSI$f
I LS u, ib; uf a(l l ,\(( rt LsT s~~~~~~~~~~~~~~~~~~~~~~~~~~~~~~~~~~~~~~~~0' Al -
tJ ;; it ) l>l) i A;4] (lt =vow 1 9 S 1s l dll l l i; J ] DJ [ Vd~~~~~~~~~~~~~~~~~~~A Et
(' a(11 [ zS iS I | u/ E | (}S} i\t1 <)t/ t =e-@1o ~~~~~~~~~~~~~~s 1''1< AAII .Jt .tIItltl}BMOWI E
L~~~~~~~~~~~~~~~~~~~~~~~( 1"7 oixs^uose
I"o u;r 0_ ,l 4 Ile Iq IT o
B!.,Az s s,vl ;f - ar 0
- _ _ _ axq! lcx I leTlrA w eK <) fsatuuxa~~~~~~~~~~~~~~~~~~~~~~~~~~I L6,1t; Sq!Jt\ .1S .............. So1. D .>l7rJR{ VtIlJ..illr,...ve-' l~ or- - vAn

r.-v _4 - r v -
. ~ ~ ~ ~ <<0 .4-
:, ~ ~ ~ ~ g8~ -0 or it
-~~~~~~~~ 2
j I ~ ~~~~~~~~~I .- I I

Table, 42
1 970 (1 501,ia - 3 1l)7 4
I ra (f P,, r.i .-t
Fr i ght-- t,,,as (000) I11.00,0 11, 500 1 2 ,333 1' 13 DODr~
t- -tanS., (mi Ion) I 3 ,600 3,900 4 .0 4 .(10
I'a .se ers - no (000) 15,400 I 6O 15,600 1,9K) 1 20D)
--pas s-kn (mtlIio,n) 1 ,900D 1.053 2,31. 100
S,tat I ,s
Freight (tons) 300r 300 3 r 2 330
Passenger (em,) 190i lq5 2Y21
I ralIn-k (00)OFreigh 2,0 12 6 67 1 2D,9 a . 13,33 3
P( nsenge~r 1000 1,0O0" IO,,~?_1 I DSPw)
Dcya r tent al11 7 20 72 0 7'3 75n
L, 1 ~ ~ ~ ~ ~ ~ ~ ~ ~ ~ ~ ~2,0 3, 3P. 7 2 3,6 'I 632L
.cat ZI L me- (COO))
Fre igh t 6,400 65,400 5 , 3 200
passenger 4,000 4,000) 2 .090 1oo
tPaP.r tneaneo 600 600o 6 31,400 -
Shunr in? 2,560 2,5E0 24&' I, 0 1 260
(at a3 ~~~~~~~ ~~~~~~~ ~~~~~~~~~~~~~13.560 13,560 00,3 4 Req
Sre ' oht 6,600 7 00 o,nV
a., f -are6,1I0) 6, !:1~aatmo(a ' (0(1 1 2'1'1.
Shunt ing 1,600 L,60)0
2,1~ 3,310
ToLto 14,400 11,620 16,9 4-, 2602,)f
aICom-tis-kr per asoam per locmmotiee- Ir. sa(flPP,)St e-r
F-eigh: 73 73 70 3
Passenger 69 988 Departmrental 5 50 50
Sh-mo C6Ig 40 40 LO40
Frei ght 210 11 11Passenger 300 ISO719
VeeDo r tnen tal 50 50~ 5 ) 5nShim tng ~ ~ ~ ~ ~ ~ ~ ~ ~ S 48~~4
N;. f lmantivs I, stack:-
Freight 398 39 16 F
Passena;* r 46 _' 6De pa r t.nem rat 12 12. P.
Sh-aring 61 1 32
Total In one 210 712 0 86
Spare 571 15 15 1' 6
Under repair 25'1 75 75 6i VTotL1 In stock 300 302 2V 122
Diesel, in ose: Freight 17 50 781 B
passenger 34 34 >_56
Departn.ental 2 3 3 7
Shontlng 33 33 69
Total in one 116 120 15 5 213
Spare 5% 7 7 1 C, 13
Under repair 15% 22 23 5 40
Total in stock 145 150 1 9. 266
Freight ear-km per car-dayIn use 20 70 7 3 7~80
Overage carload, looted ears only (toss) 211 20 20J.5 2 21.5
Plercentage loaded to total ear-km 25 25 747'72
Percentage of earn tinder repair 8 8 5
Total cars required 10.211 13,730 10.782 1 10,2 5so
Freight ear km (.illions):Loaded 1S0 190 i95 20)5
Em Pty 60 63 69 7 6P0
Total 240 253 264' 7- 25
%n, of curs Loaded (000) 5455 975 Sb0
(rihter-dam~s in use (000) 343 3,6141A 3,51?6h
Ca.r tiirnar.mord time (days) 6.3 6.3 5.9
Crass ra-Sn, (mliglmr-otiosre~Ight (ml8n ,660 0l, 300 0,%1$10,690
Passenger (million) 5,000 5,003 5 03 5 5C r20 5 010
Toatn (million) 13,660 14,3,13 11,00 5 1552700
Price indices:Im.ported material 100c 105 110ii 1 22
Fuel 100 I00 l016 I3% 12
Consumer Prices 100 106 310I 4 1 2 0
(lages and salaries 100 115 117 I 3Ž 133

Table C3
DEPRECIATION OF FIXED ASSETS, 1970
The purpose of the study is to determine the value of all theresources consumed in carrying traffic at any given future level. Deprecia-tion is therefore calculated on the basis of equipment usage and replacementvalue as follows:
Rails and Fittings 80 lb, $20,000 per km, laid in track.Service capacity 200 million gross ton.Depreciation $.0001 per gross ton-km (including locomotives)1970 Passenger 5,000 mgtk* $500,000
Freight 8,860 mgtk = 886,000
Total 13,860 mgtk = $1,386,000
Sleepers Timber, 1400 per km = total 6,720,000Cost per sleeper, laid in track $3.20Total replacement value $21,504,000Estimated average service life 15 yearsDepreciation due to wear and tear under
traffic (engineer's assessment) 10%Total annual depreciation S1,434,000Due to traffic $ 143,400
Locomotives -- Mainline Diesel
1800 hp $300,000.Estimated life 3 million kmDepreciation per km $0.10
Locomotives -- Mainline Steam
As steam locomotives are to'be replaced by diesels in the ratio ofabout 2:1, depreciation of steam locomotives is assessed at $0.05 per km
Locomotives -- Shunting Diesel
1000 hp $180,000Estimated life 133,000 hr = 1,330,000 km.Depreciation per km $0.14
Railcars Cost per unit $200,000Estimated life 2,400,000 kmDepreciation per km $0.083
Freight Cars Average cost $15,000Estimated life 1,000,000 kmDepreciation per kmn $0.015
Passenger Cars Average cost $80,000Estimated life 2,000,000 kmDepreciation per km $0.04
* Million gross ton-km.
2.14

Appendix D
FORMIULA FOR SEPARATION OF MAINLINE LOCOMOTIVE CREW EXPENSES BETWEEN SERVICES
(Hypothetical figures for XYZ Railway)(Steam)
Mainline locomotive crew expenses (000 units)
Salaries, overtime, etc. 1,500Kilometrage allowances 532
TOTAL 2,032
Train locomotive-hours (000) Total Assisting Mannedhours locomotive- Locomotive 7
hours hours(unmanned)
Passenger 100 - 100 18.2
Freight 271 - 271 49.3
Mixed 120 - 120 21.9
Departmental 40 - 40 7.2
TOTAL 531 - 531 96.6
Train locomotive shunting-hours (000) 19 3.4
Total mainline locomotive-hours (manned) (000) 550 100.0
Mainline locomotive-km (000) Total Assisting Manned %km (unmanned) km
Passenger 3,000 - 3,000 27.1Freight 4,910 - 4,910 44.2
Mixed 2,400 - 2,400 21.6
Departmental 600 - 600 5.4
Train locomotiving shunting 190 - 190 1.7
TOTAL 11,100 - 11,100 100.0
Allocation of crew expenses Salaries, Kilometrage Total(000 units) overtime, etc. allowances
Passenger 273 144 417Freight 739 235 974Mixed 329 115 444Departmental 108 29 137Wayside -hunting 51 9 60
TOTAL 1,500 532 2,032
115

Allocation of mixed cost between passenger and Freight
Vehicle-km Crew expenseson mixed trains % ($000)
(000)
Passenger 9,250 41.7 185Freight 12,950 58.3 259
TOTAL 22,200 100.0 444
Train-km (000)
Passeenger 2,970Freight 4,600 Passenger proportion, 1,CO0Mixed 2,400 Freight proportion 1,400Departmental 600
TOTAL 10,570
Train-km (000) %
Passenger and passenger, proportion of mixed 3,970 40.0Freight and freight proportion of mixed 6,000 60.0
TOTAL 9,970 100.0
Allocation of departmental cost between passenger and freight (000 units)
Passenger 55Freight 82
TOTAL 137
Final allocation of mainline locomotive crew expenses (000 units)
Line-haul
Passenger 657Freight 1,315Wayside shunting 60
TOTAL 2,032
116

Appendix E
FORMULA FOR SEPARATION OF MAINLINE LOCOtDTIVE FUELEXPENSES BETWEEN SERVICES
(Hypothetical figures forXYZ Railway) (Steam)
Total mainline locomotive fuel expense
(000 units) 1653Deduct: Train-locomotive shunting
(Total train-locomotive (Fuel consumption (Cost pershunting-hours) X per X litre)
locomotive-hour)19,000 100 litres $0.011 21
LINE-HAUL FUEL EXPENSE ($000) 1,632
Gross trailing ton-km (million) %
Passenger and proportion of mixed 1,516 30.3
Freight and proportion of mixed 3,284 65.0
Departmental 240 4.7
TOTAL 5,040 100.0
Allocation of line-haul fuel expense (000 units)Passenger (30.3 x 1,632) 495
Freight (65 x 1,632) 1,059
Departmental (4.7 x 1,632) 78
TOTAL 1,632
Allocation of departmental expense (000 units)Passenger ) Percentages as in 31
Freight ) Appendix D 47
TOTAL 78
Final allocation of mainline locomotive fuel expense (000 units)Passenger, line-haul (495 + 31) 526
Freight, line-haul (1,059 + 47) 1,106Wayside shunting 21
TOTAL 1,653
117

Appendix F
INTEREST CHARGES ON CAPITAL
(Track, Locomotives, and Rolling Stock, HypotheticalCase of XYZ Railway, 1974 projection)
Annual interest @ 7% perannum averaged over lifeof assets (000 units)
Passenger Freight Total
1. TrackRails, 4,800 km @ $20,000 per km 1,008 2,352 3,360Sleepers, 6,720,000 @ $3.20 x 10% 23 52 75
TOTAL 1,031 2,404 3,435
2. Locomotives, mainlineDiesel, 180 @ $360,000 910 1,358 2,268Steam, 77 @ $100,000 - 270 270
3. Locomotives, yardDiesel, 86 @ $200,000 48 554 602Steam, 46 @ $60,000 8 89 97
4. Freight cars, 10,250 @ $16,050 - 5,758 5,758
5. Passenger cars, 890 @ $96,000 3,018 - 3,018
6. Railcars, 75 @ $240,000 630 630
7. TurnoutsYards, $2,000,000 6 64 70Mainline, $400,000 6 8 14
TOTAL 5,657 10,505 16,162

Appendix G
FREIGHT TRAFFIC UNIT COSTS
(Hypothetical case of XYZ Railway, 1974 projection)
Long-runvariable No. of Cost per
cost units unitOperation Unit (000 units) (0o0) ($)
1. Documentation Consignment 3,413 1,900 1.80
2. Handling, LCL traffic Ton handled, 1,283 214 6.00origin anddestination
3. Yards Car movement 7,050 1,520 4.64Add: Interest on capital
Locomotives 643 .42Turnouts 64 .04Total, yards 7,757 5.10
Block trains = 4-1/2 units Train movement 22.95
4. Wayside shunting Car movement 350 55 6.36Block trains = 4-1/2 units Train movement 28.62
5. Track costs, etc. Gross ton-km 3,723 10,680,000 .00035Add: Interest on capital (including loco-
motives) 2,412 .00023Total, track etc. 6,135 .00058
6. Train costs Train-km 4,289 13,333 .322
7. Locomotive costs, mainline
Diesel Loco-km 6,023 11,300 .533Add: Interest on capital 1,358 .120Total, diesel 7,381 .653
Steam 2,800 3,200 .875Add: Interest on capital 270 .084Total, steam 3,070 .959
Average, steam and diesel -10,451 14,500 .721
8. Track, train, and locomotive Gross trailingcosts combined ton-km 20,875 9,240,000 .00226
9. Freight-car costsDistance-related Car-km 7,647 285,000 .0268Time-related Car-day in use 2,030 3,563 .57
Add: Interest on capital 5,758 1.61Total car-day costs 7,788 2.18
Total long-rum variable cost, 1974
OPERATING 38,608INTEREST ON CAPITAL 10,505
TOTAL 49,113
119

Appendix H
FORMULA FOR CALCUILATING CARLOAD SHUNTING AND MARSHALING COSTS
Hypothetical figures for(XYZ Railway, 1974 projection)
I Total cars loaded(a) At wayside station 36,000(b) At depot stations
(i) In block trains (No. oftrains = 6,000) 120,000
(ii) In individual carloads 449,000
(c) Total 605,000
II Total shunting movements in originating depot stations(a) Block trains = 1 hr = equivalent 3.5 cars, industry
to marshaling yard plus 1 movement forattachment of brake van - equivalent4.5 movements x 6,000 trains 27,000
(b) Individual carloads = No. of cars loaded x2 (siding to marshaling yard plusmarshaling) 898,000
(c) Total 925,000
III Total shunting movements in destination depot stations
(a) Block trains = 1 hr = equivalent 3.5 cars,marshaling yard to industrialsiding plus 1 movement for detach-ment of brake van = equivalent 4.5movements x 6,000 trains 27,000
(b) Individual carloads = No. of cars receivedx 1 (marshaling yard to siding) 449,000
(c) Total 476,000
IV Total shunting moves, origin and destination at depotstations (II(c) and III(c)) 1,401,000
V Total permanent shunting locomotive-hours 436,000
VI Average number of shunting movements pershunting locomotive-hour 3.5
120

Appendix H (continued)
(The last two factors are introduced because on almost all railwaysin countries where the Bank operates thev afford the only means ofassessing the total number of shunting movements in yards. Shuntinglocomotive-hours are recorded as part of the standard statistics;the average number of shunting movements per shunting locomotive-hour can be determined either by a special study over a period ofnormal operation or from records maintained at dead-end terminalstations, where every car must of necessity be shunted and mar-shaled. Similar figures for intermediate depots may be misleadingas many cars may pass through without requiring shunting or re-marshaling. The desirability of maintaining records of totalshunting and marshaling movements by yard locomotives is mentionedin Appendix B, para. 12.02)
VII Estimated total shunting movements (V x VI) 1,526,000
VIII Therefore, assumed number of intermediate shuntingmovements (VII - IV) 125,000
IX Total freight car-km, loaded and empty (000)
(a) Block trains 72,000(b) Other freight trains 213,000
(c) Total 285,000
X Therefore, average distance between intermediateshunting movements, individual cars only. (It isassumed that block trains will not be remar-shaled en route)
= Total car-km on other trains (IX(b))
Assumed no. of Total cars loaded onintermediate movements + other than block trains(VIII) (I(a) + I(b)(ii))
213,000,000 = 350 km125,000 + 485,000
XI Formula for calculating average number of intermediate shuntingmovements for any given carload journey(Average distance between turnaround, minus average distance betweenintermediate 'shunting movements) divided by average distance betweenintermediate shunting movements. (The distance between turnaround is,of course, the distance between two successive loadings of the freightcar. In the case of the railway as a whole, or for individual blocksof traffic, the average distance between turnaround is determined by
121

Appendix H (continued)
dividing total car-km (loaded and empty) by total car loadings. In thecase shown above the average for the whole railway is 471 km; for carsmoving in block trains it is 600 km and for other cars 439 km. When
considering specific existing or p-;ospective traffics or consignmentsit will be necessary, however, to determine the amount of empty carhaulage if any, that each specific movements might entail, beforeand/or after the loaded movement. It will obviously be less costlyto consign traffic from a station where there is an adequate supplyof empty cars of a type suitable for carriage of the commodityconcerned, than from a station to which empties must be hauled.Similarly, where there is at the destination station sufficienttraffic to load the cars out again, the cost will be less thanwhere the cars must be back-hauled or transferred to another stationempty. In certain circumstances it may be found that empty haulageis involved both before and after the loaded haul, but usually itis only in the case of specialized types of cars, such as tank,livestock, and ore cars, that the ratio of empty to loaded haulageis 100 percent. For other existing traffic the statistics ofreceived and dispatched traffic by stations, if they are available,should help to indicate the proportion of empty haulage involved
and the distance between turnaround. Where prospective new trafficis concerned the characteristics of the movement will need to beassessed by officers of the Operating and C'ommercial Departments,having regard to existing car distribution and requirements).
XII Average cost per shunting movement in terminal and intermediatedepot stations = total long-run variable cost of yard operations
total shunting movements as in VII above.
XIII Total cost of shunting in terminal and intermediate yards forone carload at any given length of haul = 2 at origin + 1 atdestination + intermediate movements calculated as in XI x cost
per movement as in XII.
In the case of the hypothetical XYZ Railway the total yard costsin 1974 were estimated at US$7.1 million equivalent. Thus theaverage cost per shunting movement is forecast as US$4.64 andthe yard costs per average carload at varying distances betweenturnaround would be as follows:
122

Appendix H (continued)
Distance between Average No. Equivalent costturnaround, of shunting Total cost per car-km
km movements US$ Usc
400 3.2 14.85 3.71500 3.4 15.78 3.16600 3.7 17.17 2.86700 4.0 18.56 2.65800 4.3 19.95 2.49900 4.6 21.34 2.37
1oon 4.9 22.73 2.27
XIV Carloads dispatched from, and/or received at, wayside stationsAlthough it may be possible to determine the number of cars loaded at
wayside stations, difficulty will on most railways be encountered in asses-sing the number of loaded cars delivered to wayside stations. Analysis ofreceived traffic by commodity and average carload per commodity may providea fairly reliable figure. On many railways there are few wayside stationsthat generate traffic in or out, and in such cases operating officers canno doubt provide an accurate picture of the flow of cars involved. Caremust be taken to determine the number of train locomotive shunting movementsinvolved. If empty haulage is involved both before and after the loadedhaul, as the case may be if the consignment is from one wayside station toanother, then four movements will be involved--placing an emptv for loading,withdrawing the loaded car, placing the car for unloading, and finallywithdrawing the empty the empty. Having estimated the total movementsinvolved at wayside stations the cost per movement can be calculated fromthe total cost of train-locomotive shunting hours. The number and cost ofintermediate shunting movements should be calculated as in Section XI above.
123

* A" ao : = -
n~ ~ ~~~ . o C e D .,
..
0 v.) - C CA n: CL :'Cwr W ; tZrr 1 t- o
2~~~~~30 rC x QNgO, V :neo0D''% 0
.gOb )na
_ I - I 3 g '
0' 3 3o2 w : v : - ' J
* ~3 0u ;- -I- f , R ,° .oC,
'3~ § o 9'0
I~~ ~~~ I I ,.~r
'_ ;w1 ' s)'- o' L; _ 4~N -> _ 3r1sg~ 0 o 5 5
O7 s _ 2 4~330 1_3 ,0 2 h 5 ; r > >.
_ xn~~~~~~ 2 .: DJ_I§4. J '0I ..=S _*8
g 7 . >.: c ,, -> -, c&- rO3
,'7
_ J _4 2) "''' )l a: C . _C
) C' -o t t'0'C 'C -1
Z3~ ~ ~ ~ 0E ao C' 7-3' I >'t' _
-'~ ~~~~c a4 '0 . 3" ' 0ifpI) 'C w 4)' 4 ,s>
33~~~ ,t

Table J1
EMPTY RETURN IIAULAGE COSTS AND COMMODITY COSTS FROMAVERAGE ROUND-TRIP COSTS
(Example Based on an Actually Observed Case)
Down Traffic Up Traffic___________ _ __- A-B B-A
Average net trainload (tons) 400 100Average gross trainload (tons) 700 400Load including locomotive (tons) 800 500No. of cars per train -- loaded 20 7
-- empty 2 15-- total 22 22
Length of haul, km 700 700Locomotive-km, shed to shed 710 710Shunting movements per car at terminals 3 3No. intermediate shuntingCar-days per car journey -- loaded 6 6
-- empty 4 4Net ton-km 280,000 70,000Gross trailing ton-km 490,000 280,000Gross ton-km, including locomotive 560,000 350,000
Long-Run Variable Costs
VI Unit Cost per Cost per train-journey x$) Cost per train-journey ($)
unit Loaded Empty Total Loaded Empty Total'$) Proportion Proportion Proportion ProDortion
Documentat4on Car consigned 1.80 36.00 - 36.00 12.60 - 12.60Yard costs Car handled 4.64 278.40 27.84 306.24 97.44 208.80 306.24Track costs Gross ton-km .00058 311.80 13.00 324,80 101.50 101.50 203.00Train costs Train-km .322 204.91 20.49 225.40 71.72 153.68 225.40Locomotive costs:
Fuel, lubricants etc. Gross trailington-km .000135 63.50 2.65 66.15 18.90 18.90 37.80
Other costs Loco -km .543 370.11 15.42 385.53 192.77 192.76 385.53Car-day costs Car-day 2,18 261.60 17.44 279.04 91.56 130.80 222.36Car-km costs Car-km .0268 375.20 37.52 412.72 131.32 281.40 412.72
TOTAL 1,901.52 134.36 2,035.88 717.81 1,092.84 1,810.65

Comments on Table Jl:
(i) Down traffic in this example exceeds up traffic in ratio of 4:1.
(ii) If the characteristics of the traffic flows are such that it is impos-
sible to reduce this imbalance, then in accordance with conventional
costing concepts the traffic moved in either direction much bear the
cost of empty return movement on the respective back-hauls, as follows:
Down traffic -- $ 1,901.52 + 1,092.84 = $ 2,994.36 per train =
$ 7.49 per ton (average) = 1.07 c per net ton-km (average).
Up traffic -- $ 717.81 + 134.36 $ 852.17 per train $ 8.52per ton (average) = 1.22 ¢ per net ton-km (average)
(Individual commodities will, of course, vary from average
according to loability, type of car, and other factors (see
Table I2))
(iii) If the possibility exists to increase up traffic by offering attrac-
tively low rates, then it will be seen that the marginal cost of
Increasing the up trainload from 100 tons to 400 tons is only $225.23
($ 2,035.88 minus $ 1,810.65) = $ 0.75 per ton = 0.11 i per ton-km.
Any rate in excess of these figures will contribute to fixed costs
and profit. The danger here is that very low rates may stimulate up
traffic to the extent that ultimately up traffic may exceed down
traffic, in which event marginal cost pricing would no longer be
relevant. It is suggested that, if such an eventuality should be
considered possible, no rate should be set below the long-run cost
of moving traffic in full trainloads without empty return haulage,
i.e., $ 4.75 per ton in the above example ($ 1,901.52 t- 400).
(iv) Alternatively, if there should be strong evidence of the potential for
increasing up traffic, the cost of empty haulage in the up direction
could be considered as unused Capacity Cost, and excluded from the
calculation of long-run variable costs for purposes of fixing the
lower limit for rates on existing traffic. Such rates could then be
reduced, if necessary, by about $ 2 per ton, at which level they should
presumably be sufficiently attractive to generate new traffic to absorb
the excess capacity in the up direction. This concept of Capacity
Costs would be particularly valuable if any threat of diversion of
existing traffic to competing modes should exist.
126

Table J2
COMMODITY COSTS DERIVED FROM AVERAGETRAIN ROUND-TRIP COSTS
(As shown in Table Il)
CoTmnodity 1/ Ilides Tea Cotton Coffee Groundnuts Total(dry) Lint
No. of cars per train 2/ 2 2 4 6 6 20Average carload (tons)- 8 12 15 20 30 20Net tons per train 16 24 60 120 180 400Cross tons per train 43 51 114 202 262 672Net ton-km 11,200 16,800 42,000 84,000 126,000 280,000Gross ton-km 30,100 35,700 79,800 141,400 183,400 470,400Long-run variable cost ($)
Documentation 3.60 3.60 7.20 10.80 10.80 36.00Yard costs 27.84 27.84 55.68 83.52 83.52 278.40Loco., train and track costs4/ 60.80 72.11 161.20 285.63 370.58 950.32Car-day costs 5/ 26.16 26.16 52.32 78.48 78.48 261.60Car-km costs 5/ 37.52 37.52 75.04 112.56 112.56 375.20
TOTAL, LOADED HAUL 155.92 167.23 351.44 570.99 655.94 1,901.52
Empty return haulage5/ 109.28 109.28 218.58 327.85 327.85 1,092.84
TOTAL, LONG-RUN VARIABLE COST 265.20 276.51 570.02 898.84 983.79 2,994.36
Cost per net ton ($) 16.57 11.52 9.50 7.49 5.47 7.49Cost per net ton-km (cents) 2.37 1.65 1.36 1.07 .78 1.07
NJ
Notes
1/ The number of commodities carried over any section of the line will vary widely, but all commodities having the same load-ahility and carried in cars of comparable type and capacity can be consolidated in one calculation.
2/ This is a simplified example. The average train will normally consist of cars and fractions of cars. The makeup will bederived by dividing total car-km of each commodity by total train-km.
3/ Average carload of each commodity can be assessed in a ntimber of ways, e.g.:(a) total tonnage divided by total cars loaded;(b) net ton-km divided by car-km, or, if statistics by commodity are not available;(c) examination of waybills for a representative period.
4/ Simplified calculation, in ratio of gross trailing ton-km (see paras. 2.116 and 2.117 in Chapter II).
5/ To simplify this example the commodities selected are all carried in the same type of boxcar. Cost per car and the ratioof empty return haulage are therefore the same for all commodities. In practice there will be differences between cars ofvarying types, and the ratio of empty haulage will vary according to the suitability or otherwise of the various cars forloading commodities for the backhaul.

Appendix K
FREIGHT TRAFFIC COST SHEET FOR CARLOAD TRAFFIC
1. Commodity Maize2. From Various to Port3. Length of haul 960 km (average)4. Percentage of empty back-haul 40 %5. Type of freight car - bogie/4-wheeler/tank/hopper/livestock/box/
gondola/flat6. Average tare weight of car 15 tons7. Average net load 35 tons8. Average gross load 50 tons9 Turnaround time - actual/estimated 8.5 days
10. No. of shunting movements involved:(a) Train-locomotive shunting(b) Yard-locomotive shunting(c) Total
or (d) All-line average 4.811. Other charges - Collection -
Delivery -
Loading -
Unloading -
Transshipment-Port charges $10 per car
12. Duration of traffic Permanent13. Can traffic be carried in cars now being back-hauled empty between
stations indicated? No14. Is there surplus capacity on existing trains to accommodate this traffic
without increasing train mileage over the whole or any section of thehaul? No
15. Any other relevant information.
Calculation of Cost
Cost per carjourney
Operation ($)
DocumentationUnit cost $ 1.80 per consignmentNo. of cars per consignment 3.6 (average) 0.50
Terminal and intermediate yard costs:Unit cost $ 5.10 per car movementNo. of units 4.8 (as in 10 b or d) 24.48
128

Appendix K (continued)
Cost per carjourney
Operation ($)
Wayside station shunting:Unit cost $ per car movementNo. of units (as in 10a)
Freight-car costs:(a) Provision
Unit cost $ 2.18 per car-dayTurnaround time 8.5 days ( as in 9) 18.53
(b) MovementUnit cost $ 0.0268 per car-kmNo. of units 1,344 (as in 3 + 4) 36.02
Line-haul costs:Unit cost $ 0.00226 per gross trailing ton-kmNo. of units (3 x 8) + (3 x 6 x 4)
(960 x 50) + (960 x 15 x .40)- 53,760 121.50
Collection $ per ton xDelivery $ per ton xLoading $ per ton xUnloading $ per ton xTransshipment $ per ton xPort charges $10 per car 10.00
Long-run variable cost per car journey $211.03Per net ton $ 6.03Per net ton-km 0.63q
129

Appendix L
FREIGHT TRAFFIC COST SHEET FOR TRAINLOAD TRAFFIC
1. Commodity Cement clinker2. From A to B3. Length of haul 400 km4. Percentage of empty back-haul 1005. Type of wagon -- bogie/4-wheeler/tank/hopper/livestock/box/gondola/flat6. Average no. of cars per train 14 plus brake van 157. Average tare weight of train 270 tons8. Average net load 560 tons9. Average gross load 830 tons
10. Type of locomotive Diesel11. Weight of locomotive 80 tons12. Locomotive-km (including shed/station and station/shed) 415 km13. No. of shunting moves:
(a) Train-locomotive shunting 2(b) Yard-locomotive shunting 2(c) Total 4
14. Turnaround time -- actual/estimated 4 days
15. Other relevant information
Calculation of Cost
Cost pertrain journey
Operation $
Documentation $1.80 per unit 1.80Terminal costs
(a) At wayside stationsUnit cost $28.62 per train movement 57.24
(b) At depot stationsUnit cost $22.95 per train movement 45.90
Freight-car costs(a) Provision
Unit cost $2.18 per car-day 130.80No. of units (6 x 14)* = 60
(b) MovementUnit cost $0.0268 per car-km 321.60No. of units (3 x 6) x 1 + (4)* 12,000
Locomotive costsUnit cost $0.653 per loco-km 541.99No. of units 830 (as in 12 + 4)*
* Line numbers above.
130

Appendix L (continued)
Cost pertrain journey
Operation $
Train costsUnit cost $0.322 per train-kmNo. of units 800 (as in 3 + 4)* 257.60
Track etc. costsUnit cost $0.00058 per gross ton-km
(including locomotiveNo. of units (9 x 3)* + (11 x 12)* + (7 x 3)* +
(11 x 4)*506,400 293.71
Long-run variable cost per train-journey $1,650.64Per net ton $ 2.95Per net ton-km 0.74¢
* Line numbers above.
131

Appendix M
FREIGHT TRAFFIC COST SHEET FOR CALCULATION OF LONG-RUN VARIABLE COST
AT VARYING LENGTHS OF HAUL
(XYZ Railway: Branch C to B, Mainline B to Port A)
Commodity: Groundnuts Percentage of empty back-haul: 40 Average carload: Tons
Terminal costs per car: Documentation 1.80 Net 35
Shunting and marshaling 15.39 Tare 16
Port charges 5.00 Gross 51
22.19
Intermediate Freight-car costs
Length of Terminal marshaling Car-day Car-km Other-line Long-run variable cost
haul, km Costs, $ costs, $ costs/l, $ costs, $ costs/2, $ Per car, $ Per net ton, $ Per net ton-km, c
20 22.19 - 4.33 0.70 2.34 29.56 0.84 4.20
30 22.19 - 4.53 1.05 3.51 31.28 0.89 2.97
40 22.19 - 4.63 1.40 4.68 32.90 0.94 2.35
50 22.19 - 4,74 1.75 5.85 34.53 0.99 1.98
100 22.19 - 5.56 3.50 11.71 42.96 1.23 1.23
200 22.19 - 7,00 7.00 23.42 59.61 1.70 0.85
300 22.19 - 8.45 10.50 35.13 76.27 2,18 0.73
400 22.19 5.13 9.89 14.00 46.84 98.05 2.80 0.70
500 22.19 5.13 11,33 17.50 58.55 114.70 3.28 0.63
600 22.19 5.13 12.77 21.00 70.26 131.35 3.75 0.62
700 22.19 5.13 14,21 24.50 86,10 152.13 4.35 0.62
800 22.19 10.26 15.66 28.00 101.94 178.05 5.09 0.64
900 22.19 10.26 17.10 31.50 117.79 198.84 5.68 0.63
1000 22,19 10.26 18,54 35.00 133.63 219.62 6.27 0.63
/I Car turnaround includes 1 day loading, I day unloading, plus running time at 200 kin/day, loaded and empty.
/2 Unit costs as in Table 2.4.

Appendix N
PRO FORMA SEPARATION OF COSTS OF PASSENGER, MAIL, AND EXPRESS TRAFFIC
(Hypothetical Case of XYZ Railway)
I Projection of Future Costs (000 units)
1970 long- Projected Projected
run long-run Interest totalvariable operating on long-run
Kind of cost costs at Ratio of variable capital variable1974 prices output cost, (Appendix cost,(Table 2.1) '74:'70 1974 F) 1974
Track etc. costs 2,553 1.00 2,553 1,031 3,584
Train costs 5,825 1.00 5,825 - 5,825
Locomotive costs:Diesel, mainline 3,074 1.65 5,072 910 5,982
Steam, mainline 3,355 0.00 - - -
Diesel, shunting 123 2.00 246 48 294
Steam, shunting 155 0.50 78 8 86
Railcars 1,481 1.00 1,481 630 2,111
Passenger-car costs:First-class cars 940 1.00 940 564 1,504
Second-class cars 1,175 1.00 1,175 705 1,880
Third-class cars 1,81.5 1.00 1,815 1,089 2,904
Restaurant andkitchen cars 400 1.00 400 240 640
All other cars 700 1.00 700 420 1,120
Yard costs 78 1.00 78 12 90
Total 21,674 20,363 5,657 26,020
II Car and gross ton-km
Car-km, Gross ton-km
Kind of car (000) (million)
First-class cars 15,000 600
Second-class cars 25,000 875
Third-class cars 60,000 1,800
Restaurant and kitchen cars 8,000 290
Canteen cars 2,000 60
Mail cars 6,000 180
Express cars 5,000 160
Brake and baggage-cars 13,000 325
TOTAL 134,000 4,290
133

Appendix N (continued)
III Allocation of car-km to services (000 units)
First Second ThirdKind of car Class class class Mail Express
Passenger-carrying cars 15,000 25,000 60,000 - -
Restaurant & kitchen cars/l 6,000 2,000 - - -
Canteen cars/2 - 500 1,500 - -
Mail and express - - - 6,000 5,000
Brake & baggage cars/3 2,255 2,955 6,610 645 535
TOTAL 23,255 30,455 68,110 6,645 5,535
Percent 17.4 22.7 50.9 4.9 4.1
/1 Restaurant cars are estimated to be used 75 percent by first-class
passengers, 25 percent by second-class passengers./2 Canteen cars are estimated to be used 75 percent by third-class
passengers and 25 percent by second class passengers./3 Brake and baggage vans are pro rated to other car-km.
IV Allocation of gross ton-km to seririces/4 (million)
Kind of car First Second Thirdclass class class 'Mail Express
Passenger-carrying cars 600 875 1,800 - -
Restaurant & kitchen cars 218 72 - - -
Canteen cars 15 45 - -
Mail and express - - 180 160
Brake & baggage cars 56 74 165 16 14
TOTAL 874 1,036 2,010 196 174
Percent 20.4 24.2 46.8 4.6 4.0
/4 The allocations follow the same pattern as for car-km.
134

Appendix N (continued)
V. Allocation for long-run variable cost (000 units)
Kind of cost Basis of First Second ThirdAllocation class class class Mail Express
Track, etc. costs Gross ton-km 731 866 1,676 168 143Train costs Car-km 1,014 1,322 2,965 285 239Locomotive costs Car-km 1,041 1,358 3,046 293 244Railcar costs Seat-km 352 704 1,055 - -Passenger-car
costs Actual 1,504 1,880 2,904 - -
Restaurant-carcosts As in III 480 160 - - -
Other car costs Car-km 97 148 350 287 238Yard costs Car-km 80 107 240 23 20
TOTAL 5,299 6,545 12,236 1,056 884
Add: express terminal costs (Section V of Appendix A) 500
1,384
135

: ~ ~ ~ ~ ~ ~ ~ ~ ~ ~ ~ ~ ~ ~ ~ ~ ~ ~ ~ ~ ~ ~ ~ 7 5- _ G
0IeC -4 ..~o
0~ r . - 2 .3 4 0o _
r~~~~~0 -a r.
-~~~~I S4 .4- 7
-41 o- o . _, 3 o
. ~ ~~~~~ ~ ~ -|- 3 . -_=
. 7 5 0 0c..7 °0 00w4 o -- 0- .0S
'C G4. 0. O7 °7 .0 0> $0
W~~~~~0 - _ 7oO C7 7 _O07 4 b<x
co o4~ , .. .... ...
W U r q vo °o o 2
c c
e X ¢, _e t ' C ,->
C C $00 0' ° e' -
_CO 00 4 2 G. O CC O _G u |' c O.u .Uc
e 17 C s 7.7 eC.CC -° s o 000c; o
07000.0 0 0...C 77C C - 00136

o~~ ~ a 3- r
e ~ ~ ~ ~~~ N 0 -3 3- -
r; r 3- e ._ 0 _ 3- 4_
7-
I'~~~~e '
*~ ~~~ 3- .0 4
4 1 N n G c~~3 - -- S '- _ -Bv:
_~ ~ ~ *- - N G
4 :wsE~g 1 _.
u K C 2 _ -. c.4 -c
C~~~~~~~~ c3 ._ -_- c
a 33 - 3- 3- 3-~~13