world an increasingly globalised input-output analysis...
TRANSCRIPT

Please cite this paper as:
Wixted, B., N. Yamano and C. Webb (2006), “Input-Output Analysis in an Increasingly Globalised World:Applications of OECD's Harmonised International Tables”,OECD Science, Technology and Industry Working Papers,2006/07, OECD Publishing.http://dx.doi.org/10.1787/303252313764
OECD Science, Technology andIndustry Working Papers 2006/07
Input-Output Analysis inan Increasingly GlobalisedWorld
APPLICATIONS OF OECD'S HARMONISEDINTERNATIONAL TABLES
Brian Wixted, Norihiko Yamano,Colin Webb
Unclassified DSTI/DOC(2006)7 Organisation de Coopération et de Développement Economiques Organisation for Economic Co-operation and Development 31-Aug-2006 ___________________________________________________________________________________________
English - Or. English DIRECTORATE FOR SCIENCE, TECHNOLOGY AND INDUSTRY
INPUT-OUTPUT ANALYSIS IN AN INCREASINGLY GLOBALISED WORLD: APPLICATIONS OF OECD'S HARMONISED INTERNATIONAL TABLES STI/WORKING PAPER 2006/7 Statistical Analysis of Science, Technology and Industry
Brian Wixted, Norihiko Yamano and Colin Webb
JT03212914
Document complet disponible sur OLIS dans son format d'origine Complete document available on OLIS in its original format
DST
I/DO
C(2006)7
Unclassified
English - O
r. English

DSTI/DOC(2006)7
2
STI Working Paper Series
The Working Paper series of the OECD Directorate for Science, Technology and Industry is designed to make available to a wider readership selected studies prepared by staff in the Directorate or by outside consultants working on OECD projects. The papers included in the series cover a broad range of issues, of both a technical and policy-analytical nature, in the areas of work of the DSTI. The Working Papers are generally available only in their original language � English or French � with a summary in the other.
Comments on the papers are invited, and should be sent to the Directorate for Science, Technology and Industry, OECD, 2 rue André-Pascal, 75775 Paris Cedex 16, France.
The opinions expressed in these papers are the sole responsibility of the author(s) and do not necessarily reflect those of the OECD or of the governments of its member countries.
http://www.oecd.org/sti/working-papers
© Copyright OECD/OCDE, 2006

DSTI/DOC(2006)7
3
INPUT-OUTPUT ANALYSIS IN AN INCREASINGLY GLOBALISED WORLD: APPLICATIONS OF OECD�S HARMONISED INTERNATIONAL TABLES*
Brian Wixted**, Norihiko Yamano*** and Colin Webb***
ABSTRACT
Input-output (I-O) analysis has been around for nearly 70 years, and although its use has ebbed and flowed over the years, it has always retained a dedicated core of users in the worldwide research community. Recently however, there seems to have been a notable increase in the use of input-output tables in empirical analyses addressing a wide range of policy issues. This is partly due to the improved availability and quality of national input-output tables as well as modern IT capabilities allowing more complex analyses to be undertaken by more researchers. A quick glance through recent editions of the journal Economic Systems Research confirms the variety of research topics that can benefit from input-output analysis as does a recent user survey conducted by OECD.
This paper is primarily aimed at a non-technical audience and focuses on the applications and important policy questions that can benefit from the availability of harmonised input-output tables, such as those developed over the years by the OECD. The additional benefits of linking such tables via bilateral trade matrices, to produce inter-country input-output models, are also outlined. The paper describes current uses of such models and their potential contribution to understanding a range of issues such as global value chains and production fragmentation; technology flows; productivity and determinants of growth; industrial ecology and sustainable development. Current constraints of the international harmonised tables produced by OECD are also discussed and overviews of relevant literature are included which cover the economic and environmental questions that can be addressed. By raising awareness of the analytical possibilities of input-output tables amongst policy analysts, we hope to encourage further widespread use of OECD�s harmonised input-output tables and provide the impetus for continued development of multi-country input-output tables linked by trade data.
Technical details of how national and OECD harmonised input-output tables are constructed, and in particular how the closely related supply-use tables are converted into symmetric input-output tables, are not covered here � they are described in a related paper (Yamano and Ahmad, 2006).
* The authors would like to thank OECD colleagues for their guidance, comments and suggestions. In particular, Nadim Ahmad, Dirk Pilat and Andrew Wyckoff.
** Visiting Scholar, Centre for Policy Research on Science and Technology, Simon Fraser University, Vancouver.
*** OECD, Directorate for Science, Technology and Industry, Economic Analysis and Statistics Division.
DSTI/DOC(2006)7
4
ANALYSE DES ENTREES-SORTIES DANS UN CONTEXTE DE MONDIALISATION GENERALISÉE: UTILISATION DES TABLEAUX INTERNATIONAUX HARMONISÉS DE
L�OCDE*
Brian Wixted**, Norihiko Yamano*** et Colin Webb***
RÉSUMÉ
L�analyse des tableaux d�entrées-sorties existe depuis bientôt 70 ans et si leur utilisation a connu des hauts et des bas à travers le temps, ces tableaux suscitent toujours l�intérêt d�un noyau d�utilisateurs du monde entier, spécialisés dans la recherche. Depuis peu, l�exploitation de ces tableaux a toutefois pris de l�ampleur et donne lieu à des analyses empiriques portant sur un grand nombre de questions d�ordre politique. Cela est en partie dû à l�amélioration de la disponibilité et de la qualité des tableaux d�entrées-sorties ainsi qu�aux capacités des technologies de l�information modernes qui désormais permettent aux chercheurs de mener à bien des analyses plus complexes. Les dernières éditions du journal Economic Systems Research, tout comme les réponses à l�enquête menée récemment par l�OCDE auprès de ses utilisateurs, confirment la variété des sujets traités à partir d�analyses des entrées-sorties.
Ce document est principalement destiné à des lecteurs n�ayant pas nécessairement de compétence technique en ce domaine ; il a trait aux utilisations des tableaux entrées-sorties et à d�importantes questions d�ordre politique auxquelles peuvent répondre des données d�entrées-sorties harmonisées, comme celles développés par l�OCDE au fil des années. Il souligne également l�intérêt de pouvoir lier de tels tableaux entre pays, par le biais de matrices de commerce bilatéral, afin de produire un modèle d�entrées-sorties international. Ce document décrit comment les modèles d�entrées-sorties sont utilisés de nos jours et illustre également dans quelles mesures ces tableaux peuvent contribuer à comprendre les chaînes de valeur mondiales et le morcellement de la production ; les évolutions de la technologie ; la productivité et les déterminants de la croissance ; l�impact de l�industrie sur l�environnement et le développement durable. Cette étude examine aussi les contraintes actuelles des tableaux harmonisés compilés par l�OCDE et fournit une vue d�ensemble des ouvrages consacrés à ce sujet qui traitent de préoccupations d�ordre économique et environnemental. L�OCDE souhaite encourager l�utilisation de ses tableaux harmonisés d�entrées-sorties, car ils offrent des multitudes de possibilités pour les analystes politiques, et l�organisation entend initier un développement suivi de tableaux d�entrées-sorties pour plusieurs pays en utilisant les données du commerce.
Ce document ne donne pas de détails techniques concernant la construction des tableaux d�entrées-sorties par pays ou des tableaux harmonisés de l�OCDE ; il ne décrit pas comment les tableaux de l�offre et de la demande (étroitement liés aux tableaux d�entrées-sorties) sont convertis en matrices entrées-sorties symétriques � Ces informations sont néanmoins rapportées dans un autre document (Yamano et Ahmad 2006).
* Les auteurs tiennent à remercier leurs collègues de l�OCDE pour leurs conseils, commentaires et suggestions. En particulier, Nadim Ahmad, Dirk Pilat et Andrew Wyckoff.
** Centre de Recherche Politique sur la Science et la Technologie, Université Simon Fraser, Vancouver.
*** OCDE, Direction de la Science, de la Technologie et de l�Industrie, Division de l�Analyse Economique et des Statistiques.
DSTI/DOC(2006)7
5
TABLE OF CONTENTS
1. INTRODUCTION 6 2. BACKGROUND ON INPUT-OUTPUT DATA AND ANALYTICAL METHODOLOGIES 7
2.1 Basic input-output economics 7 2.2 Databases of international input-output transactions 12
3. INTERNATIONALISATION OF ECONOMIC VALUE CREATION 15 3.1 Clustering, global value chains and production fragmentation 18 3.2 Embodied technology 25 3.3 Productivity and the determinants of growth 27
4. MEASURING MATERIAL AND ENVIRONMENTAL FLOWS 29 4.1 Industrial ecology 29 4.2 CO2 and greenhouse gases 30
5. CONCLUDING REMARKS 33 5.1 A starting point, not an end point � the limitations of the database 33 5.2 Input-output as a framework for detailed analysis 34 5.3 Benefits of OECD�s international Input-Output Database 34
REFERENCES 35 ANNEX A. THE INDUSTRY CLASSIFICATION OF THE OECD INPUT-OUTPUT TABLES 41 ANNEX B. DISTINCTION BETWEEN SINGLE AND MULTI-REGIONAL INPUT-OUTPUT TABLES 43 ANNEX C. CALCULATING �EMBODIED� ACTIVITIES IN INPUT-OUTPUT ANALYSIS 44 ANNEX D. USERS OF OECD INPUT-OUTPUT DATABASES 45
DSTI/DOC(2006)7
6
1. INTRODUCTION
It is increasingly clear that although the phenomenon of global production is not new, the speed at which it is deepening and the breadth of its transmission across countries is remarkable. Analysis of changing trade patterns, technology flows and the environmental impact of human activity such as carbon dioxide (CO2) emissions, all separately require data that integrates the production system and international trade. Therefore, there is an ongoing need for new data and new analytical techniques to contribute to a greater understanding of what is happening to guide business leaders, policy makers, analysts and educators.
With this problem in mind, the OECD�s Directorate for Science, Technology and Industry (DSTI) continues to develop harmonised input-output tables for analytical use � the latest set based around the year 2000. Also, in the context of a project on global value chains (GVCs), such tables are being linked, via bilateral trade matrices, to produce an international inter-country input-output model that includes both OECD countries and important non-OECD economies such as Brazil, China and India. This is in the spirit of a similar exercise carried out earlier at the OECD in order to track CO2 emissions embodied in international trade in goods (Ahmad and Wyckoff, 2003). However, one important feature of this current project is the possibility of making an OECD inter-country data set, or at least the required tools, publicly available.
DSTI has often led the way in the production and dissemination of harmonised input-output datasets. The first edition (OECD 1995) covered 10 OECD countries and the subsequent 2002 edition (OECD 2002) covered 20 countries (over a range of years around the mid-1990s). 1 The 2006 version includes 34 economies (including 7 major non-OECD economies) with a common base year around 2000.
The main purpose of this paper is to show how harmonised input-output tables, linked or not, can be of benefit to a large number of analysts. The paper is split into two main components. The first discusses in general terms, some history and background to the construction of input-output (I-O) tables and goes on to discuss the benefits of an international inter-country input-output model. This is followed by some examples of existing analyses and future possible research, based on inter-country input-output tables, structured around the themes of economic value creation and physical production chains (industrial ecology). As this paper aims at being a non-technical introduction, it cannot do full justice to the analytical literature that exists on the topics it covers. However, it is hoped that the current paper shows that analysis based on input-output tables can provide key insights into the changing industrial architecture of the world economy at the beginning of the 21st Century.
1 . www.oecd.org/std/io-tables/data
DSTI/DOC(2006)7
7
2. BACKGROUND ON INPUT-OUTPUT DATA AND ANALYTICAL METHODOLOGIES
2.1 Basic input-output economics
�[The pioneer of input-output analysis Wassily] Leontief has argued that if you want to explain an economy to high school students, it is extremely confusing if you begin to talk about supply and demand curves. Nobody ever saw a supply or a demand curve, while the movement of commodities and services between different sectors, which provides the logic of input-output analysis, can be observed and described.� (Amsden 1995:280)
Input-output analysis has been around for nearly 702 years and is constructed on �the almost banally simple idea that flows should be registered in a matrix, simultaneously by origin and by destination� (Augusztinovics 1995: 272). Commodities are produced and they are used. The basic structure of an input-output table (the transaction matrix) is shown in Figure 1.
Essentially, a regional (most typically national) input-output table can be divided into five sections. The basic layout is of suppliers (rows) and users (columns):
• The first section is the intermediate goods3 matrix that provides data on the interactions between domestic suppliers and domestic users of domestically produced raw materials, industrial components and services. It is a square matrix of an equal number of supplying and user industries. The values of the transactions recorded in the table can be either at basic or purchaser�s prices.4
• The second section (below the intermediate transactions matrix) consists of rows showing the adjustments required to derive total intermediate inputs used in production at purchasers� prices. These include imports of intermediate goods and services; any taxes less subsidies (net taxes) on intermediate products; and any VAT and import duties paid on intermediate products.
2 . Leontief 1936. Although the original idea can be attributed to François Quesnay and his Tableau
économique (1759).
3. Intermediate or producer goods are those used in the production of other goods, rather than final consumption. They can include raw materials such as mineral ores, partly processed products such as steel, manufactured products such as car engines or business activities such as accounting services. Some goods (e.g. milk) might be consumed or used as an intermediate input into other production processes (making chocolate etc).
4. The United Nations (1999) makes the following commentary on these methods: �The preferred method of valuation is at basic prices, especially when a system of VAT, or similar deductible tax, is in operation, although producer�s prices may be used when valuation at basic prices is not feasible � The basic price is the amount receivable by the producer from the purchaser for a unit of a good or service produced as output minus any tax payable, and plus any subsidy receivable, on that unit as a consequence of its production or sale. It excludes any transport charges invoiced separately by the producer; the producer's price is the amount receivable by the producer from the purchaser for a unit of a good or service produced as output minus any VAT, or similar deductible tax, invoiced to the purchaser. It excludes any transport charges invoiced separately by the producer.�

DSTI/DOC(2006)7
8
• The third section comprises of the rows that make up value added (at basic prices) such as wages and salaries and gross operating surplus.
• The fourth section, to the right of the intermediate goods matrix, accounts for the supplies of goods that are not consumed by domestic industries. The columns therefore include such categories as final consumption (both by households and general government), gross fixed capital formation (investment) and exports.
• Finally, imported goods for final use, and the required taxes less subsidies associated with transactions in these products (and those shown in Section 4) can be added to Section 4 to provide total final use at purchaser�s prices (section 5).
Figure 1. The basic structure of an input-output table
Priv
ate
dom
estic
con
sum
ptio
n
Gov
ernm
ent c
onsu
mpt
ion
Gro
ss fi
xed
capi
tal f
orm
atio
n
(GFC
F)
Cha
nges
in in
vent
orie
s
Exp
orts
Gro
ss O
utpu
t at b
asic
pric
es
Gross Output at basic prices (i.e. total inputs)
a. Compensation of employees b. Gross operating surplus
Domesticinvestment (GFCF)
matrix
Domesticintermediate
matrix
Total use of domestic products at basic prices Imported intermediate productsTaxes, less subsidies, on intermediate products
c. Taxes, less subsidies, on production
Importedintermediate products
matrix
Importedinvestment (GFCF)
matrix
Total intermediate inputs at purchasers pricesValue Added at basic prices (a+b+c)
1
2
3
4
5
Because the columns represent the destination of inputs, and the rows sum to total output of a sector, the matrix represents a national approach to double entry bookkeeping; namely that the total input and output of a sector are equal to each other. To cover all intermediate inputs, the matrix of domestic interactions needs to be complemented with a matrix covering imported goods which has a similar structure. For certain analyses (e.g. Papaconstantinou et al. 1996), additional matrices (again with the same structure) showing transactions in investment goods, both domestically produced and imported are highly desirable � though not readily available (see OECD, 1995).

DSTI/DOC(2006)7
9
A simple example of this structure is given in Table 1. In the first part of the table it is possible to see that the output of industries (Row totals) equals the total value of industry activity � consumption, or use, of the output of other industries plus value added.
Table 1. A simple example of a domestic transactions input-output table
Transaction matrix
Users
Suppliers
Agr
icul
ture
Min
ing
Man
ufac
ture
s
Util
ities
Con
stru
ctio
n
Ser
vice
s
Priv
ate
final
con
sum
ptio
n
Gov
ernm
ent
final
con
sum
ptio
n
GFC
F
Exp
orts
Indu
stry
Out
put
at b
asic
pric
es
Agriculture 2731 3 8260 36 59 615 962 62 567 8568 21863Mining 4 282 2013 3979 188 60 28 0 210 5528 12292Manufactures 3322 291 40218 480 8004 16999 16896 2340 8573 113777 210900Utilities 983 53 2400 4395 85 3458 6184 14 439 238 18249Construction 121 70 565 135 14103 9509 405 530 33974 832 60244Services 2884 1078 28400 1404 9339 106994 126180 87409 16752 55512 435953Imports 1779 1029 71117 1878 7572 33964 24189 1085 17771 81863Net taxes on products 129 67 497 706 249 8651 22908 -152 10233 0TOTAL use at purchaser's prices 11953 2873 153470 13013 39599 180250 197752 91288 88519 266318
Value Addedat basic prices 9910 9419 57430 5236 20645 255703
Industry Outputat basic prices 21863 12292 210900 18249 60244 435953
Coefficients
Users
Suppliers
Agr
icul
ture
Min
ing
Man
ufac
ture
s
Util
ities
Con
stru
ctio
n
Ser
vice
s
Priv
ate
final
con
sum
ptio
n
Gov
ernm
ent f
inal
con
sum
ptio
n
GFC
F
Exp
orts
Agriculture 0.12 0.00 0.04 0.00 0.00 0.00 0.00 0.00 0.01 0.03Mining 0.00 0.02 0.01 0.22 0.00 0.00 0.00 0.00 0.00 0.02Manufactures 0.15 0.02 0.19 0.03 0.13 0.04 0.09 0.03 0.10 0.43Utilities 0.04 0.00 0.01 0.24 0.00 0.01 0.03 0.00 0.00 0.00Construction 0.01 0.01 0.00 0.01 0.23 0.02 0.00 0.01 0.38 0.00Services 0.13 0.09 0.13 0.08 0.16 0.25 0.64 0.96 0.19 0.21Imports 0.08 0.08 0.34 0.10 0.13 0.08 0.12 0.01 0.20 0.31Net taxes on products 0.01 0.01 0.00 0.04 0.00 0.02 0.12 0.00 0.12 0.00TOTAL use at purchaser's prices 0.55 0.23 0.73 0.71 0.66 0.41 1.00 1.00 1.00 1.00
Value Addedat basic prices 0.45 0.77 0.27 0.29 0.34 0.59
Industry Outputat basic prices 1.00 1.00 1.00 1.00 1.00 1.00
Source: Eurostat, OECD aggregation of 2000 input-output table for the Netherlands.
�Technological coefficients�. For a Total transaction matrix, the coefficients in the imports row are distributed amongst the using industries.
DSTI/DOC(2006)7
10
The second part of Table 1 shows the industry coefficients. They are calculated as the ratio of industry usage of inputs relative to total output. So in this example we can see the different input coefficients and as we would expect, the column totals sum to unity.
Because this information architecture is not just a useful approach to presenting data on the structure of an economy but also for ensuring that calculations of GDP are accurate, input-output, particularly supply-use (product-industry), data collection has been incorporated into internationally recognised systems of national accounting. Many countries currently compile national input-output and/or supply-use tables in line with the recommendations of a System of National Accounts, 1993 (SNA93) 5 or in Europe, the European System of Accounts, 1995 (ESA95). In fact, many countries now use a supply-use and input-output framework to derive key economic measures and balance estimates of GDP calculated from the expenditure accounts, production accounts and income accounts.
By converting the initial monetary values in the transactions matrices (shown above) to ratios (coefficients) it is possible to examine the underlying system of interactions and interdependencies.6 These coefficients can be mathematically modelled7 to examine which industries are important to others and since a Leontief input-output table represents a complete system of all interactions, for a given year, such modelling can take account of both direct and indirect flows.
For example, to estimate what additional inputs would be needed if the motor vehicle industry increased production by one unit, we would need to measure the following: i) first round, direct effects on the industries that supply the motor vehicle industry with steel, rubber, plastics and electronics etc; and ii) a range of secondary (indirect) effects as these supplier industries themselves require additional inputs for their production in order to meet the additional demand coming from the motor vehicle production system.
Fortunately, an eloquent solution exists to solve such problems via the use of the �Leontief inverse matrix�.8 This describes how many units of one good or service have to be produced at any stage of the value added chain in order to produce one unit of the final demand for goods or services. For example, Figure 2 below shows estimates of service sector value added embodied in manufacturing goods and points to the increasing importance of service activities for manufacturing and the economy as a whole.
Going a small step further, the �Leontief inverse matrix� can then be used to estimate the follow-on effects, (impacts on all industries) resulting from a given increase in demand for goods or services from one or more particular industries. For example, Pilat and Wölfl, 2005, estimate, for eight countries, the percentage increase in total output of selected industries if total final demand for services increases by 10%.
5. http://unstats.un.org/unsd/sna1993/introduction.asp
6. These are often referred to as the technological coefficients � because they are a mathematical representation of the rate at which inputs are transformed (thus the technology) into outputs.
7. See Drejer (2002) for a discussion of Hirschman et al. See Polenske and Hewings (2004) on feedback loops and for a general discussion of linkages, including hypothetical extraction, see Dieztenbacher 2002.
8. The Leontief inverse = (I-A)-1 where A is the matrix of coefficients and I the identity matrix. United Nations (1999) provides a straightforward description, elaborates on interpretation and provides examples.

DSTI/DOC(2006)7
11
These examples demonstrate why analyses of input-output tables are able to provide the foundation for a wide range of applications. They continue to be valuable for assessing the economic impact (both ex-ante and ex-post) of policy changes � for example, ex-ante analysis of the recent Australia-US Free Trade Agreement9 and ongoing ex-post analysis of NAFTA.10 Input-output analysis has also been used for a wide range of structural comparisons (for example, see the discussion in Rose and Miernyk 1989), structural growth decomposition (see OECD 1992) and, as discussed later in this paper, industrial ecology analysis.
Figure 2. Service sector value added embodied in manufacturing goods
Percentage of total value of manufacturing goods in final demand
0
5
10
15
20
25
30
Australia Canada Denmark France Germany Japan Italy Netherlands UnitedKingdom
United States
%Early 1970s Mid-1970s Early 1980s Mid-1980s Early 1990s Mid-1990s
Source: Pilat and Wölfl, 2005.
However, although input-output data have been collected for a large number of countries11 their use for analyses did, seemingly, drop from prominence for a number of years:
�Game theory and chaos [theory] have already established themselves in economic model building. Young people, particularly, want challenging problems and are eager to respond to the new type of demand, coming mainly from the excessive financial superstructure. This is not to say that there are no valuable new results in the input-output field. Interesting and innovative papers are continuously being published that report on expansions and new applications, address novel problems, extend the subject-
9. Centre for International Economics (2004).
10. See e.g. Kehoe (2003). 11. For example, Version 6 of the GTAP (Global Trade Analysis Project) database, developed at Purdue
University, includes input-output tables for 86 countries: www.gtap.agecon.purdue.edu/ .

DSTI/DOC(2006)7
12
matter and polish the method. The heyday of input-output as a simple, transparent, deterministic, static linear model are, however, certainly over.� (Augusztinovics 1995: 275)
One possible reason for this is the difficulty, in comparison with trade analysis for example, of using input-output analysis to investigate the challenging questions related to increasing globalisation. Because inter-regional datasets, whether they are at the national level (or at the State/Province level), as discussed in Part 3, link trade data on a bilateral basis with domestic production, they are complex to create and are therefore relatively rare. As Polenske and Hewings (2004) comment:
�One fundamental problem that has plagued regional analysts has been the dearth of data on inter-regional flows; this has resulted in their either focusing attention on single-region models and ignoring interregional trade, or grouping trade in final demand with other external flows, or estimating the flows using a variety of non-survey techniques.� (2004: 270).
These approaches are not completely satisfactory. Therefore, the current project of the OECD, particularly because of its country coverage and timeliness12 should greatly encourage new avenues of research.
2.2 Databases of international input-output transactions
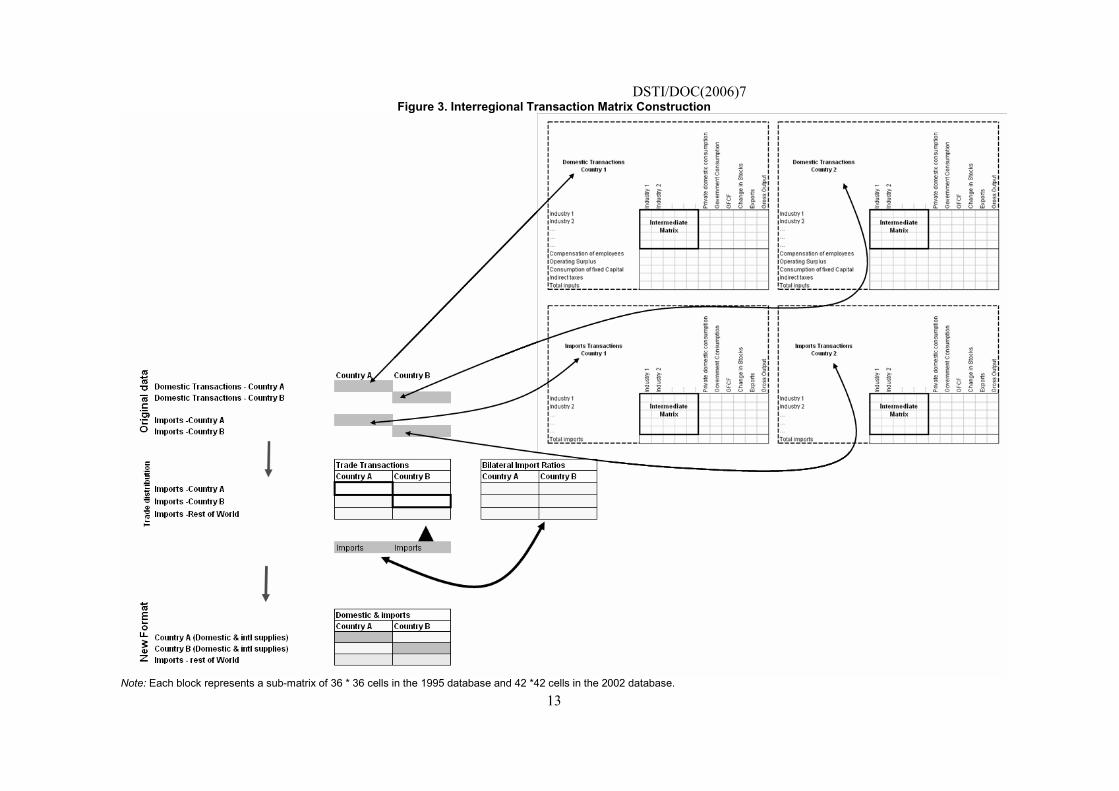
Given the certain limitations of using single nation input-output tables, one might expect that there would be considerable effort devoted to constructing integrated international input-output models. This has not generally been the case, but for good reasons. To construct a large inter-country input-output dataset it is necessary to integrate trade and domestic production structures, a computationally challenging task (see Figure 3 for a two region depiction). Despite this, from mid 1970s to early 1990s, Leontief established the United Nations� world economic model with input-output tables of 15 regions linked by international trade statistics resulting in a series of world-wide economic analyses being released. However, Duchin, who is currently developing techniques and approaches for a �World Trade Model� notes that:
�After a lapse of a quarter of a century, models of the world economy are once again in demand in connection with prospects for improving the international distribution of income and for reducing global pressures on the environment. While virtually all empirical models of the world economy make use of input-output matrices to achieve consistent sector-level disaggregation, only input-output models make full use of sectoral interdependence to determine production levels.� (2005: 144)
Duchin further emphasises:
�A key requirement at this time for the application of a full-scale model is the development of a new database. The input-output tables that provide the bulk of the required data are regularly compiled for many countries, but integrating them into a common database remains a substantial challenge.� (2005:159)
12. Though note that because of the complexity in creating standard national input-output tables, not least the
dozens of data sources often required, the period covered by the data is often five or more years behind the publication date.
DSTI/DOC(2006)7
13
Figure 3. Interregional Transaction Matrix Construction
Note: Each block represents a sub-matrix of 36 * 36 cells in the 1995 database and 42 *42 cells in the 2002 database.

DSTI/DOC(2006)7
14
Several sets of linked tables have been developed and published in recent years by various research groups around the world,13 though few reach the coverage possible with the latest OECD tables.
The first step to construct a inter-country input-output model is to assemble compatible (year and industry classification) national domestic and imports transactions tables. Step 2 is to construct a database of trade flows (ratios of imports from regions included in the database and the rest of the world) and step 3 applies those trade ratios to the imports data assembled in step 1 to create a trade matrix for each country in the database. Step 4 then requires that both the domestic data and the trade data be included in the same transaction matrix.
To construct a set of integrated input-output tables it is necessary to have some information on the flows of goods and services across borders on the basis of which industries (in which territories) are supplying those goods and services and which industries (in which territories) are using them. Unfortunately, few national statistical agencies collect imports data on the basis of a user-producer system. Goods crossing the borders of a country are usually defined according to the Harmonised System commodity classification.14 Although this data collection is a good indication of what is coming across the borders, different countries have different rules on identifying relevant trade partners. Goods may pass through countries on their way from the producer to the final destination, but in some cases the last country is identified as the exporter.
In converting the value of imports by commodity, to their probable user industry, some statistical agencies apply ratios which are developed on the basis of surveys. This is for primary and manufactured goods � services are more difficult. Until the mid 1990s trade in services were only collected at the total world level, not by trading partner. During the 1990s some OECD countries started collecting data by bilateral partner, but only at the aggregate sectoral level (i.e. all services). Now, some countries have finally starting collecting data by bilateral partner at the broad activity level for trade in services (see OECD 2004b).
To analyse pertinent questions concerning the flows of skills, technology, carbon dioxide or material inputs embodied within products and services, requires a further step. For example, to track the transmission of CO2 embodied in production it is necessary to have a set of tables that provide the CO2 content produced by all the industries in the transaction matrix for all the countries in the database. This may seem like stretching the limits of data availability, but the significance of developing such analytical tools lies in the ability to derive large scale frameworks which can then be further refined with case studies.
As noted earlier, the lack of accessible multi-country input-output data frameworks, supported by an international organisation has arguably limited the scope of empirical analyses addressing the changing world economic architecture.
In the next sections two primary categories of the uses of international inter-regional databases are examined, namely economic development; and environmental flows.
13. Currently, the Regional Economics Department at the University of Groningen has EU inter-country input-
output tables that can be downloaded (www.regroningen.nl/index_en.html). The Institute of Developing Economies, JETRO, has a database linking Asian countries with the US while a world linked model has recently been developed by Shimpo and Okamura (2005). OECD developed an inter-country interregional model of the flow of goods for internal use for its work analysing the flow of CO2 (Ahmad and Wyckoff 2003), while the tables developed for the analysis by Wixted (2005) and Wixted and Cooper (in press) are also not publicly available.
14. Information is available at the World Customs Organization www.wcoomd.org/ie/index.html

DSTI/DOC(2006)7
15
3. INTERNATIONALISATION OF ECONOMIC VALUE CREATION
The most frequent applications of input-output have been those developed on the basis of single national input-output tables. However, while considering one nation at a time still provides valuable insights, having access to international data is becoming increasingly important for contemporary economic analyses. What is often described as the �fragmentation of production�, whereby parts of manufacturing production and service development are relocated inter-regionally or overseas, has important ramifications for the operations of modern societies. Cohen�s (2002) analysis of Asian development uses data on trade, international bank transfers, telephone communications and travel routes to map a little of the emerging structure of production:
�Trade data, over the years, show a greater integration of Asia. But it is a particular sort. It takes the form of an elaborate factory, or production network, where components move around the international system, but final product and the wellbeing of the network depend overwhelmingly on shipment to the US � In 1998 the US absorbed 35.4 percent of the region�s exports while providing only 17.5 percent of what the region imported.� (2002: 22)
This was the case for the late 1990s. With the recent rise of China as a global production centre, what is the latest evidence on the structure of trade and production? Gaulier et al. make the following observation:
�The rise of China has intensified the international segmentation of production processes among Asian partners but has not (yet?) created an autonomous engine for regional trade, which still depends on outside markets for final goods exports. � As China has become an export platform for multinational firms, the driving force of Japan�s trade has shifted from exporting final goods to North America and Europe towards exporting parts and components to China, and from importing final goods from America, Europe and the Dragons towards importing these goods from China. The Dragons� trade has also switched away from Japan and NAFTA and towards China. The reorganisation of production has weakened trade between the advanced economies but up to now has not severely affected the position of the emerging Asian economies (Malaysia, Philippines, Thailand) in international trade.� (2006: 4)
One of the ways in which we can analyse the emerging phenomena of this international factory is through intra-industry trade (IIT). IIT is the import and export of goods within the same industry classifications. Across time, IIT trade has been rising, as illustrated by Table 2 from Brulhart and Elliot which uses unadjusted Grubel-Lloyd indices calculated from SITC trade statistics.

DSTI/DOC(2006)7
16
Table 2. Intra-industry trade within the EU by country 1961-1992
Country 1961 1967 1972 1977 1985 1988 1990 1992 Belgium-Luxembourg 0.51 0.56 0.49 0.57 0.56 0.57 0.58 0.60 Denmark 0.30 0.37 0.41 0.44 0.42 0.44 0.43 0.47 France 0.60 0.69 0.67 0.71 0.68 0.67 0.67 0.72 Germany 0.47 0.56 0.57 0.57 0.60 0.59 0.61 0.68 Greece 0.02 0.06 0.08 0.10 0.15 0.15 0.16 0.15 Ireland 0.22 0.28 0.36 0.45 0.40 0.38 0.38 0.41 Italy 0.44 0.56 0.57 0.56 0.52 0.51 0.51 0.51 The Netherlands 0.54 0.57 0.59 0.59 0.60 0.62 0.61 0.67 Portugal 0.04 0.10 0.13 0.14 0.24 0.25 0.30 0.31 Spain 0.10 0.16 0.29 0.38 0.47 0.56 0.57 0.60 United Kingdom 0.51 0.67 0.65 0.71 0.62 0.59 0.64 0.68 EUa 0.48 0.56 0.57 0.59 0.58 0.58 0.59 0.64
Source: Brulhart and Elliot 1998: 235.
For many countries, intra-industry trade now accounts for a significant level of activity. A complementary understanding of trade is developed when the evolving trade specialisations of countries by industry, country or both are analysed. As one example, the OECD bilateral trade database (BTD) can be formatted to provide interesting information on industry x trading partner patterns � see Figure 4 (below). This particular example shows that Korea�s exports are specialised in the ICT and motor vehicle industries and concentrated in the US market. When this is compared with a similar analysis for previous years it can be easily shown how that country�s pattern has evolved from a specialisation in textiles, footwear and leather exported to Japan and food, beverages and tobacco exports to the United States in 1970 through to the current patterns (Wixted, 2005). As noted later in this paper, access to detailed ICT sub-category trade data formatted in a similar fashion to the current OECD BTD would facilitate useful analysis of the flows of Office & computing machinery and Radio, TV & communication equipment components. These are important trade categories for many countries � exemplified by Korea (Figure 3), but which are covered in a highly aggregated form in both OECD�s input-output tables and BTD.
However, trade data alone do not tell us much about the inputs from other countries that were required to make these exports. International input-output data get us beyond this black box so that it is possible to investigate more directly the domestic and foreign inputs necessary for production.
Beyond the economics of the factory, input-output modelling can also assist with developing analysis of the materials being processed, consumed and discarded. �The globalization of trade in goods has numerous environmental implications�, particularly, as Ahmad and Wyckoff (2003) note with �the importance of CO2 embodiment in global trade�, and thus to attempts to encourage reductions in the production of CO2.
The rest of this paper will outline the benefits of a large multi-country input-output database that is developed with consistent trade data.

DSTI/DOC(2006)7
17
Figure 4. Korea 2000 � industry by country exports (%GDP)
Aus
Aut
Blx
Can
ada
CZE
DN
KFi
nFr
aD
euG
RC
Hun Is
l Irl Ita Jpn
Kor
Mex Nld
NZl
Nor Po
lPr
tEs
pSv
kSw
eC
he Tur
GBR
USA Ar
gBR
AC
HN
TWN
CSK
HKG IN
DID
NM
YS PHL
SGP
Tha
OPC
RO
W
Food, drink & tobaccoTextiles, foot & leatherWood, cork & furniturePaper, print & publishIndustrial chemicalsPharmaceuticalsPetroleum refiningRubber & plastic prodStone, clay & glassFerrous metalsNon-ferrous metalsFabricated metal productsNon-electrical machineryComputers & office machineryElectrical machineryCommunicat. equip. etcShipbuildingOther transport equipmentMotor vehiclesAerospaceInstrumentsOther manufacturingDiscrepancy (Scrap Metal)
2.50-3.00
2.00-2.50
1.50-2.00
1.00-1.50
0.50-1.00
0.00-0.50
Source: Wixted (2005) based on OECD Bilateral Trade Database.
DSTI/DOC(2006)7
18
3.1 Clustering, global value chains and production fragmentation
The phenomena of outsourcing, off-shoring and the fragmentation of production processes are attracting increasing interest from industry analysts even if the terminology gets a little muddled.15 For the purposes of this paper, outsourcing refers to the practice of contracting out to external businesses the supply of certain goods and services that were previously supplied in-house (whether intra- or inter-regionally). Off-shoring refers to the transfer of parts of the production process (goods or services) to international locations, while fragmentation of production (see e.g. Feenstra 1998 and Jones and Kierzkowski 2000) describes the gradual transformation of previously continuous production processes, typically carried out in the same plant, into several modular sub-processes, undertaken in separate locations (with integration into a final product occurring in a single location).
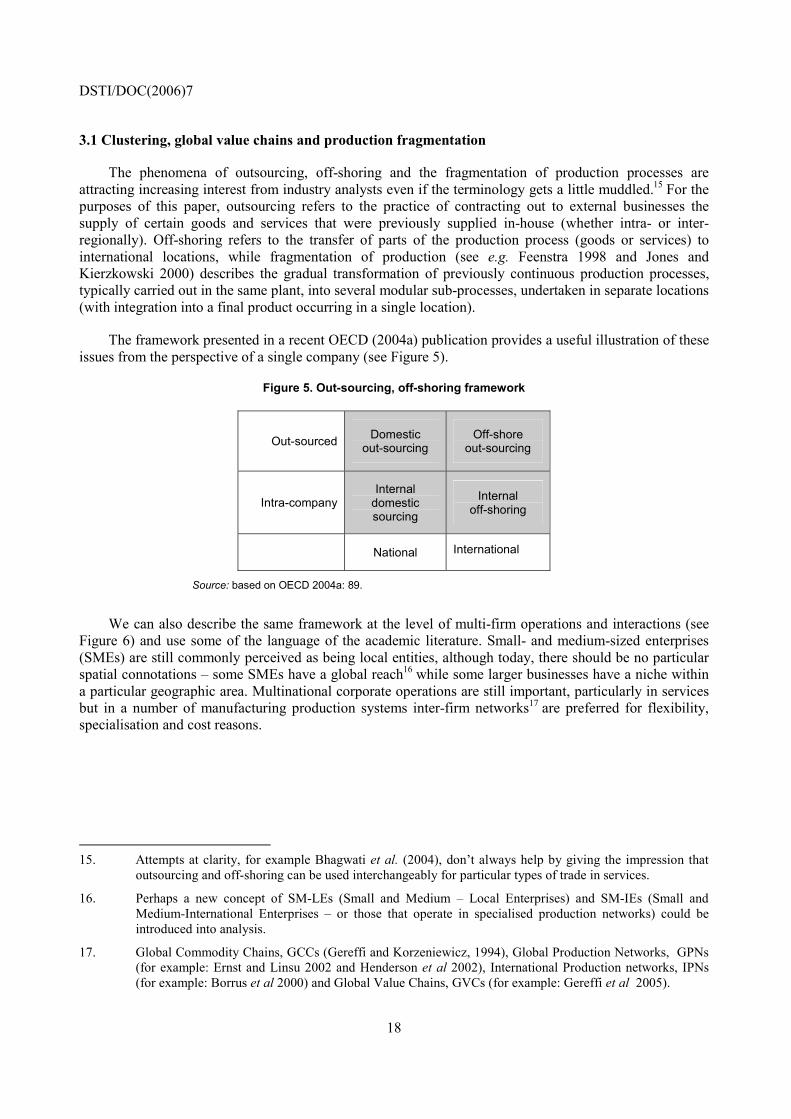
The framework presented in a recent OECD (2004a) publication provides a useful illustration of these issues from the perspective of a single company (see Figure 5).
Figure 5. Out-sourcing, off-shoring framework
Out-sourced Domestic out-sourcing
Off-shore out-sourcing
Intra-company Internal
domestic sourcing
Internal off-shoring
National International
Source: based on OECD 2004a: 89.
We can also describe the same framework at the level of multi-firm operations and interactions (see Figure 6) and use some of the language of the academic literature. Small- and medium-sized enterprises (SMEs) are still commonly perceived as being local entities, although today, there should be no particular spatial connotations � some SMEs have a global reach16 while some larger businesses have a niche within a particular geographic area. Multinational corporate operations are still important, particularly in services but in a number of manufacturing production systems inter-firm networks17 are preferred for flexibility, specialisation and cost reasons.
15. Attempts at clarity, for example Bhagwati et al. (2004), don�t always help by giving the impression that
outsourcing and off-shoring can be used interchangeably for particular types of trade in services.
16. Perhaps a new concept of SM-LEs (Small and Medium � Local Enterprises) and SM-IEs (Small and Medium-International Enterprises � or those that operate in specialised production networks) could be introduced into analysis.
17. Global Commodity Chains, GCCs (Gereffi and Korzeniewicz, 1994), Global Production Networks, GPNs (for example: Ernst and Linsu 2002 and Henderson et al 2002), International Production networks, IPNs (for example: Borrus et al 2000) and Global Value Chains, GVCs (for example: Gereffi et al 2005).
DSTI/DOC(2006)7
19
Figure 6. Local and international corporate interactions
External suppliers
Local business networks
Global production networks
Intra-company Domestic enterprises
Multinational enterprises
Intra-regional Inter-regional
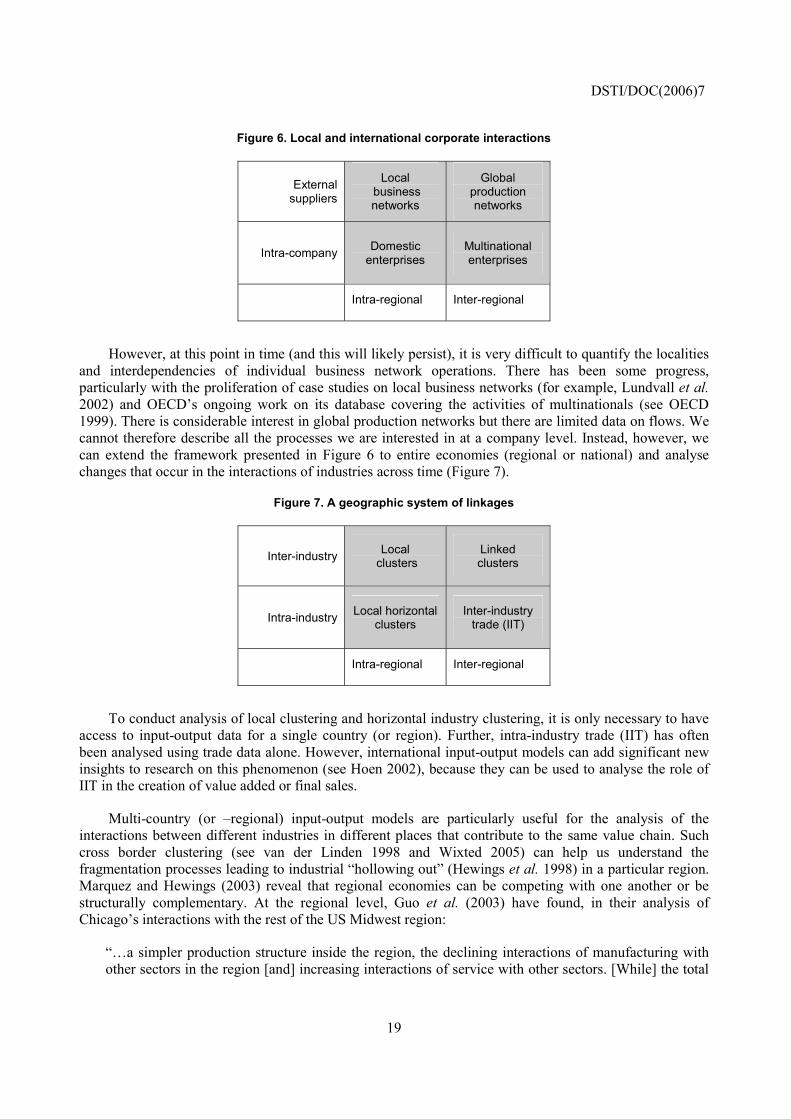
However, at this point in time (and this will likely persist), it is very difficult to quantify the localities and interdependencies of individual business network operations. There has been some progress, particularly with the proliferation of case studies on local business networks (for example, Lundvall et al. 2002) and OECD�s ongoing work on its database covering the activities of multinationals (see OECD 1999). There is considerable interest in global production networks but there are limited data on flows. We cannot therefore describe all the processes we are interested in at a company level. Instead, however, we can extend the framework presented in Figure 6 to entire economies (regional or national) and analyse changes that occur in the interactions of industries across time (Figure 7).
Figure 7. A geographic system of linkages
Inter-industry Local clusters
Linked clusters
Intra-industry Local horizontal clusters
Inter-industry trade (IIT)
Intra-regional Inter-regional
To conduct analysis of local clustering and horizontal industry clustering, it is only necessary to have access to input-output data for a single country (or region). Further, intra-industry trade (IIT) has often been analysed using trade data alone. However, international input-output models can add significant new insights to research on this phenomenon (see Hoen 2002), because they can be used to analyse the role of IIT in the creation of value added or final sales.
Multi-country (or �regional) input-output models are particularly useful for the analysis of the interactions between different industries in different places that contribute to the same value chain. Such cross border clustering (see van der Linden 1998 and Wixted 2005) can help us understand the fragmentation processes leading to industrial �hollowing out� (Hewings et al. 1998) in a particular region. Marquez and Hewings (2003) reveal that regional economies can be competing with one another or be structurally complementary. At the regional level, Guo et al. (2003) have found, in their analysis of Chicago�s interactions with the rest of the US Midwest region:
��a simpler production structure inside the region, the declining interactions of manufacturing with other sectors in the region [and] increasing interactions of service with other sectors. [While] the total
DSTI/DOC(2006)7
20
output of manufacturing did not decrease, all these features provide evidence of hollowing out effect in the Chicago economy.� (2003: 20).
This �reveals production fragmentation patterns at the regional level, paralleling findings of similar processes at the international level.� (2003: 20). Studies of the international economy have suggested a number of findings on this regionalisation of the division of labour. Yi, on the basis of theoretical modelling, suggests that tariff reductions have been significant drivers (50% or more) of vertical specialisation (2003). Although reductions in protection seem unlikely to be a factor in the specialisation of the US Midwest economies, vertical specialisation seems to be deepening nonetheless. Seo et al. (2004) explored the multi-regional economic setting, confirming an inter-regional effect, mostly accounted for by neighbouring States in the US Midwest.
�Intra-industry trade has grown noticeably in intraregional, and even in interregional trades. Further, the Midwest-to-Midwest flow is on the increase during the period of estimation (1980-2000); it remains to be seen whether the hollowing out process observed for the Chicago metropolitan region represents a spatially hierarchical process, evident first at smaller geographic scales. It would seem reasonable to expect that continued improvements in logistics and communications would effectively undermine any (short-term) advantages offered by the Midwest as a region; between 1990 and 2004, the Midwest region lost 12% of its manufacturing jobs (for Illinois, the loss was much higher, almost 24% while for the nation, the loss was 19%). However, as has been noted, job losses may not be entirely reflective in losses of production, as productivity gains in the Midwest have been dramatic.� (2004: 12)
Intra-industry trade has been by necessity the primary tool for trade-oriented analysis of specialisation but it may under-estimate vertical and horizontal trade. Interregional input-output analysis, in contrast, facilitates a range of different analyses (intra- and inter-industry activity). Van der Linden (1998: 188-195) for example identified eight major Europe wide �intercountry� clusters 18 of interdependencies. The approach adopted in that analysis identified the major contributing industry branches for each significant inter-country cluster. Thus, for example, industries such as, rubber and plastics and metals as well as the various transport sector branches themselves [in various countries] were identified as contributing to the overall motor vehicle and other transport divisions of the transport equipment inter-country cluster. Analysis along these lines goes beyond intra-industry trade to reveal the degree to which trade and specialisation can go hand in hand with industry value chain development, an observation not possible with trade data alone.
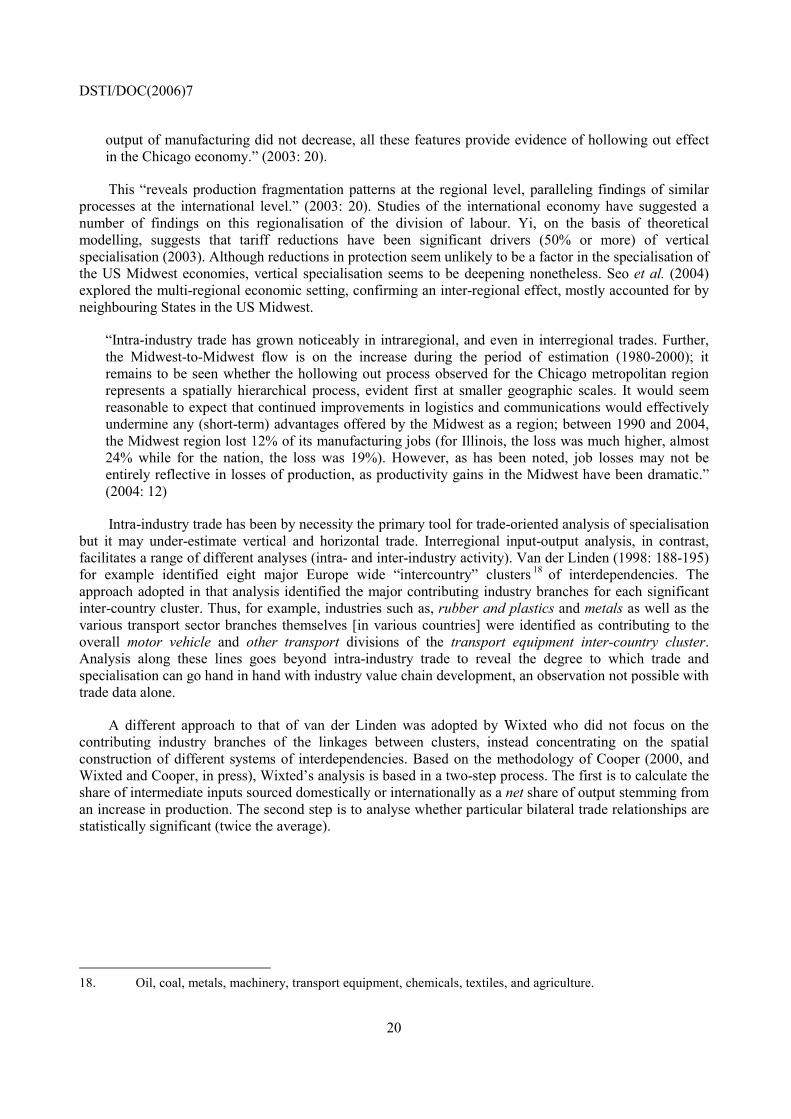
A different approach to that of van der Linden was adopted by Wixted who did not focus on the contributing industry branches of the linkages between clusters, instead concentrating on the spatial construction of different systems of interdependencies. Based on the methodology of Cooper (2000, and Wixted and Cooper, in press), Wixted�s analysis is based in a two-step process. The first is to calculate the share of intermediate inputs sourced domestically or internationally as a net share of output stemming from an increase in production. The second step is to analyse whether particular bilateral trade relationships are statistically significant (twice the average).
18. Oil, coal, metals, machinery, transport equipment, chemicals, textiles, and agriculture.
DSTI/DOC(2006)7
21
Figure 8. Aerospace production system - interdependencies between national clusters (1995)
Source: Wixted (previously unpublished), constructed from various data sources OECD (2002) and OECD (2004c).

DSTI/DOC(2006)7
22
What this methodology allows is an analysis of the contribution of trade in materials, components and services (intra- and inter-industry) to the overall structure of an internationalised production system (see Figure 8 for an example concerning the aerospace industry). As the focus is on the contribution to production, it highlights dependencies rather than just trade volume (as was shown in Figure 4 above). This makes it possible to highlight deep dependencies, as is shown in the example of aerospace, where many countries rely on the United States for industrial components. The approach also reveals second-tier suppliers such as France and Germany and perhaps Japan as a third-level supplier. In Figure 8, the dotted lines represent trade relationships that measure between 1.5 and 2 times the average trade strength. The values represent the share of imports. The arrows point in the direction of the flow of financial flows, the goods and services travel in the opposite direction.
The structure of linkages between aerospace clusters is quite different to that apparent in the motor vehicles production system (Wixted 2005 and 2006), which has a more tandem spatial structure (Europe and the Asia-Pacific - Americas) and ICT-related manufacturing, with its increasing variety of major suppliers (see 2005 and Wixted and Cooper in press).
The foregoing presentation is by no means the only approach for visualising the connection between producers and users. For example, van der Linden 1998 examines production linkages based on hypothetical extraction while Sonis and Hewings 2001 use feedback loops and Dietzenbacher et al. 2005, propagation lengths.
One way feedback loop analysis can be visualised can be found in Hitomi et al. (2002). In this presentation (Figure 9) of the interregional interactions within Japan, three hierarchical levels are considered:
• Regions.
• Macro-economic level:
− Primary activities: agriculture, P and non agriculture, p.
− Manufacturing: durable goods, M and non-durable goods, m.
− Services: business services, S and personal services, s.
• Intra-industry activities.
The three hierarchies are presented by the sequence of shading, tint and colours � the darker colours show the stronger linkages. For all regions, the intra-regional transactions are higher than the inter-regional transactions (diagonal blocks). Inter-regional dependencies are determined according to the geographical location and the size and types of economies. It can be seen that the regions with the larger manufacturing sectors depend more on external economies (Kanto, Chubu and Chugoku).

DSTI/DOC(2006)7
23
Figure 9. Internal trade flows of Japan (1990): hierarchy of interregional and inter-activities feedback loops
Source: Hitomi et al. (2002).
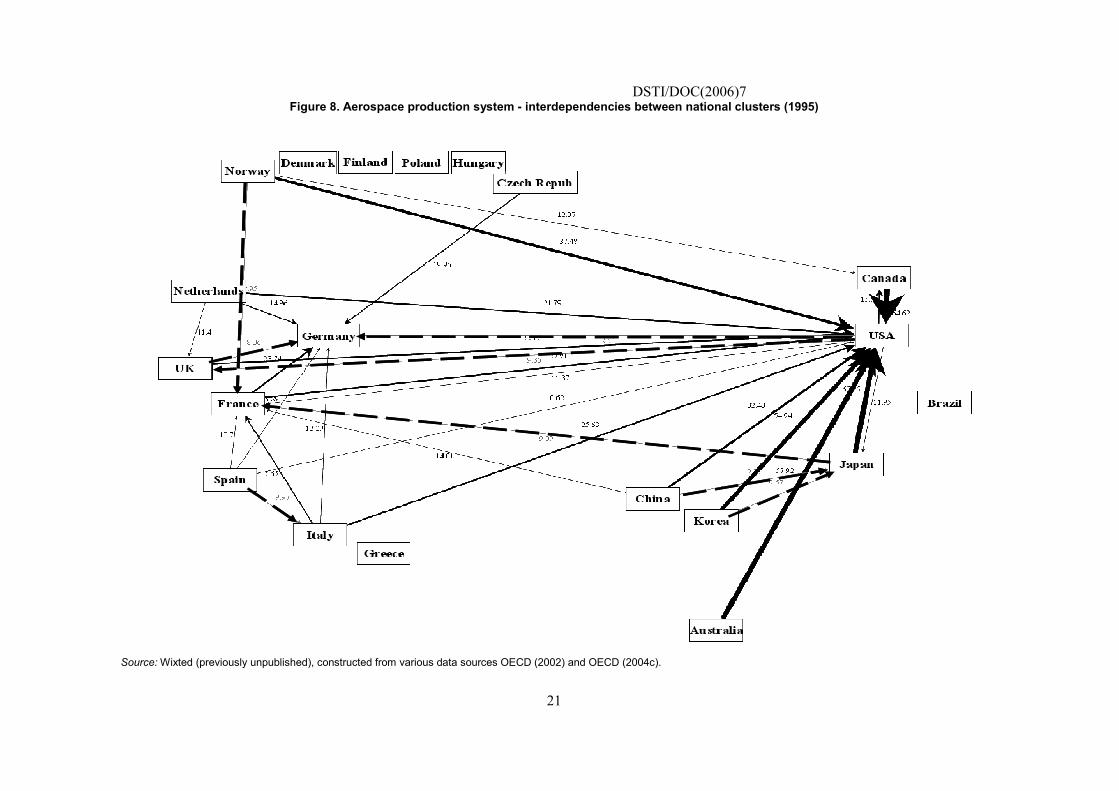
Another important feature of input-output analysis is that it facilitates an analysis of the role of imports in the production process. In this way it can be used to track the dependency of industries on imports through time. Wixted (forthcoming) presents a table of the changing nature of the internationalisation of production. Table 3 is the tabulation of the top five national clusters19 (from each economy) that rely most heavily on imported supplies for the years 1970, 1990 and 1995.
19. The total activity arising from the modelled increase in demand for the product of each industry � thus all
the imports coming from country x to country y in all industries.
DSTI/DOC(2006)7
24
Table 3. A count of the top five national industrial clusters for each country with a high dependency on imports � ordered by 2000 List
Top importing clusters 1970 (9) 1990 (9) 1995 (9) � 1995 (20)* Petroleum and coal products 9 8 8 14
Office equipment and Radio, TV and communications equip.
2 (of 14 series)
7 (of 14 series)
11 (of 17 series)
27(of 38 series)
Motor vehicles 3
(of 8 series) 5
(of 8 series) 5 12
Aircraft 4 4 5 9
Non-ferrous metals 6 6 4 9
Iron and steel 4 3 8
Shipbuilding and repairing ships 1 3 3
Textiles, clothing and footwear 5 5 2 2
Industrial chemicals 2 4 2
Other transport 3 2 2 2
Paper, paper products and printing 1
Wood products and furniture 2 1 1 2
Rubber and plastic products 1 4
Other manufacturing 2
Mining and quarrying 1 1
Scientific instruments etc. 1
Food, beverages and tobacco 1
Transport and storage 1
Pharmaceuticals 2
Electrical Machinery 2
Computer services 1
Total 45 (9 * 5) 45 (9 * 5) 45 (9 * 5) 100 (20 * 5)
Note� The transactions table for 1995 was analysed on a consistent basis as the models constructed around the previous OECD 1995 database to provide a time series. Although the original OECD (1995) tables included Italy it was only incorporated for one year (mid 1980s) and was therefore excluded from the modelling, leaving 9 countries for the time series.
Note* For comparative purposes the year 1995 transactions table was also analysed to understand the spread of activities which were relatively dependent on imports in all 20 countries.
Source: Wixted, B. (forthcoming).
It can be seen from this that some production activities that are technologically intensive such as aerospace, ICT and motor vehicles are heavily reliant on imports, while others are less so. Interestingly, for lower technology and more labour intensive activities such as textiles, clothing and footwear a declining share of the leading internationalised sectors is revealed. However, data used in this analysis focussed on input use in the creation of value added. If labour intensive and cost sensitive activities are being re-localised (i.e. the entire production process is being moved off-shore), then the level of cross border integration will drop (or grow at a slower rate) and thus it will not appear in Table 3.
Finally, it is worth noting that even with input-output modelling it is not entirely possible to track products in an ever increasingly complex system of international trade. A computer chip manufactured in one country, shipped to a second country for integration in a computer and then purchased by an industry
DSTI/DOC(2006)7
25
in a third country will appear as three separate steps � it is difficult to attribute back to the first country a proportion of the activity in the third.. However, by opening up the individual black boxes of the international factory, input-output modelling, as highlighted in this section, can greatly improve our understanding of trade dynamics.
3.2 Embodied technology
To produce a list of industries which are increasingly reliant on imports, such as those shown in Table 3, while highlighting the role of technology-based industries, information on the diffusion of technology is required. There have been regular reviews of R&D expenditure by industry (for example, OECD 2005), and this measure has often been used as a proxy for both innovation and knowledge generation capabilities. However, less attention has been paid to the diffusion and use of that knowledge, which is embodied in products and components.
The primary methodology for calculating embodied technology is to use measures of �R&D intensity� (R&D expenditure per unit of output) by industry to weight the different industries in an input-output table. The revised transaction table is then used as the basis for calculating the dependency of industries on purchased technologies. For example, an industry that relies relatively more upon inputs of raw materials (such as metal ores) than on inputs of industrial machinery (such as the mining industry) will typically show lower requirements for embodied technology. Annex C describes a general method to estimate any embodied entity present in industry output, originating both domestically and from abroad.
Two key studies have examined domestic flows of embodied technology (Drejer 2000 and Düring and Schnabl 2000) while another, Papaconstantinou et al. (1996), has investigated the cross border flows. The latter study, because of its international nature, is of the most interest here � some of the results are reproduced in Table 4 which shows the principal industries that perform R&D and those that benefit most from technology (R&D) embodied in purchased products. Table 4 reveals a substantial difference between those industries that perform R&D and those that are dependent to a significant degree on products which incorporate R&D. The column on the left shows manufacturing industries that are generally considered to be high technology and includes aerospace, computing, instruments and pharmaceuticals.20 The column on the right reveals that many service industries are substantially reliant on technology through purchased products � identified in the paper as frequently being goods based on information and communications technologies (ICT).
20. In fact, this approach was used by Hatzichronoglou (1997) to develop a classification of manufacturing
industries according to their �global technological intensity�.

DSTI/DOC(2006)7
26
Table 4. R&D intensity and embodied R&D usage intensity, 1990 � five biggest industries in seven OECD countries
R&D performers (country & industry) % Embodied R&D users (country & industry) %United States
Aerospace 26.7 Social and personal services 12.5
Communication and semiconductors 16.8 Wholesale and retail trade 9.9Chemicals 13.2 Real estate and business services 7.6Computers 12.5 Transport and storage 7.1Motor vehicles 10.6 Construction 6.4Germany
Electrical machinery 26.4 Motor vehicles 10.2
Chemicals 22.0 Real estate and business services 9.1Motor vehicles 17.6 Transport and storage 6.9Other non-electrical machinery 10.8 Other non-electrical machinery 6.8Aerospace 9.1 Construction 6.3United Kingdom
Communication and semiconductors 22.9 Social and personal services 14.8
Pharmaceuticals 16.3 Aerospace 8.1Aerospace 15.9 Real estate and business services 7.8Chemicals 11.4 Wholesale and retail trade 7.3Computers 8.6 Finance and insurance 6.7Canada
Communication and semiconductors 32.5 Motor vehicles 15.9
Aerospace 13.2 Communication and semiconductors 8.7Computers and office machinery 8.6 Communication services 8.7Pharmaceuticals 7.4 Social and personal services 8.7Chemicals 4.8 Transport and storage 8.5Japan
Communication and semiconductors 16.3 Social and personal services 11.5
Motor vehicles 14.4 Construction 10.8Electrical machinery 11.2 Real estate and business services 10.0Chemicals 10.1 Transport and storage 8.6Computers and office machinery 10.1 Motor vehicles 6.0France
Communication and semiconductors 23.8 Aerospace 10.4
Aerospace 20.6 Transport and storage 10.2Motor vehicles 12.4 Construction 7.1Chemicals 10.0 Motor vehicles 6.1Pharmaceuticals 8.0 Social and personal servicesItaly
Motor vehicles 18.4 Social and personal services 18.1
Communication and semiconductors 14.3 Transport and storage 7.2Pharmaceuticals 14.1 Construction 6.2Aerospace 11.7 Chemicals 5.3Electrical machinery 8.4 Real estate and business services 5.0
Source: Papaconstantinou et al. (1996).

DSTI/DOC(2006)7
27
Although Papaconstantinou et al. (1996) did not rely on an inter-regional model of flows, instead weighting imports by respective bilateral import intensities, the study was nevertheless able to indicate the likely source and destination countries of the technology flows. As would be expected, where only national tables are available, smaller countries are shown to rely on international imports to a greater extent than larger economies. Beyond this, Papaconstantinou et al. comment:
�The US and Germany are the most important source of new technology for all countries (in the case of the US, especially for computers and aerospace); for the US, Japan and the Dynamic Asian Economies taken together are important sources of product-embodied technology acquired through imports. Finally, the paper showed that technology emanating from the information and communications technology cluster of industries is the bulk of technology acquired in most countries. Its importance has increased over time; ICT is the fastest growing acquired technology cluster; the share of other technology clusters is steady or declining.� (1998: 311)
These results appear to reinforce the findings presented in Table 3 that some of the most import-intensive industries are also technology intensive.
3.3 Productivity and the determinants of growth
Interest in the productivity of nations continues unabated. Since analysis of productivity makes a significant contribution to economic policy decisions, many efforts are being made by statisticians and researchers to improve its measurement � particularly in terms of international comparability. Many studies tend to concentrate on measures of labour productivity based on value added or, when adequate data on capital inputs are available, multi-factor productivity (MFP) based on value added.21 While using value added as a measure of output has its advantages (not least, ease of aggregation across industries and a simple conceptual link between industry-level MFP and aggregate MFP growth), it is recognised that MFP based on gross output (KLEMS22-MFP) �is the most appropriate tool to measure technical change by industry as the role of intermediate inputs in production is fully acknowledged�.
In order to estimate KLEMS productivity, input-output tables are required to provide information on the main groups of intermediate inputs: energy, materials (machinery and equipment) and services. Also the gross output of each industrial sector needs to be adjusted to remove flows of intermediate inputs within the sector.
Early attempts at the OECD to calculate MFP based on information from input-output tables (Sakurai et al, 1996) split intermediate inputs into domestically produced and imported, rather than energy, materials and services, when comparing the sources of growth for nine OECD countries. In the context of growing interest into the economic impacts of globalisation, such an approach may be worth reviving. With internationally linked input-output tables, efforts could also be made to determine the impact of imports from a particular nation (e.g. China), or region, on a countries� aggregate growth. In fact, by exploiting information from OECD�s Activities of Foreign Affiliates (AFA) database, attempts could be made to decompose domestic production and imports into nationally-owned and foreign-owned, and by following the flows with linked input-output tables (in a similar manner to studying embodied technology), investigate the impact on growth of �nationally produced� goods and services � i.e. by taking into account the fact that many imports into the United States (Japan or Europe), for example, originate from companies with US (Japanese or European) ownership based in lower-waged countries (China, Mexico etc.).
21. For an overview of different types of productivity measures, see Chapter 2 of OECD (2001).
22. So called because inputs of capital (K), labour (L), energy (E), materials (M) and services (S) are taken into account.
DSTI/DOC(2006)7
28
Amongst contemporary efforts to produce internationally comparable estimates of KLEMS productivity, the EUKLEMS project is a good example. 23 This project (2005-2007), funded by the European Commission,24 is using input-output tables, along with many other data sources, in an attempt to produce comparable measures of KLEMS MFP for all EU countries. The project�s objective in part reads:
�This project aims to create a database on measures of economic growth, productivity, employment creation, capital formation and technological change at the industry level for all European Union member states from 1970 onwards. � The database should facilitate the sustainable production of high quality statistics using the methodologies of national accounts and input-output analysis. The input measures will include various categories of capital, labour, energy, material and service inputs. Productivity measures will be developed, in particular with growth accounting techniques. Several measures on knowledge creation will also be constructed. Substantial methodological and data research on these measures will be carried out to improve international comparability.�
23. For full details, refer to www.euklems.net
24. This project is funded by the European Commission, Research Directorate General as part of the 6th Framework Programme, Priority 8, �Policy Support and Anticipating Scientific and Technological Needs�.

DSTI/DOC(2006)7
29
4. MEASURING MATERIAL AND ENVIRONMENTAL FLOWS
4.1 Industrial ecology
There are a number of labels attached to the study of flows of resources from the natural world; through production processes and consumption; then to waste; and from there back into the environment. Broadly the field is known as industrial ecology (see e.g. Suh and Kagawa 2005) but there are a number of other terms which are used in the same research field. These include industrial metabolism (see e.g. Kowalski 2003), materials flow accounting (see e.g. Palm and Jonsson 2003) and ecological footprints (see e.g. Foran and Poldy 2002a).
Since physical input-output tables (PIOTs25) are only available for a few countries, studies of regions (rather than individual production chains such as Frey et al. 2006 for mobile phones) typically need to rely to some extent on input-output tables. For constructing analysis of material flows, Eurostat (2001: 47) suggests that the following data sources are required:
• Forestry statistics and accounts (timber harvested and removed, other products of forestry, supply and use tables of wood, etc.).
• Agricultural statistics (cereals, vegetables, hay, etc.).
• Industry/production statistics (extraction of fossil fuels, crude ores, industrial and construction minerals, identification of recycled materials).
• Energy statistics and energy balances (extraction of fuels, estimation of oxygen demand).
• Statistics of foreign trade (imports).
• Supply-use tables and input-output tables (accounts for individual product groups).
• Estimates: e.g. air inputs may be estimated based on combustion of fossil fuels.
The role of regional / national input-output tables in attempts at modelling the flows of resources from the environment through the economic and societal systems and back to the environment via waste, is to provide the data on the industrial and consumption patterns within the economy. In a significant project the Australian Commonwealth Scientific and Industrial Research Organisation (CSIRO) undertook a study:
25. PIOT tables are laid out in a similar fashion to monetary I-O tables except that the values are replaced by
physical units. According to Giljum and Hubacek (2004), the environment is typically added as a source of raw materials and as a sink for residuals (p302). In contrast to PIOTs which �account for all material transactions within a national economy, i.e. material flows between economic sectors and branches�, MFA-based analysis �is a physical accounting framework to monitor material inputs, accumulations, and outputs of national economies �. [to] provide a comprehensive and systematic overview of the physical basis and requirements of all economic activities taking place within a national economy.� Femia and Moll (2005: 6)

DSTI/DOC(2006)7
30
�to generate new insights on what lies over the horizon for Australia, researchers at CSIRO Sustainable Ecosystems have been developing new tools and new approaches to modelling Australia�s physical economy in order to build scenarios of what the distant future might hold.� (Foran and Poldy 2002a: 5)
At the core of the CSIRO�s work was the Australian Stocks and Flows Framework (ASFF), �a relatively complex input-output table that blends raw materials and energy to form intermediate and then final products for both domestic consumption and export�, (Foran and Poldy 2002b: 159). The modelling also utilised the OzEcco model that �embodied energy (the direct and indirect energy required to create a good or service) to construct an energy-based simulator of Australia's physical economy� [also incorporating input-output data]. (Foran and Poldy 2002a: 14)
Although quite sophisticated, these modeling exercises are still confined within national borders. Going beyond national borders were the recent studies carried out within the MOSUS26 project funded by the European Union. This was described by Lutz et al (2005) as an
�� ambitious project to identify possible strategies for a sustainable development in Europe considering the interrelations of resource inputs, land use, energy consumption; economic development; and fundamental social indicators.�
At the heart of much of the analyses was an extended version of the GINFORS27 model which uses bilateral trade matrices to link harmonised national input-output tables which are in turn linked to energy-emission models, material input models and land use models.
Although the MOSUS project ended in December 2005, researchers involved have continued to develop the modelling system, most recently with the integration of a global material flow database into GINFORS and the release of a �material flows portal� on the Internet (www.materialflows.net) maintained by the Sustainable Europe Research Institute (SERI) in Austria and providing a variety of material flows data resources.
4.2 CO2 and greenhouse gases
Large scale modelling of the flows of the natural resources (water, ores, timber and land, etc.) that we use to maintain our way of life are massively complex but can provide policy makers with valuable new insights into our impact on the environment. Taking one particular entity and modelling its flow through the economy is, however, more amenable to more rapid progress. One example that is of particular interest to researchers, because of the scientific concern over the enhanced greenhouse effect and the resulting international policy discussions surrounding climate change, is the analysis of the embodiment of CO2 in production. In principal it is possible to calculate embodied CO2, just as it is possible to calculate embodied technology (see Annex C). If the ratio of CO2, emissions to production is known for different industries then it is feasible to calculate an intensity index and from there a weighted transactions table for embodied CO2. The policy importance of this analysis rests with the specific formulation of the Kyoto protocol.
The Kyoto Protocol to the United Nations Framework Convention on Climate Change adopted in 1997 (UNFCCC), is an agreement by ratifying countries to limit their domestic production of greenhouse
26. For full details of the MOSUS project (�Modelling Opportunities And Limits For Restructuring Europe
Towards Sustainability�), go to www.mosus.net
27. Global Interindustry Forcasting System developed by GWS in Germany: www.gws-os.de. Significant data sources are OECD bilateral trade matrices and OECD harmonised I-O tables.

DSTI/DOC(2006)7
31
gas (GHG)28 emissions. Because the emphasis is on the domestic production of GHGs, the discussion of the fragmentation of production (above) is highly relevant to understanding the changes in the global production of GHGs. Changes in the global trade patterns since 1990 could have potentially big implications for the level of domestically produced gases. Ahmad and Wyckoff (2003) have already made this point, observing that:
�Many policies designed to reduce these emissions set emission reduction goals based on some previous level (e.g. 1990 in the case of Kyoto for many countries) which is used as a benchmark for success and compliance to the protocol. But changes in emissions at the national level can occur for many reasons: including the relocation of production abroad, and/or by import substitution. This may have a negligible impact on global emissions but, if the imports use more GHG intensive production processes than the domestically produced goods that they displace, global emissions could well be higher.� (p6)
Shui and Harriss (2006) have come to a similar conclusion noting, �our exploration of the embodied carbon in the US�China trade has revealed that the environmental consequences of international trade are highly relevant to climate change policy considerations�. For example, as US production shifts to China, US national greenhouse gas production is reduced while China�s increases, and because of the differences in technologies used in production, global output of CO2 subsequently increases.
�It is evident that if the goods imported from China had been produced in the US the net contribution of CO2 to the global atmosphere would have been reduced. This is largely due to the relatively high use of coal and less efficient manufacturing technologies in China�s industrial sector.� (2006)
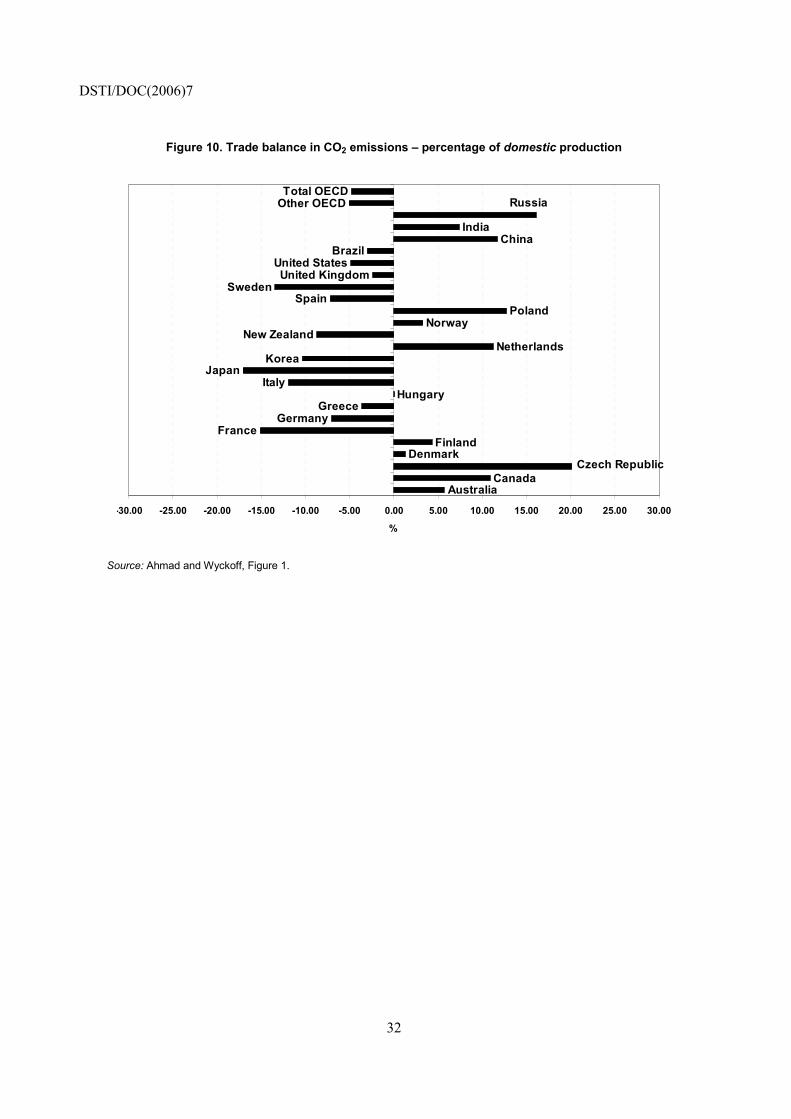
Therefore, for any particular country, domestic production of CO2 may decrease but consumption via imported products may be higher. This difference between domestic consumption and domestic production is reflected in the balance of emissions embodied in imports and those embodied in exports (see Figure 10). For their analysis of flows, Ahmad and Wyckoff (2003) developed an interregional model linked by trade in goods (services were excluded) while Shui and Harriss based their analysis on trade tables. An updated international inter-country input-output dataset would greatly enhance the ability of analysts to track the flows of embodied29 CO2 and thus contribute to future policy debates on measures to reduce greenhouse gas production.
28. Greenhouse gases include, amongst others, Carbon dioxide, Methane Nitrous oxide and Carbon
tetrafluoride.
29. Note that due to the protocol, various countries are making significant efforts to develop such measures. For example, data for Australia are available at www.greenhouse.gov.au/inventory/index.html, while international data is available from the International Energy Agency, www.iea.org
DSTI/DOC(2006)7
32
Figure 10. Trade balance in CO2 emissions � percentage of domestic production
Canada
DenmarkFinland
FranceGermany
GreeceHungary
ItalyJapan
KoreaNetherlands
New ZealandNorway
PolandSpain
SwedenUnited Kingdom
United StatesBrazil
ChinaIndia
Other OECDTotal OECD
Australia
Russia
Czech Republic
-30.00 -25.00 -20.00 -15.00 -10.00 -5.00 0.00 5.00 10.00 15.00 20.00 25.00 30.00
%
Source: Ahmad and Wyckoff, Figure 1.
DSTI/DOC(2006)7
33
5. CONCLUDING REMARKS
This paper has attempted to outline the contribution that input-output analysis can make to a deeper understanding of a few of today�s important policy and research questions. Until recently, many input-output analyses have concentrated on national tables because of the limited availability of comparable and integrated multi-country datasets. The current development of harmonised input-output tables, and accompanying bilateral trade matrices, by the OECD will address these problems and hopefully open up new avenues of research.30 It will, however, not be a total solution.
5.1 A starting point, not an end point � the limitations of the database
Based on the authors� experience with developing inter-country datasets, a number of limitations with the harmonised I-O tables are inevitable and it is important to acknowledge these. Major hurdles include the industry classification, data confidentiality and international trade in services.
Although the current standard industry classification (see Annex A) is a sensible compromise between implementation (maximising data availability across countries) and usefulness (industries of particular interest such as aerospace, motor vehicles and pharmaceuticals are identified), it does not serve everyone�s needs. For example, as mentioned earlier in this paper, the transfer of components for production in ICT-related products has been rising rapidly � yet they are only represented by two industry categories in the dataset. However, even with just two categories, some countries have reporting limitations.31 In the 2002 edition of OECD tables, data for certain detailed manufacturing industries (such as Radio, television and communication equipment and Pharmaceuticals) and some service activities were not reported by some countries. To satisfy the needs of many analysts, more detailed information would be preferable.
Although the availability of trade in services data has improved significantly in recent years, it still presents a challenge. To implement a full inter-regional input-output model, all cells must be filled in. This means that when bilateral trade in services is unavailable it is necessary to develop proxy indicators of likely trading preferences. One classic technique to achieve this is to use gravity modelling (see, for example, Kimura and Lee, 2004). However, with the new dataset providing the means to link input-output tables of OECD countries with those of major non-OECD countries (with very different trading patterns), efforts will be required to determine whether such techniques still produce reasonable proxies. For example, manufacturing trade patterns in comparison to trade in services trade are skewed away from the United States and United Kingdom (important players in services) and towards East Asia.
30. The International Input-Output Association (www.iioa.org) welcomed OECD�s latest efforts at its meeting
in Sendai, Japan, in July 2006.
31. Either due to confidentiality or data collection mechanisms: the underlying data may be based on enterprises rather than establishments, or a national classification may need to be aggregated to match the ISIC-based list.

DSTI/DOC(2006)7
34
5.2 Input-output as a framework for detailed analysis
International harmonised input-output tables will never be able to provide the level of detail that some researchers require, but nevertheless, they can be used to develop frameworks, and provide baseline scenarios, around which more detailed analyses can be performed. For example, international input-output tables can be used to model the overall structure of flows between countries as a framework for deeper analysis. Very detailed trade data could then be used to examine the content of those flows to understand more specifically the types of products that are moving between countries. The existing OECD STAN bilateral trade database (BTD) can already be formatted in such a way as to provide clear information on the bilateral specialisation patterns of countries (see Figure 4). Introducing detailed ICT trade data32 in a similar format would create an opportunity for researchers to examine more closely the specialisation patterns of countries.
5.3 Benefits of OECD�s international Input-Output Database
An often-heard criticism of input-output tables is that they are invariably out-of-date � five year time lags are not uncommon. Some people wonder whether developing a database in 2006 whose latest figures are for the year 2000 is worth the effort. The answer lies both in the type of information provided by input-output and also by what we can learn across time if there is a continuing effort to develop these databases. Users of OECD input-output databases (see Annex D) clearly see a need to continue their development with more recent tables and more country coverage. We know from previous input-output analyses that input structures remain relatively stable for some time so that with periodic updates to international input-output datasets it is possible to monitor the structural pattern of change in consumption, trade and production. Specifically, for example, although there is much discussion of �globalisation�, without input-output researchers would use trade volume information. However, that tells us surprisingly little about the structure of interdependencies between countries, as shown in the example of the aerospace industry (Figure 8). We can continue to develop trade data methodologies, but we can interpret the results with far more insight if we can gain access to periodic updates of international input-output tables. The other benefit, even with episodic updates of input-output tables is that we can monitor the changes in the world economies � which economies require which imports, in what quantities, and how the spatial structures of production in particular sectors change across time.
As more data becomes available, new research questions can be addressed, new methodologies developed and previous policy frameworks examined in the light of better evidence � all of which will encourage the further collection and further development of the data sets. Also, widespread and expanding use by researchers, of varying experience, is expected, and with it, pertinent comments and suggestions that will help further improve the data set.
The current paper has outlined how input-output tables can respond to contemporary research and policy questions concerning the changing dynamics of the modern world economy. The production of an international harmonised input-output database that includes a significant proportion of the world economy will enable us to look inside the changing nature of global production to a greater extent than is currently possible. Such a dataset should also make an important contribution, despite its limitations, to research on the industrial ecology of economies.
32. The OECD has prepared a detailed classification of ICT-related products that can be isolated in existing
trade data. If detailed ICT trade data were provided in a similar format to the existing OECD bilateral trade database, it might be possible to develop specialisation indexes and even some methodologies for estimating a transformation or value added index as countries import particular products and export others.

DSTI/DOC(2006)7
35
REFERENCES
Ahmad, N. and A. Wyckoff (2003), �Carbon Dioxide Emissions Embodied in International Trade of Goods�, OECD STI Working Paper 2003/15, OECD, Paris. www.olis.oecd.org/olis/2003doc.nsf/linkto/dsti-doc(2003)15
Amsden, A. (1995), �Inductive Theory in Economic Development: A Tribute to Wassily Leontief on his 90th birthday�, Structural Change and Economic Dynamics, Vol. 6 (1995): 279-293.
Augusztinovics, M. (1995), �What Input-Output is About�, Structural Change and Economic Dynamics Vol. 6 (1995): 271-277.
Bhagwati, J., A. Panagariya and T.N. Srinivasan (2004), �The Muddles over Outsourcing�, Journal of Economic Perspectives, Vol. 18 (4): 93�114.
Borrus, M., D. Ernst and S. Haggard (eds.) (2000), International Production Networks in Asia: Rivalry or Riches?, London: Routledge.
Brülhart, M. and R.J.R. Elliott (1998), �Adjustment to the European Single Market: Inferences from Intra-industry Trade Patterns�, Journal of Economic Studies, Vol. 25 (3): 225-247.
Centre for International Economics (2004), Economic Analysis of AUSFTA Impact of the Bilateral Free Trade Agreement with the United States, Canberra: Australian Department of Foreign Affairs and Trade.
Cohen, S. (2002), �Mapping Asian Integration: Transnational Transactions in the Pacific Rim�, American Asian Review, Vol. XX (3): 1-29.
Cooper, R.J. (2000), �An Extension of the Block Spatial Path Approach to Analysis of the Influence of Intra and Interregional Trade on Multiplier Effects in General Multiregional Input-Output Models�, Chapter 15 in: A. Reggiani [ed.], Spatial Economic Science: New Frontiers in Theory and Methodology, Berlin: Springer.
Dieztenbacher, E. (2002), �Interregional Multipliers: Looking Backward, Looking Forward�, Regional Studies, Vol. 36 (2): 125�136.
Dietzenbacher, E., I. Romero and N.S. Bosma (2005), �Using Average Propagation Lengths to Identify Production Chains in the Andalusian Economy�, REAL Discussion Papers: Technical Series 2005-T-6, Urbana: Regional Economics Applications Laboratory.
Dong G., G.J.D. Hewings and M. Sonis (2003), �Temporal Changes in the Structure of Chicago�s Economy: 1980 � 2000�, REAL Discussion Papers: Technical Series 03-T-32, Urbana: Regional Economics Applications Laboratory.
DSTI/DOC(2006)7
36
Drejer, I. (2000), �Comparing Patterns of Industrial Interdependence in National Systems of Innovation � A Study of Germany, the United Kingdom, Japan and the United States�, Economic Systems Research 12 (3): 377 � 399.
Drejer, I. (2002), �Input-Output Based Measures of Interindustry Linkages Revisited � A Survey and Discussion�, presented to the 14th International Conference on Input-Output Techniques, Université du Québec à Montréal, Canada, October 10-15, 2002.
Duchin, F. (2004), �Input-Output Economics and Material Flows�, Rensselaer Working Papers in Economics No. 0424, New York: Rensselaer Polytechnic Institute.
Duchin, F. (2005), �A World Trade Model Based on Comparative Advantage�, Economic Systems Research 17 (2): 1-22.
Düring, A. and H. Schnabl (2000), �Imputed Interindustry Technology Flows � A Comparative SMFA Analysis�, Economic Systems Research 12 (3): 363 � 375.
Ernst, D. and K. Linsu (2002), �Global Production Networks, Knowledge Diffusion and Local Capability Formation�, Research Policy, Special Issue in Honour of Richard Nelson and Sydney Winter, Vol. 31 (8/9): 1417-1429.
Eurostat (2001), Economy-Wide Material Flow Accounts and Derived Indicators: A Methodological Guide, Luxembourg: European Communities.
Feenstra, R. (1998), �Integration of Trade and Disintegration of Production in the Global Economy�, Journal of Economic Perspectives, Vol 12 (4): 31-50.
Femia, A. and S. Moll (2005), Use of MFA-Related Family of Tools in Environmental Policy-Making: Overview of Possibilities, Limitations and Existing Examples of Application in Practice, European Environment Agency.
Fischer-Kowalski, M. (2003), �On the History of Industrial Metabolism�, pp. 35-45 in: Bourg, D. and Erkman, S. [eds.] (2003), Perspectives on Industrial Ecology, Sheffield, UK, Greenleaf Publishing.
Foran, B. and F. Poldy (2002a), Dilemmas Distilled: A Summary and Guide to the CSIRO Technical Report Future Dilemmas: Options to 2050 for Australia's Population, Technology, Resources and Environment, Canberra: Commonwealth Scientific and Industrial Research Organisation.
Foran, B. and F. Poldy (2002b), �Future Dilemmas: Options to 2050 for Australia�s Population, Technology, Resources and Environment�, CSIRO Resource Futures Working Paper 02/01, Canberra: Commonwealth Scientific and Industrial Research Organisation.
Frey, D., D. Harrison and E. Billett (2006), �Ecological Footprint Analysis Applied to Mobile Phones�, Journal of Industrial Ecology, Vol. 10 (1�2): 199-216.
Gaulier, G., F. Lemoine and D. Ünal-Kesenci (2006), �China�s Emergence and the Reorganisation of Trade Flows in Asia�, CEPII Working Paper 2006-05, Paris: Centre d'Etudes Prospectives et d'Informations Internationales.
Gereffi, G. and M. Korzeniewicz (eds.) (1994), Commodity Chains and Global Capitalism, Westport: Praeger.
DSTI/DOC(2006)7
37
Gereffi, G., J. Humphrey and T. Sturgeon (2005), �The Governance of Global Value Chains�, Review of International Political Economy, Vol. 12 (1): 78�104.
Giljum, S. and K. Hubacek (2004), �Alternative Approaches of Physical Input-Output Analysis to Estimate Primary Material Inputs of Production and Consumption Activities�, Economic Systems Research. Vol. 16 (3): 301-310.
Guo, D., G. J.D. Hewings and M. Sonis (2003), �Temporal Changes in the Structure of Chicago�s Economy: 1980 � 2000�, REAL Discussion Papers: Technical Series 2003-T-32, Urbana: Regional Economics Applications Laboratory.
Hatzichronoglou, T. (1997), �Revision of the High-Technology Sector and Product Classification�, OECD STI Working Paper 1997/2, OECD, Paris, www.olis.oecd.org/olis/1997doc.nsf/LinkTo/OCDE-GD(97)216
Hauknes, J. and M. Knell (2006), �Inter-linkages Between High Tech and Low Tech Industries: The Example of France, Norway and Spain�, NIFU-STEP, Oslo.
Henderson, J., P. Dicken, M. Hess, N. Coe and H.W-C. Yeung (2002), �Global Production Networks and the Analysis of Economic Development�, Review of International Political Economy, Vol. 9: 436-464.
Hewings, G.J.D., M. Sonis, J. Guo, P.R. Israilevich and G.R. Schindler (1998), �The Hollowing-out Process in the Chicago Economy, 1975-2015�, Geographical Analysis, Vol. 30: 217-233.
Hitomi, K., G. Hewings, N. Yamano and T. Ohkawara (2002), �Hollowing Out Process in Regional Economy: an Interregional Input-Output Analysis�, CRIEPI Report, Central Research Institute of Electric Power Industry.
Hoen, A. (2002), An Input-Output Analysis of European Integration, Amsterdam: North-Holland.
Jones R. W. and H. Kierzkowski (2001), �A Framework for Fragmentation�, in: Arndt S. and Kierzkowski H. (eds.), Fragmentation and International Trade, Oxford: Oxford University Press.
Kehoe, T. (2003), �An Evaluation of the Performance of Applied General Equilibrium Models of the Impact of NAFTA�, Federal Reserve Bank of Minneapolis Research Department Staff Report No. 320, Minneapolis: Federal Reserve Bank of Minneapolis.
Kimura, F. and H-H. Lee (2004), �The Gravity Equation in International Trade in Services�, European Trade Study Group Conference, University of Nottingham.
Leontief, W. (1936), �Quantitative Input-Output Relations in the Economic System of the United States�, Review of Economics and Statistics, Vol. 18 (3): 105-125.
Linden, J. A. van der (1998), Interdependence and Specialisation in the European Union: Intercountry Input-Output Analysis and Economic Integration, The Netherlands: Labyrint Publication.
Lundvall, B-A., B. Johnson, E. Sloth Andersen and B. Dalum (2002), �National Systems of Production, Innovation and Competence Building�, Research Policy 31: 213�231.
Lutz, C., B. Meyer and H.I. Wolter (2005), �GINFORS-Model�, paper presented to 3rd MOSUS workshop, IIASA Laxenburg, April 14-15, 2005, www.mosus.net/documents/Lutz_et_al_2005_GINFORS.pdf
DSTI/DOC(2006)7
38
Miguel A.M. and G.J.D. Hewings (2003), �Geographical Competition between Regional Economies: The Case of Spain�, Annals of Regional Science 37: 559�580.
Miller, R.E. and P.D. Blair (1985), �Input-Output Analysis: Foundations and Extensions�, Prentice-Hall, Englewood Cliffs, New Jersey.
OECD (1992), Structural Change and Industrial Performance: A Seven Country Growth Decomposition Study, OECD, Paris.
OECD (1995), OECD Input-Output Database, ISBN 92-64-04612-7, OECD, Paris.
OECD (1999), Measuring Globalisation: The Role of Multinationals in OECD Economies, 1999 edition, OECD, Paris, www.oecd.org/sti/measuring-globalisation
OECD (2001), Measuring Productivity � OECD Manual, Measurement of Aggregate and Industry-Level Productivity Growth, Paris, www.oecd.org/dataoecd/59/29/2352458.pdf
OECD (2002) [publicly released January 2005], OECD Input-Output Database, OECD, Paris, www.oecd.org/std/io-tables/data
OECD (2004a), The OECD Information Technology Outlook 2004, OECD, Paris, www.oecd.org/sti/ito
OECD (2004b), OECD Statistics on International Trade in Services, Detailed Tables by Partner Country 1999-2002, OECD, Paris, www.oecd.org/document/18/0,2340,en_2649_34243_1945746_1_1_1_1,00.html
OECD (2004c), OECD STAN: Bilateral Trade Database 2004, OECD, Paris, www.oecd.org/sti/btd
OECD (2005), OECD Science, Technology and Industry Scoreboard 2005, OECD, Paris, www.sourceoecd.org/scoreboard
Palm, V. and Jonsson, K (2003), �Materials Flow Accounting in Sweden Material Use for National Consumption and for Export�, in: Journal of Industrial Ecology, Vol. 7 (1): 81-92.
Papaconstantinou, G., N. Sakurai and A. Wyckoff (1996), �Embodied Technology Diffusion: An Empirical Analysis for 10 OECD countries�, OECD STI Working Papers 1996/1, OECD, Paris, www.olis.oecd.org/olis/1996doc.nsf/LinkTo/OCDE-GD(96)26
Pilat, D. and A. Wölfl, (2005), �Measuring the Interaction between Manufacturing and Services�, OECD STI Working Papers 2005/5, OECD, Paris, www.oecd.org/dataoecd/43/33/34946920.pdf
Polenske, K.R. and G.J.D. Hewings (2004), �Trade and Spatial Economic Interdependence�, Papers in Regional Science 83 (1): 269-289.
Rose and Miernyk (1989), �Input-Output: The first Fifty Years�, Economic Systems Research Vol. 1 (2): 229-271.
Sakurai, N., G. Papaconstantinou and A. Wyckoff (1996), �The Impact of R&D and Technology Diffusion on Productivity Growth: Evidence for 10 OECD Countries in the 1970s and 1980s�, OECD STI Working Papers 1996/2, OECD, Paris, www.olis.oecd.org/olis/1996doc.nsf/LinkTo/OCDE-GD(96)27
DSTI/DOC(2006)7
39
Seo, J., G.J.D. Hewings and M. Sonis (2004), �Vertical Connections in the Midwest Economies: The Role of Internal and External Trade�, REAL Discussion Papers: Technical Series 2004-T-10, Urbana: Regional Economics Applications Laboratory.
Kazushige Shimpo and Asako Okamura (2006), �Input-Output Based World Model and its Database�, paper presented to IIOA Intermediate Input-Output Meeting, July 2006, Sendai, Japan, www.atkinn.com/iioa/html/
Shui, B. and R.C. Harriss (2006), �The Role of CO2 Embodiment in US�China Trade�, Energy Policy (in press), www.globalchange.umd.edu/pub_db/index.cfm?display&pubtype=1&pubid=97
Suh, S. and Kagawa, S. (2005), �Industrial Ecology and Input-Output Economics: An Introduction�, Economic Systems Research Vol. 17 (4): 349-364 [December 2005].
Sonis, M. and G.J.D. Hewings (2001), �Feedbacks in Input-Output Systems: Impacts, Loops and Hierarchies�, in: Lahr, M. and E. Dietzenbacher [eds.], Input-Output Analysis: Frontiers and Extensions, Basingstoke: Palgrave.
UNFCCC (1997), Kyoto Protocol to the United Nations Framework Convention on Climate Change, http://unfccc.int/essential_background/kyoto_protocol/background/items/1351.php
United Nations Department for Economic and Social Affairs Statistics Division (1999), Handbook of National Accounting: Handbook of Input-Output Table Compilation and Analysis, New York: United Nations.
United Nations Department for Economic and Social Affairs Statistics Division (2003), National Accounts: A Practical Introduction, New York: United Nations.
Venables, A., P.G. Rice and M. Stewart (2003), �The Geography of Intra-Industry Trade: Empirics�, Topics in Economic Analysis & Policy: Vol. 3: No. 1, Article 11, http://www.bepress.com/bejeap/topics/vol3/iss1/art11
Wixted, B. (2005), �Systems of Innovation Beyond Borders: Linked Clusters and the Role, Scale and Spatial Structure of Extra-Territorial Interdependencies�, unpublished thesis, available at: http://library.uws.edu.au/adt-NUWS/public/adt-NUWS20060407.100831/index.html
Wixted, B. and R. Cooper (in press), �OECD Cluster Networks 1970-2000: An Input-Output Study of Changes in Interdependencies between 9 OECD Countries in ICT Industries�, in: Cooper, R.J., K.P. Donaghy and G.J.D. Hewings [eds.] (2006), Globalization and Regional Economic Modeling, Springer, Heidelberg.
Wixted, B. (forthcoming) �Cluster Complexes: A Framework for Understanding the Internationalisation of Systems of Innovation�, Centre for Policy Research on Science and Technology (CPROST) working paper, Vancouver.
Wixted, B (2006), �The International Spatial Organisation of the Motor Vehicle Production System: Place, Flows, Hierarchy and Evolution�, presented at The DRUID Summer Conference 2006 on Knowledge, Innovation and Competitiveness: Dynamics of Firms, Networks, Regions and Institutions, Copenhagen: 18-20 June 2006.
Wölfl, A. (2005), �The Service Economy in OECD Countries�, OECD STI Working Papers 2005/3, OECD, Paris, www.olis.oecd.org/olis/2005doc.nsf/linkto/dsti-doc(2005)3

DSTI/DOC(2006)7
40
Wyckoff, A. (1993), �The Extension of Networks of Production across Borders�, Science, Technology and Industry Review, 13, 61-87, OECD, Paris.
Yamano, N. and N. Ahmad (2006), �The OECD�s Input-Output Database � 2006 Edition�, OECD STI Working Papers 2006/8, OECD, Paris.
Yi, K.-M. (2003), �Can Vertical Specialization Explain the Growth of World Trade?�, Journal of Political Economy Vol. 111 (1): 52-102.

DSTI/DOC(2006)7
41
ANNEX A. THE INDUSTRY CLASSIFICATION OF THE OECD INPUT-OUTPUT TABLES
ISIC Rev. 2 codes Description ISIC Rev. 3 codes Description ISIC Rev. 3 codes Description
1 1 Agriculture, forestry and fishery 01+02+05 1 Agriculture, hunting, forestry and fishing 01+02+05 1 Agriculture, hunting, forestry and fishing10+11+12 2 Mining and quarrying (energy)13+14 3 Mining and quarrying (non-energy)
31 3 Food, beverages and tobacco 15+16 3 Food products, beverages and tobacco 15+16 4 Food products, beverages and tobacco
32 4 Textiles, apparel and leather 17+18+19 4 Textiles, textile products, leather and footwear 17+18+19 5 Textiles, textile products, leather and
footwear33 5 Wood products and furniture 20 5 Wood and products of wood and cork 20 6 Wood and products of wood and cork
34 6 Paper, paper products and printing 21+22 6 Pulp, paper, paper products, printing and publishing 21+22 7 Pulp, paper, paper products, printing and
publishing
351+352ex3522 7 Industrial chemicals 23 7 Coke, refined petroleum products and nuclear fuel 23 8 Coke, refined petroleum products and
nuclear fuel3522 8 Drugs and medicines 24 excluding 2423 8 Chemicals exluding pharmaceuticals 24 excluding 2423 9 Chemicals exluding pharmaceuticals
353+354 9 Petroleum and coal products 2423 9 Pharmaceuticals 2423 10 Pharmaceuticals355+356 10 Rubber and plastic products 25 10 Rubber and plastics products 25 11 Rubber and plastics products36 11 Non-metallic mineral products 26 11 Other non-metallic mineral products 26 12 Other non-metallic mineral products371 12 Iron and steel 271+2731 12 Iron and steel 271+2731 13 Iron and steel 372 13 Non-ferrous metals 272+2732 13 Non-ferrous metals 272+2732 14 Non-ferrous metals
381 14 Metal products 28 14 Fabricated metal products, except machinery and equipment 28 15 Fabricated metal products, except
machinery and equipment382ex3825 15 Non-electrical machinery 29 15 Machinery and equipment, n.e.c. 29 16 Machinery and equipment, n.e.c.
3825 16 Office and computing machinery 30 16 Office, accounting and computing machinery 30 17 Office, accounting and computing
machinery383ex3832 17 Electrical apparatus, nec 31 17 Electrical machinery and apparatus, n.e.c. 31 18 Electrical machinery and apparatus, n.e.c.
3832 18 Radio, TV and communication equipment 32 18 Radio, television and communication equipment 32 19 Radio, television and communication
equipment3841 19 Shipbuilding and repairing 33 19 Medical, precision and optical instruments 33 20 Medical, precision and optical instruments
3842+3844+3849 20 Other transport 34 20 Motor vehicles, trailers and semi-trailers 34 21 Motor vehicles, trailers and semi-trailers3843 21 Motor vehicles 351 21 Building and repairing of ships and boats 351 22 Building and repairing of ships and boats3845 22 Aircraft 353 22 Aircraft and spacecraft 353 23 Aircraft and spacecraft385 23 Professional goods 352+359 23 Railroad and transport equipment n.e.c. 352+359 24 Railroad and transport equipment n.e.c.
39 24 Other manufacturing 36+37 24 Manufacturing n.e.c. (includes furniture); recycling 36+37 25 Manufacturing n.e.c. (includes furniture);
recycling
2006 edition2002 edition
2 Mining and quarrying10+11+12+13+14
1996 edition
2 Mining and quarrying2

DSTI/DOC(2006)7
42
ISIC Rev. 2 codes Description ISIC Rev. 3 codes Description ISIC Rev. 3 codes Description
401 26 Production, collection and distribution of electricity
402 27 Manufacture of gas; distribution of gaseous fuels through mains
403 28 Steam and hot water supply
41 29 Collection, purification and distribution of water
5 26 Construction 45 26 Construction 45 30 Construction61+62 27 Wholesale and retail trade 50+51+52 27 Wholesale and retail trade; repairs 50+51+52 31 Wholesale and retail trade; repairs63 28 Restaurants and hotels 55 28 Hotels and restaurants 55 32 Hotels and restaurants
60 33 Land transport; transport via pipelines61 34 Water transport62 35 Air transport
63 36 Supporting and auxiliary transport activities; activities of travel agencies
72 30 Communication 64 30 Post and telecommunications 64 37 Post and telecommunications81+82 31 Finance and insurance 65+66+67 31 Finance and insurance 65+66+67 38 Finance and insurance83 32 Real estate and business services 70 32 Real estate activities 70 39 Real estate activities9 33 Community, social and personal services 71 33 Renting of machinery and equipment 71 40 Renting of machinery and equipment
34 Producers of government services 72 34 Computer and related activities 72 41 Computer and related activities35 Other producers 73 35 Research and development 73 42 Research and development36 Statistical discrepancy 74 36 Other business activities 74 43 Other business activities
75 37 Public administration and defence; compulsory social security 75 44 Public administration and defence;
compulsory social security80 38 Education 80 45 Education85 39 Health and social work 85 46 Health and social work
90+91+92+93 40 Other community, social and personal services 90+91+92+93 47 Other community, social and personal
services
95+99 41 Private households with employed persons; Extra-territorrial organisations and bodies 95+99 48 Private households with employed persons;
Extra-territorrial organisations and bodies
2002 edition 2006 edition
29 Transport and storage60+61+62+6329 Transport and storage71
25 Electricity, gas and water supply40+414 25 Electricity, gas and water
1996 edition
Source: OECD (1995, 2002, and 2006).
DSTI/DOC(2006)7
43
ANNEX B. DISTINCTION BETWEEN SINGLE AND MULTI-REGIONAL INPUT-OUTPUT TABLES
The following definitions of the different types of input-output tables are from Polenske (1995: 315-316) � emphasis added.
(1) Regional � A model of a single region, with an m x m technology matrix for the region and with total outflows/inflows that occur from/to the region specified for each of the m commodities. For a particular industry, each input is shown as the total amount a given industry in a region purchases from another industry located in the same region per unit of output of the purchasing industry. The outflows and inflows can be indicated by region of destination and origin if sufficient data are available.
(2) Intranational � A model of two or more regions, either with separate m x m technology matrices for each of the n regions or, in some early cases, with the same (national) technology matrix for each region. For a particular industry, each input is shown as the total amount a given industry in a region purchases from another industry, regardless of where the other industry is located, per unit of output of the purchasing industry. The place where a particular input is produced, in other words, is not specified. (I refer to this as an engineering technology specification.) Outflows or inflows are specified only as net, rather than gross, figures for each commodity in each region; thus, the analyst knows that a particular region is a net exporter or importer of a commodity, but not the amount of the commodity exported and imported.
(3) Multiregional � A model of two or more regions, with separate m °� m technology matrices for each of the n regions and with separate n °� n trade matrices for each of the m commodities. The technology matrix is specified in the same way as for the intranational model. Each trade matrix shows the shipments of a given commodity to and from each of the n regions. {Polenske and Hewings 2004 make this clearer by noting that in multi-regional models the supplies is known but only on a regional basis and not on an industry by industry basis � thus the columns � the purchasing industries are not known].
(4) Interregional � A model of two or more regions, with separate m °� m technology matrices for each of the n regions as for the regional model. Trade is stipulated in terms of industry and region of production and industry and region of consumption; in other words, every element in the mn x mn input-output (inflows/outflows) matrix is specified.

DSTI/DOC(2006)7
44
ANNEX C. CALCULATING �EMBODIED� ACTIVITIES IN INPUT-OUTPUT ANALYSIS
In this paper we have referred to being able to calculate the degree to which research and development and CO2 are �embodied� into products. Here we briefly describe how this can be done. There have been a number of different approaches: Papaconstantinou et al. (1996) in part used input-output multipliers whereas Drejer (2000: 381) weighted the input-output co-efficients by the R&D expenditures in each industry. Ahmad and Wyckoff (2003: 46) use a similar methodology that incorporates imports:
�Let the production function (input-output table) at a point in time for a country be defined as A, with components, aij that represent the ratio of domestic inputs from industry i to the output of industry j (known as the Leontief matrix) where n is the number of industries, and industries 1 to k (<n) are manufacturing. Further let the import matrix (with dimension k*n) be defined as Mc, with components mcij representing the ratio of manufactured imports from industry i in country c (the exporting country) to the output of domestic industry j at f.o.b. prices. Total CO2 consumed within this economy (assuming no imports of services) can be shown to be equal to:
{ }DAIME DAIE mcC
w
c
mc D +−××∑+−× −− )()( 11
Where E is a 1* n vector of the ratio of CO2 emissions per monetary value of domestic output by industry with zero entries for all service industries; D is an n *1 vector of domestic consumption33
of domestic production: Em
c is a 1* k vector of CO2 emissions per unit of country c exports (converted into the importing country�s currency), and known here as the export emission ratio (emission factor); and Dm
c is an n * 1 vector of imports from country c directly purchased as domestic final consumption (not intermediate). W is the total number of exporting countries�.
By replacing the vectors E with other appropriate indicators of interest (R&D expenditure, skill intensity, foreign ownership etc), for both domestic industries and those of trading partners, the embodied presence within industrial output of a variety of phenomena can be estimated.
To model all flows it might be necessary to go beyond intermediate inputs and create links to industry x industry capital flow matrices (showing origins of investment goods both domestically produced and imported). This was the approach used by Papaconstantinou et al. (1996) and is particularly useful when considering service sectors. However, at present, ISIC Rev.3 industry by industry capital flow matrices are only available for a few countries despite the rich information they provide. Development of such tables would noticeably enhance the analytical capabilities of linked input-output tables.
33. �Domestic consumption� includes household final consumption, general government final consumption,
changes in inventories, gross fixed capital formation and valuables, and exports of services but not exports of manufactured products (ISIC 1-40). Ahmad and Wyckoff (2003: 46).

DSTI/DOC(2006)7
45
ANNEX D. USERS OF OECD INPUT-OUTPUT DATABASES
Below is a summary of user profiles based on information from about 550 researchers who requested the 2002 edition of OECD�s Input-Output Database (mid-1990s tables) between December 2004 and May 2006.
Figure D.1. Users by type of institution
AC55%
RES12%
GOV11%
ORG5%
COM17%
AC � Academia; RES � Research institutes; GOV � Government agencies (including national banks); ORG � International Organisations (EC, ECB, IMF, UN etc.); COM � Commercial enterprise.

DSTI/DOC(2006)7
46
Figure D.2. Users by region
NAFTA21%
Europe Big 429%
Other OECD Europe
27%
Non-OECD14%
OECD Asia/Oceania
9%
NAFTA � Canada, Mexico, US ; Europe Big 4 - France, Germany, Italy, UK; OECD Asia/Oceania � Australia, Japan, Korea, New Zealand.
In December 2005, a brief questionnaire was sent to 400 users of OECD�s Input-Output Database in 48 countries requesting information concerning the types of analyses that they used the tables for. The response rate was good � 50 replies from 22 countries with no reminder required. The uses were wide-ranging and can be summarised as follows:
• Growth accounting / productivity analysis distinguishing capital, labour, energy, materials and services (KLEMS) inputs.
• Energy use, natural resources and sustainable growth, including work on carbon embodiment.
• Global value chains / interdependency of countries.
• Global trends � outsourcing, trade patterns, general structural change � importance of services, role of ICT.
• Industry-specific studies (e.g. construction, tourism).
• Country-specific studies.
• Price effects (i.e. effect of price shocks on an economy).
The survey results confirmed that there is growing demand for harmonised input-output tables for OECD countries and major non-OECD economies (such as Brazil, China and India) and strong recognition of OECD�s contribution in this area.