world agricultural supply and demand...
TRANSCRIPT

United StatesDepartment ofAgriculture
Office of theChief Economist
World Agricultural SupplyAnd Demand EstimatesAgricultural Marketing ServiceEconomic Research ServiceFarm Service AgencyForeign Agricultural Service
WASDE-386 Approved by the World Agricultural Outlook Board May 10, 2002
Note: This report presents USDA’s initial assessment of U.S. and world crop supply and demand prospectsand U.S. price prospects for the 2002/03 season. Also presented are the first projections of U.S. livestockproduct supply, use, and prices for the new year (2003 for animal products and 2002/03 for milk). Projections are based on economic analysis, normal weather, trends, and judgment.
Because planting of spring crops is still underway in the Northern Hemisphere and remains several monthsaway in the Southern Hemisphere, these projections are highly tentative. Substantial variation may resultfrom weather developments, economic factors, and policy changes. National Agricultural Statistics Service(NASS) forecasts are used for U.S. winter wheat. For other U.S. crops, the March 28 NASS ProspectivePlantings report is used for planted acreage, and methods used to project harvested acreage and yield arenoted on each table.
Several changes are introduced in today’s report. For grains, import and export forecasts for the EuropeanUnion (EU-15) are revised to exclude trade between EU members. Exports of U.S. broiler meat are revisedto exclude exports of chicken feet (paws), which are not reported in federally inspected broiler production. Historical revisions of grain supply and use estimates for the EU-15 and the world, as well as revisions toU.S. broiler supply and use, are available at: http://www.usda.gov/oce/waob/wasde/wasde.htm.
WHEAT: The 2002/03 outlook for U.S. wheat is dominated by prospects for the smallest U.S.wheat exports in more than 30 years. Total production is projected down 4 percent from2001/02 to 1,886 million bushels. The survey-based forecast of winter wheat production is 4percent below a year earlier due to lower area and yields. Using planting intentions and averageharvested-to-planted ratios and yields results in lower spring wheat (including durum) production. The smaller crop and the smallest carryin stocks since 1998/99 drop total 2002/03 suppliesalmost 7 percent below a year earlier.
Projected 2002/03 use is down around 4 percent from a year earlier. Domestic use is up slightlydue to expanding food use. However, projected exports of 875 million bushels are down 100million bushels from the 2001/02 forecast and would be the lowest since 610 million bushels in1971/72. Reduced U.S. export prospects are due to smaller U.S. supplies, shrinking globalimports, and intense competition. Although total use is declining, it will exceed production plusimports and result in a further drop in U.S. ending stocks. However, U.S. prices will receive littleadded support from the declining stocks due to the bleak export prospects. The projected pricerange for 2002/03 is $2.50 to $3.10 per bushel, compared with an estimated $2.78 for2001/02.
Projected 2002/03 global wheat production is up sharply from a year earlier, led by gains in theEU. Expanding use is expected to absorb the larger crops, leaving global ending stocks littlechanged from a year earlier. Production in the major exporters (Argentina, Australia, Canada, andthe EU) is projected up more than 19 million tons or almost 13 percent. In addition, India's crop

WASDE-386-2
is expected to rise more than 5 million tons in 2002/03, intensifying the pressure to reducealready huge government stocks via exports. The combined production of Russia, Ukraine, andKazakstan is projected down more than 10 million tons from 2001/02 but carryin stocks are upmore than 14 million tons, leaving ample supplies for export. Global imports are projected downslightly, despite an expected doubling in China's imports from the 1.5 million tons expected for2001/02. EU imports, forecast at a world-leading 8 million tons for 2001/02, are expected todrop by half.
COARSE GRAINS: The U.S. 2002/03 corn crop is projected at 9,935 million bushels, up almost 5percent from last year, based on prospective plantings reported in March, harvested-to-plantedrelationships for recent years, and trend yields. However, the larger crop is partially offset bysmaller expected carryin stocks, and total 2002/03 corn supplies are up only a little more than 1percent.
Total use in 2002/03 is expected to expand due to gains in domestic use and exports. Domesticuse is expected to rise slightly as expanding industrial use more than offsets reduced feed andresidual use because of declining cattle on feed. U.S. corn exports, however, are projected upsignificantly because of less competition from foreign exporters. With use exceeding production,2002/03 ending stocks of corn are down slightly from the forecast carryin level. The projectedprice range for corn is $1.75 to $2.15 for 2002/03 and $1.85 to $1.95 for 2001/02.
Global 2002/03 coarse grain production and use are up sharply from a year earlier, but endingstocks are lower. Larger coarse grain crops are expected in the United States, China, Canada,and several other countries. Crops in Eastern Europe and the countries of the former Soviet Unionwill drop from the extraordinary levels of 2001/02, but remain relatively large. However, thecrops that will have the largest potential impact on world corn trade are centered in SouthAmerica. While Argentina is still harvesting the 2001/02 crop and planting for the 2002/03 cropis many months away, corn plantings and production are expected to drop, reflecting betterexpected returns from other crops. This would mean significantly less Argentine corn exports in2002/03. In addition, prospects for Brazil's second or winter corn crop for the 2001/02 yearhave been cut by prolonged dry conditions. Prices have risen sharply, shutting off exports. Thus,Brazil is not expected to have corn supplies available for export until its 2002/03 main crop isharvested in January-March 2003. Expanding production and large stocks are expected to resultin China's corn exports remaining relatively large, although the 4 million tons projected for2002/03 is down from the revised forecast of 6 million tons in 2001/02.
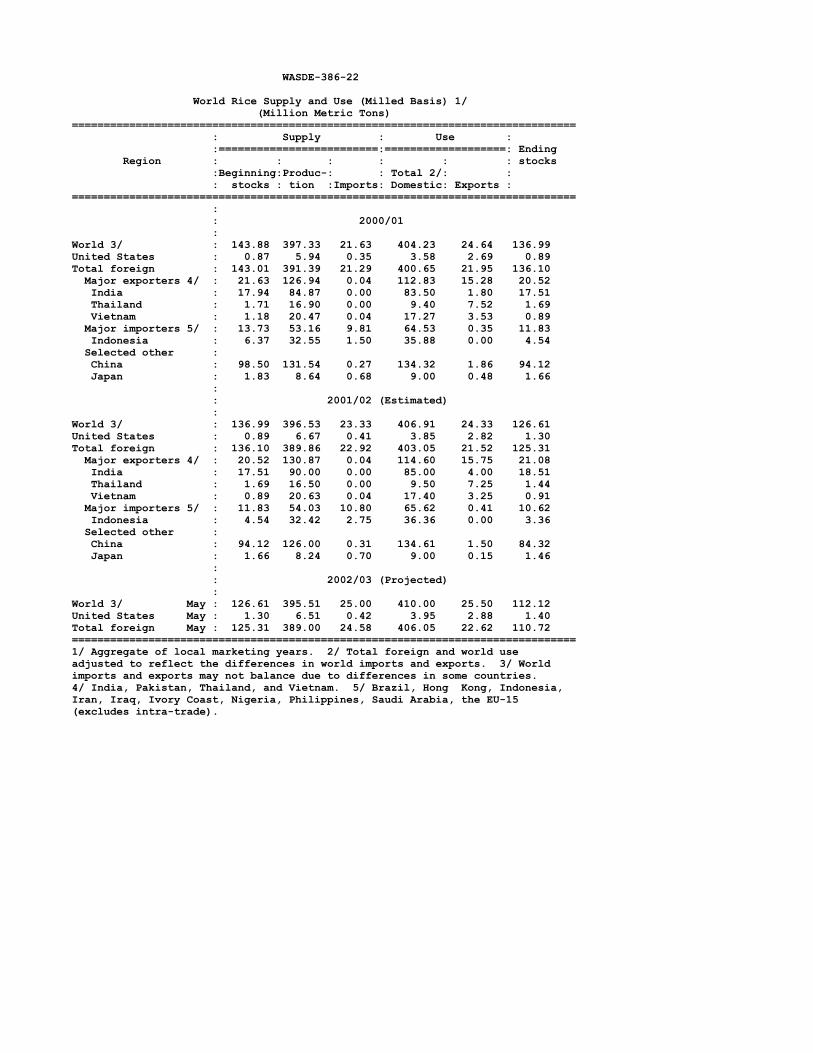
RICE: U.S. rice production in 2002/03 is projected at 208 million cwt, down 2 percent from 2001/02 but still the second largest crop on record. Harvested area in 2002/03 is projected at3.3 million acres, based on the NASS Prospective Plantings report, and is nearly unchanged from2001/02. Rice yield is projected at 6,299 pounds per acre, down 2 percent from the 2001/02record. Long-grain rice production is projected at 160 million cwt, down 3 percent from therecord of 2001/02, while combined medium- and short-grain rice production is projected at 48million cwt, nearly the same as in 2001/02. Domestic and residual use is projected at a record126.1 million cwt, up nearly 2.5 percent. Exports are projected at 92 million cwt, up 2 percentfrom the revised 2001/02 level. Rough rice exports are projected at 27 million cwt, equal torevised 2001/02 exports. Ending stocks for 2002/03 are projected at 44.6 million cwt, up about7.5 percent. Ending stocks of long-grain rice for 2002/03 are projected at 36.1 million cwt whilecombined medium- and short-grain stocks are projected at 7.2 million cwt. Rice prices areexpected to continue to be under pressure from intense competition among the major exporters aswell as burdensome domestic supplies. The season-average price range for 2002/03 is $3.95 to$4.45 per cwt compared to $4.15 to $4.25 per cwt for 2001/02. The 2002/03 milling yield isprojected at 69 percent, the same as the revised rate for 2001/02.

WASDE-386-3
Global 2002/03 rice production is projected at 395.5 million tons assuming normal globalweather, down slightly from the revised 2001/02 forecast. World consumption is projected at arecord level. Global exports are expected to pick up compared to the levels of 2001/02 and2000/01. Ending stocks in 2002/03 are projected to decline 11 percent to a little over 112million tons, the third consecutive year of falling stocks.
World production for 2001/02 is increased 1.3 million tons this month to 396.5 million tons,largely because of increases in Burma, Cambodia, and India; partially offset by a reduction inIndonesia. India’s 2001/02 rice crop is estimated at a record 90 million tons, 1 million tons abovelast month and 5.1 million tons above 2000/01. Exports in 2001/02 in Burma and India areraised while Vietnam’s exports are lowered.
OILSEEDS: U.S. oilseed production for 2002/03 is projected to decrease by 2.4 million tons, orabout 3 percent, to 87.6 million tons. Soybean production will decline about 40 million bushelsto a projected 2.85 billion bushels, or 77.6 million tons. Other U.S. oilseed production isexpected to decrease by over 1 million tons, led by projected reductions for cottonseed andsunflowerseed. U.S. soybean production is based on intended soybean plantings of 73 millionacres and a trend yield of 39.7 bushels per acre. Soybean supplies are projected at 3.1 billionbushels, almost unchanged from 2001/02 due to larger carryin stocks. A modest increase indomestic soybean crush is expected, reflecting expanding pork and poultry production. Reducedexport prospects leave the projected soybean carryover little changed from the forecast 2001/02level. U.S. soybean and soybean meal export prospects in 2002/03 are reduced because ofrecord competitor supplies, particularly in the first half of the marketing year. Global oilseed production for 2002/03 is projected at a record 331 million metric tons, up about 7million tons from 2001/02. Foreign oilseed production is projected to increase about 10 milliontons to 243 million tons. Total foreign supplies are projected up about 8 million tons to 267.5million tons.
U.S. season-average soybean prices for 2002/03 are projected at $4.00 to $4.90 per bushel,compared with a forecast of $4.25 per bushel in 2001/02. Based on a midpoint of $4.45 perbushel, this would be the first annual price increase since 1996/97. Soybean meal prices areprojected at $145 to $175 per short ton, compared with $159 per ton forecast for 2001/02. Soybean oil prices in 2002/03 are projected at 15 to 18 cents per pound, compared with 15.1cents per pound forecast for 2001/02.
Global oilseed output for 2001/02 is estimated at 324.1 million tons, down 1 million from lastmonth. Soybean production is reduced this month for both Paraguay and Indonesia, based largelyon reduced yields. Other production changes this month include a 0.2-million-ton increase insunflowerseed production for Argentina, and a 0.7-million-ton increase for Indonesia’s palm oilproduction. Soybean imports for China are reduced 1 million tons this month, declining to aprojected 11 million tons. Soybean exports from Brazil and Argentina are reduced this month,reflecting the reduced import demand by China.
U.S. soybean crush for 2001/02 is increased 5 million bushels this month in response to a rise indomestic soybean meal use to 32.6 million short tons.
SUGAR: Projected U.S. sugar production for fiscal year 2002/03 is 8.75 million short tons, rawvalue, up 746,000 tons from 2001/02. Beet sugar production is projected at 4.5 million tons, up500,000 tons, based mainly on increased acreage. Projected cane sugar production is 4.25million tons, up 246,000 tons, based mainly on per-acre productivity increases. Projected2002/03 non-program imports are 60,000 tons, down 30,000 tons due to lower projected

WASDE-386-4
imports of high-tier sugar from Mexico. The 2002/03 tariff rate quota (TRQ) has not beenannounced. On the use side, deliveries for use in domestic food and beverages are projected at10.085 million tons, up 100,000 tons.
For 2001/02, cane sugar production is decreased this month based on factory reporting, withlower output in Florida and Puerto Rico more than offsetting an increase in Texas. Imports underthe TRQ are decreased 177,157 tons to reflect the surrender of Certificates for Quota Eligibility(CQE) in exchange for CCC sugar stocks. Sugar used in domestic food and beverages isdecreased 100,000 tons, based on continued weak deliveries. CCC stocks are lowered 129,000tons, mostly reflecting the CQE exchange. Forecast ending stocks are 1.617 million tons and thestocks-to-use ratio is 16 percent, down from 16.9 percent last month.
LIVESTOCK, POULTRY, AND DAIRY: Total U.S. meat production in 2003 is projected to declinefractionally from 2002 as lower beef production offsets increased pork and poultry production. Beef production is expected to decline in late 2002 and throughout 2003 as lower cattleinventories and a return to favorable grazing conditions reduce feedlot placements. Record porkoutput is projected in 2003, although weak prices expected in fourth-quarter 2002 may constrainthe sector’s growth. Larger hog imports also are projected for 2003. Broiler and turkeyproduction are expected to expand modestly in 2003. Egg production is expected to grow about1 percent in 2003, as weak egg prices in 2002 limit growth in the laying flock.
Forecast 2002 total meat production is raised this month. Increased cattle placements areexpected to result in higher beef production, especially through the summer quarter. Porkproduction is increased this month because of higher hog slaughter, partially due to higherimports. Recovery from recent weakness in broiler eggs set and heavier weights point towardincreased broiler meat output.
U.S. broiler supply and use is adjusted to reflect the removal of chicken feet/paws exports (HTSB0207.14.0045) from the supply and use balances for broiler meat because reported broiler meatproduction does not include feet. Including chicken feet in exports resulted in overstating theproportion of broiler meat exported and understating domestic consumption. For statisticalreporting, chicken feet/paws exports will continue to be included as chicken exports but notcategorized as broiler meat. Revisions to broiler supply and use data back to 1997 are availableat http://www.usda.gov/oce/waob/wasde/wasde.htm.
Meat trade is projected to be higher in 2003. Lower cow slaughter will encourage increasedimports of beef, while improved foreign demand is expected to lead to export recovery. Largerred meat exports will depend on economic growth and a return in consumer confidence in thewholesomeness of beef in Japan. Poultry exports in 2003 are expected to increase following thisyear’s slow first half.
Cattle prices in 2003 are projected to increase from anticipated 2002 levels because of smallerinventories and stronger demand. Hog and broiler prices will increase as lower beef productionkeeps total meat supplies at about the 2002 level and exports increase. Forecast 2002 prices forlivestock and poultry are reduced from last month because of larger than previously expectedsupplies of meat and relatively lackluster demand.
Dairy production in 2002/03 is projected to increase about 2 percent as higher output per cowmore than offsets a reduction in cow numbers. Milk/feed price ratios are expected to remain nearthis year’s level, which will help support gains in production. However, relatively lacklusterdemand for skim solids and a return to historical levels of growth in fat demand will forestall anyprice recovery. With the extension of the $9.90 per cwt support price, continued removals of

WASDE-386-5
nonfat dry milk (NDM) by the CCC are expected. Despite assumption of continued support forNDM purchases, recent large production of butter has resulted in lowering of the forecast price forClass IV milk in 2001/02. The Class III price forecast for 2001/02 is about unchanged. Weakclass prices are expected to carry through in 2002/03 with all milk prices forecast at $12.25 to$13.25 per cwt, slightly lower than 2001/02.
COTTON: The first U.S. projections for 2002/03 include sharply lower production, marginallyhigher disappearance, and lower ending stocks. Production is projected at 17.8 million bales,based on the area in the Prospective Plantings report, combined with 10-year averageabandonment and yields. Domestic mill use is projected at 7.8 million bales, a 2.6-percentincrease from the current season, reflecting anticipated growth in retail cotton consumption aseconomic conditions improve. Exports are projected at 11.0 million bales, the same as therevised 2001/02 level; these are the largest exports since 1926/27. Stronger foreign importdemand and continued surplus domestic supplies will sustain an historically large U.S. share ofworld trade. Ending stocks are likely to drop 1.0 million bales to 6.7 million, about 36 percent oftotal use.
World production and consumption for 2002/03 are projected at 91.0 and 95.5 million bales,respectively, reducing world stocks almost 10 percent to 40.6 million bales. Production isprojected to fall 7 percent as the current season’s historically low prices have significantlyreduced planted area. World use is expected to rebound more than 2 percent, above the long-runaverage growth rate, as economic recovery and competitive cotton prices stimulate demand. Larger consumption will also boost world trade.
For 2001/02, U.S. ending stocks are reduced this month reflecting higher forecasts of both milluse and exports, which are based on activity to date. The world 2001/02 estimates show largersupplies relative to last month, partially offset by higher consumption, with ending stocks raisednearly 400,000 bales. Historical revisions in the estimates for Brazil account for a 1-percentincrease in world beginning stocks and about half of the increase in world production; productionis also raised in Australia and Pakistan. World consumption also is raised nearly 1 percent,reflecting increases for China, Turkey, Mexico, and the United States; in addition, consumptiondata are now included for Bahrain and Mauritius.
Approved by the Secretary of Agriculture and the World Agricultural Outlook Board, Gerald A. Bange,Chairperson, (202) 720-6030. This report was prepared by the Interagency Commodity EstimatesCommittees. Committee members are listed on page 34.
APPROVED:
ANN M. VENEMANSECRETARY OF AGRICULTURE
* * * * * * * * * *
See page 35 for a guide to finding other USDA outlook reports.
The next issue of this report will be released 8:30 a.m. ET on June 12, 2002.
The World Agricultural Supply and Demand Estimates (WASDE) report will be released 8:30 a.m. EasternTime on the following dates in 2002: June 12, July 11, Aug. 12, Sep. 12, Oct. 11, Nov. 12, and Dec. 10.

WASDE-386-6 World and U.S. Supply and Use for Grains 1/ Million Metric Tons=============================================================================== : : Total : : Total : Ending Commodity : Output : Supply : Trade 2/ : Use : Stocks=============================================================================== : : WorldTotal grains 3/ : 2000/01 : 1,839.23 2,369.91 233.21 1,876.39 493.52 2001/02 (Est.) : 1,857.23 2,350.76 229.17 1,893.85 456.90 2002/03 (Proj.) : May : 1,896.44 2,353.34 230.94 1,920.15 433.18Wheat : 2000/01 : 583.88 760.98 102.78 590.52 170.46 2001/02 (Est.) : 580.63 751.10 107.11 587.94 163.15 2002/03 (Proj.) : May : 595.75 758.90 105.87 596.48 162.42Coarse grains 4/ : 2000/01 : 858.02 1,067.72 105.80 881.64 186.08 2001/02 (Est.) : 880.07 1,066.15 97.72 899.00 167.14 2002/03 (Proj.) : May : 905.18 1,072.32 99.56 913.67 158.64Rice, milled : 2000/01 : 397.33 541.21 24.64 404.23 136.99 2001/02 (Est.) : 396.53 533.51 24.33 406.91 126.61 2002/03 (Proj.) : May : 395.51 522.12 25.50 410.00 112.12 : : United StatesTotal grains 3/ : 2000/01 : 339.83 420.91 88.07 255.40 77.43 2001/02 (Est.) : 321.81 405.06 85.26 253.42 66.37 2002/03 (Proj.) : May : 332.31 404.83 86.96 255.85 62.01Wheat : 2000/01 : 60.76 89.05 28.87 36.34 23.85 2001/02 (Est.) : 53.28 79.98 26.54 33.37 20.08 2002/03 (Proj.) : May : 51.32 74.26 23.81 33.61 16.83Coarse grains 4/ : 2000/01 : 273.13 324.70 56.51 215.49 52.70 2001/02 (Est.) : 261.86 317.11 55.91 216.20 45.00 2002/03 (Proj.) : May : 274.48 322.34 60.27 218.28 43.79Rice, milled : 2000/01 : 5.94 7.15 2.69 3.58 0.89 2001/02 (Est.) : 6.67 7.97 2.82 3.85 1.30 2002/03 (Proj.) : May : 6.51 8.23 2.88 3.95 1.40===============================================================================1/ Aggregate of local marketing years. 2/ Based on export estimate. Seeindividual commodity tables for treatment of export/import imbalances. 3/Wheat, coarse grains and milled rice. 4/ Corn, sorghum, barley, oats, rye,millet and mixed grains (for U.S. excludes millet and mixed grains).

WASDE-386-7 World and U.S. Supply and Use for Grains, Continued 1/ Million Metric Tons=============================================================================== : : Total : : Total : Ending Commodity : Output : Supply : Trade 2/ : Use : Stocks=============================================================================== : : Foreign 3/Total grains 4/ : 2000/01 : 1,499.40 1,949.00 145.14 1,620.98 416.09 2001/02 (Est.) : 1,535.42 1,945.70 143.91 1,640.43 390.53 2002/03 (Proj.) : May : 1,564.12 1,948.51 143.97 1,664.30 371.17Wheat : 2000/01 : 523.12 671.93 73.92 554.18 146.61 2001/02 (Est.) : 527.36 671.11 80.58 554.58 143.07 2002/03 (Proj.) : May : 544.43 684.64 82.06 562.87 145.59Coarse grains 5/ : 2000/01 : 584.89 743.01 49.28 666.15 133.38 2001/02 (Est.) : 618.21 749.04 41.81 682.80 122.15 2002/03 (Proj.) : May : 630.69 749.98 39.29 695.39 114.86Rice, milled : 2000/01 : 391.39 534.06 21.95 400.65 136.10 2001/02 (Est.) : 389.86 525.55 21.52 403.05 125.31 2002/03 (Proj.) : May : 389.00 513.89 22.62 406.05 110.72===============================================================================1/ Aggregate of local marketing years. 2/ Based on export estimate. Seeindividual commodity tables for treatment of export/import imbalances. 3/Total foreign is equal to world minus United States. 4/ Wheat, coarse grainsand milled rice. 5/ Corn, sorghum, barley, oats, rye, millet and mixedgrains.
World and U.S. Supply and Use for Cotton 1/ Million 480-lb. bales=============================================================================== : : Total : : Total : Ending Commodity : Output : Supply : Trade 2/ : Use : Stocks=============================================================================== : : World 2000/01 : 88.74 131.23 26.28 92.12 40.08 2001/02 (Est.) : 97.95 138.03 29.26 93.46 44.81 2002/03 (Proj.) : May : 91.00 135.81 30.70 95.50 40.61 : United States 2000/01 : 17.19 21.12 6.76 8.86 6.00 2001/02 (Est.) : 20.30 26.33 11.00 7.60 7.70 2002/03 (Proj.) : May : 17.80 25.53 11.00 7.80 6.70 : Foreign 3/ 2000/01 : 71.55 110.12 19.51 83.26 34.08 2001/02 (Est.) : 77.65 111.70 18.26 85.86 37.11 2002/03 (Proj.) : May : 73.20 110.29 19.70 87.70 33.91===============================================================================1/ Marketing year beginning August 1. 2/ Based on export estimate. 3/ TotalForeign is equal to world minus United States. See global cotton tables fortreatment of export/import imbalances.

WASDE-386-8 World and U.S. Supply and Use for Oilseeds 1/ (Million Metric Tons)=============================================================================== : : Total : : Total : Ending Commodity : Output : Supply : Trade : Use 2/ : Stocks=============================================================================== : : WorldOilseeds : 2000/01 : 313.35 347.38 71.68 256.20 33.83 2001/02 (Est.) : 324.08 357.91 70.36 266.24 33.14 2002/03 (Proj.) : May : 331.00 364.14 Oilmeals : 2000/01 : 176.59 182.35 56.93 176.75 5.25 2001/02 (Est.) : 183.64 188.89 58.95 183.32 5.22 2002/03 (Proj.) : May : Vegetable Oils : 2000/01 : 89.64 97.69 34.87 89.38 8.03 2001/02 (Est.) : 91.42 99.45 35.88 91.83 7.09 2002/03 (Proj.) : May : : : United StatesOilseeds : 2000/01 : 84.89 94.69 28.08 49.02 7.83 2001/02 (Est.) : 89.86 98.28 28.79 50.53 8.41 2002/03 (Proj.) : May : 87.60 96.60 27.39 51.04 7.96Oilmeals : 2000/01 : 38.20 39.66 7.19 32.07 0.40 2001/02 (Est.) : 38.91 40.28 7.31 32.67 0.30 2002/03 (Proj.) : May : 39.33 40.88 7.20 33.40 0.28Vegetable Oils : 2000/01 : 9.51 12.42 1.06 9.67 1.69 2001/02 (Est.) : 9.68 12.98 1.43 10.09 1.47 2002/03 (Proj.) : May : 9.87 13.19 1.28 10.46 1.32 : : Foreign 3/Oilseeds : 2000/01 : 228.46 252.69 43.61 207.18 26.00 2001/02 (Est.) : 234.22 259.63 41.56 215.71 24.72 2002/03 (Proj.) : May : 243.40 Oilmeals : 2000/01 : 138.39 142.69 49.73 144.68 4.85 2001/02 (Est.) : 144.73 148.60 51.64 150.64 4.92 2002/03 (Proj.) : May : Vegetable Oils : 2000/01 : 80.13 85.27 33.81 79.72 6.34 2001/02 (Est.) : 81.73 86.46 34.45 81.74 5.62 2002/03 (Proj.) : May : ===============================================================================1/ Aggregate of local marketing years with Brazil and Argentina on anOct.-Sept. year. 2/ Crush only for oilseeds. 3/ Total foreign is equal toworld minus United States.

WASDE-386-9 U.S. Wheat Supply and Use 1/=============================================================================== : : : 2002/03 Projections Item : 2000/01 : 2001/02 :============================== : : Est. : May===============================================================================Area : Million acres Planted : 62.6 59.6 59.0 * Harvested : 53.1 48.7 47.1 *Yield per harvested : Bushels acre : 42.0 40.2 40.1 * : Million bushelsBeginning stocks : 950 876 738Production : 2,232 1,958 1,886Imports : 90 105 105 Supply, total : 3,272 2,939 2,729Food : 956 945 955Seed : 80 81 80Feed and residual : 299 200 200 Domestic, total : 1,335 1,226 1,235Exports : 1,061 975 875 Use, total : 2,396 2,201 2,110Ending stocks : 876 738 619 CCC inventory : 97 95 Free stocks : 779 643Avg. farm price ($/bu) 2/ : 2.62 2.78 2.50- 3.10=============================================================================== U.S. Wheat by Class: Supply and Use=============================================================================== Year beginning : Hard : Hard : Soft : : : June 1 : Winter : Spring : Red : White : Durum : Total===============================================================================2001/02 (estimated) : Million bushelsBeginning stocks : 411 210 135 75 45 876Production : 767 476 400 232 84 1,958 Supply, total 3/ : 1,179 750 535 314 162 2,939Domestic use : 463 313 269 96 86 1,226Exports : 360 220 200 150 45 975 Use, total : 823 533 469 246 130 2,201 Ending stocks May : 356 217 66 68 31 738 Apr : 356 212 66 68 31 733===============================================================================Note: Totals may not add due to rounding. 1/ Marketing year beginning June 1. 2/ Marketing-year weighted average price received by farmers. 3/ Includesimports. * Planted acres reported in March 28, 2002, Prospective Plantings. Harvested acres and yield for spring wheat (including durum) projected usingharvested-to-planted ratios and yields by State for 1999-2001. Winter wheatharvested acreage and yield reported in May 10 Crop Production.
******************************************************************************* ** ** Wheat-by-class projections for 2002/03 will first be published ** in the July 11 WASDE. ** ** *******************************************************************************

WASDE-386-10 U.S. Feed Grain and Corn Supply and Use 1/=============================================================================== : : : 2002/03 Projections Item : 2000/01 : 2001/02 :============================== : : Est. : May===============================================================================FEED GRAINS :Area : Million acres Planted : 99.1 95.4 98.3 * Harvested : 87.7 83.6 86.8 *Yield per harvested : Metric tons acre : 3.11 3.13 3.16 : Million metric tonsBeginning stocks : 48.8 52.7 45.0Production : 272.9 261.7 274.2Imports : 2.6 2.4 2.8 Supply, total : 324.4 316.7 321.9Feed and residual : 159.6 158.0 157.0Food, seed & industrial : 55.6 57.9 60.9 Domestic, total : 215.2 215.9 217.9Exports : 56.5 55.9 60.3 Use, total : 271.7 271.8 278.2Ending stocks, total : 52.7 45.0 43.8 CCC inventory : 0.2 0.2 Free stocks : 52.4 44.8 Outstanding loans : 6.6 5.9 :CORN :Area : Million acres Planted : 79.6 75.8 79.0 * Harvested : 72.4 68.8 72.0 *Yield per harvested : Bushels acre : 136.9 138.2 137.9 * : Million bushelsBeginning stocks : 1,718 1,899 1,621Production : 9,915 9,507 9,935Imports : 7 10 15 Supply, total : 11,639 11,416 11,571Feed and residual : 5,838 5,825 5,750Food, seed & industrial : 1,967 2,045 2,160 Domestic, total : 7,805 7,870 7,910Exports : 1,935 1,925 2,100 Use, total : 9,740 9,795 10,010Ending stocks, total : 1,899 1,621 1,561 CCC inventory : 8 5 Free stocks : 1,891 1,616 Outstanding loans : 253 225Avg. farm price ($/bu) 2/ : 1.85 1.85- 1.95 1.75- 2.15===============================================================================Note: Totals may not add due to rounding. 1/ Marketing year beginningSeptember 1 for corn and sorghum; June 1 for barley and oats. 2/ Marketing-yearweighted average price received by farmers. * The planted acres estimatereported in March 28, 2002, Prospective Plantings. For corn: Harvested acresprojected by using relationship between planted and harvested for 1999-2001. Projected yield derived from simple linear trend fit over 1960-2001 period.

WASDE-386-11 U.S. Sorghum, Barley and Oats Supply and Use 1/=============================================================================== : : : 2002/03 Projections Item : 2000/01 : 2001/02 :============================== : : Est. : May=============================================================================== : Million bushelsSORGHUM :Area planted (mil. acres) : 9.2 10.3 9.0 *Area harv. (mil. acres) : 7.7 8.6 7.7 *Yield (bushels/acre) : 60.9 59.9 69.0 *Beginning stocks : 65 42 46Production : 471 515 533Imports : 0 0 0 Supply, total : 536 556 579Feed and residual : 220 215 225Food, seed & industrial : 35 45 50 Total domestic : 255 260 275Exports : 239 250 250 Use, total : 494 510 525Ending stocks, total : 42 46 54Avg. farm price ($/bu) 2/ : 1.89 1.80- 1.90 1.60- 2.00 :BARLEY :Area planted (mil. acres) : 5.9 5.0 5.1 *Area harv. (mil. acres) : 5.2 4.3 4.5 *Yield (bushels/acre) : 61.1 58.2 62.1 *Beginning stocks : 111 106 84Production : 319 250 278Imports : 29 23 30 Supply, total : 459 379 392Feed and residual : 123 95 110Food, seed & industrial : 172 172 172 Total domestic : 295 267 282Exports : 58 28 25 Use, total : 353 295 307Ending stocks, total : 106 84 85Avg. farm price ($/bu) 2/ : 2.11 2.23 1.95- 2.35 :OATS :Area planted (mil. acres) : 4.5 4.4 5.1 *Area harv. (mil. acres) : 2.3 1.9 2.5 *Yield (bushels/acre) : 64.2 61.3 61.2 *Beginning stocks : 76 73 55Production : 150 117 155Imports : 106 95 100 Supply, total : 332 285 310Feed and residual : 189 155 175Food, seed & industrial : 68 72 72 Total domestic : 257 227 247Exports : 2 3 2 Use, total : 259 230 249Ending stocks, total : 73 55 61Avg. farm price ($/bu) 2/ : 1.10 1.55 0.90- 1.30===============================================================================Note: Totals may not add due to rounding. 1/ Marketing year beginningSeptember 1 for sorghum, June 1 for barley and oats. 2/ Marketing-year weightedaverage price received by farmers. * Planted acres reported in March 28, 2002,Prospective Plantings. Sorghum and barley: Harvested acres projected by using relationship between planted and harvested for 1999-2001 for sorghum and1999-2001 for barley. For sorghum, barley, and oats projected yield derivedfrom simple linear trend fit over 1960-2001 period. Oats: Harvested acresreported in March 28, 2002 Prospective Plantings.

WASDE-386-12 U.S. Rice Supply and Use 1/ (Rough Equivalent of Rough and Milled Rice)=============================================================================== : : : 2002/03 Projections Item : 2000/01 : 2001/02 :============================== : : Est. : May===============================================================================TOTAL :Area : Million acres Planted : 3.06 3.34 3.32 * Harvested : 3.04 3.31 3.30 *Yield per harvested : Pounds acre : 6,281 6,429 6,299 * : : Million hundredweight : Beginning stocks 2/ : 27.5 28.5 41.4 Production : 190.9 213.0 208.0 Imports : 10.8 13.0 13.2 Supply, total : 229.2 254.5 262.7 Domestic & residual 3/ : 114.3 123.1 126.1 Exports, total 4/ : 86.4 90.0 92.0 Rough : 22.7 27.0 27.0 Milled (rough equiv.) : 63.7 63.0 65.0 Use, total : 200.7 213.1 218.1 Ending stocks : 28.5 41.4 44.6Avg. milling yield (%) 5/ : 68.6 69.0 69.0Avg. farm price ($/cwt) 6/ : 5.61 4.15- 4.25 3.95- 4.45 :LONG GRAIN : Harvested acres (mil.) : 2.19 2.70 Yield (pounds/acre) : 5,882 6,130 Beginning stocks : 15.6 11.6 29.9 Production : 128.8 165.3 160.0 Supply, total 7/ : 152.8 186.0 199.1 Domestic & Residual 3/ : 75.1 86.1 90.0 Exports 8/ : 66.1 70.0 73.0 Use, total : 141.2 156.1 163.0 Ending stocks : 11.6 29.9 36.1 : :MEDIUM & SHORT GRAIN : Harvested acres (mil.) : 0.85 0.62 Yield (pounds/acre) : 7,308 7,733 Beginning stocks : 10.4 15.6 10.3 Production : 62.1 47.7 48.0 Supply, total 7/ : 75.1 67.3 62.3 Domestic & Residual 3/ : 39.2 37.0 36.1 Exports 8/ : 20.3 20.0 19.0 Use, total : 59.5 57.0 55.1 Ending stocks : 15.6 10.3 7.2===============================================================================Note: Totals may not add due to rounding. 1/ Marketing year beginning August1. 2/ Includes the following quantities of broken kernel rice (typeundetermined) not included in estimates of beginning stocks by type (in mil.cwt): 2000/01-1.4; 2001/02-1.3; 2002/03-1.3. 3/ Residual includes unreported use, processing losses and estimating errors. Use by type may not add to totalrice use because of the difference in brokens between beginning and endingstocks. 4/ Includes rough rice and milled rice exports. Milled rice exportsare converted to an equivalent rough basis. 5/ Expressed as a percent, i.e.,the total quantity of whole kernel and broken rice produced divided by thequantity of rough rice milled. 6/ Marketing-year weighted average pricereceived by farmers. 7/ Includes imports. 8/ Exports by type of rice areestimated. * Planted acres reported in March 28, 2002 Prospective Plantings. Harvested acres projected using harvested-to-planted ratios by State and typeof rice for 1997-2001. Projected yield is derived from a simple linear trendfit by type of rice over 1982-2001 period.

WASDE-386-13 U.S. Soybeans and Products Supply and Use (Domestic Measure) 1/=============================================================================== : : : 2002/03 Projections Item : 2000/01 : 2001/02 :=============================== : : Est. : May===============================================================================SOYBEANS: : Million acresArea : Planted : 74.3 74.1 73.0 * Harvested : 72.4 73.0 71.7 * : : BushelsYield per harvested : acre : 38.1 39.6 39.7 * : : Million bushels :Beginning stocks : 290 248 260Production : 2,758 2,891 2,850Imports : 4 3 4 Supply, total : 3,052 3,141 3,114Crushings : 1,641 1,690 1,710Exports : 1,000 1,020 975Seed : 91 89 89Residual : 73 82 84 Use, total : 2,804 2,881 2,859Ending stocks : 248 260 255Avg. farm price ($/bu) 2/ : 4.54 4.25 4.00 - 4.90 : : : Million poundsSOYBEAN OIL: :Beginning stocks : 1,995 2,877 2,565Production : 18,434 18,755 _3/ 19,170Imports : 73 58 65 Supply, total : 20,502 21,690 21,800Domestic : 16,219 16,975 17,500Exports : 1,406 2,150 1,950 Use, total : 17,625 19,125 19,450Ending stocks : 2,877 2,565 2,350Average price (c/lb) 2/ : 14.15 15.10 15.00- : 18.00 : : Thousand short tonsSOYBEAN MEAL: :Beginning stocks : 293 383 275Production : 39,389 40,162 _3/ 40,660Imports : 51 60 65 Supply, total : 39,733 40,605 41,000Domestic : 31,687 32,580 33,100Exports : 7,662 7,750 7,650 Use, total : 39,349 40,330 40,750Ending stocks : 383 275 250Average price ($/s.t.) 2/ : 173.60 159.00 145.00- : 175.00===============================================================================Note: Reliability calculations at end of report. 1/ Marketing year beginning September 1 for soybeans; October 1 for soybean oiland meal. 2/ Prices: soybeans, marketing year weighted average price received by farmers; for oil, simple average of crude soybean oil, Decatur; for meal,simple average of 48 percent, Decatur. 3/ Based on October year crush of 1,685million bushels. *Planted acres are reported in March 28 Prospective Plantings.Harvested acres based on 5-year average planted to harvested ratios by state.Projected yield based on 1978-2001 regional trend analysis.

WASDE-386-14 U.S. Sugar Supply and Use 1/====================================================================== : : 2001/02 : 2002/03 Item : 2000/01 : Estimates :Projections : : April May : May====================================================================== : 1,000 short tons, raw value :Beginning stocks 2/ : 2,219 2,194 2,194 1,617Production 2/3/ : 8,674 8,030 8,004 8,750 Beet sugar : 4,592 4,000 4,000 4,500 Cane sugar 4/ : 4,082 4,030 4,004 4,250Imports 2/ : 1,574 1,706 1,529 NA TRQ 5/ : 1,260 1,356 1,179 NA Other program 6/ : 238 260 260 260 Non-program 7/ : 76 90 90 60 Total supply : 12,467 11,930 11,727 NA :Exports 2/8/ : 141 125 125 125Domestic deliveries 2/ : 10,130 10,085 9,985 10,085 Domestic food use : 9,998 9,900 9,800 9,900 Other 9/ : 132 185 185 185Miscellaneous 10/ : 1 0 0 0 Use, total : 10,272 10,210 10,110 10,210Ending stocks 2/ : 2,194 1,720 1,617 NA Private : 1,410 1,314 1,340 NA Other 11/ : 784 406 277 NA :Stocks to use ratio : 21.4 16.9 16.0 NA======================================================================1/ Fiscal years beginning Oct 1. Includes Puerto Rico. 2/ Historical data are from FSA, "Sweetener Market Data" except imports from U.S. Customs Service. 3/ Projections for 2002/03 are based on analyses bythe Interagency Commodity Estimates Committee for sugar. 4/ Productionby state for 2001/02 (projected 2002/03): FL 1,985 (2,100); HI 270 (270); LA 1,575 (1,700); TX 172 (175); PR 2 (5). 5/ Actual arrivals under the tariff rate quota (TRQ) with late entries, early entries, and TRQ overfills assigned to the fiscal year in which they actually arrived. The 2001/02 available TRQs assume shortfall of 50,000 tons.6/ Includes sugar under the re-export and polyhydric alcohol programs.7/ Includes high-tier and other. 8/ Mostly reexports. 9/ Transfer tosugar-containing products for reexport and for nonedible alcohol and feed. 10/ For 2000/2001, includes Commodity Credit Corporation sales to ethanol producers and residual statistical discrepancies. 11/ For 2001/02, includes sugar owned by the CCC as of May 8, 2002. Season-endingstocks will be a function of market and program developments.
METRIC CONVERSION FACTORS 1 Hectare = 2.4710 Acres 1 Kilogram = 2.205 Pounds--------------------------------------------------------------------- 1 Metric Ton : = Domestic Unit * Factor---------------------------------------------------------------------Wheat & Soybeans : = bushels * .027216Rice : = cwt * .045359Rapeseed & Sunflowerseed : = cwt * .045359Corn, Sorghum & Rye : = bushels * .025401Barley : = bushels * .021772Oats : = bushels * .014515Sugar : = short tons * .907185Cotton : = 480-lb bales * .217720---------------------------------------------------------------------

WASDE-386-15 U. S. Cotton Supply and Use 1/=============================================================================== : : : 2002/03 Projections Item : 2000/01 : 2001/02 :=============================== : : Est. : May=============================================================================== : Million acresArea : Planted : 15.52 15.77 14.77 * Harvested : 13.05 13.83 13.35 * : : Pounds Yield per harvested : acre : 632 705 640 * : : Million 480 pound bales :Beginning stocks 2/ : 3.92 6.00 7.70Production : 17.19 20.30 17.80Imports : 0.02 0.03 0.03 Supply, total : 21.12 26.33 25.52Domestic use : 8.86 7.60 7.80Exports : 6.76 11.00 11.00 Use, total : 15.62 18.60 18.80Unaccounted 3/ : -0.51 0.03 0.03Ending stocks : 6.00 7.70 6.70 :Avg. farm price 4/ : 49.8 31.3 5/===============================================================================1/ Upland and extra-long staple; marketing year beginning August 1. Totals maynot add due to rounding. 2/ Based on Bureau of Census data. 3/ Reflects thedifference between the previous season's supply less total use and endingstocks based on Bureau of Census data. 4/ Cents per pound for upland cotton. The 2001/02 price is a weighted average for August-April. 5/ USDA isprohibited by law from publishing cotton price projections. * Planted areareported in March 28 "Prospective Plantings." Projected harvested area basedon 1992-2001 average acreage abandonment by State. Projected yield based on1992-2001 average yield by State.
Note: Public Law 106-78, signed October 22, 1999, requires the Secretary ofAgriculture to estimate and report the U.S. upland cotton season-endingstocks-to-use ratio, excluding projected raw cotton imports but including thequantity of raw cotton imports that has been imported during the marketingyear. Pursuant to this requirement, the estimated ratio for 2001/02 is 40.7percent.

WASDE-386-16 World Wheat Supply and Use 1/ (Million Metric Tons)=============================================================================== : Supply : Use : :=========================:=======================:Ending Region : : : : Domestic 2/ : :stocks :Beginning:Produc-: :===============: : : stocks : tion :Imports: Feed : Total :Exports:=============================================================================== : : 2000/01 :World 3/ : 177.10 583.88 101.61 104.99 590.52 102.78 170.46United States : 25.85 60.76 2.44 8.14 36.34 28.87 23.85Total foreign : 151.26 523.12 99.16 96.86 554.18 73.92 146.62 Major exporters 4/ : 26.02 171.58 3.44 54.75 111.78 59.74 29.52 Argentina : 0.62 16.23 0.01 0.08 4.99 11.27 0.59 Australia : 3.61 23.77 0.07 4.00 6.89 15.93 4.63 Canada : 7.74 26.80 0.20 3.85 7.91 17.32 9.52 EU-15 : 14.05 104.78 3.16 46.82 91.98 15.22 14.79 Major importers 5/ : 89.99 143.90 50.47 11.40 208.11 2.59 73.66 Brazil : 1.25 1.66 7.29 0.20 9.50 0.00 0.70 China : 71.36 99.64 0.20 8.00 114.10 0.62 56.47 N. Africa 6/ : 6.11 9.94 18.28 0.31 28.43 0.30 5.60 Pakistan : 3.25 21.08 0.15 0.50 20.50 0.25 3.73 Southeast Asia 7/ : 1.70 0.00 9.32 1.31 8.98 0.26 1.78 Selected other : East. Europe : 4.45 28.48 2.88 9.94 28.98 2.34 4.50 India : 13.08 76.37 0.06 0.50 66.44 1.57 21.50 FSU-12 8/ : 5.76 63.12 4.98 16.16 63.81 4.67 5.38 Russia : 1.20 34.45 1.60 11.50 35.16 0.70 1.40 Kazakstan : 0.70 9.10 0.01 1.10 4.70 3.67 1.45 Ukraine : 1.80 10.20 0.69 1.70 12.16 0.08 0.45 : : 2001/02 (Estimated) :World 3/ : 170.46 580.64 106.39 107.29 587.94 107.12 163.15United States : 23.85 53.28 2.86 5.44 33.37 26.54 20.08Total foreign : 146.62 527.36 103.53 101.85 554.58 80.58 143.07 Major exporters 4/ : 29.52 152.52 8.21 53.27 110.05 55.30 24.91 Argentina : 0.59 15.50 0.01 0.05 4.75 10.80 0.55 Australia : 4.63 24.00 0.05 3.30 6.30 18.00 4.38 Canada : 9.52 21.30 0.15 3.75 8.07 16.50 6.40 EU-15 : 14.79 91.72 8.00 46.18 90.93 10.00 13.58 Major importers 5/ : 73.66 140.17 48.90 10.94 206.54 3.97 52.22 Brazil : 0.70 3.00 6.70 0.20 9.60 0.00 0.80 China : 56.47 94.00 1.50 7.00 112.60 1.50 37.87 N. Africa 6/ : 5.60 12.68 15.70 0.31 28.19 0.25 5.54 Pakistan : 3.73 19.02 0.50 0.40 19.80 1.00 2.45 Southeast Asia 7/ : 1.78 0.00 9.50 1.68 9.45 0.27 1.56 Selected other : East. Europe : 4.50 36.44 1.57 11.44 31.38 4.42 6.71 India : 21.50 68.76 0.10 0.50 60.36 3.00 27.00 FSU-12 8/ : 5.38 91.28 3.69 19.76 68.64 11.66 20.05 Russia : 1.40 46.90 0.50 14.00 38.00 2.50 8.30 Kazakstan : 1.45 12.70 0.02 1.30 4.96 3.50 5.70 Ukraine : 0.45 21.30 0.10 2.40 12.86 5.50 3.50===============================================================================1/ Aggregate of local marketing years. 2/ Total foreign and world useadjusted to reflect the differences in world imports and exports. 3/ Worldimports and exports may not balance due to differences in marketing years,grain in transit and reporting discrepancies in some countries. 4/ Argentina, Australia, Canada and the EU-15 (excludes intra-trade). 5/ Brazil, China,Iran, Japan, Mexico, North Africa, Pakistan, Southeast Asia. 6/ Algeria,Egypt, Libya, Morocco, and Tunisia. 7/ Indonesia, Malaysia, Philippines, andThailand. 8/ Former USSR excluding the Baltic States.

WASDE-386-17 World Wheat Supply and Use 1/ (Cont'd.) (Million Metric Tons)=============================================================================== : Supply : Use : :=========================:=======================:Ending Region : : : : Domestic 2/ : :stocks :Beginning:Produc-: :===============: : : stocks : tion :Imports: Feed : Total :Exports:=============================================================================== : : 2002/03 (Projected)World 3/ : May : 163.15 595.75 104.50 109.50 596.48 105.87 162.42United States : May : 20.08 51.32 2.86 5.44 33.61 23.81 16.83Total foreign : May : 143.07 544.43 101.64 104.06 562.87 82.06 145.59 Major exporters 4/ : May : 24.91 171.96 4.21 56.23 113.68 57.30 30.10 Argentina May : 0.55 16.50 0.01 0.05 4.60 11.80 0.66 Australia May : 4.38 24.50 0.05 3.70 6.63 18.00 4.30 Canada May : 6.40 24.00 0.15 4.20 8.35 15.50 6.70 EU-15 May : 13.58 106.96 4.00 48.28 94.10 12.00 18.44 Major importers 5/ : May : 52.22 143.36 50.10 8.98 204.05 3.42 38.22 Brazil May : 0.80 3.00 6.50 0.20 9.70 0.00 0.60 China May : 37.87 96.00 3.00 5.00 110.00 1.00 25.87 N. Africa 6/ May : 5.54 11.48 16.20 0.30 27.78 0.25 5.19 Pakistan May : 2.45 19.50 0.50 0.40 20.00 1.00 1.45 SE Asia 7/ May : 1.56 0.00 9.80 1.78 9.72 0.22 1.42 Selected other : East. Europe May : 6.71 32.56 1.87 10.74 31.12 3.05 6.96 India May : 27.00 74.00 0.10 0.60 64.10 4.00 33.00 FSU-12 8/ May : 20.05 81.08 4.07 21.80 71.19 10.16 23.85 Russia May : 8.30 41.00 1.00 15.50 39.50 2.50 8.30 Kazakstan May : 5.70 11.00 0.02 1.50 5.26 4.00 7.45 Ukraine May : 3.50 18.50 0.10 2.70 13.30 3.50 5.30===============================================================================1/ Aggregate of local marketing years. 2/ Total foreign and world useadjusted to reflect the differences in world imports and exports. 3/ Worldimports and exports may not balance due to differences in marketing years,grain in transit and reporting discrepancies in some countries. 4/ Argentina, Australia, Canada and the EU-15 (excludes intra-trade). 5/ Brazil, China,Iran, Japan, Mexico, North Africa, Pakistan, Southeast Asia. 6/ Algeria,Egypt, Libya, Morocco, and Tunisia. 7/ Indonesia, Malaysia, Philippines, andThailand. 8/ Former USSR excluding the Baltic States.

WASDE-386-18 World Coarse Grain Supply and Use 1/ (Million Metric Tons)=============================================================================== : Supply : Use : :=========================:=======================:Ending Region : : : : Domestic 2/ : :stocks :Beginning:Produc-: :===============: : : stocks : tion :Imports: Feed : Total :Exports:=============================================================================== : : 2000/01 :World 3/ : 209.69 858.02 101.61 588.29 881.64 105.80 186.08United States : 48.86 273.13 2.72 159.67 215.49 56.51 52.70Total foreign : 160.84 584.89 98.90 428.62 666.15 49.28 133.38 Major exporters 4/ : 9.86 62.60 3.20 36.00 48.31 19.90 7.44 Argentina : 1.35 19.58 0.02 7.03 9.39 10.34 1.22 Australia : 0.71 10.85 0.00 4.52 6.03 4.41 1.12 Canada : 5.67 24.33 2.59 20.56 24.70 3.60 4.28 Major importers 5/ : 31.61 155.68 69.32 162.24 217.94 10.79 27.87 EU-15 : 19.52 107.19 3.03 78.20 102.81 10.05 16.88 Japan : 2.24 0.22 20.24 15.72 20.36 0.00 2.33 Mexico : 3.68 24.46 11.01 20.14 36.07 0.02 3.06 Southeast Asia : 1.61 15.37 4.24 14.35 19.04 0.72 1.46 South Korea : 0.85 0.47 8.89 7.01 9.25 0.00 0.96 Selected other : China : 102.69 113.95 2.56 95.38 130.29 7.30 81.63 East. Europe : 4.75 35.84 2.74 30.21 40.28 1.25 1.80 FSU-12 6/ : 3.72 49.52 1.14 29.14 45.83 2.46 6.08 Russia : 1.06 28.20 0.79 15.60 26.88 0.57 2.60 Ukraine : 1.18 12.99 0.05 7.55 10.83 1.45 1.95 : : 2001/02 (Estimated) :World 3/ : 186.08 880.07 98.97 602.12 899.00 97.72 167.14United States : 52.70 261.86 2.54 158.09 216.20 55.91 45.00Total foreign : 133.38 618.21 96.43 444.03 682.80 41.81 122.14 Major exporters 4/ : 7.44 60.36 3.92 35.59 47.87 18.30 5.55 Argentina : 1.22 17.05 0.03 5.90 7.96 9.22 1.11 Australia : 1.12 11.24 0.00 4.76 6.28 5.36 0.72 Canada : 4.28 22.88 3.44 20.89 25.32 2.40 2.88 Major importers 5/ : 27.87 158.18 67.52 162.92 218.67 5.40 29.49 EU-15 : 16.88 105.72 4.21 77.90 102.34 5.08 19.38 Japan : 2.33 0.21 19.48 15.31 19.93 0.00 2.09 Mexico : 3.06 26.87 10.36 21.27 37.21 0.02 3.06 Southeast Asia : 1.46 15.19 3.92 14.22 18.91 0.30 1.37 South Korea : 0.96 0.47 8.20 6.71 8.96 0.00 0.67 Selected other : China : 81.63 118.40 2.78 99.32 134.85 6.02 61.93 East. Europe : 1.80 53.57 1.25 35.67 46.74 4.04 5.82 FSU-12 6/ : 6.08 61.85 1.17 33.26 51.10 6.48 11.52 Russia : 2.60 35.15 0.90 17.75 29.30 2.26 7.10 Ukraine : 1.95 16.96 0.06 8.54 12.46 3.71 2.81===============================================================================1/ Aggregate of local marketing years. 2/ Total foreign and world use adjustedto reflect the differences in world imports and exports. 3/ World imports and exports may not balance due to differences in marketing years, grain intransit and reporting discrepancies in some countries. 4/ Argentina,Australia, Canada, and South Africa. 5/ The EU-15 (excludes intra-trade),Mexico, Japan, North Africa (includes Algeria, Egypt, Libya, Morocco, andTunisia), South Korea, Southeast Asia (includes Indonesia, Malaysia,Philippines, and Thailand), Saudi Arabia, and Taiwan. 6/ Former USSR excludingthe Baltic States.

WASDE-386-19 World Coarse Grain Supply and Use 1/ (Cont'd.) (Million Metric Tons)=============================================================================== : Supply : Use : :=========================:=======================:Ending Region : : : : Domestic 2/ : :stocks :Beginning:Produc-: :===============: : : stocks : tion :Imports: Feed : Total :Exports:=============================================================================== : : 2002/03 (Projected)World 3/ : May : 167.14 905.18 96.25 606.66 913.68 99.56 158.64United States : May : 45.00 274.48 2.86 157.04 218.28 60.27 43.78Total foreign : May : 122.14 630.69 93.39 449.62 695.39 39.29 114.86 Major exporters 4/ : May : 5.55 64.30 1.21 35.56 47.76 16.82 6.49 Argentina May : 1.11 14.77 0.03 5.78 7.89 7.02 1.00 Australia May : 0.72 10.53 0.00 4.44 5.76 4.85 0.64 Canada May : 2.88 29.67 0.84 21.18 25.67 3.65 4.07 Major importers 5/ : May : 29.49 159.61 66.90 162.00 218.82 6.57 30.61 EU-15 May : 19.38 107.26 2.66 76.52 102.13 6.26 20.91 Japan May : 2.09 0.23 18.89 14.66 19.28 0.00 1.92 Mexico May : 3.06 26.72 11.15 22.36 38.30 0.02 2.62 Southeast Asia May : 1.37 14.90 4.12 14.08 18.76 0.30 1.33 South Korea May : 0.67 0.47 8.26 6.61 8.86 0.00 0.53 Selected other : China May : 61.93 128.50 3.52 100.38 136.98 4.02 52.96 East. Europe May : 5.82 50.66 1.22 36.37 47.54 3.46 6.70 FSU-12 6/ May : 11.52 55.19 1.27 34.60 52.57 5.62 9.78 Russia May : 7.10 31.00 0.95 19.30 31.10 2.00 5.94 Ukraine May : 2.81 15.60 0.06 8.90 12.80 3.05 2.61===============================================================================1/ Aggregate of local marketing years. 2/ Total foreign and world use adjustedto reflect the differences in world imports and exports. 3/ World imports and exports may not balance due to differences in marketing years, grain intransit and reporting discrepancies in some countries. 4/ Argentina,Australia, Canada, and South Africa. 5/ The EU-15 (excludes intra-trade),Mexico, Japan, North Africa (includes Algeria, Egypt, Libya, Morocco, andTunisia), South Korea, Southeast Asia (includes Indonesia, Malaysia,Philippines, and Thailand), Saudi Arabia, and Taiwan. 6/ Former USSR excludingthe Baltic States.

WASDE-386-20 World Corn Supply and Use 1/ (Million Metric Tons)=============================================================================== : Supply : Use : :=========================:=======================:Ending Region : : : : Domestic 2/ : :stocks :Beginning:Produc-: :===============: : : stocks : tion :Imports: Feed : Total :Exports:=============================================================================== : : 2000/01 :World 3/ : 171.13 585.80 74.64 426.91 606.18 77.40 150.74United States : 43.63 251.85 0.17 148.30 198.26 49.16 48.24Total foreign : 127.50 333.94 74.46 278.62 407.92 28.25 102.50 Major exporters 4/ : 2.62 22.90 0.42 7.60 13.30 11.18 1.47 Argentina : 0.49 15.40 0.02 3.90 5.60 9.68 0.64 South Africa : 2.13 7.50 0.40 3.70 7.70 1.50 0.83 Major importers 5/ : 11.46 76.28 48.28 86.43 123.95 0.99 11.07 EU-15 : 3.63 37.46 2.86 31.30 40.30 0.27 3.38 Japan : 1.16 0.00 16.34 11.90 16.20 0.00 1.30 Mexico : 2.34 17.92 5.93 8.80 24.00 0.02 2.17 Southeast Asia : 1.61 15.17 4.24 14.18 18.85 0.71 1.46 South Korea : 0.85 0.06 8.74 6.95 8.70 0.00 0.96 Selected other : Brazil : 0.60 41.54 0.29 30.50 34.50 6.32 1.61 Canada : 1.55 6.83 2.54 7.93 9.93 0.11 0.88 China : 102.31 106.00 0.09 93.00 120.00 7.28 81.13 East. Europe : 2.93 16.77 1.56 16.14 19.58 0.87 0.81 FSU-12 6/ : 1.20 7.52 0.35 5.60 7.11 0.46 1.50 Russia : 0.47 1.55 0.18 1.50 2.00 0.00 0.20 : : 2001/02 (Estimated) :World 3/ : 150.74 589.46 71.89 437.16 615.76 69.85 124.44United States : 48.24 241.48 0.25 147.96 199.91 48.90 41.17Total foreign : 102.50 347.97 71.64 289.19 415.85 20.95 83.27 Major exporters 4/ : 1.47 21.80 0.32 6.85 12.35 9.80 1.43 Argentina : 0.64 13.00 0.02 3.05 4.55 8.50 0.60 South Africa : 0.83 8.80 0.30 3.80 7.80 1.30 0.83 Major importers 5/ : 11.07 79.17 45.38 87.60 125.12 0.52 9.98 EU-15 : 3.38 38.81 2.75 32.60 41.60 0.20 3.14 Japan : 1.30 0.00 15.30 11.20 15.50 0.00 1.10 Mexico : 2.17 19.12 5.50 9.60 24.80 0.02 1.97 Southeast Asia : 1.46 14.99 3.92 14.04 18.71 0.30 1.37 South Korea : 0.96 0.06 8.00 6.60 8.35 0.00 0.67 Selected other : Brazil : 1.61 35.00 0.53 31.50 35.50 0.50 1.13 Canada : 0.88 8.20 3.30 9.08 11.28 0.25 0.85 China : 81.13 110.00 0.25 97.00 124.00 6.00 61.38 East. Europe : 0.81 29.21 0.59 20.10 24.26 2.90 3.44 FSU-12 6/ : 1.50 6.46 0.73 5.47 6.88 0.36 1.44 Russia : 0.20 0.80 0.60 1.00 1.50 0.00 0.10===============================================================================1/ Aggregate of local marketing years. 2/ Total foreign and world use adjustedto reflect the differences in world imports and exports. 3/ World imports and exports may not balance due to differences in marketing years, grain intransit and reporting discrepancies in some countries. 4/ Argentina and South Africa. 5/ Egypt, the EU-15 (excludes intra-trade), Mexico, Japan, SouthKorea, Taiwan, and Southeast Asia (includes Indonesia, Malaysia, Philippines, and Thailand). 6/ Former USSR excluding the Baltic States.

WASDE-386-21 World Corn Supply and Use 1/ (Cont'd.) (Million Metric Tons)=============================================================================== : Supply : Use : :=========================:=======================:Ending Region : : : : Domestic 2/ : :stocks :Beginning:Produc-: :===============: : : stocks : tion :Imports: Feed : Total :Exports:=============================================================================== : : 2002/03 (Projected)World 3/ : May : 124.44 614.95 70.35 439.86 625.67 71.38 113.72United States : May : 41.17 252.36 0.38 146.06 200.92 53.34 39.65Total foreign : May : 83.27 362.59 69.97 293.80 424.75 18.04 74.07 Major exporters 4/ : May : 1.43 20.00 0.22 7.05 12.55 7.80 1.30 Argentina May : 0.60 11.00 0.02 3.10 4.60 6.50 0.52 South Africa May : 0.83 9.00 0.20 3.95 7.95 1.30 0.78 Major importers 5/ : May : 9.98 79.32 45.12 87.64 125.16 0.57 8.70 EU-15 May : 3.14 39.34 2.50 32.70 41.70 0.25 3.03 Japan May : 1.10 0.00 15.00 10.90 15.20 0.00 0.90 Mexico May : 1.97 19.00 6.00 10.30 25.50 0.02 1.46 Southeast Asia May : 1.37 14.70 4.12 13.88 18.56 0.30 1.33 South Korea May : 0.67 0.06 8.00 6.45 8.20 0.00 0.53 Selected other : Brazil May : 1.13 38.50 0.53 33.50 37.50 1.50 1.16 Canada May : 0.85 10.50 0.80 8.50 10.80 0.50 0.85 China May : 61.38 120.00 1.00 98.00 126.00 4.00 52.38 East. Europe May : 3.44 27.53 0.59 20.38 24.64 2.70 4.21 FSU-12 6/ May : 1.44 7.24 0.73 6.15 7.56 0.36 1.50 Russia May : 0.10 1.40 0.60 1.50 2.00 0.00 0.10===============================================================================1/ Aggregate of local marketing years. 2/ Total foreign and world use adjustedto reflect the differences in world imports and exports. 3/ World imports and exports may not balance due to differences in marketing years, grain intransit and reporting discrepancies in some countries. 4/ Argentina and SouthAfrica. 5/ Egypt, the EU-15 (excludes intra-trade), Mexico, Japan, SouthKorea, Taiwan, and Southeast Asia (includes Indonesia, Malaysia, Philippines, and Thailand). 6/ Former USSR excluding the Baltic States.
WASDE-386-22 World Rice Supply and Use (Milled Basis) 1/ (Million Metric Tons)=============================================================================== : Supply : Use : :=========================:===================: Ending Region : : : : : : stocks :Beginning:Produc-: : Total 2/: : : stocks : tion :Imports: Domestic: Exports :=============================================================================== : : 2000/01 :World 3/ : 143.88 397.33 21.63 404.23 24.64 136.99United States : 0.87 5.94 0.35 3.58 2.69 0.89Total foreign : 143.01 391.39 21.29 400.65 21.95 136.10 Major exporters 4/ : 21.63 126.94 0.04 112.83 15.28 20.52 India : 17.94 84.87 0.00 83.50 1.80 17.51 Thailand : 1.71 16.90 0.00 9.40 7.52 1.69 Vietnam : 1.18 20.47 0.04 17.27 3.53 0.89 Major importers 5/ : 13.73 53.16 9.81 64.53 0.35 11.83 Indonesia : 6.37 32.55 1.50 35.88 0.00 4.54 Selected other : China : 98.50 131.54 0.27 134.32 1.86 94.12 Japan : 1.83 8.64 0.68 9.00 0.48 1.66 : : 2001/02 (Estimated) :World 3/ : 136.99 396.53 23.33 406.91 24.33 126.61United States : 0.89 6.67 0.41 3.85 2.82 1.30Total foreign : 136.10 389.86 22.92 403.05 21.52 125.31 Major exporters 4/ : 20.52 130.87 0.04 114.60 15.75 21.08 India : 17.51 90.00 0.00 85.00 4.00 18.51 Thailand : 1.69 16.50 0.00 9.50 7.25 1.44 Vietnam : 0.89 20.63 0.04 17.40 3.25 0.91 Major importers 5/ : 11.83 54.03 10.80 65.62 0.41 10.62 Indonesia : 4.54 32.42 2.75 36.36 0.00 3.36 Selected other : China : 94.12 126.00 0.31 134.61 1.50 84.32 Japan : 1.66 8.24 0.70 9.00 0.15 1.46 : : 2002/03 (Projected) :World 3/ May : 126.61 395.51 25.00 410.00 25.50 112.12United States May : 1.30 6.51 0.42 3.95 2.88 1.40Total foreign May : 125.31 389.00 24.58 406.05 22.62 110.72===============================================================================1/ Aggregate of local marketing years. 2/ Total foreign and world useadjusted to reflect the differences in world imports and exports. 3/ Worldimports and exports may not balance due to differences in some countries. 4/ India, Pakistan, Thailand, and Vietnam. 5/ Brazil, Hong Kong, Indonesia, Iran, Iraq, Ivory Coast, Nigeria, Philippines, Saudi Arabia, the EU-15(excludes intra-trade).

WASDE-386-23 World Soybean Supply and Use 1/ (Million Metric Tons)=============================================================================== : Supply : Use : :=========================:=======================:Ending Region : : : : : :stocks :Beginning:Produc-: : Domestic : : : stocks : tion :Imports: Crush : Total :Exports:=============================================================================== : : 1999/00World 2/ : 26.51 159.90 47.95 136.19 160.73 46.72 26.92United States : 9.48 72.22 0.11 42.94 47.39 26.54 7.90Total foreign : 17.03 87.68 47.83 93.25 113.34 20.18 19.02 Major exporters 3/ : 12.85 58.30 1.46 38.98 42.01 17.41 13.19 Argentina : 6.03 21.20 0.47 17.08 18.05 4.13 5.52 Brazil : 6.80 34.20 1.00 21.20 23.19 11.16 7.65 Major importers 4/ : 3.60 17.38 38.04 39.22 52.62 1.29 5.11 EU-15 : 0.84 1.15 15.66 14.43 15.66 1.05 0.94 Japan : 0.62 0.19 4.91 3.75 5.05 0.00 0.66 China : 1.90 14.29 10.10 15.07 22.89 0.23 3.17 : : 2000/01 (Estimated)World 2/ : 26.92 175.08 55.49 148.48 173.00 55.44 29.06United States : 7.90 75.06 0.10 44.65 49.10 27.21 6.74Total foreign : 19.02 100.03 55.40 103.82 123.90 28.23 22.32 Major exporters 3/ : 13.19 70.32 1.32 40.80 44.24 25.44 15.15 Argentina : 5.52 27.80 0.42 17.30 18.40 7.42 7.93 Brazil : 7.65 39.00 0.90 22.62 24.87 15.47 7.21 Major importers 4/ : 5.11 18.13 45.35 47.34 60.48 1.56 6.54 EU-15 : 0.94 1.04 19.12 17.58 18.96 1.34 0.79 Japan : 0.66 0.24 4.77 3.78 5.08 0.00 0.59 China : 3.17 15.40 13.24 18.90 26.70 0.21 4.91 : : 2001/02 (Projected)World 2/ : April : 29.13 184.75 58.59 158.58 184.76 58.29 29.43 May : 29.06 184.13 57.74 158.40 184.14 57.34 29.44United States : April : 6.74 78.67 0.08 45.86 50.51 27.76 7.22 May : 6.74 78.67 0.08 45.99 50.65 27.76 7.08Total foreign : April : 22.39 106.09 58.51 112.72 134.24 30.53 22.21 May : 22.32 105.46 57.66 112.41 133.49 29.58 22.36 Major exporters 3/ : April : 15.15 76.30 1.30 44.35 48.03 27.82 16.90 May : 15.15 76.10 1.30 44.50 48.19 26.91 17.45 Argentina Apr : 7.93 29.50 0.40 20.15 21.34 8.00 8.49 May : 7.93 29.50 0.40 20.20 21.39 7.70 8.74 Brazil Apr : 7.21 43.50 0.90 23.40 25.81 17.40 8.40 May : 7.21 43.50 0.90 23.40 25.81 17.10 8.70 Major importers 4/ : April : 6.61 18.61 46.60 51.37 65.49 1.59 4.76 May : 6.54 18.25 45.80 50.99 64.70 1.54 4.36 EU-15 Apr : 0.79 1.24 20.72 19.12 20.58 1.36 0.81 May : 0.79 1.22 20.72 19.12 20.56 1.36 0.80 Japan Apr : 0.63 0.27 4.95 3.88 5.25 0.00 0.59 May : 0.59 0.27 5.00 3.88 5.19 0.00 0.67 China Apr : 4.91 15.45 12.00 21.10 29.12 0.20 3.04 May : 4.91 15.45 11.00 20.60 28.62 0.15 2.59===============================================================================1/ Data based on local marketing years except Argentina and Brazil which areadjusted to an October-September year. 2/ World imports and exports may notbalance due to differences in local marketing years and to time lags betweenreported export and imports. Therefore, world supply may not equal world use. 3/ Argentina, Brazil and Paraguay. 4/ Japan, China, and EU, Mexico, andSoutheast Asia (includes Indonesia, Malaysia, Philippines, and Thailand).

WASDE-386-24 World Soybean Meal Supply and Use 1/ (Million Metric Tons)=============================================================================== : Supply : Use : :=========================:===================: Ending Region : : : : : : stocks :Beginning:Produc-: : Total : : : stocks : tion :Imports: Domestic: Exports :=============================================================================== : : 1999/00World 2/ : 4.96 107.79 39.61 108.78 39.71 3.87United States : 0.30 34.10 0.04 27.53 6.65 0.27Total foreign : 4.66 73.69 39.56 81.25 33.06 3.60 Major exporters 3/ : 2.04 33.63 0.10 8.57 26.03 1.17 Argentina : 0.78 13.45 0.00 0.21 13.74 0.27 Brazil : 1.19 16.74 0.10 7.20 9.93 0.90 India : 0.07 3.44 0.00 1.16 2.35 0.00 Major importers 4/ : 1.08 25.07 26.30 45.90 5.57 0.98 EU-15 : 0.89 11.47 19.81 25.87 5.54 0.76 China : 0.00 11.98 0.63 12.58 0.03 0.00 : : 2000/01 (Estimated)World 2/ : 3.87 117.85 41.43 118.19 41.14 3.83United States : 0.27 35.73 0.05 28.75 6.95 0.35Total foreign : 3.60 82.12 41.39 89.44 34.18 3.48 Major exporters 3/ : 1.17 35.05 0.18 9.16 26.33 0.92 Argentina : 0.27 13.65 0.00 0.22 13.60 0.10 Brazil : 0.90 17.87 0.18 7.46 10.68 0.82 India : 0.00 3.53 0.00 1.48 2.05 0.00 Major importers 4/ : 0.98 31.47 27.44 52.30 6.42 1.17 EU-15 : 0.76 14.00 20.44 28.22 6.31 0.67 China : 0.00 15.30 0.10 15.29 0.11 0.00 : : 2001/02 (Projected)World 2/ : April : 3.73 125.46 44.21 125.57 43.86 3.97 May : 3.83 125.35 44.08 125.11 44.17 3.98United States : April : 0.35 36.34 0.05 29.46 7.03 0.25 May : 0.35 36.43 0.05 29.56 7.03 0.25Total foreign : April : 3.38 89.12 44.16 96.11 36.83 3.72 May : 3.48 88.92 44.03 95.55 37.14 3.73 Major exporters 3/ : April : 0.92 38.19 0.24 9.62 28.58 1.16 May : 0.92 38.23 0.24 9.48 28.76 1.16 Argentina Apr : 0.10 15.87 0.00 0.23 15.44 0.30 May : 0.10 15.91 0.00 0.23 15.48 0.30 Brazil Apr : 0.82 18.57 0.24 7.90 10.88 0.86 May : 0.82 18.57 0.24 7.90 10.88 0.86 India Apr : 0.00 3.75 0.00 1.49 2.26 0.00 May : 0.00 3.75 0.00 1.35 2.40 0.00 Major importers 4/ : April : 1.10 34.38 28.82 56.33 6.76 1.21 May : 1.17 34.12 28.80 55.96 6.91 1.22 EU-15 Apr : 0.67 15.24 21.43 30.21 6.36 0.77 May : 0.67 15.24 21.43 30.21 6.36 0.77 China Apr : 0.00 16.76 0.05 16.41 0.40 0.00 May : 0.00 16.50 0.03 15.98 0.55 0.00===============================================================================1/ Data based on local marketing years except for Argentina and Brazil whichare adjusted to an October-September year. 2/ World imports and exports maynot balance due to differences in local marketing years and to time lagsbetween reported exports and imports. Therefore, world supply may not equalworld use. 3/ Argentina, Brazil, and India. 4/ Eastern Europe, China, EU,and Southeast Asia (includes Indonesia, Malaysia, Philippines, and Thailand).

WASDE-386-25 World Soybean Oil Supply and Use 1/ (Million Metric Tons)=============================================================================== : Supply : Use : :=========================:===================: Ending Region : : : : : : stocks :Beginning:Produc-: : Total : : : stocks : tion :Imports: Domestic: Exports :=============================================================================== : : 1999/00World 2/ : 2.18 24.75 7.13 24.31 7.27 2.47United States : 0.69 8.09 0.04 7.28 0.62 0.91Total foreign : 1.49 16.67 7.09 17.03 6.65 1.56 Major exporters 3/ : 0.75 9.75 0.80 4.61 5.92 0.77 Argentina : 0.25 3.12 0.00 0.11 3.04 0.23 Brazil : 0.32 4.03 0.22 3.00 1.20 0.36 EU-15 : 0.18 2.60 0.58 1.50 1.69 0.18 Major importers 4/ : 0.21 3.28 1.57 4.69 0.08 0.29 China : 0.19 2.48 0.56 2.87 0.08 0.28 Pakistan : 0.02 0.01 0.23 0.24 0.00 0.01 : : 2000/01 (Estimated)World 2/ : 2.47 27.06 7.82 26.75 7.92 2.67United States : 0.91 8.36 0.03 7.36 0.64 1.30Total foreign : 1.56 18.70 7.78 19.39 7.28 1.37 Major exporters 3/ : 0.77 10.69 0.85 5.24 6.52 0.56 Argentina : 0.23 3.19 0.00 0.11 3.21 0.10 Brazil : 0.36 4.34 0.21 3.12 1.53 0.26 EU-15 : 0.18 3.16 0.64 2.01 1.78 0.20 Major importers 4/ : 0.29 4.08 1.70 5.74 0.06 0.29 China : 0.28 3.24 0.08 3.26 0.06 0.28 Pakistan : 0.01 0.03 0.23 0.26 0.00 0.01 : : 2001/02 (Projected)World 2/ : April : 2.62 28.81 8.70 28.95 8.70 2.47 May : 2.67 28.78 8.66 28.92 8.66 2.53United States : April : 1.30 8.48 0.04 7.70 0.98 1.15 May : 1.30 8.51 0.03 7.70 0.98 1.16Total foreign : April : 1.31 20.32 8.66 21.25 7.72 1.32 May : 1.37 20.27 8.64 21.22 7.68 1.36 Major exporters 3/ : April : 0.56 11.64 0.84 5.51 6.94 0.59 May : 0.56 11.64 0.84 5.51 6.94 0.59 Argentina Apr : 0.10 3.69 0.00 0.12 3.48 0.19 May : 0.10 3.70 0.00 0.12 3.48 0.19 Brazil Apr : 0.26 4.50 0.20 3.20 1.55 0.21 May : 0.26 4.50 0.20 3.20 1.55 0.21 EU-15 Apr : 0.20 3.44 0.64 2.19 1.91 0.18 May : 0.20 3.44 0.64 2.19 1.91 0.18 Major importers 4/ : April : 0.29 4.54 1.90 6.36 0.09 0.28 May : 0.29 4.46 1.95 6.40 0.05 0.25 China Apr : 0.28 3.62 0.20 3.75 0.09 0.27 May : 0.28 3.55 0.15 3.69 0.05 0.24 Pakistan Apr : 0.01 0.05 0.25 0.30 0.00 0.01 May : 0.01 0.05 0.25 0.30 0.00 0.01===============================================================================1/ Data based on local marketing years except for Argentina and Brazil whichare adjusted to an October-September year. 2/ World imports and exports maynot balance due to differences in local marketing years and to time lagsbetween reported exports and imports. Therefore, world supply may not equalworld use. 3/ Argentina, Brazil and EU. 4/ India, China and Pakistan.

WASDE-386-26 World Cotton Supply and Use 1/ (Million 480-pound bales)=============================================================================== : Supply : Use : : Region :=========================:================: Loss :Ending :Beginning:Produc-:Imports:Domestic:Exports: 2/ :stocks : stocks : tion : : : : :=============================================================================== : : 2000/01 :World : 42.50 88.74 26.66 92.12 26.28 -0.58 40.08United States : 3.92 17.19 0.02 8.86 6.76 -0.51 6.00Total foreign : 38.58 71.55 26.65 83.26 19.51 -0.07 34.08 Major exporters 4/ : 14.31 37.19 2.32 25.86 15.58 -0.09 12.48 Pakistan : 2.70 8.20 0.45 8.10 0.58 0.03 2.65 India : 4.91 10.90 1.55 13.55 0.05 0.00 3.76 Central Asia 5/ : 1.74 6.44 0.01 1.59 5.08 0.00 1.51 Afr. Fr. Zone 6/ : 1.01 3.22 3/ 0.22 3.16 0.00 0.85 S. Hemis. 7/ : 3.09 5.84 0.19 1.10 5.29 -0.14 2.87 Australia : 2.31 3.70 3/ 0.18 3.90 -0.16 2.10 Argentina : 0.38 0.74 0.01 0.35 0.44 0.01 0.32 Major importers : 22.36 31.13 17.82 49.08 2.74 0.02 19.47 Brazil : 2.39 4.31 0.60 4.27 0.32 -0.17 2.90 Mexico : 0.49 0.36 1.86 2.10 0.08 0.03 0.51 China : 14.96 20.30 0.23 23.50 0.45 0.00 11.54 Europe : 1.82 2.49 5.02 5.82 1.72 0.07 1.72 Turkey : 0.83 3.60 1.75 5.10 0.12 0.00 0.96 Selected Asia 8/ : 1.87 0.07 8.35 8.29 0.06 0.10 1.84 Indonesia : 0.24 0.03 2.65 2.40 0.02 0.05 0.46 South Korea : 0.43 3/ 1.42 1.45 0.01 0.00 0.39 : : 2001/02 (Estimated) :World : 40.08 97.95 29.42 93.46 29.26 -0.07 44.81United States : 6.00 20.30 0.03 7.60 11.00 0.03 7.70Total foreign : 34.08 77.65 29.40 85.86 18.26 -0.10 37.11 Major exporters 4/ : 12.48 39.48 3.06 25.92 14.20 -0.09 14.99 Pakistan : 2.65 8.20 0.90 8.45 0.10 0.03 3.17 India : 3.76 11.80 1.75 13.20 0.05 0.00 4.06 Central Asia 5/ : 1.51 7.38 0.01 1.75 4.86 0.00 2.28 Afr. Fr. Zone 6/ : 0.85 4.57 3/ 0.22 3.73 0.00 1.46 S. Hemis. 7/ : 2.87 4.50 0.27 0.99 4.06 -0.14 2.74 Australia : 2.10 3.10 3/ 0.15 3.10 -0.16 2.11 Argentina : 0.32 0.28 0.02 0.28 0.23 0.01 0.11 Major importers : 19.47 35.03 19.43 51.36 2.78 -0.01 19.81 Brazil : 2.90 3.60 0.45 4.27 0.70 -0.20 2.18 Mexico : 0.51 0.44 1.90 2.05 0.10 0.03 0.67 China : 11.54 24.40 0.40 24.50 0.25 0.00 11.59 Europe : 1.72 2.61 5.03 5.84 1.54 0.07 1.92 Turkey : 0.96 3.90 2.50 6.00 0.13 0.00 1.24 Selected Asia 8/ : 1.84 0.08 9.15 8.70 0.07 0.10 2.21 Indonesia : 0.46 0.04 2.50 2.40 0.02 0.05 0.53 South Korea : 0.39 3/ 1.65 1.60 0.02 0.00 0.42===============================================================================1/ Marketing year beginning August 1. Totals may not add exactly and trademay not balance due to rounding and other factors. 2/ Generally reflectscotton lost or destroyed in the marketing channel; for Australia, Brazil, and the United States, reflects the difference between implicit stocks based onsupply less total use and indicated ending stocks. 3/ Less than 5,000 bales. 4/ Includes Egypt and Syria in addition to the countries and regions listed. 5/ Azerbaijan, Kazakhstan, Kyrgyzstan, Tajikistan, Turkmenistan, andUzbekistan. 6/ Benin, Burkino Faso, Cameroon, Central African Republic, Chad,Cote d'Ivoire, Mali, Niger, Senegal, and Togo. 7/ Argentina, Australia,Paraguay, South Africa, Tanzania, and Zimbabwe. 8/ Hong Kong, Indonesia,Japan, South Korea, Taiwan, and Thailand.

WASDE-386-27 World Cotton Supply and Use 1/ (Million 480-pound bales)=============================================================================== : Supply : Use : : Region :=========================:================: Loss :Ending :Beginning:Produc-:Imports:Domestic:Exports: 2/ :stocks : stocks : tion : : : : :=============================================================================== : : 2002/03 (Projected)World : May : 44.81 91.00 31.00 95.50 30.70 0.00 40.61United States : May : 7.70 17.80 0.03 7.80 11.00 0.03 6.70Total foreign : May : 37.11 73.20 30.98 87.70 19.70 -0.02 33.91===============================================================================1/ Marketing year beginning August 1. Totals may not add exactly and trademay not balance due to rounding and other factors. 2/ Generally reflectscotton lost or destroyed in the marketing channel; for Australia, Brazil, and the United States, reflects the historical difference between implicit stocks based on supply less total use and indicated ending stocks.

WASDE-386-28 U.S. Quarterly Animal Product Production 1/=============================================================================== Year : : : Red : : : Total : Red : : : and : : : meat : : :poultry :meat & : : : quarter : Beef : Pork : 2/ :Broiler:Turkey: 3/ :poultry: Egg : Milk :=============================================================================== : Million pounds Mil doz Bil lbs2001 : II : 6502 4546 11148 7988 1381 9501 20649 1778 42.7 III : 6723 4548 11371 7882 1394 9406 20777 1788 40.6 IV : 6700 5239 12048 7863 1454 9444 21492 1829 40.8 Annual : 26107 19138 45663 31266 5562 37343 83006 7152 165.3 :2002 : I : 6376 4779 11259 7834 1386 9352 20611 1768 42.3 II*: 6700 4675 11473 8225 1425 9780 21253 1785 43.9 III*: 6900 4775 11772 8075 1400 9600 21372 1795 41.7 IV*: 6375 5325 11805 8050 1425 9595 21400 1835 41.9 Annual :Apr Proj : 26050 19315 45771 32050 5625 38180 83951 7195 169.4May Proj : 26351 19554 46309 32184 5636 38327 84636 7183 169.7 :2003 : I*: 6150 4850 11104 8075 1350 9550 20654 1780 43.2 Annual :Apr Proj : NA NA NA NA NA NA NA NA NAMay Proj : 25125 19800 45320 33000 5675 39175 84495 7250 172.4===============================================================================* Projection.1/ Commercial production for red meats; federally inspected for poultry meats.2/ Beef, pork, veal and lamb & mutton. 3/ Broilers, turkeys and mature chicken.
U.S. Quarterly Prices for Animal Products=============================================================================== Year : Choice : Barrows : : : : : and : steers :and gilts : Broilers : Turkeys : Eggs : Milk : quarter : 1/ : 2/ : 3/ : 4/ : 5/ : 6/ :=============================================================================== : Dol./cwt Dol./cwt Cents/lb. Cents/lb. Cents/doz. Dol./cwt2001 : II : 76.41 52.05 59.2 65.0 63.3 15.43 III : 70.19 51.05 61.1 67.1 61.4 16.60 IV : 65.13 37.30 58.5 71.4 68.2 14.50 Annual : 72.71 45.81 59.1 66.3 67.2 14.97 :2002 : I : 70.19 39.43 56.0 60.0 69.1 13.07 II*: 66-68 34-36 54-56 62-64 56-58 11.90-12.20 III*: 63-67 36-38 57-61 63-67 58-62 12.00-12.60 IV*: 70-76 30-32 56-60 68-74 70-76 13.00-13.90 Annual :Apr Proj : 72-75 39-41 56-59 63-66 63-67 12.70-13.20May Proj : 67-70 35-36 56-58 63-66 63-66 12.45-12.95 :2003 : I*: 71-77 36-38 55-59 59-63 67-73 12.45-13.45 Annual :Apr Proj : NA NA NA NA NA NAMay Proj : 72-79 35-38 57-61 63-68 64-69 12.25-13.25===============================================================================*Projection.1/ Nebraska, Direct, 1100-1300 lbs. 2/ National Base, Live equiv 51-52% lean3/ Wholesale, 12-city average. 4/ 8-16 lbs, hens, Eastern Region. 5/ Grade Alarge, New York, volume buyers. 6/ Price received by farmers for all milk.

WASDE-386-29 U.S. Meats Supply and Use============================================================================ : Supply : Use :--------------------------------------------------------- : : : : : : : Consumption : : Pro- : : : : :--------------- : Beg- : duc- : : : : End- : : Per Item :inning: tion : Im- :Total : Ex- : ing : :capita :stocks: 1/ :ports :supply: ports:stocks:Total : 2/ 3/============================================================================ : Million pounds 4/BEEF : 2001 : 525 26212 3161 29898 2271 606 27022 66.2 2002 Proj. Apr : 606 26155 3245 30006 2250 425 27331 66.2 May : 606 26456 3230 30292 2285 425 27582 66.8 2003 Proj. Apr : NA NA NA NA NA NA NA NA May : 425 25230 3275 28930 2400 350 26180 62.9 :PORK : 2001 : 478 19160 950 20588 1563 536 18489 50.2 2002 Proj. Apr : 536 19337 960 20833 1485 525 18823 50.6 May : 536 19576 960 21072 1485 550 19037 51.1 2003 Proj. Apr : NA NA NA NA NA NA NA NA May : 550 19822 960 21332 1550 600 19182 51.1 :TOTAL RED MEAT 5/ : 2001 : 1021 45804 4257 51082 3840 1160 46082 118.1 2002 Proj. Apr : 1160 45911 4360 51431 3740 968 46723 118.5 May : 1160 46449 4351 51960 3775 993 47192 119.7 2003 Proj. Apr : NA NA NA NA NA NA NA NA May : 993 45460 4396 50849 3955 968 45926 115.6 :BROILERS : 2001 : 798 30938 14 31749 5562 712 25475 76.5 2002 Proj. Apr : 712 31707 8 32427 6100 725 25602 76.1 May : 712 31840 8 32560 5440 725 26395 78.5 2003 Proj. Apr : NA NA NA NA NA NA NA NA May : 725 32647 12 33384 5850 715 26819 79.0 :TURKEYS : 2001 : 241 5489 1 5732 487 241 5003 17.5 2002 Proj. Apr : 241 5551 1 5793 470 300 5022 17.4 May : 241 5562 1 5804 470 300 5033 17.4 2003 Proj. Apr : NA NA NA NA NA NA NA NA May : 300 5601 1 5902 490 325 5086 17.4 :TOTAL POULTRY 6/ : 2001 : 1048 36942 18 38008 6232 961 30815 95.2 2002 Proj. Apr : 961 37763 11 38735 6740 1033 30961 94.7 May : 961 37908 11 38880 6080 1033 31766 97.1 2003 Proj. Apr : NA NA NA NA NA NA NA NA May : 1033 38747 15 39795 6500 1048 32246 97.7 :RED MEAT & POULTRY: 2001 : 2069 82746 4275 89090 10072 2121 76897 213.3 2002 Proj. Apr : 2121 83674 4371 90166 10480 2001 77684 213.1 May : 2121 84357 4362 90840 9855 2026 78958 216.7 2003 Proj. Apr : NA NA NA NA NA NA NA NA May : 2026 84207 4411 90644 10455 2016 78172 213.3============================================================================1/ Total including farm production for red meats and, for poultry,federally inspected plus non-federally inspected, less condemnations.2/ Pounds, retail-weight basis. 3/ Population source: Dept. of Commerce,Bureau of Economic Analysis. 4/ Carcass weight for red meats and certifiedready-to-cook weight for poultry. 5/ Beef, pork, veal, lamb and mutton.6/ Broilers, turkeys and mature chicken.

WASDE-386-30 U.S. Egg Supply and Use=============================================================================== : : : 2002 Projected : 2003 Projected : : :-----------------:----------------- Commodity : 2000 : 2001 : Apr : May : Apr : May===============================================================================EGGS : Million dozen Supply : Beginning stocks : 7.6 11.4 10.4 10.4 NA 12.0 Production : 7033.5 7152.0 7195.0 7183.0 NA 7250.0 Imports : 8.4 8.9 8.0 8.0 NA 8.0 Total supply : 7049.5 7172.2 7213.4 7201.4 NA 7270.0 : Use : Exports : 171.1 190.4 165.0 165.0 NA 168.0 Hatching use : 940.2 953.0 965.0 965.0 NA 1000.0 Ending stocks : 11.4 10.4 12.0 12.0 NA 12.0 Consumption : Total : 5926.8 6018.5 6071.4 6059.4 NA 6090.0 Per capita (number) : 251.8 252.6 252.2 251.7 NA 250.7=============================================================================== U.S. Milk Supply, Use and Prices=============================================================================== : : : 2001/02 Proj 1/: 2002/03 Proj 1/ Commodity :1999/00:2000/01:-----------------:----------------- : 1/ : 1/ : Apr : May : Apr : May===============================================================================MILK : Billion poundsSupply : Beg. commercial stocks 2/ : 7.4 8.9 8.8 8.8 NA 8.6 Production : 167.4 165.2 168.4 168.7 NA 171.8 Farm use : 1.3 1.3 1.2 1.2 NA 1.2 Marketings : 166.0 163.9 167.2 167.5 NA 170.6 Imports 2/ : 4.6 5.4 5.1 5.2 NA 4.8 Total cml. supply 2/ : 178.1 178.2 181.0 181.4 NA 184.0Use : Commercial use 2/ 3/ : 168.4 169.1 172.6 172.6 NA 175.3 Ending commercial stks. 2/: 8.9 8.8 8.3 8.6 NA 8.3 CCC net removals: : Milkfat basis 4/ : 0.8 0.3 0.2 0.2 NA 0.5 Skim-solids basis 4/ : 8.5 6.3 6.3 7.7 NA 5.2 : : Dollars per cwtMilk Prices : Basic Formula/Class III 5/: 9.99 12.29 11.35- 11.40- NA 10.80- : 11.65 11.60 NA 11.80 : Class IV : 11.51 13.88 11.50- 11.35- NA 10.85- : 12.00 11.65 NA 12.05 : All milk 6/ : 12.61 14.51 13.00- 12.90- NA 12.25- : 13.30 13.10 NA 13.25 : : Million poundsCCC product net removals 4/: Butter : 11 0 0 0 NA 15 Cheese : 17 17 4 4 NA 6 Nonfat dry milk : 690 525 535 660 NA 440 Dry whole milk : 34 3 0 0 NA 0===============================================================================Note: Totals may not add due to rounding.1/ Marketing year beginning October 1. 2/ Milk equivalent, milkfat basis.3/ Includes commercial exports. 4/ Includes products exported under the DairyExport Incentive Program. 5/ Basic Formula Price through Dec. 31, 1999;Class III price beginning Jan. 1, 2000 6/ Milk of average fat test. Does notreflect any deductions from producers as authorized by legislation.

WASDE-386-31 Note: Tables on pages 31-33 present a 21-year record of the differences betweenthe Mayl projection and the final estimate. Using world wheat production as an example, changes between the May projection and the final estimate haveaveraged 14.1 million tons (2.6%) ranging from -32.5 to 29.7 million tons. The May projection has been below the estimate 13 times and above 8 times. Reliability of May Projections------------------------------------------------------------------------------- :Differences between proj. & final estimate,1981/82-2001/02 1/ Commodity and :------------------------------------------------------------- region : Avg. : Avg. : Difference : Below final : Above final-------------------------------------------------------------------------------WHEAT :Percent Million metric tons Number of years 2/ Production : World : 2.6 14.1 -32.5 29.7 13 8 U.S. : 4.7 2.9 -7.2 9.8 10 11 Foreign : 2.7 12.6 -25.3 28.7 12 9 Exports : World : 4.2 4.8 -16.3 12.7 13 8 U.S. : 8.6 2.9 -10.0 7.8 12 9 Foreign : 5.0 4.2 -12.0 5.3 14 7 Domestic use : World : 2.0 10.5 -28.0 19.9 13 8 U.S. : 6.3 2.0 -6.4 4.0 14 7 Foreign : 1.9 9.3 -24.7 18.4 14 7 Ending stocks : World : 9.9 12.4 -21.5 26.9 13 8 U.S. : 16.6 3.8 -9.0 14.1 12 9 Foreign : 10.5 10.1 -17.8 16.8 11 10 :COARSE GRAINS 3/ : Production : World : 3.1 24.8 -31.9 75.3 8 13 U.S. : 10.5 20.9 -35.9 70.3 11 10 Foreign : 2.4 13.7 -27.4 42.8 5 16 Exports : World : 5.9 6.2 -10.0 15.5 14 7 U.S. : 15.5 8.2 -22.8 15.3 10 11 Foreign : 12.3 6.2 -14.0 14.2 11 10 Domestic use : World : 1.7 13.7 -16.7 32.4 7 14 U.S. : 4.7 8.3 -16.6 33.0 14 7 Foreign : 1.6 10.3 -8.4 32.8 8 13 Ending stocks : World : 17.4 22.6 -71.4 48.1 13 8 U.S. : 37.6 18.5 -57.6 43.8 10 11 Foreign : 16.2 11.5 -23.9 18.6 15 6 :RICE, milled : Production : World : 2.3 7.6 -21.8 11.4 15 6 U.S. : 6.3 0.3 -1.0 0.5 12 9 Foreign : 2.3 7.6 -22.0 11.2 15 6 Exports : World : 8.6 1.6 -7.5 1.1 15 6 U.S. : 8.0 0.2 -0.7 0.7 12 6 Foreign : 9.3 1.5 -7.1 0.9 16 5 Domestic use : World : 1.8 5.9 -19.4 5.0 18 3 U.S. : 7.4 0.2 -0.5 0.6 8 12 Foreign : 1.8 6.0 -20.0 5.2 18 3 Ending stocks : World : 12.2 4.6 -15.6 9.0 14 7 U.S. : 29.1 0.3 -0.8 0.9 10 9 Foreign : 13.1 4.7 -16.4 9.1 14 7-------------------------------------------------------------------------------1/ Footnotes at end of table. CONTINUED

WASDE-386-32 Reliability of May Projections (Continued)------------------------------------------------------------------------------- :Differences between proj. & final estimate,1981/82-2001/02 1/ Commodity and :------------------------------------------------------------- region : Avg. : Avg. : Difference : Below final : Above final-------------------------------------------------------------------------------SOYBEANS :Percent Million metric tons Number of years 2/ Production : World : NA NA NA NA NA NA U.S. : 7.5 4.2 -11.3 12.0 10 11 Foreign : NA NA NA NA NA NA Exports : World : NA NA NA NA NA NA U.S. : 14.0 2.7 -6.7 6.4 12 9 Foreign : NA NA NA NA NA NA Domestic use : World : NA NA NA NA NA NA U.S. : 5.7 2.2 -7.5 4.2 16 5 Foreign : NA NA NA NA NA NA Ending stocks : World : NA NA NA NA NA NA U.S. : 41.7 2.9 -4.5 8.4 6 15 Foreign : NA NA NA NA NA NA :COTTON : Million 480-pound bales Production : World : 4.7 3.9 -13.7 11.4 14 7 U.S. : 9.7 1.4 -2.8 3.1 9 12 Foreign : 4.9 3.4 -12.2 10.5 13 8 Exports : World : 5.8 1.4 -4.2 2.7 10 11 U.S. : 20.8 1.0 -2.4 3.0 13 8 Foreign : 6.6 1.2 -3.5 1.9 9 12 Mill use : World : 2.6 2.1 -7.6 5.0 8 13 U.S. : 8.4 0.7 -1.4 1.5 12 9 Foreign : 2.7 2.0 -6.9 3.9 9 12 Ending stocks : World : 16.2 5.6 -13.8 15.4 14 7 U.S. : 35.8 1.6 -3.4 3.7 10 11 Foreign : 15.2 4.6 -13.1 12.7 14 7-------------------------------------------------------------------------------1/ Final estimate for 1981/82-2000/01 is defined as the first November estimatefollowing the marketing year and for 2001/02 last month's estimate. 2/ May nottotal 21 if projection was the same as final estimate. 3/ Includes corn,sorghum, barley, oats, rye, millet, and mixed grain.
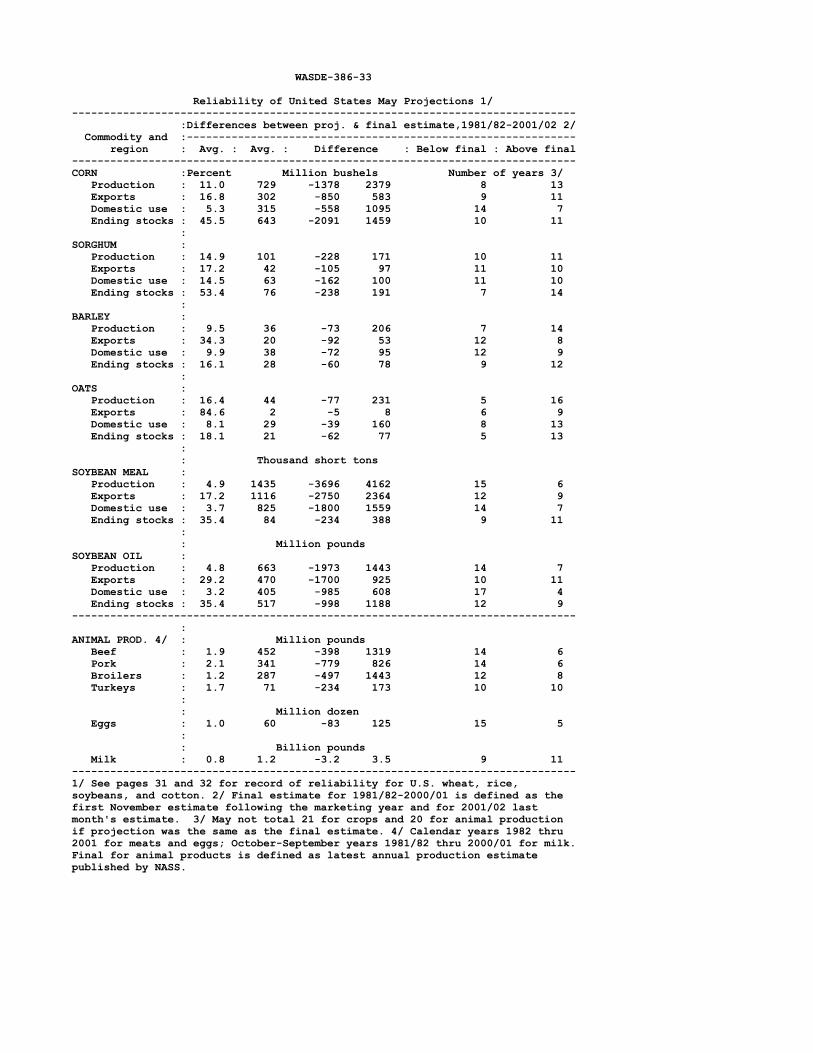
WASDE-386-33 Reliability of United States May Projections 1/------------------------------------------------------------------------------- :Differences between proj. & final estimate,1981/82-2001/02 2/ Commodity and :------------------------------------------------------------- region : Avg. : Avg. : Difference : Below final : Above final-------------------------------------------------------------------------------CORN :Percent Million bushels Number of years 3/ Production : 11.0 729 -1378 2379 8 13 Exports : 16.8 302 -850 583 9 11 Domestic use : 5.3 315 -558 1095 14 7 Ending stocks : 45.5 643 -2091 1459 10 11 :SORGHUM : Production : 14.9 101 -228 171 10 11 Exports : 17.2 42 -105 97 11 10 Domestic use : 14.5 63 -162 100 11 10 Ending stocks : 53.4 76 -238 191 7 14 :BARLEY : Production : 9.5 36 -73 206 7 14 Exports : 34.3 20 -92 53 12 8 Domestic use : 9.9 38 -72 95 12 9 Ending stocks : 16.1 28 -60 78 9 12 :OATS : Production : 16.4 44 -77 231 5 16 Exports : 84.6 2 -5 8 6 9 Domestic use : 8.1 29 -39 160 8 13 Ending stocks : 18.1 21 -62 77 5 13 : : Thousand short tonsSOYBEAN MEAL : Production : 4.9 1435 -3696 4162 15 6 Exports : 17.2 1116 -2750 2364 12 9 Domestic use : 3.7 825 -1800 1559 14 7 Ending stocks : 35.4 84 -234 388 9 11 : : Million poundsSOYBEAN OIL : Production : 4.8 663 -1973 1443 14 7 Exports : 29.2 470 -1700 925 10 11 Domestic use : 3.2 405 -985 608 17 4 Ending stocks : 35.4 517 -998 1188 12 9------------------------------------------------------------------------------- :ANIMAL PROD. 4/ : Million pounds Beef : 1.9 452 -398 1319 14 6 Pork : 2.1 341 -779 826 14 6 Broilers : 1.2 287 -497 1443 12 8 Turkeys : 1.7 71 -234 173 10 10 : : Million dozen Eggs : 1.0 60 -83 125 15 5 : : Billion pounds Milk : 0.8 1.2 -3.2 3.5 9 11-------------------------------------------------------------------------------1/ See pages 31 and 32 for record of reliability for U.S. wheat, rice,soybeans, and cotton. 2/ Final estimate for 1981/82-2000/01 is defined as thefirst November estimate following the marketing year and for 2001/02 lastmonth's estimate. 3/ May not total 21 for crops and 20 for animal productionif projection was the same as the final estimate. 4/ Calendar years 1982 thru2001 for meats and eggs; October-September years 1981/82 thru 2000/01 for milk.Final for animal products is defined as latest annual production estimatepublished by NASS.

WASDE-386-34
METRIC CONVERSION FACTORS 1 Hectare = 2.4710 Acres 1 Kilogram = 2.20462 Pounds--------------------------------------------------------------------- 1 Metric Ton : = Domestic Unit * Factor---------------------------------------------------------------------Wheat & Soybeans : = bushels * .027216Rice : = cwt * .045359Corn, Sorghum & Rye : = bushels * .025401Barley : = bushels * .021772Oats : = bushels * .014515Sugar : = short tons * .907185Cotton : = 480-lb bales * .217720---------------------------------------------------------------------
TABLE OF CONTENTS
PageHighlights . . . . . . . . . . . . . . . . . . . . . . . . . . 1World & U.S. Supply & Use for Grains . . . . . . 6World & U.S. Supply & Use for Cotton . . . . . . 7World & U.S. Supply & Use for Oilseeds . . . . 8U.S. Wheat Supply & Use . . . . . . . . . . . . . . . 9U.S. Wheat Supply & Use by Class . . . . . . . . 9U.S. Feed Grain & Corn Supply & Use . . . . . 10U.S. Sorghum, Barley &
Oats Supply & Use . . . . . . . . . . . . . . . . . 11U.S. Rice Supply & Use . . . . . . . . . . . . . . . 12U.S. Soybeans & Products Supply & Use . . . 13U.S. Sugar Supply & Use . . . . . . . . . . . . . . 14U.S. Cotton Supply & Use . . . . . . . . . . . . . 15World Wheat Supply & Use . . . . . . . . . . . . . 16World Coarse Grains Supply & Use . . . . . . . . 18
PageWorld Corn Supply & Use . . . . . . . . . . . . . . . 20World Rice Supply & Use . . . . . . . . . . . . . . . 22World Soybean Supply & Use . . . . . . . . . . . . 23World Soybean Meal Supply & Use . . . . . . . . 24World Soybean Oil Supply & Use . . . . . . . . . . 25World Cotton Supply & Use . . . . . . . . . . . . . 26U.S. Quarterly Animal Product Production . . . . 28U.S. Quarterly Prices for Animal Products . . . . 28U.S. Meats Supply and Use . . . . . . . . . . . . . . 29U.S. Egg Supply & Use . . . . . . . . . . . . . . . . . 30U.S. Milk Supply, Use & Prices . . . . . . . . . . . 30Reliability Tables . . . . . . . . . . . . . . . . . . . . . 31Metric Conversion Factors . . . . . . . . . . . . . . . 34Interagency Commodity Estimates Committees 34Electronic Access and Subscriptions . . . . . . . . 35
INTERAGENCY COMMODITY ESTIMATES COMMITTEES
Wheat: Gerald R. Rector, Chairperson, WAOBFrank Gomme, FAS; Tom Tice, FSA; Gary Vocke, ERS.
Rice: Andrew C. Aaronson, Chairperson, WAOBMichelle Thomas, FAS; Tom Tice, FSA; Nathan Childs, ERS.
Feed Grains: Gerald R. Rector, Chairperson, WAOBAlan Riffkin, FAS; Philip W. Sronce, FSA; Allen Baker, ERS.
Oilseeds: Keith Menzie, Acting Chairperson, WAOBGeorge Douvelis, FAS; Mark Ash, ERS; Philip W. Sronce, FSA.
Cotton: Carol Skelly, Chairperson, WAOBPriscilla Joseph, FAS; Wayne Bjorlie, FSA; Mark Peters, AMS; Leslie Meyer, ERS.
Sugar: John Love, Chairperson, WAOBRichard Blabey, FAS; Daniel Colacicco, FSA; Stephen Haley, ERS.
Meat Animals: Shayle Shagam, Chairperson, WAOBTim Rocke, FAS; Milton Madison, FSA; Warren Preston, AMS; Ron Gustafson, ERS.
Poultry: Shayle Shagam, Chairperson, WAOBYoonhee Macke, FAS; Milton Madison, FSA; David Harvey, ERS; Michael Berry, AMS.
Dairy: Shayle Shagam, Chairperson, WAOBArthur Coffing, FAS; John R. Mengel, AMS; James Miller, ERS; Daniel Colacicco, FSA.

WASDE-386-35
Related USDA Reports and Where To Find Them
The World Agricultural Supply and Demand Estimates (WASDE) report incorporates information from a number ofstatistical reports published by USDA and other government agencies. In turn, the WASDE report provides aframework for more detailed reports issued by USDA’s Economic Research Service and Foreign AgriculturalService.
A monthly calendar with links to reports issued by NASS, ERS, and FAS can be accessed athttp://www.usda.gov/news/releases/rptcal/calindex.htm.
Economic Research Service outlook reports analyze commodity supply, demand, and price conditions. Outlookreports for wheat, rice, feed, oil crops, cotton and wool, and livestock, dairy, and poultry are released electronically1 to 3 working days after the WASDE report. A Sugar and Sweeteners Outlook report is issued twice a year. ERSsupplements these outlook reports with commodity yearbooks that provide extensive historical data. Access ERSoutlook reports and yearbooks at http://www.ers.usda.gov/publications/outlookreports.htm.
The Foreign Agricultural Service issues reports on world agricultural production and world markets and trade. World Agricultural Production, released shortly after each WASDE report, details country-level production changessummarized in the WASDE. World Market and Trade reports for grains, oilseeds, and cotton, released 1 workingday after the WASDE, analyze monthly changes in foreign supply and demand and world trade, and providehistorical supply and demand tables for major countries and regions. World Market and Trade reports for livestockand poultry, dairy products and horticultural products, including sugar, are published several times a year. Accesscurrent issues of FAS reports at http://www.fas.usda.gov/currwmt.html. Click on “archives” for back issues.
USDA publishes PS&D View, a comprehensive database of supply and demand balances by commodity for 190countries and regions. Data are maintained by FAS and published by ERS. Grains, oilseeds and cotton data areupdated monthly and data for other commodities are updated less frequently. PS&D View runs on a free softwareprogram that graphs and displays balance sheet variables. Download the program and the data athttp://www.ers.usda.gov/data/psd/feature.htm.
WASDE Subscriptions
Mail subscriptions cost $60.00; 2- and 3-year subscriptions are available. Call 1-800-999-6779 or 703-605-6220,8:30 a.m.-5:00 pm. ET, or write ERS-NASS, 5285 Port Royal Road, Springfield, Virginia 22161. Subscriptions arealso available from the Superintendent of Documents, U.S. Government Printing Office. Internet:http://bookstore.gpo.gov. Phone: toll free (866) 512-1800; DC area (202) 512-1800. Fax: (202) 512-2250. Mail:Government Printing Office, Stop SSOP, Washington, D.C. 20402-0001.
Electronic Access
This report and other USDA releases are posted electronically by release date athttp://www.usda.gov/news/releases/rptcal/calindex.htm. To view a report, click the month of release, then thereport title.
Download this report in both ascii text format and pdf (Adobe Acrobat) format athttp://usda.mannlib.cornell.edu/usda/reports/waobr/wasde-bb/. Acrobat files can be viewed or printed in theiroriginal form, page by page.
Get a free e-mail subscription to the WASDE and other USDA crop reports at http://usda.mannlib.cornell.edu. Click on the “Reports by E-Mail” button to sign up.
For instructions on retrieving the WASDE report by fax, call (202) 694-5700 from the handset of a fax machine andfollow voice prompts to retrieve document 66900. For information on e-mail subscriptions or other questions aboutthe WASDE report, call (202) 720-5447.

FIRST-CLASS MAILPOSTAGE & FEES PAID
USDAPERMIT NO. G-289
UNITED STATES DEPARTMENT OF AGRICULTUREWORLD AGRICULTURAL OUTLOOK BOARD
WASHINGTON, D.C. 20250-3812_________________
OFFICIAL BUSINESSPenalty for Private Use, $300
World Agricultural Supply and Demand EstimatesWASDE-386 - May 10, 2002
U.S. Department of AgricultureOffice of the Chief Economist
Approved by the World Agricultural Outlook Board
**********
The U.S. Department of Agriculture (USDA) prohibits discrimination in all its programsand activities on the basis of race, color, national origin, gender, religion, age, disability,political beliefs, sexual orientation, and marital or family status. (Not all prohibited basesapply to all programs.) Persons with disabilities who require alternative means forcommunication of program information (Braille, large print, audiotape, etc.) shouldcontact USDA’s TARGET Center at 202-720-2600 (voice and TDD).
To file a complaint of discrimination, write USDA, Director, Office of Civil Rights, Room326-W, Whitten Building, 14th and Independence Avenue, SW, Washington, DC 20250-9410 or call (202) 720-5964 (voice or TDD). USDA is an equal opportunity provider andemployer.