workshop on mdg monitoring: 2015 and beyond -...
TRANSCRIPT

Workshop on MDG Monitoring:
2015 and beyond
MDG’s in Asia and the Pacific
9-13 July, 2012
Bangkok, Thailand
1
Introduction
• Introduction
• Progress assessment
• UN MDG Indicators database
• Asia-Pacific Regional MDG Report 2011/12
– Key findings
• Progress in selected countries and indicators
• Disparities within countries
• Summary
2
Introduction
• Since 2004, the ESCAP/ADB/UNDP partnership has produced
seven successive regional reports on the achievements of
the MDGs in Asia and the Pacific
• The progress assessments are based on the latest available
data from the global database on official MDG Indicators
• Analysis of the trends and calculation of simple projections
determine whether countries are on or off track
• Four categories are used:
● Early achiever: Already achieved the 2015 target
� On track: Expected to meet the target by 2015
� Off track-Slow: Expected to meet the target, but after 2015
� Off track-No progress/regressing: Stagnating or slipping
backwards 3
Progress assessment
• The progress assessment for a given MDG target is produced
on the basis of the trend since 1990
• It requires a minimum of two data points that are at least
three years apart (sufficient for estimating trends)
• Data from UN MDG Indicators database as of 30 September
2011
• No assessments for Goal 8
4
UN MDG Indicators database
• Product of Inter-Agency Group and Expert Group on MDG
Indicators (IAEG)
• Data typically drawn from official statistics provided by
ministries and national statistical offices to international
agencies
• International agencies may:
– Adjust figures to ensure comparability across countries
– Fill gaps by using data from surveys like DHS, MICS
• Also, countries may have more recent data
• Therefore: discrepancies may occur between national and
international data series, possibly resulting in differences in
assessing progress
5

UN MDG Indicators database
• The picture on data availability is positive
• Since 2011 sufficient comparable data are available to assess
progress towards a reduction by three quarters, between
1990 and 2015, of the maternal mortality ratio
• For 18 indicators, data availability for supporting progress
tracking improved considerably between 2004 and 2011
except for 3 countries (China, Viet Nam and PNG) for which
the number of indicators with insufficient data for the
assessment remained the same between 2004 and 2011
6

Asia-Pacific Regional MDG Report 2011/12
Accelerating Equitable Achievement of the MDGs
Closing Gaps in Health and Nutrition Outcomes
ESCAP/ADB/UNDP partnership in collaboration with UNFPA, UNICEF and WHO
Launched in New Delhi on 17 February 2012
7th in series since 2004 7
Key findings
• Progress has been impressive but uneven
• Particular challenges in achieving health and nutrition
targets
• Countries lagging behind need to accelerate in progress
– Large gaps in achievement across countries
• National efforts also need to target disadvantaged
population groups
– Within-country disparities as large as cross-country disparities
• Eight-point strategy to close gaps
8

Progress in achieving MDG targets in Asia and the Pacific
9

Compared to other developing regions
• Asia and the Pacific is generally making better progress
towards the MDG targets than sub-Saharan Africa
• But is lagging behind Latin America and the Caribbean
10
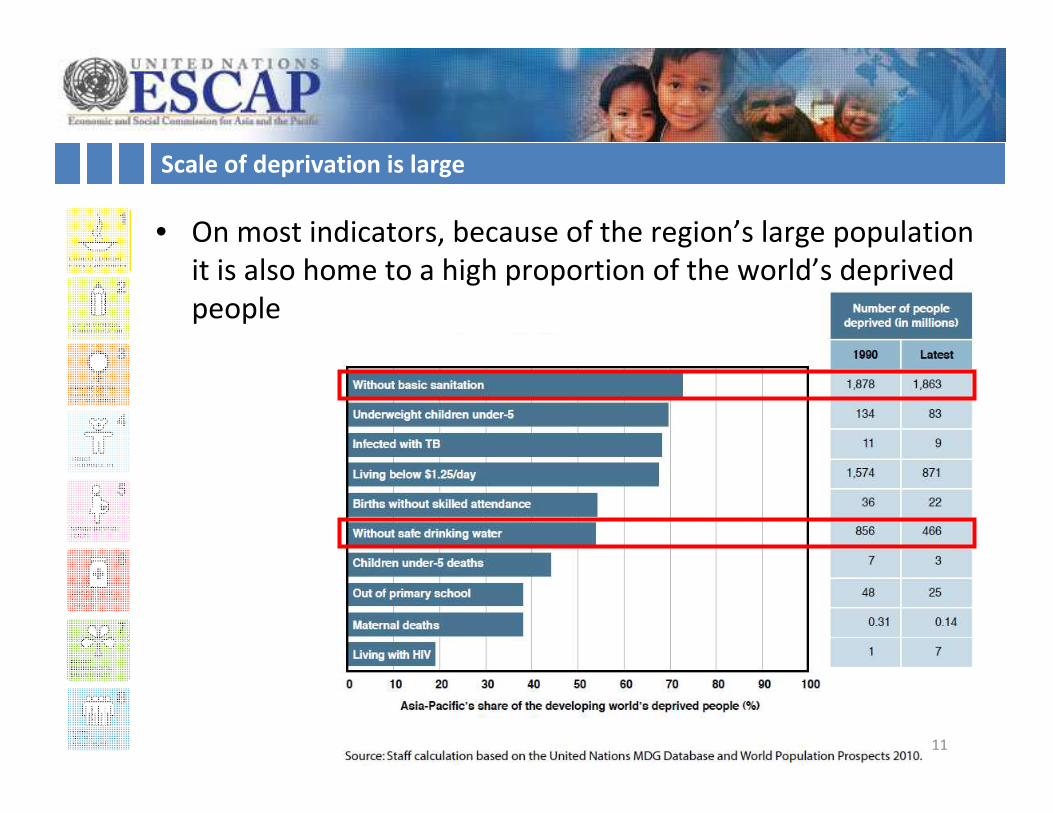
Scale of deprivation is large
• On most indicators, because of the region’s large population
it is also home to a high proportion of the world’s deprived
people
11

Progress in selected countries
12

$1.25 per day poverty
13
Country
Affected population in 2015 on current trend
(thousands)
Annual decrease needed to reach target,
percentage points
Affected population in 2015 if target reached
(thousands)
Saving in human cost if target reached
(thousands)Philippines 17,136.53 0.81 15,691.03 1,445.49
Mongolia 536.38 1.30 280.37 256.01
Bangladesh 59,605.76 1.62 53,370.77 6,234.98
Nepal 11,906.33 1.90 11,312.76 593.57
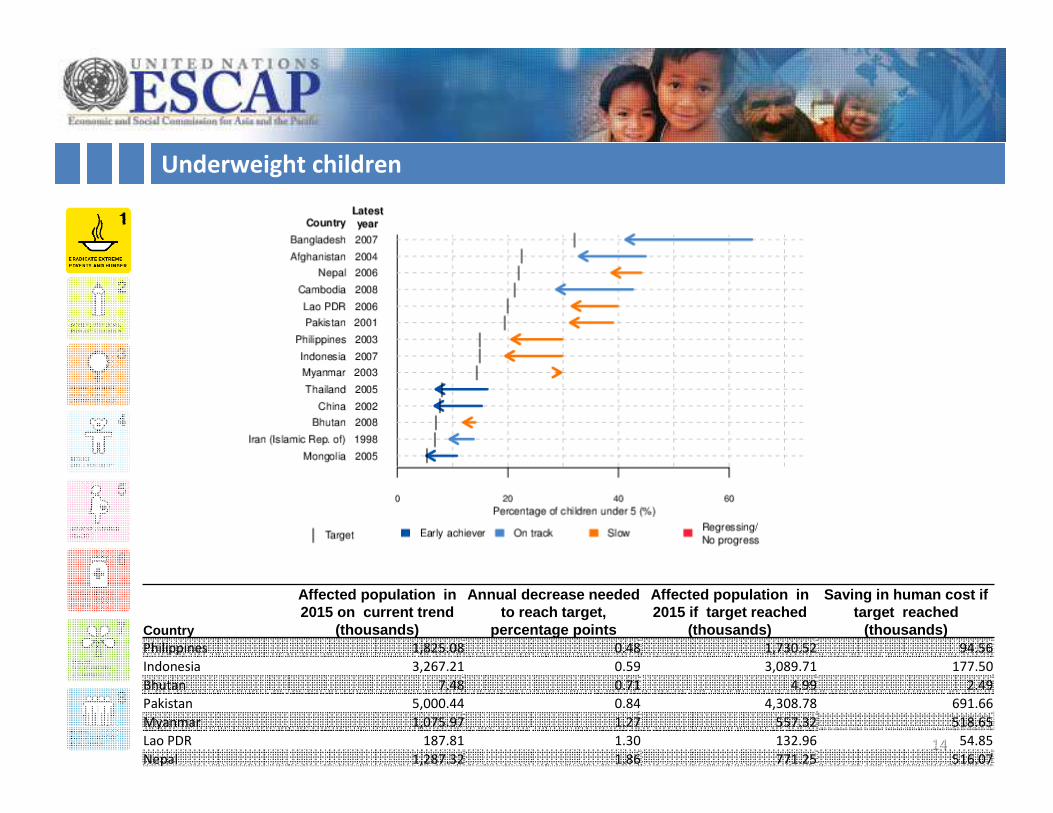
Underweight children
14
Country
Affected population in 2015 on current trend
(thousands)
Annual decrease needed to reach target,
percentage points
Affected population in 2015 if target reached
(thousands)
Saving in human cost if target reached
(thousands)Philippines 1,825.08 0.48 1,730.52 94.56
Indonesia 3,267.21 0.59 3,089.71 177.50
Bhutan 7.48 0.71 4.99 2.49
Pakistan 5,000.44 0.84 4,308.78 691.66
Myanmar 1,075.97 1.27 557.32 518.65
Lao PDR 187.81 1.30 132.96 54.85
Nepal 1,287.32 1.86 771.25 516.07

Primary enrolment
15
Country
Affected population in 2015 on current trend
(thousands)
Annual increase needed to reach target,
percentage points
Affected population in 2015 if target reached
(thousands)
Saving in human cost if target reached
(thousands)Philippines 1,061.92 0.41 672.10 389.82
Thailand 544.31 0.82 274.91 269.41
Cambodia 129.27 0.91 87.31 41.96
Bangladesh 1,568.79 0.93 739.99 828.79
Bhutan 5.13 1.10 4.96 0.17
Lao PDR 119.54 1.80 33.87 85.68
Pakistan 5,425.14 4.77 1,049.04 4,376.10

Gender primary
16
Country
Affected population in 2015 on current trend
(thousands)Annual increase needed to reach target, points
Affected population in 2015 if target reached
(thousands)
Saving in human cost if target reached
(thousands)Papua New Guinea 88.49 0.01 27.65 60.84
Afghanistan 373.45 0.05 151.72 221.73

Gender secondary
17
Country
Affected population in 2015 on current trend
(thousands)Annual increase needed to reach target, points
Affected population in 2015 if target reached
(thousands)
Saving in human cost if target reached
(thousands)Lao PDR 39.16 0.02 21.38 17.78
Afghanistan 1,361.32 0.08 133.46 1,227.86

Gender tertiary
18
Country
Affected population in 2015 on current trend
(thousands)Annual increase needed to reach target, points
Affected population in 2015 if target reached
(thousands)
Saving in human cost if target reached
(thousands)Pakistan 673.09 0.01 500.82 172.27
Nepal 1,147.60 0.05 87.23 1,060.37
Bhutan 12.53 0.05 1.94 10.59
Cambodia 114.79 0.06 39.91 74.88
Bangladesh 3,098.29 0.06 389.57 2,708.72
Afghanistan 1,384.35 0.12 91.08 1,293.27

Under-5 mortality
19
Country
Affected population over 2011-2015 on current trend (,000)
Annual decrease needed to reach target, per 1,000
live births
Affected population over 2011-2015 if target
reached (thousands)
Lives saved over 2011-2015 if target reached
(thousands)Philippines 309.80 1.87 275.81 33.99
Cambodia 79.00 2.13 69.82 9.18
Myanmar 249.52 5.73 193.31 56.20
Papua New Guinea 60.45 6.20 42.95 17.51
Pakistan 1,929.87 9.13 1,365.02 564.84
Afghanistan 975.45 15.87 703.51 271.94
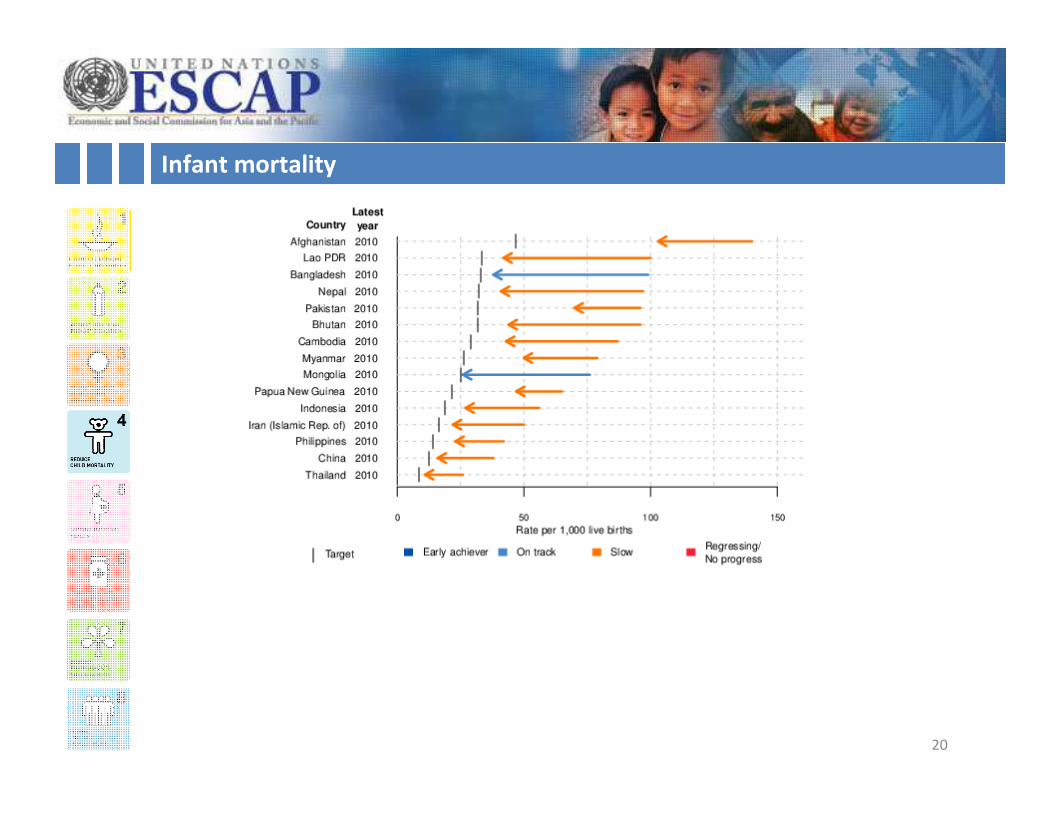
Infant mortality
20

Infant mortality
21
Country
Affected population over 2011-2015 on current trend (,000)
Annual decrease needed to reach target, per 1,000
live births
Affected population over 2011-2015 if target
reached (thousands)
Lives saved over 2011-2015 if target reached
(thousands)Thailand 37.84 0.47 38.10 0.09
China 1,169.61 0.67 1,115.96 53.65
Iran (Islamic Rep. of) 120.43 1.07 113.55 6.88
Indonesia 512.99 1.67 462.68 50.32
Lao PDR 25.70 1.73 25.57 0.13
Nepal 130.82 1.73 128.84 1.98
Philippines 252.84 1.80 205.76 47.08
Bhutan 2.86 2.40 2.69 0.18
Cambodia 67.99 2.80 53.75 14.24
Myanmar 191.05 4.73 140.81 50.25
Papua New Guinea 47.33 5.07 31.94 15.39
Pakistan 1,573.00 7.60 1,075.23 497.78
Afghanistan 681.97 11.27 477.26 204.71

Maternal mortality
22
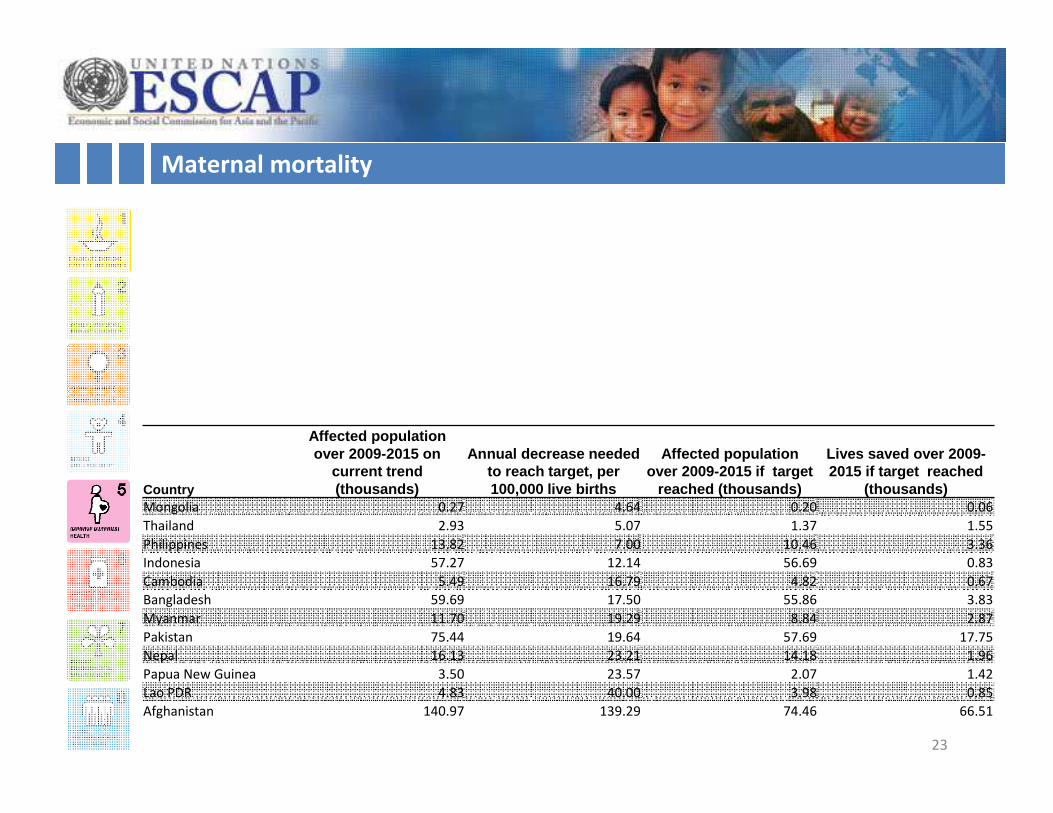
Maternal mortality
23
Country
Affected population over 2009-2015 on
current trend (thousands)
Annual decrease needed to reach target, per 100,000 live births
Affected population over 2009-2015 if target
reached (thousands)
Lives saved over 2009-2015 if target reached
(thousands)Mongolia 0.27 4.64 0.20 0.06
Thailand 2.93 5.07 1.37 1.55
Philippines 13.82 7.00 10.46 3.36
Indonesia 57.27 12.14 56.69 0.83
Cambodia 5.49 16.79 4.82 0.67
Bangladesh 59.69 17.50 55.86 3.83
Myanmar 11.70 19.29 8.84 2.87
Pakistan 75.44 19.64 57.69 17.75
Nepal 16.13 23.21 14.18 1.96
Papua New Guinea 3.50 23.57 2.07 1.42
Lao PDR 4.83 40.00 3.98 0.85
Afghanistan 140.97 139.29 74.46 66.51
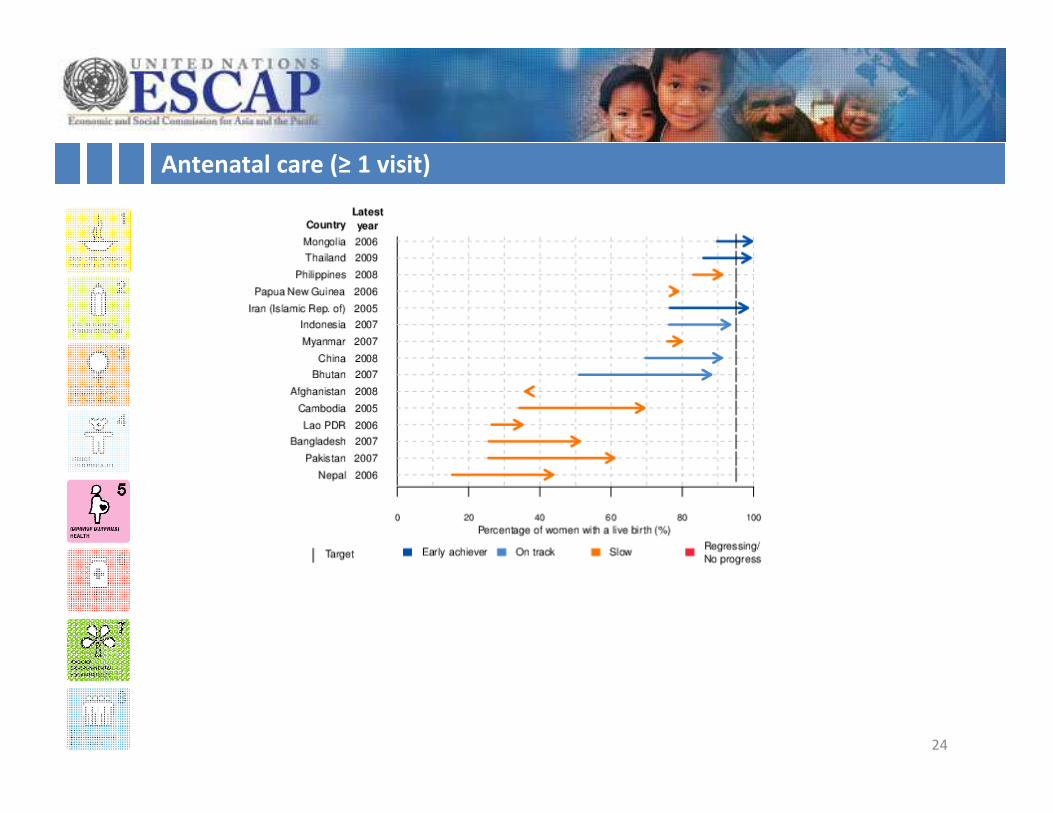
Antenatal care (≥ 1 visit)
24

Antenatal care (≥ 1 visit)
25
Country
Affected population in 2015 on current trend
(thousands)
Annual increase needed to reach target,
percentage points
Affected population in 2015 if target reached
(thousands)
Saving in human cost if target reached
(thousands)Philippines 169.01 0.56 120.93 48.08
Papua New Guinea 43.02 1.80 10.71 32.30
Myanmar 140.54 1.90 39.91 100.63
Cambodia 19.82 2.57 15.55 4.27
Pakistan 1,655.28 4.26 239.92 1,415.37
Bangladesh 911.16 5.47 146.95 764.21
Nepal 281.78 5.70 36.19 245.59
Lao PDR 65.40 6.66 6.94 58.46
Afghanistan 1,011.64 8.43 75.16 936.48

Skilled birth attendance
26

Skilled birth attendance
27
Country
Affected population in 2015 on current trend
(thousands)
Annual increase needed to reach target,
percentage points
Affected population in 2015 if target reached
(thousands)
Saving in human cost if target reached
(thousands)Thailand 4.62 0.07 1.35 3.27
Myanmar 226.92 2.83 107.16 119.77
Philippines 812.08 3.71 285.40 526.68
Papua New Guinea 104.86 3.92 25.07 79.80
Cambodia 125.80 3.97 51.32 74.48
Pakistan 2,615.71 5.11 974.06 1,641.65
Nepal 496.84 6.46 167.57 329.27
Lao PDR 108.27 6.62 27.97 80.30
Afghanistan 923.14 7.73 329.22 593.92
Bangladesh 2,033.36 8.83 664.94 1,368.42

Safe drinking water
28
Country
Affected population in 2015 on current trend
(thousands)
Annual increase needed to reach target,
percentage points
Affected population in 2015 if target reached
(thousands)
Saving in human cost if target reached
(thousands)Iran (Islamic Rep. of) 3,748.14 0.17 3,535.03 213.10
Pakistan 17,293.86 0.43 13,469.52 3,824.34
Bhutan 59.70 0.50 35.77 23.94
Indonesia 41,391.47 0.79 36,719.98 4,671.49
Myanmar 11,525.86 1.07 10,786.54 739.33
Bangladesh 30,416.84 1.29 17,577.20 12,839.64
Lao PDR 2,448.19 2.14 1,889.85 558.34
Papua New Guinea 4,634.71 4.36 2,278.73 2,355.98
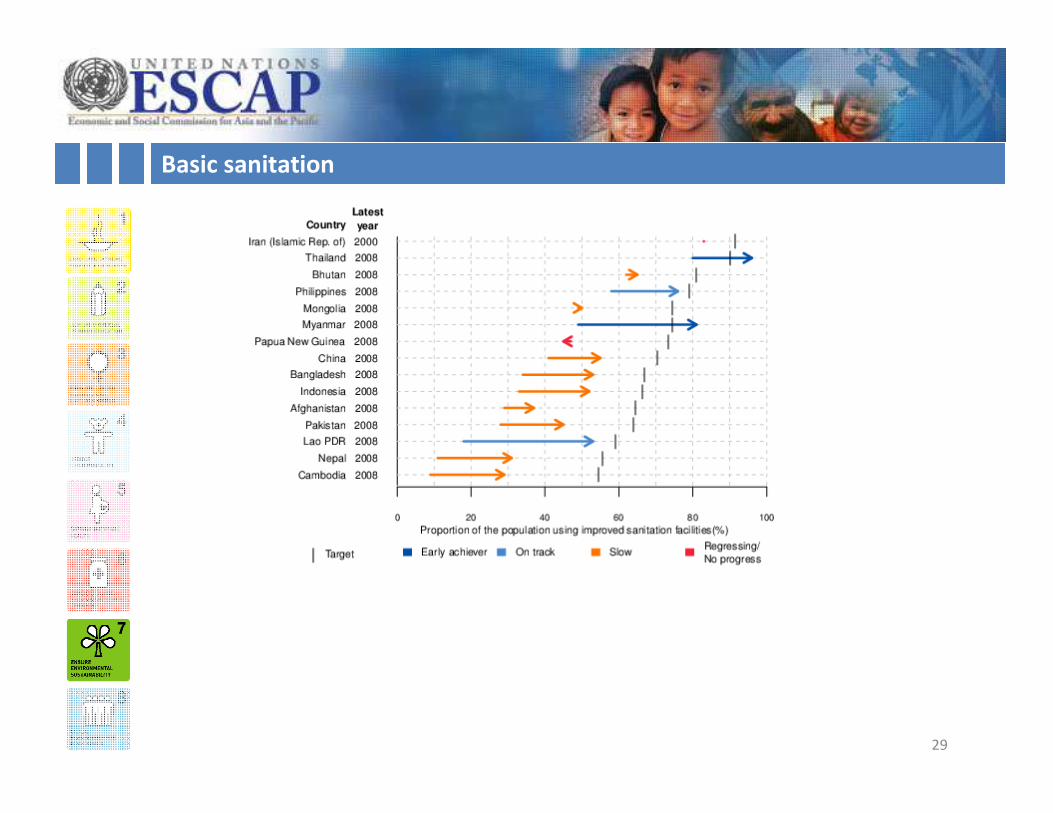
Basic sanitation
29
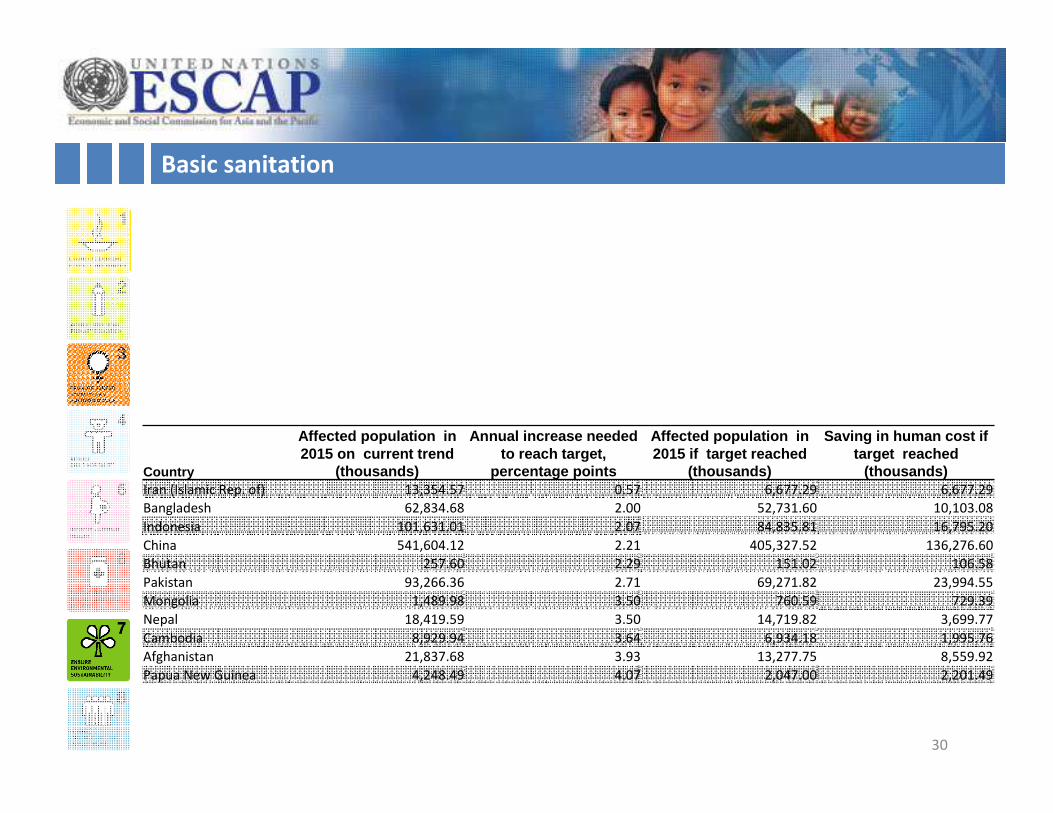
Basic sanitation
30
Country
Affected population in 2015 on current trend
(thousands)
Annual increase needed to reach target,
percentage points
Affected population in 2015 if target reached
(thousands)
Saving in human cost if target reached
(thousands)Iran (Islamic Rep. of) 13,354.57 0.57 6,677.29 6,677.29
Bangladesh 62,834.68 2.00 52,731.60 10,103.08
Indonesia 101,631.01 2.07 84,835.81 16,795.20
China 541,604.12 2.21 405,327.52 136,276.60
Bhutan 257.60 2.29 151.02 106.58
Pakistan 93,266.36 2.71 69,271.82 23,994.55
Mongolia 1,489.98 3.50 760.59 729.39
Nepal 18,419.59 3.50 14,719.82 3,699.77
Cambodia 8,929.94 3.64 6,934.18 1,995.76
Afghanistan 21,837.68 3.93 13,277.75 8,559.92
Papua New Guinea 4,248.49 4.07 2,047.00 2,201.49

Disparities
31
Source: DHS 2008ARMM: Autonomous Region in Muslim MindanaoCALABARZON: CAvite, LAguna, BAtangas, Rizal, and QueZONSOCCSKSARGEN: South Cotabato, Cotabato, Sultan Kudarat, Sarangani and General Santos City.
• Gaps in MDG
achievements
among citizens
within national
borders can be
as large as gaps
between
people from
different
countries

Disparities
32
• Overall
disparities tend
to be larger in
countries with
relatively lower
levels of
attainment
(large red
bubbles)
• Attainments
are generally
higher with low
disparities

Disparities
33
• Child malnutrition
less prevalent in
urban than in rural
areas
• Prevalence levels
similar among
children of same
economic status
Rural
Urban
Percentage of children under-5 underweight

Drivers of within country disparities
34
• A very complex set of interlinked factors is behind the
disparities, but the analysis reveals that sometimes only one
factor needs to be addressed to create significant change
and reduce the disparities even when the rest of the
characteristics remain unchangeable.
• The analysis suggests that there are common factors to
reduce disparities across the analyzed indicators:
– Household wealth
– Education of mother
– For under-5 mortality
• Breast-feeding reduces risk
• High risk for girls in some countries
– Castes, ethnic and linguistic groups
• Need to remove cultural and institutional discrimination

Summary
35
• Very good regional progress in some areas
• Uneven progress across sub-regions and between countries
• Disparities within countries persist
• Large scale of deprivation remains
• Challenges to reduce hunger, improve health and services
