working together to create value in the world of real estate · working together to create value in...
TRANSCRIPT
September 2015
Investor Presentation
58,000 employees, 230 offices, 80 countries, 1 global brand
Working together to create value in the world of real estate
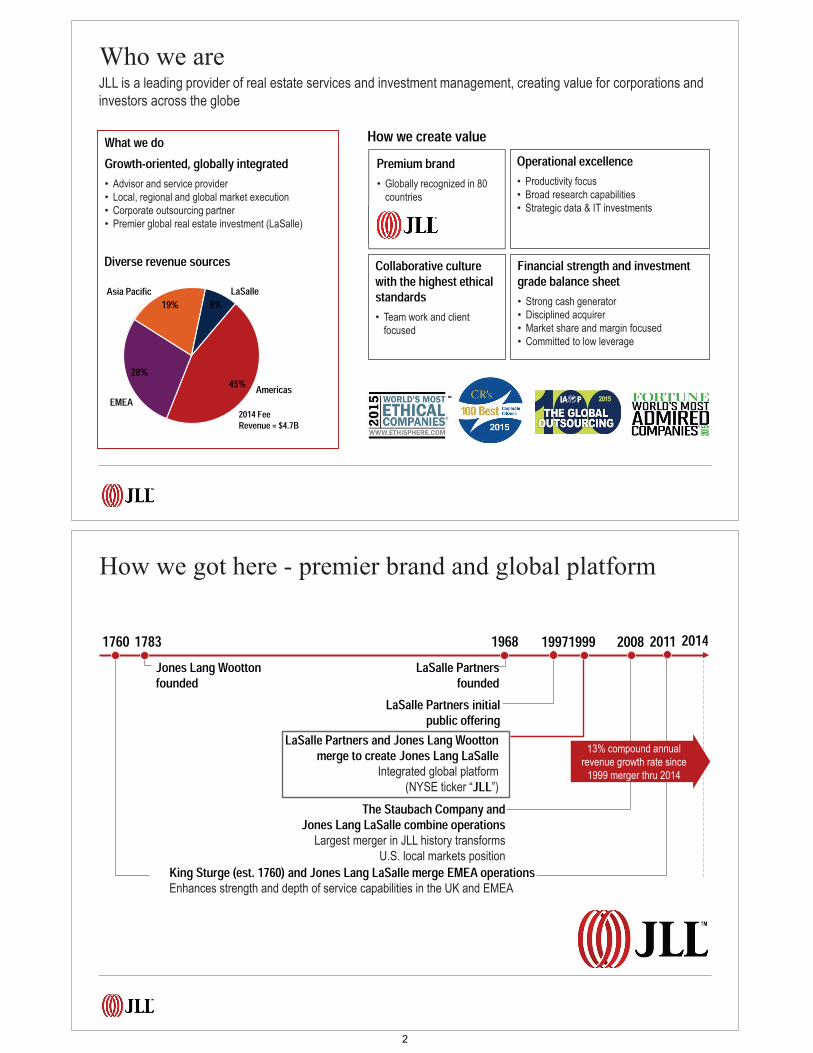
What we doGrowth-oriented, globally integrated• Advisor and service provider• Local, regional and global market execution• Corporate outsourcing partner• Premier global real estate investment (LaSalle)
Who we areJLL is a leading provider of real estate services and investment management, creating value for corporations andinvestors across the globe
Diverse revenue sources
45%28%
19% 8%
Americas
LaSalleAsia Pacific
EMEA2014 Fee Revenue = $4.7B
Operational excellence• Productivity focus• Broad research capabilities• Strategic data & IT investments
Collaborative culture with the highest ethical standards• Team work and client
focused
How we create value
Financial strength and investment grade balance sheet• Strong cash generator• Disciplined acquirer• Market share and margin focused• Committed to low leverage
Premium brand• Globally recognized in 80
countries
Jones Lang Wootton founded
1783 1968 19971999LaSalle Partners
foundedLaSalle Partners initial
public offeringLaSalle Partners and Jones Lang Wootton
merge to create Jones Lang LaSalleIntegrated global platform
(NYSE ticker “JLL”)
2008
The Staubach Company andJones Lang LaSalle combine operations
Largest merger in JLL history transforms U.S. local markets position
King Sturge (est. 1760) and Jones Lang LaSalle merge EMEA operations Enhances strength and depth of service capabilities in the UK and EMEA
1760
13% compound annual revenue growth rate since
1999 merger thru 2014
20142011
How we got here - premier brand and global platform
2
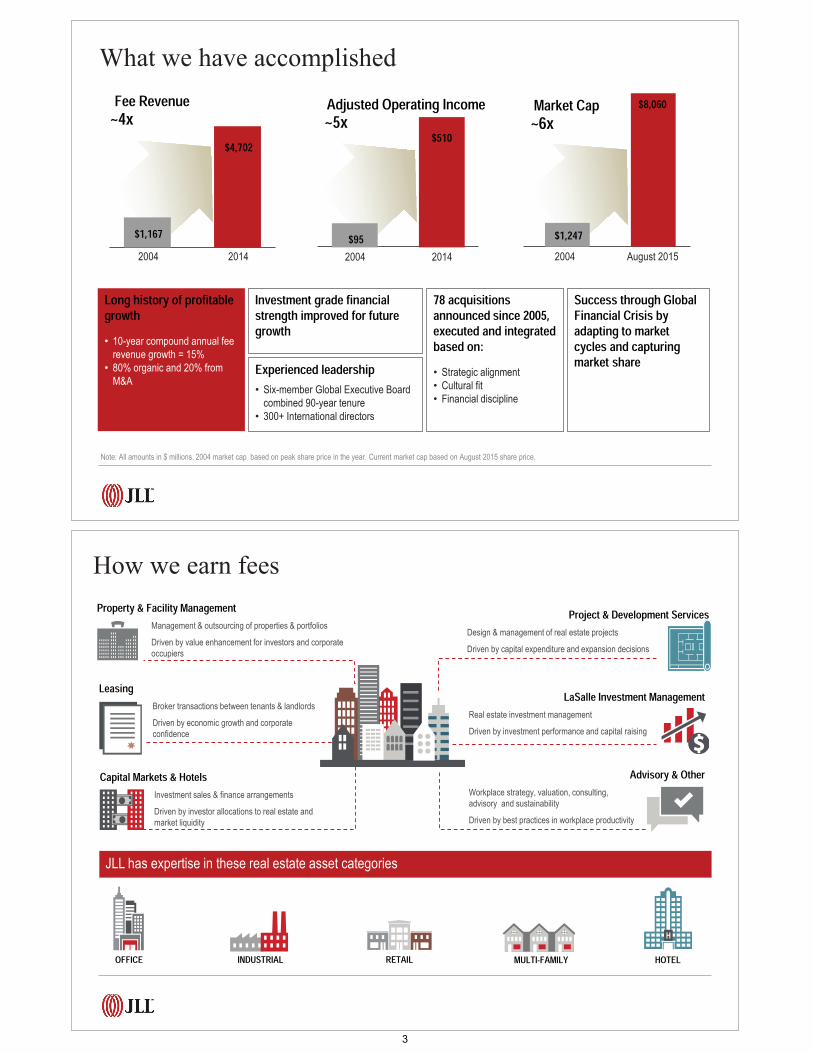
Fee Revenue ~4x
2004 2014
Note: All amounts in $ millions. 2004 market cap based on peak share price in the year. Current market cap based on August 2015 share price.
What we have accomplished
$1,167
$4,702
Market Cap~6x
2004 August 2015
Adjusted Operating Income~5x
$95
$510
2004 2014
$8,060
$1,247
Investment grade financial strength improved for future growth
Experienced leadership• Six-member Global Executive Board
combined 90-year tenure• 300+ International directors
Long history of profitable growth• 10-year compound annual fee
revenue growth = 15%• 80% organic and 20% from
M&A
78 acquisitions announced since 2005, executed and integrated based on:• Strategic alignment• Cultural fit• Financial discipline
Success through Global Financial Crisis by adapting to market cycles and capturing market share
How we earn fees
LeasingBroker transactions between tenants & landlords
Driven by economic growth and corporate confidence
Capital Markets & HotelsInvestment sales & finance arrangements
Driven by investor allocations to real estate and market liquidity
Property & Facility ManagementManagement & outsourcing of properties & portfolios
Driven by value enhancement for investors and corporate occupiers
Project & Development ServicesDesign & management of real estate projects
Driven by capital expenditure and expansion decisions
Advisory & OtherWorkplace strategy, valuation, consulting,advisory and sustainability
Driven by best practices in workplace productivity
LaSalle Investment ManagementReal estate investment management
Driven by investment performance and capital raising
MULTI-FAMILYRETAIL HOTEL
JLL has expertise in these real estate asset categories
INDUSTRIALOFFICE
3
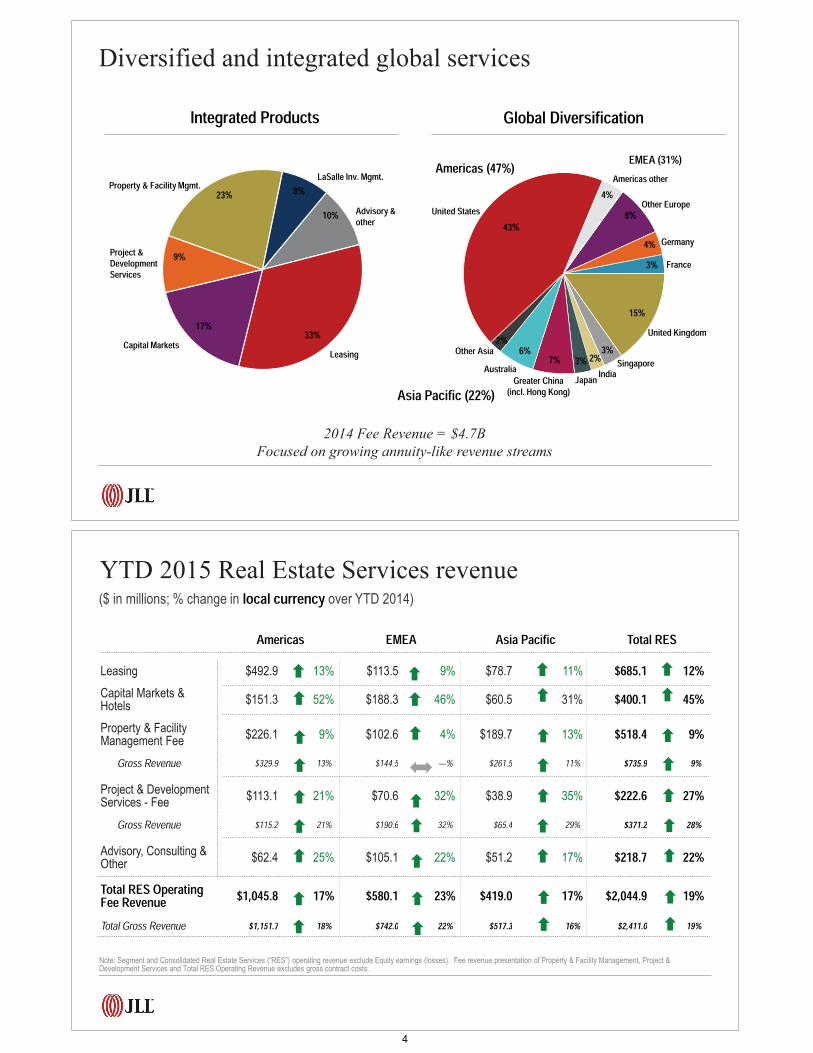
Integrated Products
Leasing
Advisory & other
LaSalle Inv. Mgmt.Property & Facility Mgmt.
Project & Development Services
Capital Markets 33%
10%8%
9%
Global Diversification EMEA (31%)
Other AsiaUnited Kingdom
FranceGermany
Other Europe
JapanGreater China(incl. Hong Kong)
Australia IndiaSingapore
Asia Pacific (22%)
Americas (47%)
United States43%
4%8%
4%3%
15%
3%2%3%7%2% 6%
Americas other 23%
Diversified and integrated global services
2014 Fee Revenue = $4.7B
Focused on growing annuity-like revenue streams
17%
($ in millions; % change in local currency over YTD 2014)
YTD 2015 Real Estate Services revenue
Note: Segment and Consolidated Real Estate Services (“RES”) operating revenue exclude Equity earnings (losses). Fee revenue presentation of Property & Facility Management, Project & Development Services and Total RES Operating Revenue excludes gross contract costs.
Americas EMEA Asia Pacific Total RESLeasing $492.9 13% $113.5 9% $78.7 11% $685.1 12%Capital Markets & Hotels $151.3 52% $188.3 46% $60.5 31% $400.1 45%Property & FacilityManagement Fee $226.1 9% $102.6 4% $189.7 13% $518.4 9%
Gross Revenue $329.9 13% $144.5 —% $261.5 11% $735.9 9%
Project & DevelopmentServices - Fee $113.1 21% $70.6 32% $38.9 35% $222.6 27%
Gross Revenue $115.2 21% $190.6 32% $65.4 29% $371.2 28%
Advisory, Consulting &Other $62.4 25% $105.1 22% $51.2 17% $218.7 22%Total RES OperatingFee Revenue $1,045.8 17% $580.1 23% $419.0 17% $2,044.9 19%Total Gross Revenue $1,151.7 18% $742.0 22% $517.3 16% $2,411.0 19%
4
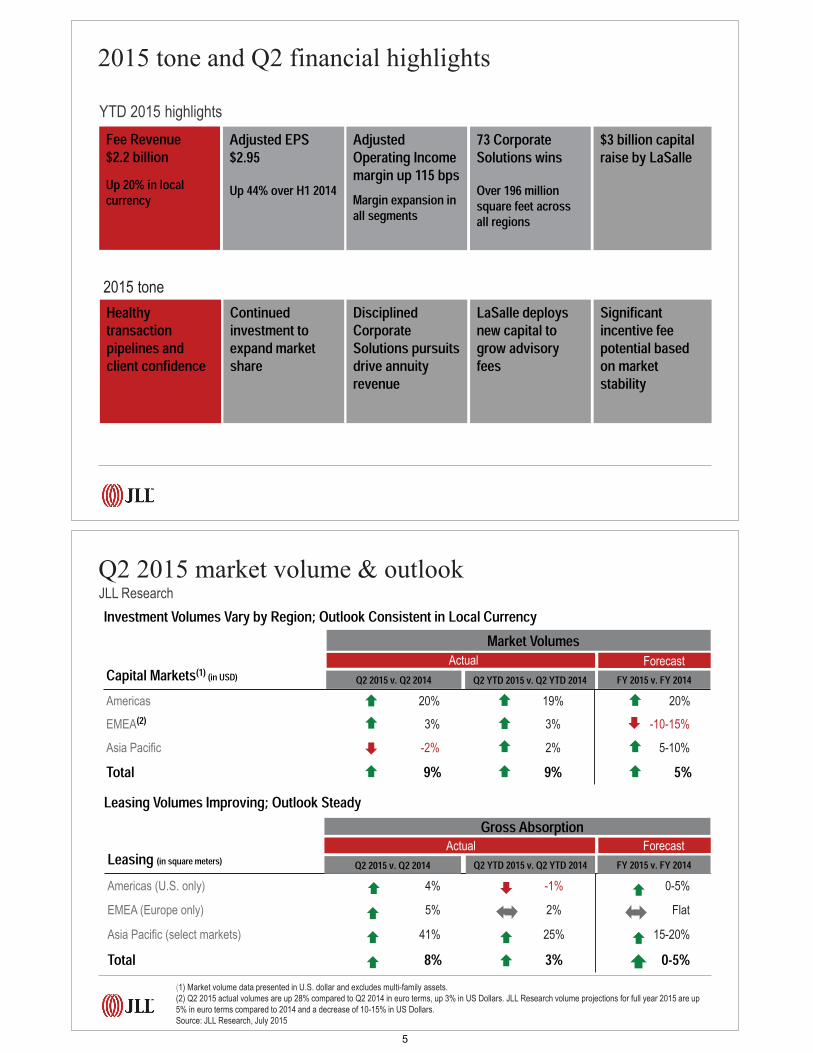
2015 tone and Q2 financial highlights
Adjusted EPS $2.95Up 44% over H1 2014
Fee Revenue $2.2 billionUp 20% in local currency
Adjusted Operating Income margin up 115 bpsMargin expansion in all segments
73 Corporate Solutions winsOver 196 million square feet across all regions
$3 billion capital raise by LaSalle
2015 tone
YTD 2015 highlights
Healthy transaction pipelines and client confidence
Continued investment to expand market share
Disciplined Corporate Solutions pursuits drive annuity revenue
LaSalle deploys new capital to grow advisory fees
Significant incentive fee potential based on market stability
JLL Research
Capital Markets(1) (in USD)Americas 20% 19% 20%
EMEA(2) 3% 3% -10-15%
Asia Pacific -2% 2% 5-10%
Total 9% 9% 5%
Leasing (in square meters)
Americas (U.S. only) 4% -1% 0-5%
EMEA (Europe only) 5% 2% Flat
Asia Pacific (select markets) 41% 25% 15-20%
Total 8% 3% 0-5%
Investment Volumes Vary by Region; Outlook Consistent in Local Currency
Q2 2015 market volume & outlook
Actual Forecast
Q2 2015 v. Q2 2014 Q2 YTD 2015 v. Q2 YTD 2014 FY 2015 v. FY 2014
Leasing Volumes Improving; Outlook Steady
Market Volumes
Actual Forecast
Q2 2015 v. Q2 2014 Q2 YTD 2015 v. Q2 YTD 2014 FY 2015 v. FY 2014
Gross Absorption
(1) Market volume data presented in U.S. dollar and excludes multi-family assets.(2) Q2 2015 actual volumes are up 28% compared to Q2 2014 in euro terms, up 3% in US Dollars. JLL Research volume projections for full year 2015 are up 5% in euro terms compared to 2014 and a decrease of 10-15% in US Dollars.Source: JLL Research, July 2015
5

Investment thesis
Driving increased profitability & cash flow
for growthObjectives and results
Guiding principles
25 acquisitions announced since 2014 with total estimated value over $500M
Capitalize on growth opportunities
S&P upgrade to BBB+
Protect balance sheet
Outperformance versus the S&P 500
Drive shareholder value
Growth focused• Long-term revenue
growth
• Market share gains
• Margin accretion
Core businesses• Market-leading
Leasing & Capital Markets positions
• Corporate Solutions
• LaSalle Investment Management
Global brand• Superior client
relationships
• Collaborative, experienced and deep leadership bench
• Highest ethical standards and commitment to diversity
Financial strength• Strong cash flow & low
leverage
• Disciplined capital allocations
• Proactive risk mitigation
• Dividend payout
Productivity mindset• Infrastructure leverage
• Occupancy
• IT investments
Driving to Strategy 2020
Our strategy for continued success
Build our local and regional Markets
business
Strengthen our winning positions in Corporate
Solutions
Capture the leading share of global capital flows for
investment sales
Grow LaSalle Investment Management’s leadership
position
G1 G2 G3 G4
G5
Connections: Differentiate and Sustain
• Balance top-line growth
• Platform investments
• Productivity to maximize profit
• Leverage global position
• Industry consolidation to grow market share
• Increase productivity
• Manage costs to improve margins
• Maintain financial strength
• Flexibility to respond to uncertainty
6
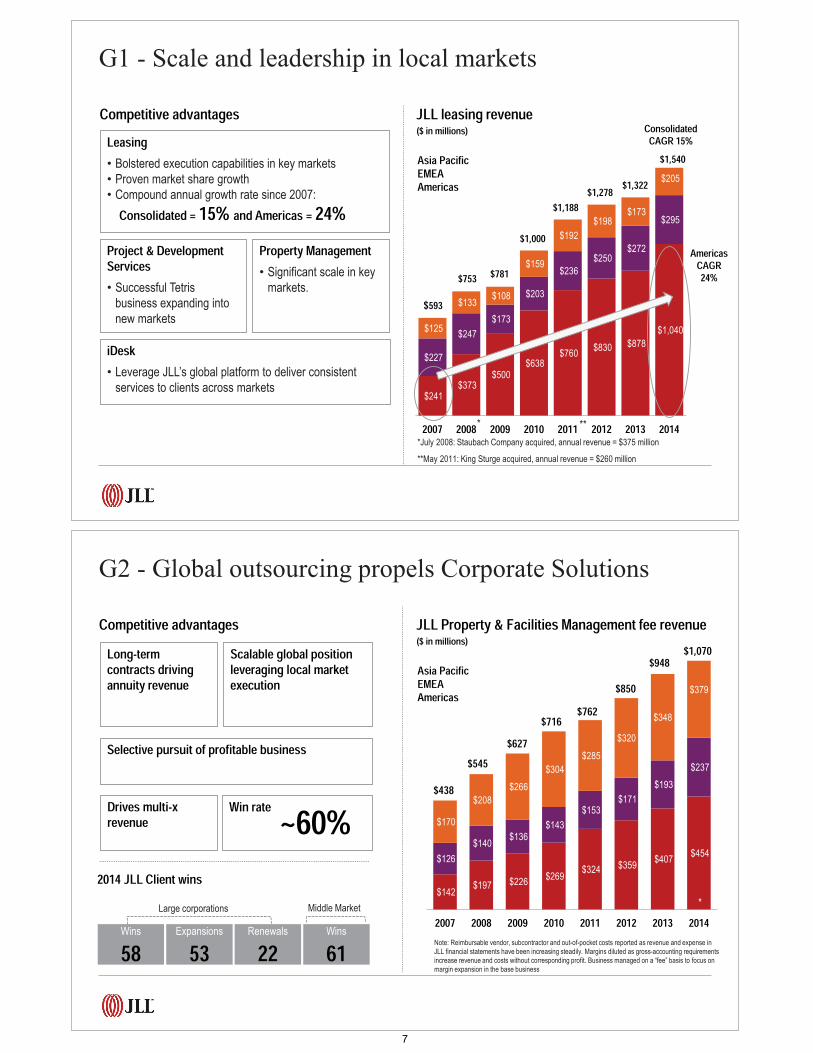
*July 2008: Staubach Company acquired, annual revenue = $375 million
**May 2011: King Sturge acquired, annual revenue = $260 million
($ in millions)
$241 $373
$500 $638
$760 $830 $878
$1,040
$227
$247
$173
$203
$236
$250 $272
$295
$125
$133 $108
$159
$192
$198 $173
$205
2007 2008 2009 2010 2011 2012 2013 2014
$593
$781$753
$1,000
$1,188$1,278
*
$1,322
ConsolidatedCAGR 15%
**
AmericasCAGR 24%
$1,540Leasing• Bolstered execution capabilities in key markets• Proven market share growth• Compound annual growth rate since 2007:
Consolidated = 15% and Americas = 24%Property Management• Significant scale in key
markets.
Project & Development Services• Successful Tetris
business expanding into new markets
iDesk• Leverage JLL’s global platform to deliver consistent
services to clients across markets
Competitive advantages JLL leasing revenue
Asia Pacific EMEA Americas
G1 - Scale and leadership in local markets
G2 - Global outsourcing propels Corporate Solutions
Note: Reimbursable vendor, subcontractor and out-of-pocket costs reported as revenue and expense in JLL financial statements have been increasing steadily. Margins diluted as gross-accounting requirements increase revenue and costs without corresponding profit. Business managed on a “fee” basis to focus on margin expansion in the base business
$142 $197 $226
$269 $324 $359
$407 $454
$126
$140 $136
$143
$153 $171
$193
$237
$170
$208
$266
$304
$285
$320
$348
$379
2007 2008 2009 2010 2011 2012 2013 2014
$438$545
$627$716 $762
$948$850
$1,070
2014 JLL Client wins
Wins
61Wins
58Expansions
53Renewals
22Large corporations Middle Market
Selective pursuit of profitable business
Long-term contracts driving annuity revenue
Scalable global position leveraging local market execution
Win rate30+
Drives multi-xrevenue ~60%
*
Competitive advantages($ in millions)JLL Property & Facilities Management fee revenue
Asia Pacific EMEA Americas
7
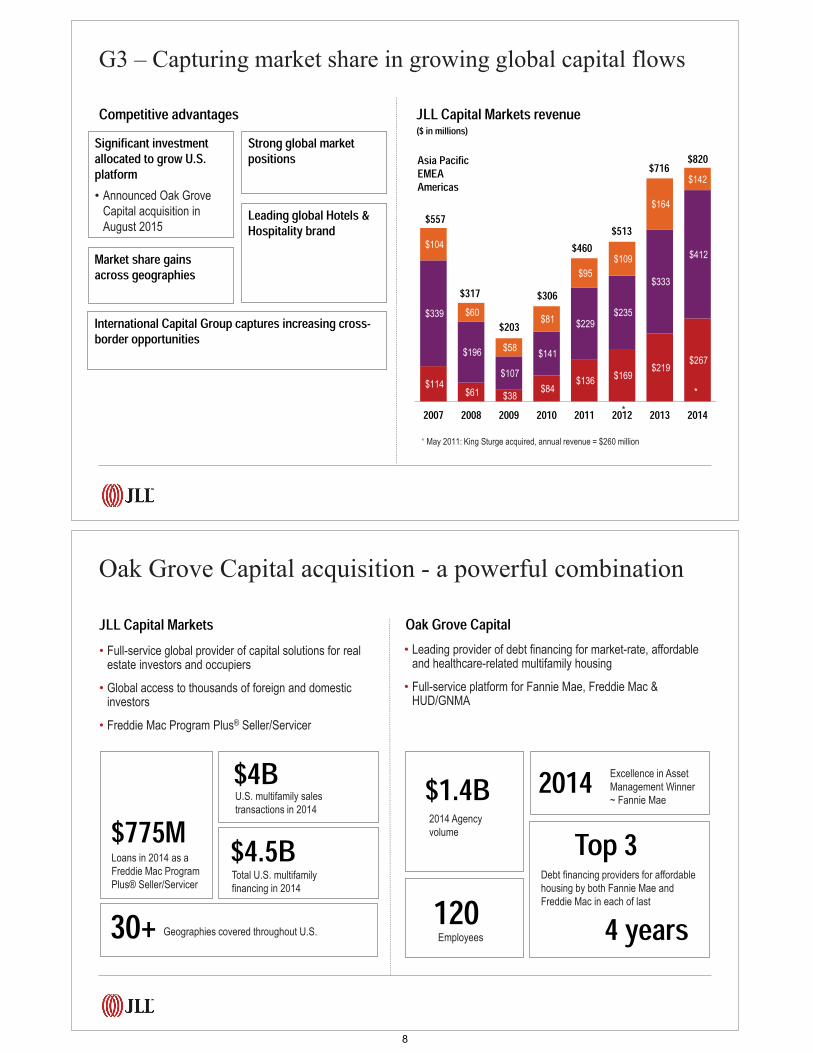
* May 2011: King Sturge acquired, annual revenue = $260 million
$114 $61 $38
$84 $136
$169 $219
$267
$339
$196
$107
$141
$229 $235
$333
$412 $104
$60
$58
$81
$95
$109
$164
$142
2007 2008 2009 2010 2011 2012 2013 2014
$557
$317
$203
$306
$460
*
$716
$513
*
$820
Market share gains across geographies
Strong global market positions
Significant investment allocated to grow U.S. platform• Announced Oak Grove
Capital acquisition in August 2015
Leading global Hotels & Hospitality brand
International Capital Group captures increasing cross-border opportunities
($ in millions)Competitive advantages JLL Capital Markets revenue
Asia Pacific EMEA Americas
G3 – Capturing market share in growing global capital flows
Oak Grove Capital• Leading provider of debt financing for market-rate, affordable
and healthcare-related multifamily housing
• Full-service platform for Fannie Mae, Freddie Mac & HUD/GNMA
• Full-service global provider of capital solutions for real estate investors and occupiers
• Global access to thousands of foreign and domestic investors
• Freddie Mac Program Plus® Seller/Servicer
$775MLoans in 2014 as a Freddie Mac Program Plus® Seller/Servicer
$4.5BTotal U.S. multifamily financing in 2014
$4BU.S. multifamily salestransactions in 2014
30+ Geographies covered throughout U.S. 4 years
$1.4B2014 Agencyvolume Top 3
Debt financing providers for affordable housing by both Fannie Mae and Freddie Mac in each of last 120
Employees
2014 Excellence in Asset Management Winner~ Fannie Mae
JLL Capital Markets
Oak Grove Capital acquisition - a powerful combination
8
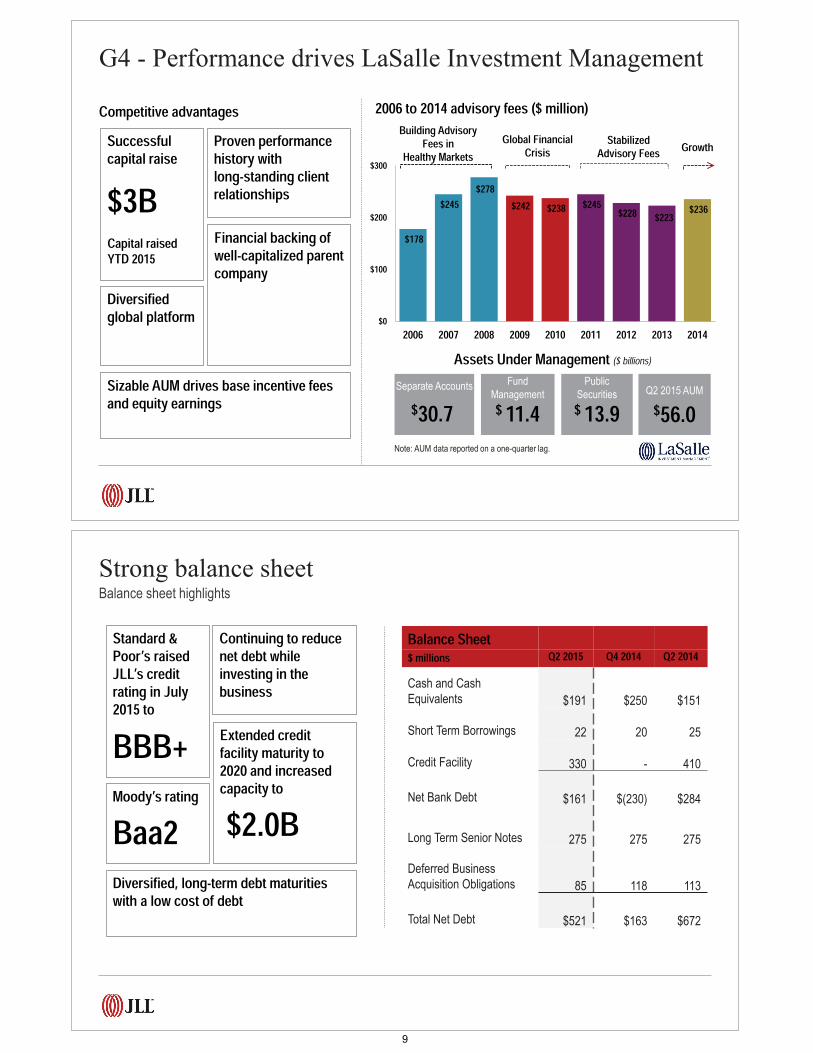
Assets Under Management ($ billions)
Note: AUM data reported on a one-quarter lag.
Q2 2015 AUM
$56.0Separate Accounts
$30.7Fund
Management
$ 11.4Public
Securities
$ 13.9
$178
$245 $278
$242 $238 $245 $228 $223 $236
$0
$100
$200
$300
2006 2007 2008 2009 2010 2011 2012 2013 2014
Building Advisory Fees in
Healthy MarketsGlobal Financial
CrisisStabilized
Advisory Fees Growth
G4 - Performance drives LaSalle Investment Management
Successful capital raise
Proven performance history with long-standing client relationships
Financial backing of well-capitalized parent company
Diversified global platform
Sizable AUM drives base incentive fees and equity earnings
$3BCapital raised YTD 2015
Competitive advantages 2006 to 2014 advisory fees ($ million)
Balance sheet highlights
Balance Sheet$ millions Q2 2015 Q4 2014 Q2 2014Cash and Cash Equivalents $191 $250 $151
Short Term Borrowings 22 20 25
Credit Facility 330 - 410
Net Bank Debt $161 $(230) $284
Long Term Senior Notes 275 275 275
Deferred Business Acquisition Obligations 85 118 113
Total Net Debt $521 $163 $672
Strong balance sheet
Standard & Poor’s raised JLL’s credit rating in July 2015 to
Continuing to reduce net debt while investing in the business
Extended credit facility maturity to 2020 and increased capacity to Moody’s rating
Diversified, long-term debt maturities with a low cost of debt
BBB+$2.0BBaa2
9
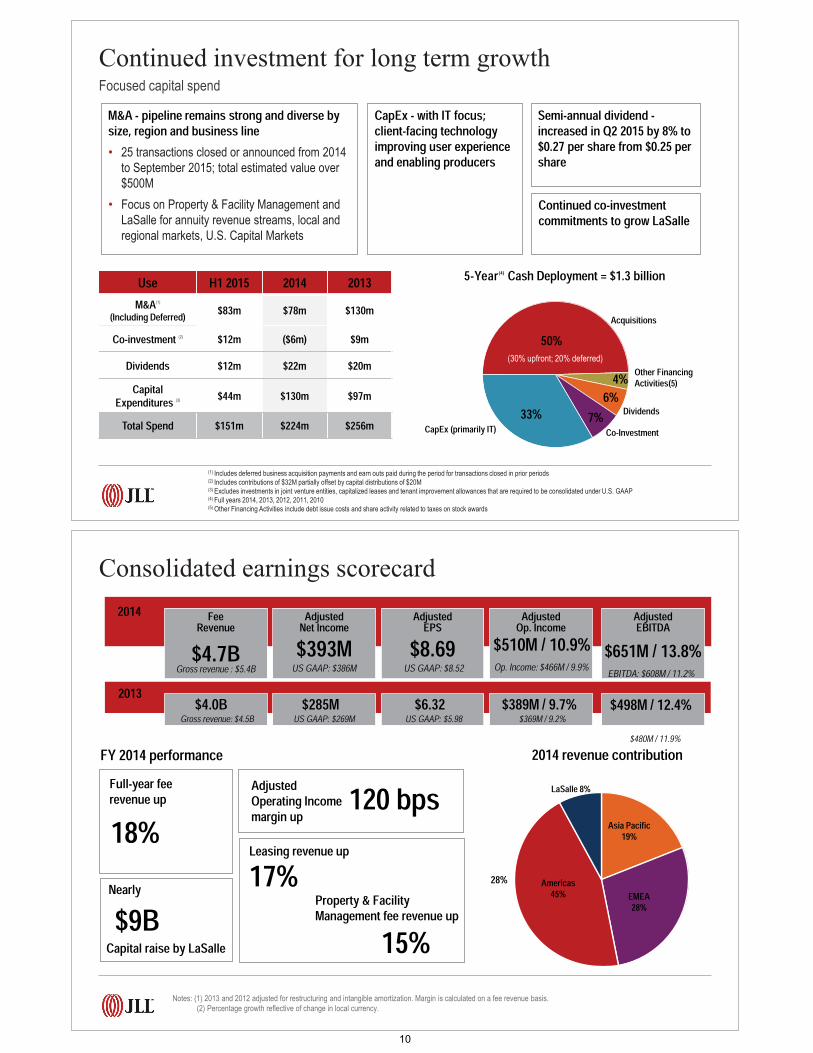
(1) Includes deferred business acquisition payments and earn outs paid during the period for transactions closed in prior periods(2) Includes contributions of $32M partially offset by capital distributions of $20M(3) Excludes investments in joint venture entities, capitalized leases and tenant improvement allowances that are required to be consolidated under U.S. GAAP(4) Full years 2014, 2013, 2012, 2011, 2010 (5) Other Financing Activities include debt issue costs and share activity related to taxes on stock awards
Continued investment for long term growth
Use H1 2015 2014 2013M&A(1)
(Including Deferred) $83m $78m $130mCo-investment (2) $12m ($6m) $9m
Dividends $12m $22m $20mCapital
Expenditures (3) $44m $130m $97mTotal Spend $151m $224m $256m
5-Year (4) Cash Deployment = $1.3 billion
50%
4%6%
7%33%
Acquisitions
Co-Investment
Other Financing Activities(5)
DividendsCapEx (primarily IT)
(30% upfront; 20% deferred)
Focused capital spend
CapEx - with IT focus; client-facing technology improving user experience and enabling producers
M&A - pipeline remains strong and diverse by size, region and business line• 25 transactions closed or announced from 2014
to September 2015; total estimated value over $500M
• Focus on Property & Facility Management and LaSalle for annuity revenue streams, local and regional markets, U.S. Capital Markets
Semi-annual dividend -increased in Q2 2015 by 8% to $0.27 per share from $0.25 per share
Continued co-investment commitments to grow LaSalle
2013 $285M $6.32 $389M / 9.7%$4.0BUS GAAP: $269M US GAAP: $5.98 $369M / 9.2%Gross revenue: $4.5B
Notes: (1) 2013 and 2012 adjusted for restructuring and intangible amortization. Margin is calculated on a fee revenue basis. (2) Percentage growth reflective of change in local currency.
2014 FeeRevenue$4.7B
AdjustedNet Income$393M
AdjustedEPS$8.69
Adjusted Op. Income$510M / 10.9%
Adjusted EBITDA
Gross revenue : $5.4B Op. Income: $466M / 9.9%US GAAP: $8.52US GAAP: $386M$651M / 13.8%EBITDA: $608M / 11.2%
$498M / 12.4%$480M / 11.9%
Consolidated earnings scorecard
28%
18%Full-year fee revenue up
$9B
120 bps
Nearly
Capital raise by LaSalle
Adjusted Operating Income margin upLeasing revenue up17%
Property & Facility Management fee revenue up
15%Americas
45% EMEA28%
Asia Pacific19%
LaSalle 8%
FY 2014 performance 2014 revenue contribution
10
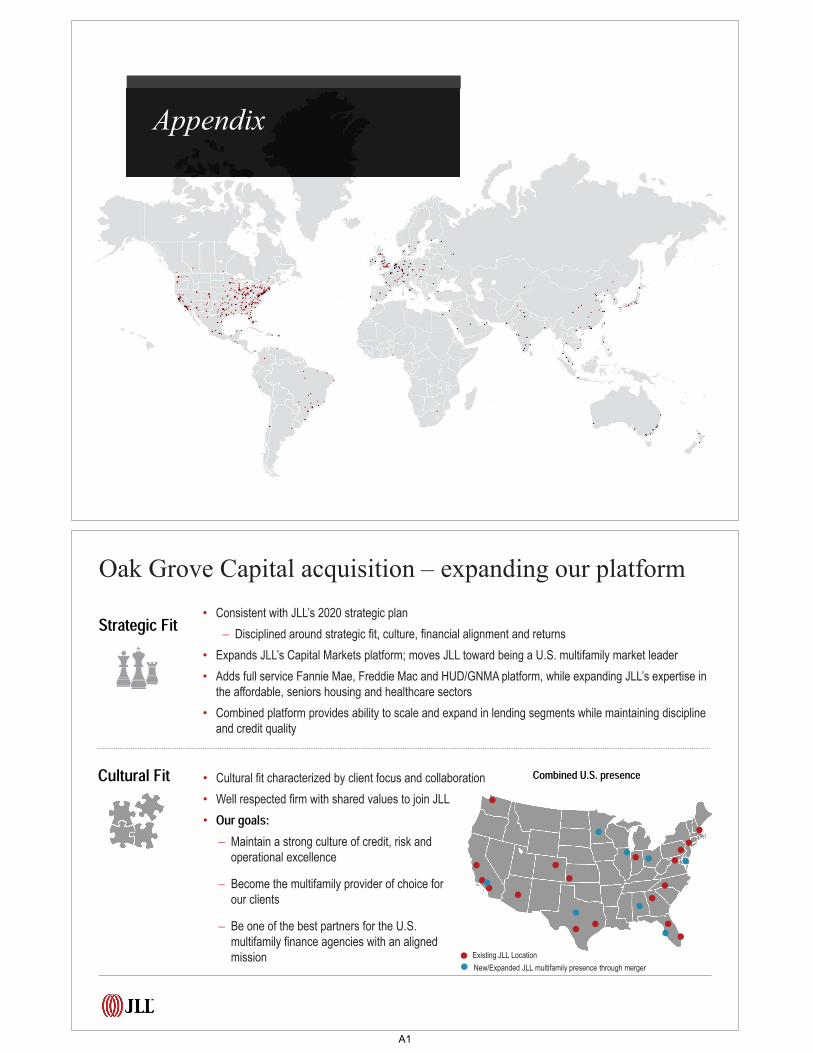
Appendix
Strategic Fit • Consistent with JLL’s 2020 strategic plan
Disciplined around strategic fit, culture, financial alignment and returns
• Expands JLL’s Capital Markets platform; moves JLL toward being a U.S. multifamily market leader
• Adds full service Fannie Mae, Freddie Mac and HUD/GNMA platform, while expanding JLL’s expertise in the affordable, seniors housing and healthcare sectors
• Combined platform provides ability to scale and expand in lending segments while maintaining discipline and credit quality
• Cultural fit characterized by client focus and collaboration
• Well respected firm with shared values to join JLL
Combined U.S. presence
• Our goals: Maintain a strong culture of credit, risk and operational excellence
Become the multifamily provider of choice for our clients
Be one of the best partners for the U.S. multifamily finance agencies with an aligned mission Existing JLL Location
New/Expanded JLL multifamily presence through merger
Cultural Fit
Oak Grove Capital acquisition – expanding our platform
A1
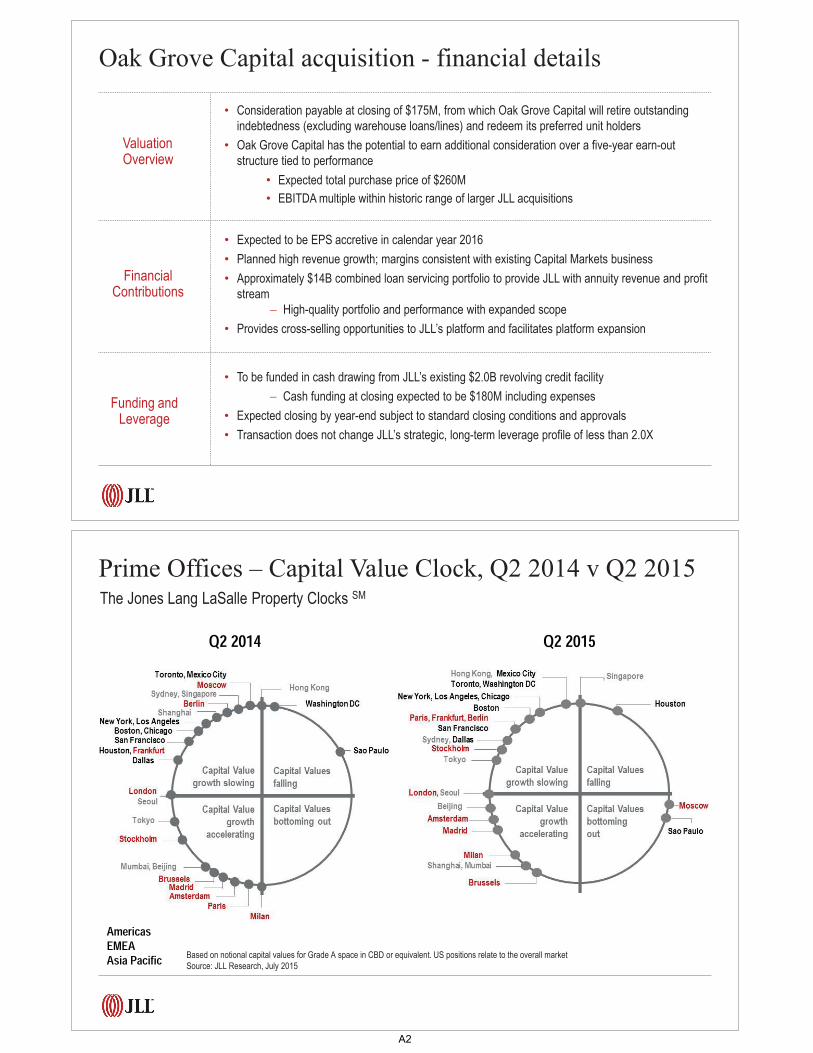
Oak Grove Capital acquisition - financial details
Valuation Overview
• Consideration payable at closing of $175M, from which Oak Grove Capital will retire outstanding indebtedness (excluding warehouse loans/lines) and redeem its preferred unit holders
• Oak Grove Capital has the potential to earn additional consideration over a five-year earn-out structure tied to performance
• Expected total purchase price of $260M
• EBITDA multiple within historic range of larger JLL acquisitions
Financial Contributions
• Expected to be EPS accretive in calendar year 2016
• Planned high revenue growth; margins consistent with existing Capital Markets business
• Approximately $14B combined loan servicing portfolio to provide JLL with annuity revenue and profit stream
High-quality portfolio and performance with expanded scope
• Provides cross-selling opportunities to JLL’s platform and facilitates platform expansion
Funding and Leverage
• To be funded in cash drawing from JLL’s existing $2.0B revolving credit facility
Cash funding at closing expected to be $180M including expenses
• Expected closing by year-end subject to standard closing conditions and approvals
• Transaction does not change JLL’s strategic, long-term leverage profile of less than 2.0X
Q2 2014 Q2 2015
Prime Offices – Capital Value Clock, Q2 2014 v Q2 2015
Based on notional capital values for Grade A space in CBD or equivalent. US positions relate to the overall market Source: JLL Research, July 2015
AmericasEMEAAsia Pacific
The Jones Lang LaSalle Property Clocks SM
A2
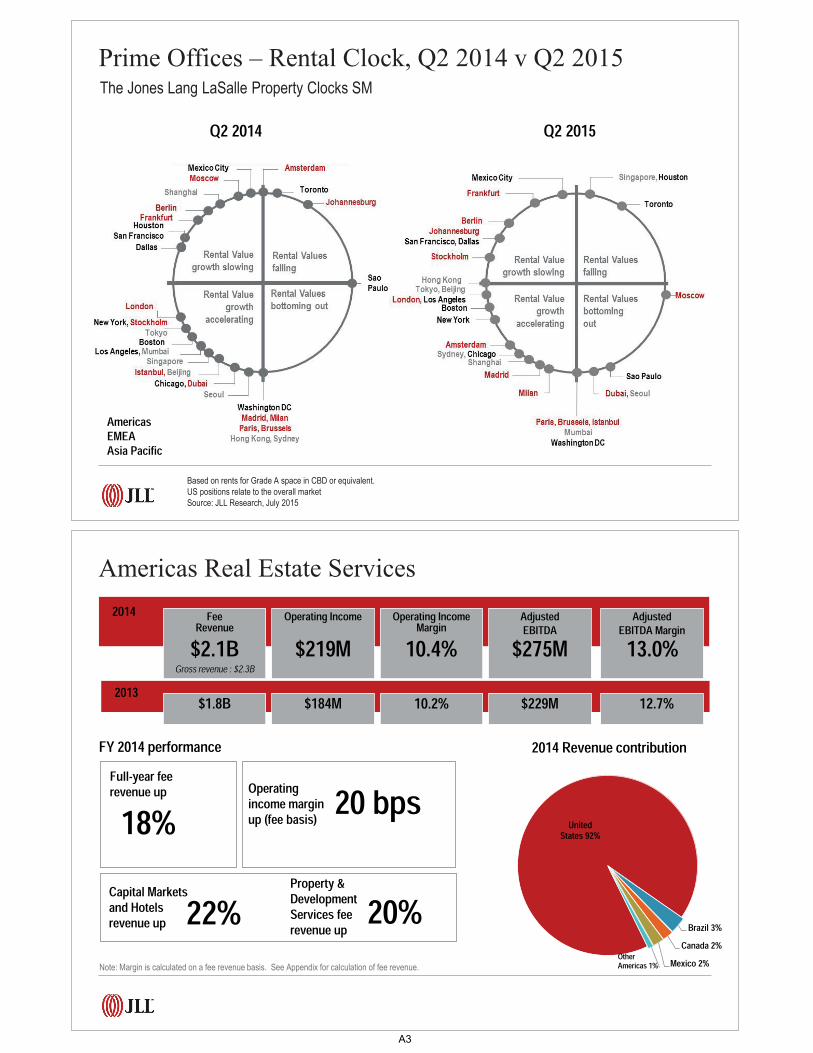
Based on rents for Grade A space in CBD or equivalent. US positions relate to the overall marketSource: JLL Research, July 2015
AmericasEMEAAsia Pacific
Prime Offices – Rental Clock, Q2 2014 v Q2 2015The Jones Lang LaSalle Property Clocks SM
Q2 2014 Q2 2015
2014 FeeRevenue Operating Income
$219MOperating Income Margin
10.4%AdjustedEBITDA$275M
AdjustedEBITDA Margin13.0%
Gross revenue : $2.3B 2013 $184M 10.2% $229M 12.7%$1.8B
$2.1B
2014 Revenue contribution
Note: Margin is calculated on a fee revenue basis. See Appendix for calculation of fee revenue.
United States 92%
Brazil 3%Canada 2%
Mexico 2%Other Americas 1%
18%Full-year fee revenue up
22%
20 bpsOperating income margin up (fee basis)
Capital Markets and Hotels revenue up
Property & Development Services fee revenue up 20%
FY 2014 performance
Americas Real Estate Services
A3
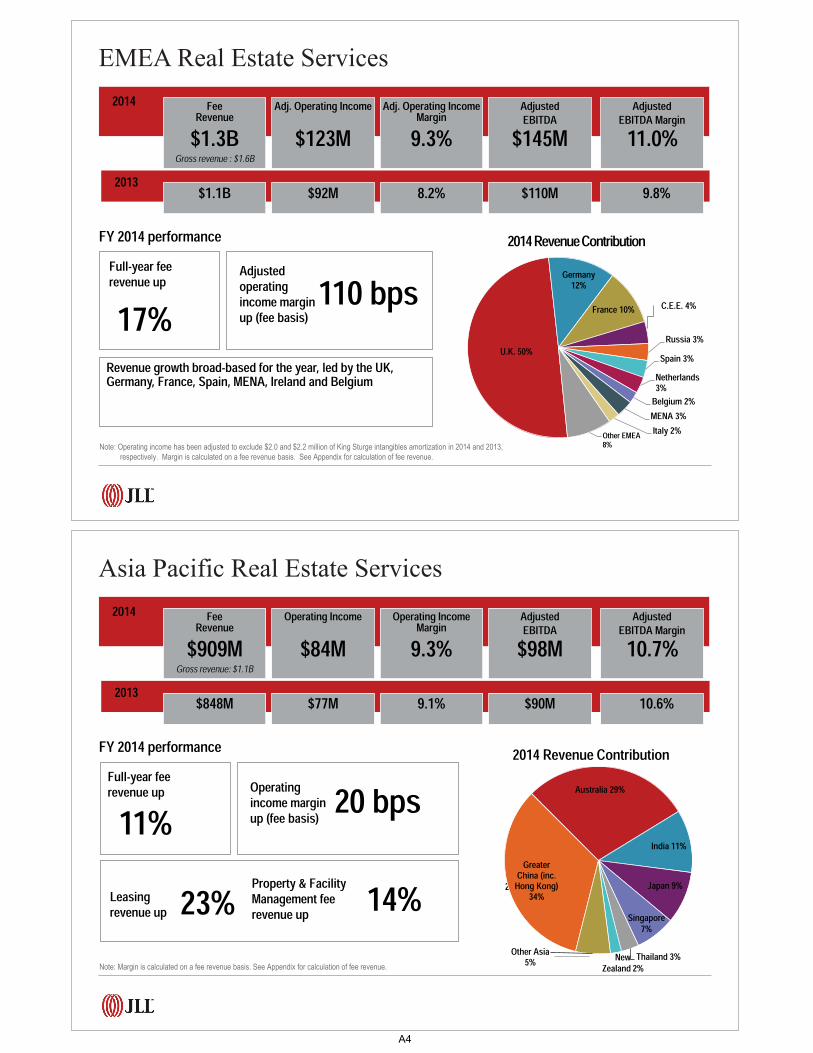
Note: Operating income has been adjusted to exclude $2.0 and $2.2 million of King Sturge intangibles amortization in 2014 and 2013, respectively. Margin is calculated on a fee revenue basis. See Appendix for calculation of fee revenue.
Germany 12%
France 10%
Russia 3%Spain 3%
Netherlands 3%
Belgium 2%MENA 3%Italy 2%Other EMEA
8%
U.K. 50%
C.E.E. 4%
Revenue growth broad-based for the year, led by the UK, Germany, France, Spain, MENA, Ireland and Belgium
17%Full-year fee revenue up 110 bpsAdjusted
operating income margin up (fee basis)
2014 Revenue ContributionFY 2014 performance
2014 FeeRevenue Adj. Operating Income
$123MAdj. Operating Income Margin
9.3%AdjustedEBITDA$145M
AdjustedEBITDA Margin11.0%
Gross revenue : $1.6B 2013 $92M 8.2% $110M 9.8%$1.1B
$1.3B
EMEA Real Estate Services
Note: Margin is calculated on a fee revenue basis. See Appendix for calculation of fee revenue.
34%
29%
11%Greater
China (inc. Hong Kong)
34%
Australia 29%
India 11%
Japan 9%
Thailand 3%Other Asia 5%
11%Full-year fee revenue up
23%
20 bpsOperating income margin up (fee basis)
Leasing revenue up
Property & Facility Management fee revenue up 14%
2014 Revenue ContributionFY 2014 performance
NewZealand 2%
2014 FeeRevenue Operating Income
$84MOperating Income Margin
9.3%AdjustedEBITDA$98M
AdjustedEBITDA Margin10.7%
Gross revenue: $1.1B 2013 $77M 9.1% $90M 10.6%$848M
$909M
Asia Pacific Real Estate Services
Singapore7%
A4
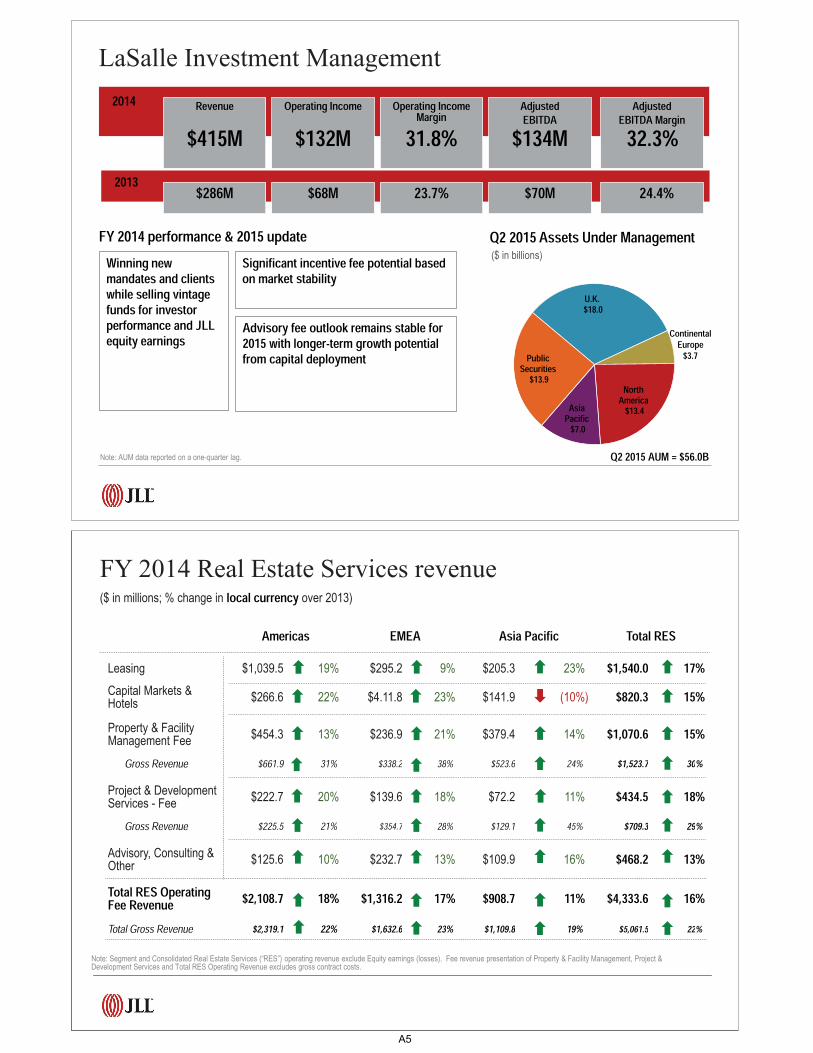
Q2 2015 Assets Under Management($ in billions)
Note: AUM data reported on a one-quarter lag. Q2 2015 AUM = $56.0B
U.K.$18.0
North America
$13.4 Asia Pacific
$7.0
Public Securities
$13.9
Advisory fee outlook remains stable for 2015 with longer-term growth potential from capital deployment
Winning new mandates and clients while selling vintage funds for investor performance and JLL equity earnings
Significant incentive fee potential based on market stability
FY 2014 performance & 2015 update
2014 Revenue Operating Income
$132MOperating Income Margin
31.8%AdjustedEBITDA$134M
AdjustedEBITDA Margin32.3%
2013 $68M 23.7% $70M 24.4%$286M
$415M
LaSalle Investment Management
Continental Europe
$3.7
Note: Segment and Consolidated Real Estate Services (“RES”) operating revenue exclude Equity earnings (losses). Fee revenue presentation of Property & Facility Management, Project & Development Services and Total RES Operating Revenue excludes gross contract costs.
FY 2014 Real Estate Services revenue ($ in millions; % change in local currency over 2013)
Americas EMEA Asia Pacific Total RESLeasing $1,039.5 19% $295.2 9% $205.3 23% $1,540.0 17%Capital Markets & Hotels $266.6 22% $4.11.8 23% $141.9 (10%) $820.3 15%Property & FacilityManagement Fee $454.3 13% $236.9 21% $379.4 14% $1,070.6 15%
Gross Revenue $661.9 31% $338.2 38% $523.6 24% $1,523.7 30%
Project & DevelopmentServices - Fee $222.7 20% $139.6 18% $72.2 11% $434.5 18%
Gross Revenue $225.5 21% $354.7 28% $129.1 45% $709.3 29%
Advisory, Consulting &Other $125.6 10% $232.7 13% $109.9 16% $468.2 13%Total RES OperatingFee Revenue $2,108.7 18% $1,316.2 17% $908.7 11% $4,333.6 16%Total Gross Revenue $2,319.1 22% $1,632.6 23% $1,109.8 19% $5,061.5 22%
A5

Note: Equity earnings of $27.1M and $38.5M in Q2 2015 and YTD 2015, respectively, are included in segment results, however, excluded from Consolidated totals. Year-over-year increases shown fee-based have been calculated using fee revenue, which excludes gross contract costs.
Consolidated Fee - $1,182Gross - $1,374
LaSalle$105
EMEAFee - $327
Gross - $418
Q2 2015 and YTD performance
AmericasFee - $545
Gross - $598
Asia PacFee - $231
Gross - $280 Consolidated Fee - $2,211Gross - $2,577
LaSalle$203
EMEAFee - $581
Gross - $743
YTD 2015
AmericasFee - $1,047
Gross - $1,153
Asia PacFee - $419
Gross - $517
Q2 2015 YTD 2015YOY % Growth, Fee Revenue basis
LC USD Segment LC USD
12% 10% Americas 18% 16%
22% 6% EMEA 23% 7%
18% 8% Asia Pacific 17% 8%
38% 29% LaSalle 41% 32%
17% 9% Consolidated 20% 13%16% 8% Consolidated Gross Revenue 20% 11%
Q2 2015
Revenue ($ in millions)
Refer to page 16 for Reconciliation of GAAP Net Income to Adjusted EBITDA for the three and six months ended June 30, 2015, for details relative to these Adjusted EBITDA calculations. Segment Adjusted EBITDA is calculated by adding the segment’s depreciation and amortization to its reported operating income, which excludes restructuring and acquisition charges. Consolidated Adjusted EBITDA is the sum of the Adjusted EBITDA of the four segments.
Q2 Adj. EBITDA Margin, Fee Revenue YTD2015 2014 Segment 2015 2014
11.3% 12.2% Americas 10.7% 10.1%
11.7% 9.8% EMEA 7.0% 5.7%
8.6% 8.9% Asia Pacific 6.6% 6.0%
36.0% 28.0% LaSalle 32.7% 25.7%
13.3% 12.2% Consolidated 11.2% 9.4%
Q2 2015 and YTD performance
Consolidated $157
Q2 2015Asia Pac
$20EMEA$38
LaSalle$38
Consolidated $247
YTD 2015
Americas$61
Asia Pac$28
LaSalle$66
Americas$112
EMEA$41
Adjusted EBITDA ($ in millions)
A6

Note: Segment and Consolidated Real Estate Services (“RES”) operating revenue exclude Equity earnings (losses). Fee revenue presentation of Property & Facility Management, Project & Development Services and Total RES Operating Revenue excludes gross contract costs.
Americas EMEA Asia Pacific Total RESLeasing $263.7 6% $65.1 12% $50.2 11% $379.0 8%Capital Markets & Hotels $76.5 30% $113.2 38% $33.1 25% $222.8 33%Property & FacilityManagement Fee $111.9 8% $50.9 (3%) $95.8 13% $258.6 7%
Gross Revenue $163.4 9% $69.7 (10%) $130.0 9% $363.1 4%
Project & DevelopmentServices - Fee $60.4 22% $39.4 36% $21.6 38% $121.4 29%
Gross Revenue $61.8 23% $110.7 44% $36.1 20% $208.6 34%
Advisory, Consulting &Other $32.1 36% $57.6 24% $30.2 27% $119.9 27%Total RES OperatingFee Revenue $544.6 11% $326.2 21% $230.9 18% $1,101.7 16%Total Gross Revenue $597.5 12% $416.3 23% $279.6 14% $1,293.4 16%
Q2 2015 Real Estate Services revenue ($ in millions; % change in local currency over Q2 2014)
• Reimbursable vendor, subcontractor and out-of-pocket costs reported as revenue and expense in JLL financial statements
have been increasing steadily
• Gross accounting requirements increase revenue and costs without corresponding profit
• Business managed on a fee revenue basis to focus on margin expansion in the base business
Revenue
Gross contract costs
Fee revenueOperating expenses
Gross contract costs
Fee-based operating expensesOperating incomeRestructuring and acquisition charges
Adjusted operating income
Adjusted operating income marginNote: Consolidated revenue and fee revenue exclude equity earnings (losses). Restructuring and acquisition charges are excluded from adjusted operating income margin.
2015 2014 2015 2014
Three months ended June 30 Six months ended June 30
$ 1,373.5 $ 1,277.2 $ 2,577.0 $ 2,314.6
191.7 191.2 366.1 350.9
$ 1,181.8 $ 1,086.0 $ 2,210.9 $ 1,963.7
$ 1,270.5 $ 1,185.5 $ 2,421.4 $ 2,238.2
191.7 191.2 366.1 350.9
$ 1,078.8 $ 994.3 $ 2,055.3 $ 1,887.3
$ 103.0 $ 91.7 $ 155.6 $ 76.41.8 5.5 2.6 41.4
$ 104.8 $ 97.2 $ 158.2 $ 117.8
8.9% 9.0% 7.2% 6.0%
Fee Revenue/Expense Reconciliation ($ in Millions)
A7

GAAP net income attributable to common shareholders
Shares (in 000s)
GAAP diluted earnings per share
2015 2014 2015 2014
Three months ended June 30 Six months ended June 30
$ 90.1 $ 71.8 $ 132.0 $ 87.7
45,435 45,278 45,393 45,220
$ 1.98 $ 1.58 $ 2.91 $ 1.94
$ 90.1 $ 71.8 $ 132.0 $ 87.7
1.4 4.1 2.0 5.2
$ 91.5 $ 75.9 $ 134.0 $ 92.945,435 45,278 45,393 45,220
$ 2.01 $ 1.68 $ 2.95 $ 2.05
GAAP net income attributable to common shareholders
Restructuring and acquisition charges, net
Shares (in 000s)
Adjusted diluted earnings per share
Adjusted net income
Reconciliation of GAAP net income to adjusted net
income and earnings per share ($ in Millions)
GAAP net income
Interest expense, net of interest income
2015 2014 2015 2014
Three months ended June 30 Six months ended June 30
$ 91.4 $ 72.4 $ 134.7 $ 88.5
7.6 7.6 13.6 14.3
31.1 24.1 45.9 (5.0)
25.5 22.8 50.4 45.2
$ 155.6 $ 126.9 $ 244.6 $ 143.01.8 5.5 2.6 41.4
$ 157.4 $ 132.4 $ 247.2 $ 184.4
Provision for (benefit from) income taxes
Depreciation and amortization
EBITDARestructuring and acquisition charges
Adjusted EBITDA
Reconciliation of GAAP net income to adjusted EBITDA($ in Millions)
A8

Statements in this presentation regarding, among other things, future financial results and performance, achievements, plans
and objectives and dividend payments may be considered forward-looking statements within the meaning of the Private
Securities Litigation Reform Act of 1995. Such statements involve known and unknown risks, uncertainties and other factors
which may cause actual results, performance, achievements, plans and objectives of JLL to be materially different from those
expressed or implied by such forward-looking statements. For additional information concerning risks, uncertainties and other
factors that could cause actual results to differ materially from those anticipated in forward-looking statements, and risks to
JLL’s business in general, please refer to those factors discussed under “Business,” “Risk Factors,” “Management’s
Discussion and Analysis of Financial Condition and Results of Operations,” “Quantitative and Qualitative Disclosures about
Market Risk,” and elsewhere in JLL’s Annual Report on Form 10-K for the year ended December 31, 2014, in the Quarterly
Reports on Form 10-Q for the quarters ended March 31, 2015 and June 30, 2015, and in other reports filed with the Securities
and Exchange Commission. There can be no assurance that future dividends will be declared since the actual declaration of
future dividends, and the establishment of record and payment dates, remains subject to final determination by the Company’s
Board of Directors. Any forward-looking statements speak only as of the date of this presentation, and except to the extent
required by applicable securities laws, JLL expressly disclaims any obligation or undertaking to publicly update or revise any
forward-looking statements contained herein to reflect any change in JLL’s expectations or results, or any change in events.
Cautionary note regarding forward-looking statements
© 2015 Jones Lang LaSalle IP, Inc. All rights reserved. No part of this publication may be reproduced by any means, whether graphically, electronically, mechanically
or otherwise howsoever, including without limitation photocopying and recording on magnetic tape, or included in any information store and/or retrieval system without
prior written permission of Jones Lang LaSalle IP, Inc.
A9