working papers series research department wp 99-17/media/publications/working-papers/... · working...
TRANSCRIPT

Working Papers Series
Who's Minding the Store? Motivating andMonitoring Hired Managers at Small, CloselyHeld Firms: The Case of Commercial Banks
Robert DeYoung, Kenneth Spong, and RichardJ. Sullivan
Working Papers SeriesResearch Department
WP 99-17

Who's Minding the Store? Motivating and MonitoringHired Managers at Small, Closely Held Firms: The Case of Commercial Banks
Robert DeYoung *Federal Reserve Bank of Chicago
Chicago, IL 60604
Kenneth SpongFederal Reserve Bank of Kansas City
Kansas City, MO 64198
Richard J. SullivanFederal Reserve Bank of Kansas City
Kansas City, MO 64198
December 1999
Abstract: We test whether the gains from hiring an outside manager exceed the principal-agent costs of owner-manager separation at 266 small, closely held U.S. commercial banks. Our results suggest that hiring an outsidemanager can improve a bank's profit efficiency, but that these gains depend on aligning the hired managers withowners via managerial shareholdings. We find that over-utilizing this control mechanism results in entrenchment,while under-utilization is costly in terms of foregone profits. This study provides a relatively unfettered test ofmitigating principal-agent costs, because these small banks cannot rely on market forces or blocks of outsideinvestors to monitor managers.
JEL codes: G34, G21.Key words: agency costs, commercial banks, corporate governance, profit efficiency, small business.
_________________________________________________________________________________The views expressed in this paper are those of the authors, and do not necessarily reflect the views of the Federal ReserveBank of Chicago, the Federal Reserve Bank of Kansas City, or the Federal Reserve System. The authors are indebted to theFederal Deposit Insurance Corporation and the state banking departments in the Tenth Federal Reserve District for their helpin collecting the data used in this paper. The authors also thank Mark Flannery, Dan Gropper, Benton Gup, Gerry Hanweck,Jan Howell, Bill Lang, Peter Nigro, Karin Roland, Jim Overdahl, Larry Wall, seminar participants at the University of Kansasand the Federal Reserve Bank of Chicago, and two anonymous referees for their helpful comments.
* Corresponding author: Robert DeYoung, Economic Research Department, Federal Reserve Bank of Chicago, 230 SouthLaSalle St., Chicago, IL 60604; phone 312-322-5396; fax: 312-322-2357; e-mail: [email protected].

Who's Minding the Store? Motivating and MonitoringHired Managers at Small, Closely Held Firms: The Case of Commercial Banks
December 1999
Abstract: We test whether the gains from hiring an outside manager exceed the principal-agent costs of owner-manager separation at 266 small, closely held U.S. commercial banks. Our results suggest that hiring an outsidemanager can improve a bank's profit efficiency, but that these gains depend on aligning the hired managers withowners via managerial shareholdings. We find that over-utilizing this control mechanism results in entrenchment,while under-utilization is costly in terms of foregone profits. This study provides a relatively unfettered test ofmitigating principal-agent costs, because these small banks cannot rely on market forces or blocks of outsideinvestors to monitor managers.
JEL codes: G34, G21.Key words: agency costs, commercial banks, corporate governance, profit efficiency, small business.
1
Introduction
The vast majority of U.S. businesses are relatively small, are not actively traded, and face little outside
monitoring. In the prototypical small and closely held business, the top manager is generally drawn from the
ranks of the firm's primary owners. But as time passes a small business can grow in size or scope, or it can
encounter challenging business conditions, that are beyond these owners' capabilities to manage effectively.
Alternately, as time passes the owner manager might wish to retire or turn her attention to other business
investments, and there may be no other insider or family member qualified to succeed her as manager. Under
these or other circumstances, the owners of a closely held firm may decide to relinquish day-to-day control to a
professional manager.
While hiring a manager from outside the ownership circle can solve a variety of problems for a closely
held business, it can also lead to costly principal-agent problems. Without the incentive to maximize the value
of the owners' investment, the hired manager may act to enhance her own utility by consuming excess perquisites
(expense preference), pursuing personal prestige and power (empire building), rejecting positive net present value
projects that have particularly bad outcomes in some state of nature (risk aversion), or simply expending low
amounts of effort (shirking). Thus, the owners must incur the costs of monitoring and motivating the hired
manager -- otherwise the expected financial gains from ceding their control over daily operations may never
materialize, or these gains may be expropriated by the hired manager.
Mitigating this principal-agent problem may be more difficult at small, closely held firms than at large,
widely held firms. At large corporations, individual shareholders typically have too little invested in the firm to
justify the expense of directly monitoring management, but they can vote their displeasure with management ex
post by selling their shares into a liquid market for corporate control. In addition, large corporations can rely on
a variety of external claimants and specialized agents (e.g., large institutional shareholders, bond rating agencies)
to monitor managers, and can use internal control mechanisms such as stock and stock options to motivate
managers to act in a value maximizing way. Closely held firms have fewer tools at their disposal: there is no
active market for corporate control, outside claimants are few and small, and there is typically only a single
specialized agent (a bank lender) monitoring the firm from the outside. And while the primary owners' large,
illiquid equity investments give them an incentive to directly monitor the managers, direct monitoring may not
2
be particularly effective: in many of these firms, the primary owners have ceded managerial control precisely
because they no longer have the time, inclination, or ability to run the business themselves.
Thus, observing the performance of small business firms that hire professional outside managers may
provide an especially pure test of the classic principal-agent problem. In these small, closely held firms -- where
market discipline, institutional oversight, and direct monitoring are either unavailable or ineffective tools for
mitigating agency costs -- the owners are left to rely disproportionately on managerial shareholdings to control
the principal-agent problem. Ideally, awarding a partial ownership stake to a hired manager will align her
preferences with those of the primary owners and create an incentive for her to make value-maximizing decisions.
But over-utilization of this control mechanism can backfire if the hired manager compiles so large a stake that
she becomes "entrenched," i.e., difficult to remove and thus even more likely to take actions that reduce the value
of the firm to the other shareholders. At small, closely held firms the risk of entrenchment may be especially high
because, given the lack of complementary control mechanisms, a relatively large ownership share might be needed
to provide the hired manager with an adequate performance incentive.
In this paper we test two main hypotheses: Does ceding day-to-day control to a professional manager
enhance financial performance at small, closely held firms? Does the financial performance of small, closely held
firms that hire outside managers exhibit patterns of alignment and entrenchment that are related to the
shareholdings of that hired manager? We test these hypotheses for 266 predominantly small, state-chartered
commercial banks in the Tenth Federal Reserve District in 1994.
Focusing on banking firms has a number of advantages. First, bank regulatory agencies systematically
collect detailed information on the shareholder identities and managerial responsibilities that is not typically
available for small, closely held nonbanks. Second, small commercial banks exhibit a richer variety of
management-ownership arrangements than do large, publicly traded corporations -- for example, banks run by
hired managers with no ownership stake, banks run by hired managers with partial ownership stakes, and banks
run by owner managers with majority ownership stakes. This heterogeneity should help us separate empirically
the effect of financial performance of hiring a professional manager from the effect on financial performance of
awarding a partial ownership stake to that hired manager. Third, by focusing on firms in a single industry we
avoid inter-industry institutional differences that could cloud the relationships in which we are most interested.

3
Fourth, the vast majority of the over 8,000 commercial banks currently operating in the U.S. are small and
closely held, so our findings should be prescriptive well beyond our small sample of 266 banks. Fifth, recent
studies of large bank holding companies have found that internal control mechanisms are at least as effective as
market forces for disciplining management, and that owner-manager principal-agent problems at these firms are
minimal, perhaps because of the wide variety of control mechanisms to which these large corporations have
access.1 Small, closely held banks may provide a better environment for testing the effectiveness of managerial
shareholdings in controlling hired bank managers, because these firms have a limited array of alternative control
mechanisms at their disposal.
Section 1 reviews some of the relevant literature on ownership and control. Section 2 defines some
important terms, describes the testable hypotheses, and presents our general empirical framework. Section 3
describes our unique ownership and management data set, which we constructed from the confidential section
of bank examination reports. These reports provide us with detailed information on ownership structure that is
normally unavailable for nontraded firms. Section 4 presents the econometric model used to estimate an efficient
profit frontier for the population of Tenth District banks, which we use as a "best practices" benchmark to
measure the relative financial performance of our sample banks. To our knowledge, this is the first corporate
governance study to use profit efficiency as a performance benchmark.
We present the results of our investigation in Section 5, and discuss their implications in Section 6. Our
results suggest that ceding day-to-day control to a professional manager can enhance the financial performance
of small, closely held commercial banks, but that these performance gains may not materialize unless mechanisms
are put in place to monitor and/or motivate the hired managers. Profit efficiency was relatively low at banks run
by hired managers with little or no ownership stake; increased substantially and became significantly greater than
average as hired managers accumulated shareholdings; but eventually declined again as hired managers'
shareholdings mounted and managers presumably became entrenched. A large percentage of the hired-manager
banks in our sample badly under-utilized this control mechanism -- foregoing potential reductions in profit
inefficiency of nearly 30 percent -- but only a small percentage of the banks over-utilized managerial
shareholdings to the point of entrenchment. In sharp contrast to the results for hired-manager banks, we find no
statistical relationship between managerial shareholdings and profit efficiency at banks run by their primary

4
owners. Finally, we find no evidence that outside shareholders or non-managerial insiders can effectively monitor
the performance of managers at these banks, a result that underscores the importance of managerial shareholdings
as a control mechanism at small, closely held firms.
1. Literature Review
Research that explores the interplay between owners, managers, and firm value has a long history. Berle
and Means (1932) were the first to emphasize that control is separated from ownership in the modern corporation.
This separation gives rise to the well-known principal-agent problem in which the manager seeks to maximize
her own utility rather than the value of the firm. As defined by Jensen and Meckling (1976), reductions in the
value of the firm caused by such behavior, as well as the expenses necessary to prevent them, are called agency
costs. The potential for agency costs creates a need for owners to monitor, and perhaps discipline, the managers
that they hire. Fama (1980) argued that the capital market performs this function for actively traded firms by
sending signals about manager performance to the labor market, where managers know they will be judged in the
future. Alchian and Demsetz (1972) pointed out that monitoring is a costly activity, so minority stockholders
who receive a small portion of the benefits produced by monitoring will free ride on the efforts of majority
owners. As the firm grows and the ownership structure becomes more fragmented, free riding becomes endemic
and managers go unmonitored.
One substitute for active monitoring is to give the managers an ownership stake in the firm, thereby
linking the managers' financial well-being to the value of the firm. Stulz (1988), however, demonstrated that
giving managers too large a share of the firm can reduce firm value. In Stulz's model, the value of the firm at first
increases as the manager's ownership stake grows. But as this ownership stake continues to increase, the manager
eventually becomes entrenched, making takeover more difficult and reducing firm value. In this theoretical model,
the decline in value stops once management owns 50% of the firm, at which point the manager becomes the
majority owner and additional insider shareholdings have no effect on firm value.
Two empirical investigations of large corporations produce results that are consistent with the
predictions of Stulz's model.2 Morck, Shleifer, and Vishny (1988) used piecewise linear regressions to test the
relationship between insider shareholdings and firm value at 371 large non-financial firms in 1980. Using
Tobin's q as a proxy for firm value, they concluded that firm value increases between 0% and 5% insider

5
ownership as manager preferences become aligned with those of owners; decreases between 5% and 25% as
entrenched managers pursue their own objectives at the expense of other owners; but then increases again beyond
25% as managers become the primary owners of the firm. Gorton and Rosen (1995) developed a model in which
the association between bank manager shareholdings and the riskiness of bank loan portfolios is conditional on
economic conditions. In this model, "good" lending opportunities diminish during an economic downturn, and
the typical bank manager attempts to sustain loan growth by writing increasingly risky loans. On average, non-
performing loans will increase and bank managers will lose their jobs, but managers with large shareholdings will
be difficult to fire and/or discipline and will continue to write risky loans. The authors tested this hypothesis
using data from 458 large banking companies between 1984 and 1990, a period during which good loan
opportunities were often in short supply for banks. They found that relatively risky commercial real estate loans
decreased as insider ownership grew from 0% to 15% (and shareholdings presumably aligned the interests of
managers and owners); these loans increased as insider ownership grew from 15% to 27% (and managers
presumably became entrenched); and these loans gradually decreased as insider ownership grew beyond 27% (and
managers presumably became primary owners).
Stulz's proposition has not been broadly tested for small, closely held corporations, because insider
ownership data is not typically available for such firms. However, insider ownership data is usually collected at
regulated financial institutions, and a number of previous studies have used these data to examine the relationship
between ownership structure and financial institution performance. One set of studies found that the profitability
of financial institutions improves with concentrated ownership (less incentive to free-ride); with greater ownership
stake by outside investors (motivated monitors); and with larger insider shareholdings (alignment of owners' and
managers' interests).3 Another set of studies used these data to test for associations between insider shareholdings
and risk-taking at financial institutions, but found mixed results, perhaps because of the inherent difficulty of
defining and measuring risk.4 However, none of these studies focused specifically on small or untraded firms,
and none of these studies identified empirically the three distinct regions of insider ownership predicted by Stulz.
2. An overview of our experimental design
The conventional gauge of corporate performance is the price of a firm's equity shares. Unfortunately,
market-based performance measures are unavailable to us, because only a handful of the banks in our sample
6
issue stock that is actively traded. We measure financial performance by estimating the relative profit efficiency
EFF of the banks in our sample. Profit efficiency is an X-efficiency concept that expresses a bank's actual
earnings as a percentage of its potential best practices earnings. We explain this estimation procedure in detail
in Section 4 below. Kwan and Eisenbeis (1996) have shown that measures of X-efficiency are statistically
correlated to stock returns for banking firms.
Measuring the degree of insider ownership in banks is more straightforward. Insider ownership is the
percentage of the bank owned by officers, board members, and their immediate family members. Of these inside
shareholdings, we focus most closely on the percentage of total shares held by the bank's daily managing officer
(DMO) and her family. The DMO is the person responsible for the daily operations of the bank, and is typically
the bank's chief executive officer. Because many of the closely held banks in our sample are essentially family-
run businesses, we measure insider ownership by the variable DMOFAMSH, which equals the aggregate
shareholdings of the DMO and her immediate family.5 We describe the construction of DMOFAMSH in detail
in Section 3 below.
Given that banks in our sample tend to be small and closely held, it is not unusual for the DMO to be
either the bank's largest shareholder or a member of a group of owners that controls the largest proportion of the
bank's voting stock.6 If the DMO is a member of this controlling shareholder group we refer to her as an owner
manager, and if the DMO is not a member of this group we refer to her as a hired manager. Some hired DMOs
own only a trivial amount of qualifying shares in the bank (DMOFAMSH = 0), and hence their compensation is
not linked to the performance of the bank through either stock dividends or price appreciation.7 Other hired
DMOs hold nontrivial stakes in the bank (DMOFAMSH > 0), so their personal wealth is tied to the performance
of the bank. If her ownership share is large enough, the hired DMO may become an entrenched manager, i.e.,
difficult and/or expensive for the other owners to remove.
2.1 Testable hypotheses
The first of our two main hypotheses is: Does ceding day-to-day control to a professional manager
enhance financial performance at small, closely held firms? Most small and closely held business start out being
run by an owner manager. As the business grows or as market conditions change, running the business effectively
may exceed the owner manager’s capabilities, and the firm may decide to hire an outside professional manager

7
with the expertise or experience necessary to meet these challenges. Under these circumstances, and in the
absence of principal-agent problems that diminish the performance of the hired manager, we would expect
EFF at hired-manager banks on average to be at least as high, and perhaps higher, than EFF at owner-manager
banks. Owner-manager firms may also relinquish day-to-day control of the firm to an outside professional
manager because the owner manager wants to retire or turn her attentions to other business matters, but there are
no other insiders qualified to succeed her as manager. Under these second best circumstances, we would expect
EFF at hired-manager banks on average to be no higher, and perhaps lower, than EFF at owner-manager banks.
Thus, depending on which of these scenarios dominates the data, we may find that hired-manager banks are
either more, less, or equally efficient relative to owner-manager banks on average.
The second of our two main hypotheses is: Does the financial performance of small, closely held firms
that hire outside managers exhibit patterns of alignment and entrenchment that are related to the shareholdings
of that hired manager? Testing this hypothesis requires a framework that relates the firm’s performance to a
variety of management, ownership, and corporate governance conditions. In the absence of effective monitoring,
finance theory suggests the following relationships between EFF and DMOFAMSH at banks that are run by hired
managers:
C If DMOFAMSH is zero, then the manager's interests are likely to diverge from those of the owners. This
is a principal-agent problem: because the benefits of the hired manager's efforts largely accrue to theowners of the firm, the manager may behave in a fashion (shirking, expense preference, empire building,or risk aversion) that does not maximize the value of the bank. Thus, EFF will be relatively low whenDMOFAMSH equals zero.
C If DMOFAMSH is small but greater than zero, then the interests of the hired manager are at least partiallylinked to the interests of the owners. To the extent that this ownership arrangement mitigates theprincipal-agent problem, the manager will exert greater effort toward maximizing the value of the firm. Thus, EFF should increase, at least initially, with increases in DMOFAMSH.
C If DMOFAMSH is large, then a hired manager may become an entrenched manager. The manager willbe able to engage in utility maximizing behavior with less fear of reprisal, and may feel less compelledto compromise with the other owners, leading to conflicts and inaction during crucial times for the bank.8
Thus, at some point EFF may decrease with increases in DMOFAMSH. Thus, we expect an inverted U-shape relationship between DMOFAMSH and EFF at hired-manager banks.
The relationship between EFF and DMOFAMSH is likely to be different at owner-manager banks. At
these banks, a marginal increase in the shareholdings of the owner manager is unlikely to materially affect the

8
firm's value. Unlike a hired manager, whose influence on the bank's agenda grows as she becomes entrenched,
an owner manager by definition already holds enough shares to control the bank's agenda. Furthermore, relative
to the typical hired manager, the owner manager's large ownership stake gives her a greater incentive to
maximize the value of the bank. Hence, although an owner manager may have an incentive to exploit minority
shareholders, this principal-agent problem is more likely to manifest itself as a wealth transfer (e.g., substituting
manager salaries for dividends) than as an action that reduces the value of the owner manager's large stake (e.g.,
shirking).
C If the DMO is the majority owner, or is a member of the majority ownership group, then her interestswill tend to be aligned with those of the general shareholders. Principal-agent problems will be lesssevere, or nonexistent, at these banks.
Thus, we expect no relationship between DMOFAMSH and EFF at owner-manager banks.
In situations where the potential for agency costs is high (i.e., at hired-manager banks), the presence
of a motivated monitor can enhance bank performance. Because monitoring is costly, it is more likely to occur
at banks with large outside shareholders for whom the benefits of monitoring the DMO's activities are substantial.
McConnell and Servaes (1990) found that increases in institutional shareholdings had a positive impact on firm
value at large non-financial firms, and some studies of outside shareholdings at financial institutions have found
similar results.9 Non-manager insiders can also monitor the DMO by retaining some policy making authority,
rather than granting unilateral authority to the hired DMO.
C Agency costs are likely to be smaller when outside shareholders own a large enough stake to overcomefree-rider incentives, and when inside shareholders retain some decision-making authority.
Thus, we expect a positive relationship between EFF and the ownership share and decision-making authority held
by the non-DMO stakeholders, especially at hired-manager banks where (as discussed above) principal-agent
problems are more likely to occur.
2.2 General empirical framework
We employ the following general framework to test for the expected relationships among EFF and
DMOFAMSH described above:

9
(1) ntrol)monitor/co status,manager ,f(DMOFAMSH = EFF
where manager status distinguishes hired-manager banks and owner-manager banks, and monitor/control
refers to conditions determining the effectiveness of monitoring by non-DMO insiders and by outside
shareholders. We use a variety of specifications to estimate this general model. Regardless of the specification
employed, we make the explicit assumption that the corporate governance structure characterized by the right-
hand-side variables is exogenous and stable, and that this structure determines bank performance measured by
EFF. As explained below, we design our sampling procedures to be consistent with this assumption.
3. Ownership and Management Data
Bank examination reports contain a variety of detailed information about the bank's managers, directors,
and major shareholders, including: the responsibilities of bank officers; the tenure and compensation of officers
and directors; the net worth of directors; the family relationships among bank stockholders and managers; and
various other financial and demographic data. This information is contained in a confidential portion of the
examination report, which is used for supervisory purposes only. We gained access to a portion of this
information, and used it to measure DMOFAMSH, manager status, and monitor/control. Extracting this
information from the reports was labor intensive, so we limited our investigation to a random sample of 266 state-
chartered banks in the Tenth Federal Reserve District, excluding from this sample any banks that experienced
a significant ownership change in the period from 1991 to 1994.10 Requiring at least three years of stable
ownership ensures that each bank's 1994 performance was not part of a transition period following an ownership
change, which is consistent with our assumption that a bank's financial performance is endogenous to its
ownership structure.
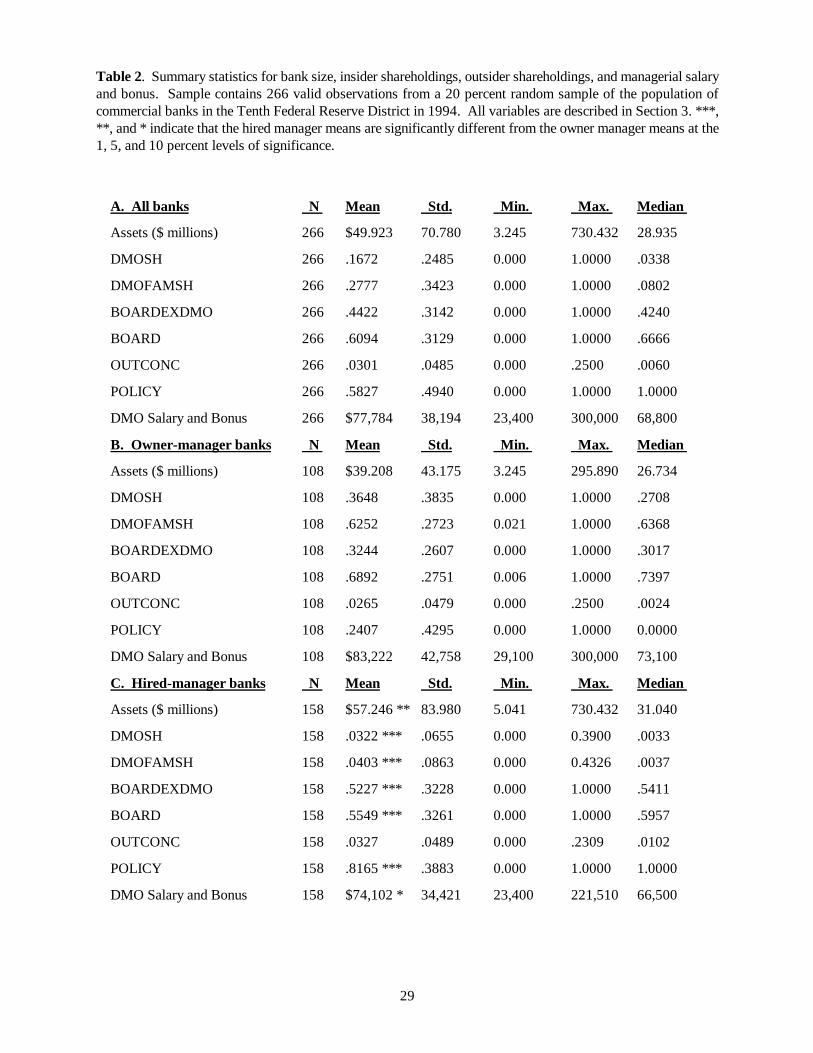
Descriptive statistics displayed in Tables 1 and 2 indicate that the sample is dominated by small, closely
held, rural banks. The average bank held only about $50 million in assets. The average DMO earned about
$78,000 in salary and bonus, and held about 17 percent of the bank's voting stock (DMOSH). In many banks,
persons related to the DMO by birth or marriage also owned stock, and including these family shareholdings
increased the average DMO's stake in the bank to about 28 percent (DMOFAMSH). The combined shareholdings
of the board of directors (BOARD) averaged about 61 percent, and the combined board shareholdings excluding

10
those held by DMOs that sat of the board (BOARDEXDMO) averaged about 44 percent. The large majority of
the sample banks were free-standing (independent) banks or were the single banking affiliates in one-bank
holding companies (OBHCs). Just one-in-five banks were affiliates in multi-bank holding companies (MBHCs),
and just one-in-four were headquartered in urban metropolitan statistical areas (MSAs).
Given that the banks in our sample tend to be dominated by insiders, effective monitoring by outsiders
may be relatively rare. Outsiders who hold only a small stake in a small bank are unlikely to incur the expenses
necessary to monitor the DMO, particularly when the price of their thinly traded shares will reliably reflect only
large changes in the value of the bank. We proxy the likelihood that outside owners will monitor the DMO with
the variable OUTCONC, a Herfindahl index of outsider concentration that increases as minority ownership
becomes less fragmented. OUTCONC equals the sum of the squared ownership shares of minority shareholders
that have at least a 5 percent stake, but are not members of the controlling shareholder group. To test whether
monitoring by insiders affects the financial performance of the bank, we construct the dummy variable POLICY,
which equals one when someone in the controlling shareholder group other than the DMO retains some policy
making authority.11
The tables reveal some significant differences between the owner-manager banks and the hired-
manager banks. About 40 percent of the sample banks were owner-manager banks. These banks tended to be
smaller than hired-manager banks, but on average their DMOs received higher salaries and bonuses. By
definition, owner-manager DMOs and their families held substantially larger ownership shares than did hired-
manager DMOs and their families, reflected in the significantly larger means for the variables DMOSH,
DMOFAMSH, and BOARD.12 The data suggest a greater capacity for inside monitoring at hired-manager banks,
where both POLICY and BOARDEXDMO were significantly larger than at owner-manager banks.
It is instructive to compare the degree of insider ownership in our sample banks to that found in previous
studies of financial institutions. For example, in Allen and Cebenoyan (1991), combined insiders at the average
bank holding company owned only 3 percent of the shares. In Brewer and Saidenberg (1996) and Cebenoyan,
Cooperman, and Register (1996), combined insiders at the average thrift institution held just 18 percent of the
shares. In Gorton and Rosen (1995), combined insiders held as much as 25 percent of the shares in only 23
11
percent of the commercial banks they examined. In comparison (see Table 2), the ownership of our sample banks
is much more concentrated in the hands of insiders, a pattern of ownership which is more representative of the
small and closely held firms that comprise the majority of commercial banks in the U.S.
Furthermore, while previous studies typically focus on the aggregate shareholdings of all insiders, we
focus our empirical tests on the shareholdings of a single insider: the daily managing officer. The DMO is the
primary provider of management services at the typical small bank in our sample, while at the large financial
institutions examined in earlier studies management responsibilities were spread unevenly across a team of
insiders. Because we can distinguish between the DMO's shareholdings and the collective shareholdings of all
insiders, our tests may produce especially accurate estimates of entrenchment and other principal-agent effects.
4. Measuring Bank Performance
Market-based performance measures are not available for the large majority of banks in our sample.13
We gauge the financial performance of banks by their estimated profit efficiency (EFF) relative to the other
banks in the 10th Federal Reserve District. Constructing an estimate of EFF for each bank requires us to first
estimate an efficient, or "best practice," profit frontier for the 10th District. The efficient profit frontier reflects
the highest profits earned by 10th District banks of different sizes, output mixes, location, and other
characteristics. We assume that the estimated frontier represents potential profit, and we calculate EFF for each
bank based on the percentage of its potential profit that it actually earned (i.e., its relative distance from the
frontier).14 Because EFF measures bank profitability after adjusting for size, output, location, etc., it should be
a better measure of bank performance than simple accounting ratios such as ROA or ROE.
The standard, neoclassical approach to modeling profits p assumes that firms purchase their inputs at
prices w in perfectly competitive input markets, and sell their outputs at prices p in perfectly competitive output
markets, i.e., p = f(p,w). This framework is problematic for banking firms. Banks are likely to be price takers
in output markets, but in some instances banks enjoy the ability to set output prices. This can be especially true
in rural markets where banks face few competitors, and also for a small business customer whose line of credit
depends on her relationship with the bank. Another drawback to the standard approach is that price data are
simply unavailable for mutual fund sales, stand-by letters of credit, and other fee-generating services which
provide a growing source of revenue for commercial banks. Pulley and Braunstein (1992) and Humphrey and
12
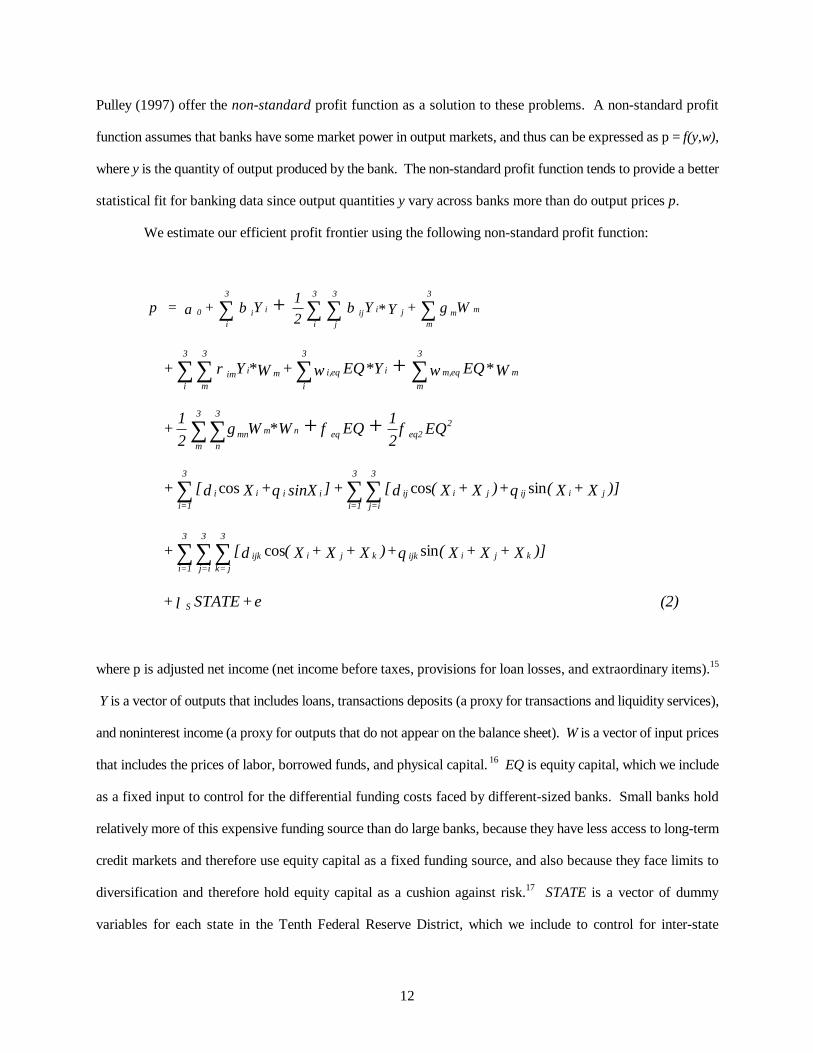
Pulley (1997) offer the non-standard profit function as a solution to these problems. A non-standard profit
function assumes that banks have some market power in output markets, and thus can be expressed as p = f(y,w),
where y is the quantity of output produced by the bank. The non-standard profit function tends to provide a better
statistical fit for banking data since output quantities y vary across banks more than do output prices p.
We estimate our efficient profit frontier using the following non-standard profit function:
W + YY21
Y + = mm
3
mjiij
3
j
3
i
ii
3
i0 + γββαπ ∑∑∑∑ *
+ W*EQY*EQ + WY + meqm,
3
m
ieqi,
3
imiim
3
m
3
iωωρ ∑∑∑∑ *
+ + EQ21
EQWW 21
+ 2eq2eqnmmn
3
n
3
m
φφγ *∑∑
)] X + X( + )X + X([ +] sinX + X[ + jiijjiij
3
ij=
3
=1iiiii
3
=1i
sincoscos θδθδ ∑∑∑
)] X + X + X( + )X + X + X([ + kjiijkkjiijk
3
j=k
3
ij=
3
=1i
sincos θδ∑∑∑
(2) + STATE + S ελ
where p is adjusted net income (net income before taxes, provisions for loan losses, and extraordinary items).15
Y is a vector of outputs that includes loans, transactions deposits (a proxy for transactions and liquidity services),
and noninterest income (a proxy for outputs that do not appear on the balance sheet). W is a vector of input prices
that includes the prices of labor, borrowed funds, and physical capital. 16 EQ is equity capital, which we include
as a fixed input to control for the differential funding costs faced by different-sized banks. Small banks hold
relatively more of this expensive funding source than do large banks, because they have less access to long-term
credit markets and therefore use equity capital as a fixed funding source, and also because they face limits to
diversification and therefore hold equity capital as a cushion against risk.17 STATE is a vector of dummy
variables for each state in the Tenth Federal Reserve District, which we include to control for inter-state

13
differences in branching restrictions and other regulations.18
The specification of equation (2) is a hybrid of the quadratic functional form and the Fourier functional
form. The quadratic form has been used elsewhere to estimate bank profit functions, and although it should
provide a good fit for banks near the means of the data, it is likely to perform poorly for very large or very small
banks.19 Adding the trigonometric (Fourier) terms adds flexibility to the profit function for observations far from
the sample means, while retaining the structural stability of the quadratic specification near the means of the data.
We adapt this functional form from Mitchell and Onvural (1996), who show that adding Fourier terms to a
standard translog cost function significantly improves the statistical fit of bank cost functions. We base our
flexible profit function on a quadratic form rather than a translog form because, unlike costs, profits can be
negative.20 The three X variables in (2) are based on the values of the output vector Y, but are transformed so that
they each fall on the interval between zero and 2p, the natural domain of the sine and cosine functions.21
The core of any frontier estimation technique is the manner in which inefficiency is separated from
random error. We begin by assuming that the disturbance term e captures both profit inefficiency (the shortfall
of actual profit below potential profit due to excess expenses and/or deficient revenues) and random movements
in profits. Let e = u + v be a composite disturbance term, where u represents dollars of profit inefficiency and
is distributed below the efficient frontier as a half normal random variable; v represents random error and is
distributed normally with a zero mean; and both u and v are orthogonal to the regressors. We use the stochastic
frontier approach (see Jondrow, Lovell, Materov, and Schmidt 1982) to generate separate estimates of u and v
for each bank. Large banks have a larger profit potential than small banks, so we transform estimated profit
inefficiency u from dollars of inefficiency into a percentage of potential profits:
(3) 0 < if 00 if )u+/(
= EFFi
iiiii
≥
ππππ
where pi+ui is potential profit, defined as the profit that bank i would have earned had it operated on the efficient
profit frontier. EFF measures percent profit efficiency, is bounded from below at 0 for the most inefficient banks,
and approaches 1 for the most efficient banks.22 The general approach presented in (2) and (3) has been used
14
elsewhere to produce reasonable estimates of the financial performance of small commercial banks (DeYoung
and Hasan 1998).
Given its construction, EFF should capture a substantial amount of the ex post effects of the four generic
types of value-reducing behaviors mentioned in the introduction: expense preference, shirking, empire building,
and risk aversion. As described above, EFFi is based on the error-adjusted difference (ui) between bank i's actual
profits and the profits of a hypothetical, frontier-efficient bank similar to bank i in terms of size, output mix, input
prices, and regulatory environment. Managerial expenditures (expense preference) over and above those
necessary to efficiently produce outputs Y will increase u and decrease EFF. Similarly, foregone revenues or
unnecessary costs due to laxity (shirking) in repricing the bank's assets, collecting its loan payments, setting its
services charges, or exploiting its cross-selling opportunities will also increase u and decrease EFF. Costly self-
aggrandizing behavior by managers, such as using expensive purchased funds to grow the bank too quickly,
hiring an unnecessarily large staff, or making ill-advised acquisitions (empire building), will also increase u and
decrease EFF. Finally, limiting revenues by making only low-risk loans, or performing excess amounts of loan
underwriting and monitoring (risk aversion), will increase u and decrease EFF.23
Although EFF is not formally a risk-adjusted measure of bank performance, our model does account for
risk in a number of ways. By including equity capital as an argument, our model partially controls for insolvency
risk, because banks that hold large equity cushions (relative to other similar-sized banks) will be less likely to
fail and as a result will have lower funding expenses and higher profits. As mentioned in the preceding
paragraph, some manifestations of managerial risk-averse behavior are captured in EFF. And to the extent that
inter-bank differences in riskiness are related to the output vector Y, our model will benchmark banks to efficient
banks with similar levels of risk. For example, banks that depend disproportionately on interest-bearing assets
that reprice (loans) are more exposed to interest rate risk than banks that depend more on noninterest fee revenue
(noninterest income). Similarly, other things equal, banks with large loan portfolios are more exposed to default
risk than banks that hold fewer loans but more securities and cash.
5. Results
We estimated equations (2) and (3) using 1994 data for all of the commercial banks in the Tenth Federal
Reserve District that were at least five years old and offered a full range of banking services (i.e., that made loans,

15
held insured deposits, and generated noninterest income). A total of 1,414 banks met these criteria after
eliminating a small number of banks for which complete data was not available. Although we are most interested
in the ownership and performance characteristics for just a sample of 266 of these banks (see below), we
estimated the profit frontier for the entire population of banks in the District in order to improve the efficiency
of the estimated parameters. All data used to estimate the profit frontier were taken from the Reports of
Condition and Income. We use data from 1994 to estimate bank efficiency because, as stated above, we expect
that the ownership in place for the period from 1991 to 1994 would be responsible for bank performance in 1994.
The estimation results, along with summary statistics for the regression variables, are displayed in Table 3.
For our population of 1,414 banks, estimated profit efficiency EFF ranged from zero to .9988 with a
mean of .6661. Thus, the average 10th District bank incurred excess costs and/or revenue shortfalls equal to
about 33 percent of its potential profits (1-.6661). In other words, the average bank could have increased its pre-
tax profits by about 50 percent ( [1-.6661]/.6661 ) had it operated on the efficient profit frontier. The magnitude
of this estimate is similar to previous studies of commercial bank profit efficiency.24 For the 266 banks in our
random sample, EFF averaged .6455, not significantly different from the population mean. EFF was truncated
at zero for only four of the 266 sample banks.
For the subsample of 108 owner-managed banks EFF averaged .6131, significantly lower (at the 5
percent level) than the average EFF of .6677 for the subsample of 158 hired-manager banks. We suggest three
overarching reasons for this difference. First, DMOs at hired-manager banks may be better managers on
average than DMOs at owner-manager banks. Many owner-managed banks are family-run enterprises that select
their DMOs from a limited labor pool (i.e., the extended family). Furthermore, as we state in the introduction
to this article, access to increased managerial expertise may be a prime motivation for owners to cede day-to-day
control to an outsider. This simple bivariate comparison suggests that the application of this increased expertise
improves bank performance by more than enough to offset any agency costs. The multivariate regression tests
reported in the next section shed more light on this issue.
Second, in many of the owner-managed banks in our sample, the DMO may have objectives other than
maximizing the value of the bank. For example, community service may be a strong motivation for these
bankers, and the DMO may be willing to sacrifice some profit in order to keep marginal businesses operating in

16
a small community. In addition, owner managers typically have a large portion of their wealth tied up in their
banks -- Sullivan and Spong (1998) find that the average owner-manager DMO in the Tenth District has 86%
of her personal net worth invested in the bank -- and as a result may be willing to accept lower profits in exchange
for less risk exposure.
Finally, owner managers may take actions that simply make their banks appear to be profit inefficient
relative to hired-manager banks. An owner-manager DMO has both the ability and the incentive to shift some
of her remuneration from dividends to salary and other benefits, thus reducing the double-taxation of her earnings.
Although this tax avoidance tactic will increase the value of the bank to the owner manager, it will decrease
the accounting profits on which our performance measure EFF is based. To test this hypothesis we regressed
DMO salary plus bonus (results not shown) on HIRED, lnASSETS, URBAN, DMO age, and a large blockholder
variable. Adjusted R2 = .59 for this regression. Consistent with our hypothesis, the coefficient on HIRED
equaled -0.19 and was significant at the 1% level. Additional calculations based on this estimated coefficient
suggest that DMO salaries and bonuses account for about 20 percent of the efficiency difference between owner-
manager banks and hired-manager banks. Hence, tax avoidance behavior is likely one of several contributing
factors for the difference in measured profit efficiency between these two groups of banks.
5.1 Regression results
Table 4 displays ordinary least squares estimations of equation (1).25 Regression [1] specifies financial
performance (EFF) as a simple quadratic function of the shareholdings of the daily managing officer and her
family (DMOFAMSH and DMOFAMSH2). As discussed above, we aggregate the shareholdings of the DMO with
those of her immediate family because many of the small, closely held banks in our sample are essentially family
owned and operated businesses. The coefficients on DMOFAMSH and DMOFAMSH2 are both statistically
insignificant. Thus, if separate regions of managerial alignment and entrenchment exist for the banks in our
sample, DMO ownership does not by itself provide enough information to identify these regions.
Regression [2] is a more complex specification in which the marginal effect of DMOFAMSH can vary
depending on whether the DMO is a hired manager or an owner manager. The dummy variable HIRED equals
one for hired-manager banks and zero for owner-manager banks, and is included both by itself and interactively

17
with DMOFAMSH and DMOFAMSH2. The negative coefficient on HIRED suggests that banks run by hired
managers with zero ownership share are relatively inefficient, although this coefficient is statistically different
from zero only at the 18 percent confidence level. The coefficients on DMOFAMSH and DMOFAMSH2 remain
statistically insignificant, which in this regression indicates that bank performance and managerial shareholdings
are unrelated at owner-manager banks. However, the coefficients on the interactive terms HIRED*DMOFAMSH
and HIRED*DMOFAMSH2 are both strongly significant, the sum of the coefficients on the linear terms
(DMOFAMSH and HIRED*DMOFAMSH) is significantly positive, and the sum of the coefficients on the squared
terms (DMOFAMSH2 and HIRED*DMOFAMSH2 ) is significantly negative. These results indicate a statistically
significant relationship between bank performance and managerial shareholdings at hired-manager banks.
Moreover, the signs on these coefficients are consistent with the inverted U-shape hypothesized above for these
banks, as well as with the findings of previous empirical studies of large, publicly traded corporations (e.g.,
Morck, Shleifer, and Vishny 1988).
To examine how concentrations of ownership or authority in persons other than the DMO will affect the
performance of the bank, we added the variables BOARDEXDMO, POLICY, and OUTCONC to the right-hand-
side of regressions [3], [4], and [5]. The board of directors is likely to monitor more actively when its members
hold a large share of the bank (BOARDEXDMO); efforts to monitor the DMO may be more effective when a
member of the largest shareholder group other than the DMO retains some policy making authority (POLICY);
and outsiders may be more motivated to monitor the DMO if outside shareholdings are concentrated in only a
few hands (OUTCONC). Because monitoring may be more necessary to control principal-agent problems at
hired-manager banks, we specify each of these variables linearly and interacted with the HIRED dummy.26
Thus, if hired managers exhibit value-reducing behaviors and any of these three monitoring channels are effective
in mitigating such behaviors, we would expect the sum of the linear and interactive coefficients to be positive.
In all three cases, however, we reject the hypothesis that strong and motivated monitors enhance the performance
of hired-manager banks -- and suprisingly, we find significant and negative marginal effects associated with
BOARDEXDMO and POLICY. As we shall see, further testing suggests that the negative coefficients on
BOARDEXDMO and POLICY are picking up the effects of important variables missing from the Table 4
regressions.
18
Each of the five regressions specified in Table 4 explains only a small portion of the variation in EFF.
In Table 5 we augment those regressions by adding variables that control for effects of bank size, location, and
organizational form that may influence bank efficiency and/or managerial control. URBAN is a dummy variable
which equals one for banks headquartered in MSAs. Urban banking markets tend to be less concentrated than
rural markets, and the resulting competition is likely to have two separate, and potentially offsetting, effects on
profit efficiency: price competition is likely to depress interest margins relative to rural banks, and competitive
rivalry is likely to create pressure for managers to run their banks more efficiently. The coefficient on URBAN
will be negative if the former effect (price competition) dominates, and positive if the latter effect (pressure to
eliminate inefficiency) dominates.27 lnASSETS is the natural log of bank assets. We expect the coefficient on
lnASSETS to be positive. Most existing studies have found that bank profit efficiency is positively related to
bank size, perhaps because larger banks face greater amounts of market discipline (from investors, specialized
monitors, and/or competitors) and can better afford to attract and retain high-quality managerial talent.28 MBHC,
LBHC, HC1, HC2, and HC3 are dummy variables related to organizational form: MBHC identifies subsidiaries
of multibank holding companies; LBHC identifies lead banks in those organizations; and HC1, HC2, and HC3
identify holding companies represented in our sample by more than one subsidiary bank (three banks were
subsidiaries of HC1, two were subsidiaries of HC2, and two were subsidiaries of HC3).
Three of these seven control variables are significantly related to bank performance in the Table 5
regressions. Consistent with previous studies of bank profit efficiency, the estimated coefficient on lnASSETS
is positive and significant. The coefficient on LBHC is negative and significant, which is not surprising given
that lead banks often provide costly services for their affiliates at transfer prices that are below the marginal
economic cost of production. Banks affiliated with HC2 are significantly less profit efficiency than the average
bank. Although the negative coefficient on URBAN suggests that the effects of price competition dominate the
effects of cost cutting in urban markets, this effect is not statistically different from zero. The coefficients on
MBHC, HC1, and HC3 are not also not statistically different from zero.
Adding these control variables greatly increases the explanatory power of the regressions, but leaves the
significance levels and relative magnitudes of the various DMO ownership coefficients unchanged. In other
words, although the control variables together explain the lion's share of the total variation in profit efficiency

19
across banks, marginal changes in managerial shareholdings are still associated with statistically significant
inverted U-shape changes in profit efficiency at hired-manager banks. The coefficients on BOARDEXDMO and
POLICY now have the expected positive signs in regressions [8] and [9], although these coefficients are not
statistically significant. (The unexpected negative coefficients were likely due to strong correlations between
these variables and asset size, which was unspecified in the Table 4 regressions.29) In addition, the coefficients
on the outside ownership concentration variables (OUTCONC) continue to be insignificant in regression [10].
Thus, we find no evidence that outsiders or non-DMO insiders at these banks can discipline management or
otherwise significantly impact bank performance. These results may indicate that the periodic presence of
government examiners reduces the incentives for these would-be monitors to scrutinize the DMO, or that outside
shareholders (regardless of their concentration) lack the economic motivation to monitor the DMO because they
collectively have only a very small stake in these banks.
5.2 Alignment and entrenchment effects
Figure 1 displays the estimated relationship between EFF, DMOFAMSH, and HIRED in a graphical
format. The hired manager graph is derived from regression [7] by setting HIRED=1; setting URBAN,
lnASSETS, and MBHC to their hired-manager bank means; setting the remainder of the regression dummy
variables to zero; and allowing DMOFAMSH to vary. The owner manager graph is derived similarly after setting
HIRED=0 and setting URBAN, lnASSETS, and MBHC to their owner-manager bank means. For hired managers,
profit efficiency follows an inverted U-shape which peaks when the DMO family owns about 17 percent of the
bank. Interpreted within our theoretical framework, increases in management shareholdings up to 17 percent
serve to align the DMO with the owners, while increases in shareholdings beyond 17 percent allow the DMO to
become entrenched. In contrast, the graph is nearly horizontal for owner managed banks. (Although this effect
for owner managers is statistically insignificant in the regression, we display it in Figure 1 to illustrate that it is
also economically insignificant.) Thus, the overall picture in Figure 1 is consistent with the predictions of Stulz
(1988): financial performance at first improves with increases in the shareholdings of hired managers; declines
as additional shareholdings allow the hired manager to become entrenched; and is invariant to additional
shareholdings after the hired manager becomes the primary owner. Consistent with the discussion above, the
EFF-DMOFAMSH locus lies vertically lower for the owner-manager banks than for the hired-manager banks for

20
most values of DMOFAMSH.
On average, increasing the hired DMO family ownership all the way from zero to the optimum 17
percent level is associated with a statistically significant 9.26 percentage point improvement in profit efficiency
(from .6819 to .7745). One on hand, the large magnitude of this improvement suggests that this is an
economically significant result. A 9 percentage point increase in EFF would eliminate approximately 29% of
the efficiency shortfall for the average hired-manager bank in our sample, clearly a large improvement in bank
performance. Furthermore, the positively sloped part of the inverted U-shape along which this result is measured
contains a substantial portion of the hired-manager banks in the sample -- of the 55 hired managers with a non-
zero family ownership stake, 45 held less than a 17% stake. (The distribution of DMOFAMSH can be seen in
Figure 2.) On the other hand, the 17% increase in DMOFAMSH needed to generate the full 9 point efficiency
improvement is a very large change in owner manager control. Amassing a 17 percent stake from scratch would
likely take a number of years, and issuing this much new stock would impose costs on the current owners (dilution
of existing shares) that partially offset the benefits from higher expected profits. Theoretically, these difficulties
could be solved by giving managers stock options, but this is not a viable alternative for most small banks.30
The EFF-DMOFAMSH locus traced out in Figure 1 implies that hired manager shareholdings could be
manipulated to make banks more profit efficient, holding bank size and other conditions constant. Our regression
estimates suggest imply there may be another way to significantly improve bank efficiency. As discussed above,
the positive coefficient on lnASSETS indicates that larger banks tend to be more profit efficient -- thus, within
reason a bank might use growth as a way to achieve greater efficiency, holding managerial shareholdings
constant. Using the coefficient estimate from regression [7], the average hired-manager bank with $57 million
in assets would have to grow to about $95 million in assets (a 66% increase in size, holding the size of other
banks constant) to add 9.26 percentage points to EFF.31 This is a tremendous amount of growth, especially for
the slow-growing rural markets which dominate our sample, some of which experienced net population outflow
during the 1990s. Thus, for most of our sample banks, growth of this magnitude likely could be accomplished
only via merger or acquisition, which of course could also alter the management/ownership structure of the bank.
This simple example suggests that a 9 percentage point increase in EFF is not easily achieved, and as such a
control mechanism with the potential to generate such a performance improvement is a powerful mechanism.

21
Our results imply that under-utilization of managerial shareholdings is a chronic and expensive problem
at small, closely held financial institutions. The 103 pure hired-manager banks with trivial levels of managerial
ownership (DMOFAMSH < 1%) forewent the entire potential 9 percentage point improvement in profit efficiency
associated with this control mechanism. This stands in direct contrast to the results of Demsetz, Saidenberg, and
Strahan (1997), who find substantial owner-manager agency problems in only about 4% of the large, publicly
traded bank holding companies they study, and furthermore that these firms tend to quickly address such
problems by increasing managerial shareholdings. These contrasting results suggest that exposure to market
discipline helps dissipate owner-manager agency problems at actively traded firms, but that these problems are
more likely to fester uncorrected at closely held firms. Alternatively, over-utilization of managerial shareholdings
(i.e., entrenchment) appears to be less of a problem in our sample than does under-utilization. The negatively
sloped part of the inverted U-shape in Figure 1 contains only a small portion of the hired-manager banks in the
sample -- of the 55 hired managers with a non-zero family ownership stake, only 10 held more than a 17% stake.
Any conclusions drawn from the results displayed in Figure 1 should be interpreted with caution. The
graphical shapes are most representative for the average bank or banks in our sample, and any conclusions based
on these graphs rest on the assumption that EFF is a good proxy for firm value. In addition, there are a number
of practical considerations that we have not taken into account in our analysis. First, our results should not be
used as a policy prescription for large banks, where a 17% ownership stake would generate dividend streams and
wealth effects larger than necessary to discipline hired managers (see Demsetz and Lehn 1985). Second, the
result in Figure 1 is based on a regression that holds other control mechanisms constant. In practice, directors
might systematically substitute intensive monitoring, or retention of some policy making authority, for manager
shareholdings.32 Third, a bank may have low EFF simply because its current manager is mediocre; awarding
stock to an incapable manager may change her incentives but it is not likely to improve performance very much.
Finally, a manager may have low DMOFAMSH because she has not performed well enough in the past to be
rewarded with bank stock, or (equivalently) has not been rewarded with a salary high enough to afford stock
purchases.
6. Conclusions

22
Unlike shareholders at large, widely traded corporations, the owners of small, closely held firms cannot
rely on external mechanisms (e.g., institutional creditors, bond rating agencies, the market for corporate control)
to monitor and discipline hired managers. So when the owners of a small, closely held business determine that
their financial interests would be served by relinquishing day-to-day control to a professional manager, they must
either directly monitor that manager, or attempt to align her preferences with their own by making her a minority
shareholder. Choosing the optimal level of managerial shareholdings is crucial: if under-utilized, the hired
manager may be insufficiently motivated and the financial gains expected by the owners will not fully materialize;
if over-utilized, the hired manager may accumulate too large a stake in the firm and become entrenched.
In this paper, we examine the relationship between managerial shareholdings and financial performance
at 266 predominantly small, state-chartered commercial banks in the Tenth Federal Reserve District. Because
only a few of these banks are publicly traded, we measure their financial performances relative to a best-practice
profit frontier that we estimate using stochastic frontier techniques and 1994 call report data. We use confidential
data from bank examination reports to establish ownership profiles and managerial responsibilities at these
banks, and we find that some of these banks are run by hired managers with no ownership stake, some are run
by hired managers with minority ownership stakes, and some are run by owner managers. Thus, this data set
allows us to test the following two general hypotheses: Does ceding day-to-day control to a professional manager
enhance financial performance at small, closely held firms? Does the financial performance of small, closely held
firms that hire outside managers exhibit patterns of alignment and entrenchment that are related to the
shareholdings of that hired manager?
Our results suggest that ceding day-to-day control to a professional manager can potentially enhance the
financial performance of small, closely held commercial banks, and that these potential gains are most likely to
materialize when mechanisms (i.e., optimal managerial shareholdings) are in place to monitor and motivate the
hired managers. Estimated profit efficiency was relatively low at banks run by hired managers with little or no
ownership stake, but improved substantially as managers accumulated shareholdings and presumably became
more aligned with the owners. Profit efficiency was highest for hired managers holding about a 17 percent
ownership share, but then declined as managers accumulated additional shareholdings and presumably became
entrenched. This inverted U-shape is roughly consistent with that found in studies of larger, publicly traded

23
corporations, which suggests that managerial entrenchment is a phenomenon that transcends firm size and trading
status. In contrast, we find that financial performance was unrelated to managerial shareholdings at banks that
were managed by a member of the primary ownership group. Overall, our empirical results are consistent with
theoretical models of manager entrenchment that predict inverted U-shape associations between financial
performance and hired manager shareholdings, but no association between financial performance and owner
manager shareholdings (e.g., Stulz 1988).
In contrast to some previous studies of large, actively traded corporations, we find no evidence that non-
managerial insiders, or blocks of outside owners, can effectively monitor the hired manager. Because the
ownership of our average sample bank is highly concentrated among a small number of insiders, there may simply
be little incentive for the remaining fragmented owners to incur the costs of monitoring management. The
presence of a government-monitor (bank examiners) at these firms may further reduce the motivation of would-be
monitors.
One implication of our results is that under-utilization of managerial shareholdings may be a chronic and
expensive problem at small, closely held depository institutions. In the most extreme cases, a static analysis of
our results indicates that nearly 30% a bank's existing profit inefficiency could be eliminated by adopting an
ownership structure in which hired managers hold a larger amount of stock. These results provide an interesting
reflection of a study by Demsetz, Saidenberg, and Strahan (1997), who found that very few large, publicly traded
banking firms suffer from owner-manager principal-agent problems. These contrasting results suggest that
exposure to market discipline helps dissipate owner-manager agency problems at publicly traded firms, but that
these problems are more likely to fester uncorrected at closely held firms.
We believe that the results derived here from our sample of 266 commercial banks are prescriptive for
other small financial institutions, in particular the thousands of U.S. commercial banks that are similar to our
sample banks in firm size, trading status, ownership structure, and business mix. We more cautiously suggest
that these results are prescriptive for tens of thousands of small, non-financial businesses which have
concentrated ownership structures similar to those of our sample banks. The obvious corporate governance
difference between small banks and small business firms is that the former are periodically monitored by
government examiners, while the latter are typically monitored by a bank lender. Whether or not our results can

24
be extended to small non-banks depends on the extent to which the efforts and the effects of these two external
monitors are close substitutes.

25
References
Agrawal, Anup and Charles R. Knoeber, "Firm Performance and Mechanisms to Control Agency Problemsbetween Managers and Shareholders." Journal of Financial and Quantitative Analysis 31: 377-98, 1996.
Akhavein, Jalal D., Allen N. Berger, and David B. Humphrey, "The Effects of Megamergers on Efficiency andPrices: Evidence from a Bank Profit Function," Review of Industrial Organization 12: 95-139, 1997.
Akhavein, Jalal D., P.A.V.B. Swamy, Stephen B. Taubman, and Rao N. Singamsetti, "A General Method forDeriving the Efficiencies of Banks from a Profit Function," Journal of Productivity Analysis 8: no. 1, 1997.
Alchian, Armen, and Harold Demsetz, "Production, Information Costs, and Economic Organization," AmericanEconomic Review 62: 777-795, 1972.
Allen, Linda and A. Sinan Cebenoyan, "Bank Acquisitions and Ownership Structure: Theory and Evidence,"Journal of Banking and Finance 15: 425-448, 1991.
Bauer, Paul, Allen N. Berger, Gary Ferrier, and David Humphrey, "Consistency Conditions for RegulatoryAnalysis of Financial Institutions: A Comparison of Frontier Efficiency Techniques," Journal of Economics andBusiness, forthcoming, April 1998.
Berger, Allen N., Robert DeYoung, Hesna Genay, and Greg Udell, "The Globalization of Financial Institutions:Evidence from Cross-Border Banking Efficiency," Brookings-Wharton Papers on Financial Service, Vol. 3,2000 (forthcoming), Robert E. Litan and Anthony Santomero, eds.
Berger, Allen N., Diana Hancock, and David B. Humphrey, "Bank Efficiency Derived from the Profit Function,"Journal of Banking and Finance, 17: 317-347, 1993.
Berger, Allen N., John H. Leusner, and John J. Mingo, "The Efficiency of Bank Branches," Journal of MonetaryEconomics 40: 141-162, 1997.
Berger, Allen, N., and Loretta J. Mester, "Inside the Black Box: What Explains Differences in the Efficienciesof Financial Institutions?" Journal of Banking and Finance 21: 895-948, 1997.
Berle, Adolph, and Gardiner Means, The Modern Corporation and Private Property, New York: MacMillan(1932).
Brewer, Elijah III, and Marc R. Saidenberg, "Franchise Value, Ownership Structure, and Risk at SavingsInstitutions," Federal Reserve Bank of New York, Research Paper 9632, 1996.
Cebenoyan, A. Sinan, Elizabeth S. Cooperman, and Charles A. Register, "Ownership Structure, Charter Value,and Risk-Taking Behavior for Thrifts," working paper, 1998.
Cebenoyan, A. Sinan, Elizabeth S. Cooperman, and Charles A. Register, "Ownership Structure, CapitalForebearance, and the Looting of the Savings and Loans," working paper, 1996.
Chen, Carl R., Thomas L. Steiner, and Ann Marie Whyte, "Risk-taking Behavior and Management Ownershipin Depository Institutions," The Journal of Financial Research XXI: 1-16, 1998.
Cole, Rebel A., and Hamid Mehran, "The Effect of Changes in Ownership Structure on Performance: Evidencefrom the Thrift Industry," Board of Governors of the Federal Reserve System, Financial and EconomicsDiscussion Series 96-6, 1996.

26
Demsetz, Harold, and Kenneth Lehn, "The Structure of Corporate Ownership: Causes and Consequences,"Journal of Political Economy 93: 1155-1177, 1985.
Demsetz, Rebecca S., Marc R. Saidenberg, and Philip E. Strahan, "Agency Problems and Risk Taking at Banks,"Federal Reserve Bank of New York, Staff Report #29, September 1997.
DeYoung, Robert, and Iftekhar Hasan, "The Performance of De Novo Commercial Banks: A Profit EfficiencyApproach," Journal of Banking and Finance, forthcoming 1998.
DeYoung, Robert and Daniel Nolle, "Foreign-Owned Banks in the U.S.: Buying Market Share or Earning It?,"Journal of Money, Credit, and Banking 28: 622-636, November 1996.
Evanoff, Douglas D., and Philip R. Israilevich, "Regional Differences in Bank Efficiency and Technology," TheAnnals of Regional Science, 25: 41-54, 1991.
Fama, Eugene, "Agency Problems and the Theory of the Firm," Journal of Political Economy, 88: 288-307,1980.
Glassman, Cynthia A., and Stephen A. Rhoades, "Owner vs. Manager Control Effects on Bank Performance,"The Review and Economics and Statistics 62: 263-270, 1980.
Gorton, Gary and Richard Rosen "Corporate Control, Portfolio Choice, and the Decline of Banking," Journalof Finance: 50, 1377-1420, December 1995.
Gropper, Daniel M., and T. Randolph Beard, "Insolvency, Moral Hazard, and Expense Preference Behavior:Evidence from U.S. Savings and Loan Associations," Managerial and Decision Economics 16: 607-617.
Hannan, Timothy, and Ferdinand Mavinga, "Expense Preference and Managerial Control: The Case of theBanking Firm," Bell Journal of Economics, Autumn: 671-682, 1980.
Houston, Joel F., and Christopher James, "CEO Compensation and Bank Risk: Is Compensation in BankingStructured to Promote Risk Taking?" Journal of Monetary Economics 36: 405-431.
Howell, Jann, "To Buy or Sell: Active Investors, Entrenched CEOs, and Financial Institution Mergers andAcquisitions," Iowa State University, working paper, June 1997.
Hughes, Joseph P., and Loretta J. Mester, "Bank Capitalization and Cost: Evidence of Scale Economies in RiskManagement and Signaling," Review of Economics and Statistics, forthcoming 1998.
Humphrey, David, and Lawrence Pulley, "Banks' Responses to Deregulation: Profits, Technology, andEfficiency," Journal of Money, Credit and Banking (forthcoming, 1997).
Jensen, Michael, and William Meckling, "Theory of the Firm: Managerial Behavior, Agency Costs, andOwnership Structure," Journal of Financial Economics, 3: 305-360, 1976.
Jondrow, James, C.A. Knox Lovell, Ivan Materov, and Peter Schmidt, "On the Estimation of TechnicalInefficiency in the Stochastic Frontier Production Function Model," Journal of Econometrics, 19: 233-238,1982.
Knopf, John D., and John L. Teall, "Risk-Taking Behavior in the U.S. Thrift Industry: Ownership Structure andRegulatory Changes," Journal of Banking and Finance 20: 1329-1350, 1996.
27
Kwan, Simon H., and Robert A. Eisenbeis, "An Analysis of Inefficiencies in Banking: A Stochastic Cost FrontierApproach," Federal Reserve Bank of San Francisco Economic Review, number 2, 1996, pp.16-26.
Mayers, David, Anil Shivdasani, and Clifford W. Smith, "Board Compensation and Corporate Control: Evidencefrom the Insurance Industry," Journal of Business 70: 33-62, 1997.
McConnell, John J., and Henri Servaes, "Additional Evidence on Equity Ownership and Corporate Value,"Journal of Financial Economics 27, 595-612, 1990.
Mitchell, Karlyn, and Nur M. Onvural, "Economies of Scale and Scope at Large Commercial Banks: Evidencefrom the Fourier Flexible Functional Form," Journal of Money, Credit, and Banking, 28: 178-199, 1996.
Morck, Randall, Andrei Shleifer, and Robert W. Vishny, "Management Ownership and Market Valuation, AnEmpirical Analysis," Journal of Financial Economics 20: 293-315, 1988.
Pi, Lynn, and Stephen Timme, "Corporate Control and Bank Efficiency," Journal of Banking and Finance 17:515-530, 1993.
Prowse, Stephen, "Corporate Control in Commercial Banks," The Journal of Financial Research 20: 509-527,1997.
Pulley, L. and Y. Braunstein, "A Composite Cost Function for Multiproduct Firms with an Application toEconomies of Scope in Banking," Review of Economics and Statistics 74: 221-230, 1992.
Saunders, Anthony, Elizabeth Strock, and Nickolaos Travlos, "Ownership Structure, Deregulation, and Bank RiskTaking," Journal of Finance, 45: 643-654, 1990.
Schranz, Mary, "Takeovers Improve Firm Performance: Evidence from the Banking Industry," Journal ofPolitical Economy, vol 101: 299-323, 1993.
Spong, Kenneth, Richard Sullivan, and Robert DeYoung, "What Makes a Bank Efficient? A Look at FinancialCharacteristics and Bank Management and Ownership Structure," Federal Reserve Bank of Kansas City,Financial Industry Perspectives, December, 1995.
Stulz, R.M., "On Takeover Resistance, Managerial Discretion, and Shareholder Wealth," Journal of FinancialEconomics 20: 25-54, 1988.
Sullivan, Richard, and Kenneth Spong, "Does Manager Wealth and Insider Ownership Influence Risk? A Lookat Ownership Structure, Manager Wealth, and Risk in Commercial Banks," Federal Reserve Bank of Kansas City,Financial Industry Perspectives, December: 15-40, 1998.

28
Table 1. Composition of sample banks by ownership, location, and organizational form. Sample contains 266valid observations from a 20 percent random sample of the population of commercial banks in the Tenth FederalReserve District in 1994.
% of sample% of owner-
manager banks% of hired-
manager banks
Owner-manager banks 40.6% -- --
Hired-manager banks 59.4% -- --
Urban location 24.8% 19.4% 28.5%
Rural location 75.2% 80.6% 71.5%
MBHC affiliates 20.3% 9.3% 27.9%
OBHC affiliates 56.0% 63.8% 50.6%
Independent banks 23.7% 26.7% 21.5%
Notes: In an owner-manager bank, the daily managing officer (DMO) is a member of the controlling shareholdergroup. In a hired-manager bank, the DMO is not a member of the controlling shareholder group. Urban banksare headquartered in metropolitan statistical areas (MSAs), while rural banks are not. Our sample banks areeither one of several banking affiliates in a multibank holding company (MBHC), the single banking affiliate ina one-bank holding company (OBHC), or are not affiliated with a holding company (Independent).
29
Table 2. Summary statistics for bank size, insider shareholdings, outsider shareholdings, and managerial salaryand bonus. Sample contains 266 valid observations from a 20 percent random sample of the population ofcommercial banks in the Tenth Federal Reserve District in 1994. All variables are described in Section 3. ***,**, and * indicate that the hired manager means are significantly different from the owner manager means at the1, 5, and 10 percent levels of significance.
A. All banks N Mean Std. Min. Max. Median
Assets ($ millions) 266 $49.923 70.780 3.245 730.432 28.935
DMOSH 266 .1672 .2485 0.000 1.0000 .0338
DMOFAMSH 266 .2777 .3423 0.000 1.0000 .0802
BOARDEXDMO 266 .4422 .3142 0.000 1.0000 .4240
BOARD 266 .6094 .3129 0.000 1.0000 .6666
OUTCONC 266 .0301 .0485 0.000 .2500 .0060
POLICY 266 .5827 .4940 0.000 1.0000 1.0000
DMO Salary and Bonus 266 $77,784 38,194 23,400 300,000 68,800
B. Owner-manager banks N Mean Std. Min. Max. Median
Assets ($ millions) 108 $39.208 43.175 3.245 295.890 26.734
DMOSH 108 .3648 .3835 0.000 1.0000 .2708
DMOFAMSH 108 .6252 .2723 0.021 1.0000 .6368
BOARDEXDMO 108 .3244 .2607 0.000 1.0000 .3017
BOARD 108 .6892 .2751 0.006 1.0000 .7397
OUTCONC 108 .0265 .0479 0.000 .2500 .0024
POLICY 108 .2407 .4295 0.000 1.0000 0.0000
DMO Salary and Bonus 108 $83,222 42,758 29,100 300,000 73,100
C. Hired-manager banks N Mean Std. Min. Max. Median
Assets ($ millions) 158 $57.246 ** 83.980 5.041 730.432 31.040
DMOSH 158 .0322 *** .0655 0.000 0.3900 .0033
DMOFAMSH 158 .0403 *** .0863 0.000 0.4326 .0037
BOARDEXDMO 158 .5227 *** .3228 0.000 1.0000 .5411
BOARD 158 .5549 *** .3261 0.000 1.0000 .5957
OUTCONC 158 .0327 .0489 0.000 .2309 .0102
POLICY 158 .8165 *** .3883 0.000 1.0000 1.0000
DMO Salary and Bonus 158 $74,102 * 34,421 23,400 221,510 66,500

30
Table 3. Data, variables, and results from profit efficiency model. Population contains 1,414 state charteredbanks in the Tenth Federal Reserve District in 1994. Sample contains 266 valid observations from a 20 percentrandom sample of the population of commercial banks in the Tenth Federal Reserve District in 1994. Allvariables are described in Section 4. Dollar signs ($) refer to thousands of 1994 dollars. EFF is an estimate ofthe percentage of a bank's potential before-tax profits that is actually captured. ** indicates the EFF isstatistically different from the population mean at the at the 5 percent level of significance.
A. Variables Used in Profit Efficiency Model
N Mean Std. Dev. Min. Max. Median
adjusted net income 1414 $1,652 7,303 -4,884 171,494 599
equity 1414 $7,022 22,453 151 565,375 3,324
loans 1414 $44,818 180,784 468 4,617,15 17,498
noninterest income 1414 $768 6,735 1 151,587 68
transactions deposits 1414 $26,424 103,489 901 2,217,98 10,172
price of labor 1414 $33.05 7.47 19.75 56.17 31.94
price of funds 1414 0.0349 0.0049 0.0221 0.0454 0.0352
price of physical capital 1414 0.4541 0.4218 0.0949 2.2143 0.3308
% in Colorado 1414 14.62% -- -- -- --
% in Kansas 1414 28.04% -- -- -- --
% in Missouri 1414 10.95% -- -- -- --
% in Nebraska 1414 20.55% -- -- -- --
% in New Mexico 1414 2.12% -- -- -- --
% in Oklahoma 1414 20.48% -- -- -- --
% in Wyoming 1414 3.25% -- -- -- --
B. Results from Profit Efficiency Model
N Mean Std. Dev. Min. Max. Median
EFF, population 1414 .6661 .2182 0 .9988 .7038
EFF, random sample 266 .6455 .2140 0 .9933 .6708
EFF, owner-manager banks 108 .6131 .2264 0 .9933 .6431
EFF, hired-manager banks 158 .6677 ** .2033 0 .9707 .6916

31
Table 4. OLS regressions of EFF on ownership and management variables for 266 commercial banks from theTenth Federal Reserve District in 1994. Standard errors are displayed below coefficient estimates in parentheses. ***, ** and * indicate a significant difference from zero at the 1, 5, and 10 percent levels, respectively, and "n.s."indicates not statistically significant. All variables are described in Section 5.
[1] [2] [3] [4] [5]
intercept 0.6746*** 0.7841*** 0.8066*** 0.7697*** 0.7880***(0.0181) (0.0648) (0.3424) (0.1008) (0.0953)
DMOFAMSH -0.0159 -0.3782 -0.3705 -0.3381 -0.3543(0.1377) (0.3482) (0.3424) (0.3908) (0.3531)
DMOFAMSH2 -0.1275 0.1410 0.1323 0.1075 0.1111(0.1526) (0.2851) (0.2804) (0.2958) (0.2946)
HIRED -- -0.1278 -0.0653 -0.0469 -0.1201(0.0968) (0.1017) (0.1105) (0.0977)
HIRED*DMOFAMSH -- 1.6084** 1.6237** 1.2759* 1.7307**(0.6654) (0.6543) (0.6947) (0.6765)
HIRED*DMOFAMSH2 -- -4.3563*** -4.5422*** -3.6878** -4.4962***(1.6158) (1.5899) (1.6613) (1.6222)
BOARDEXDMO -- -- -0.0719 -- --(0.0760)
BOARDEXDMO*HIRED -- -- -0.0892 -- --(0.0914)
POLICY -- -- -- 0.0202 --(0.0486)
POLICY*HIRED -- -- -- -0.0942 --(0.0664)
OUTCONC -- -- -- -- -0.1872(0.4645)
OUTCONC*HIRED -- -- -- -- -0.3046(0.5873)
number of observations 266 266 266 266 266adjusted R-square 0.0361 0.0558 0.0873 0.0588 0.0559sum of DMOFAMSH coefficients -- ** ** n.s. **sum of DMOFAMSH2 coefficients -- *** *** ** ***sum of monitoring coefficients -- -- *** * n.s.

32
Table 5. OLS regressions of EFF on ownership and management variables for 266 commercial banks from theTenth Federal Reserve District in 1994. Standard errors are displayed below coefficient estimates in parentheses. ***, ** and * indicate a significant difference from zero at the 1, 5, and 10 percent levels, respectively, and "n.s."indicates not statistically significant. All variables are described in Section 5.
[6] [7] [8] [9] [10]
intercept -1.2175*** -1.2091*** -1.2828*** -1.2416*** -1.2231***(0.1112) (0.1349) (0.1431) (0.1390) (0.1369)
DMOFAMSH 0.0639 0.0766 0.0897 0.0948 0.0379(0.0969) (0.2402) (0.2401) (0.2494) (0.2433)
DMOFAMSH2 -0.1243 -0.1235 -0.1284 -0.1369 -0.07320.1060 (0.1959) (0.1959) (0.2037) (0.2023)
HIRED -- -0.0046 -0.0235 -0.0306 0.0060(0.0670) (0.0717) (0.0762) (0.0678)
HIRED*DMOFAMSH -- 1.0159** 1.0278** 1.1362** 1.0978**(0.4647) (0.4642) (0.4845) (0.4725)
HIRED*DMOFAMSH2 -- -3.0975*** -3.0637*** -3.3765*** -3.2006***(1.1244) (1.1235) (1.1566) (1.1301)
BOARDEXDMO -- -- 0.0334 -- --(0.0535)
BOARDEXDMO*HIRED -- -- 0.0258 -- --(0.0647)
POLICY -- -- -- 0.0055 --(0.0335)
POLICY*HIRED -- -- -- 0.0302 --(0.0466)
OUTCONC -- -- -- -- 0.3242(0.3241)
OUTCONC*HIRED -- -- -- -- -0.4575(0.4048)
URBAN -0.0329 -0.0311 -0.0293 -0.0329 -0.0321(0.0217) (0.0216) (0.0216) (0.0217) (0.0217)
lnASSETS 0.1840*** 0.1827*** 0.1885*** 0.1854*** 0.1835***(0.0111) (0.0111) (0.0116) (0.0114) (0.0112)
MBHC -0.0283 -0.0269 -0.0227 -0.0274 -0.0271(0.0252) (0.0251) (0.0252) (0.0252) (0.0252)
LBHC -0.0301 -0.0368* -0.0409** -0.0387* -0.0390*(0.0201) (0.0202) (0.0203) (0.0203) (0.0205)
HC1 0.0584 0.0674 0.0893 0.0618 0.0629(0.1044) (0.1035) (0.1045) (0.1038) (0.1038)
HC2 -0.1782* -0.1693* -0.1741* -0.1733* -0.1723*(0.1052) (0.1042) (0.1041) (0.1044) (0.1046)
HC3 -0.1122 -0.1024 -0.0855 -0.1109 -0.1066(0.0879) (0.0872) (0.0881) (0.0877) (0.0874)
number of observations 266 266 266 266 266adjusted R-square 0.5487 0.5573 0.5582 .5560 0.5561sum of DMOFAMSH coefficients -- *** *** *** ***sum of DMOFAMSH2 coefficients -- *** *** *** ***sum of monitoring coefficients -- -- n.s. n.s. n.s.

33
Figure 1Predicted Profit Efficiency based on DMO Family Ownership
50%
60%
70%
80%
0% 20% 40% 60% 80% 100%
Percent of Bank Owned by DMO Family (DMOFAMSH)
Prof
it Ef
ficie
ncy
(EFF
)
hired manager banks
Figure 2Distribution of Banks by DMO Family Ownership Share
0
20
40
60
80
100
120
0% 1 -10%
10-20%
20-30%
30-40%
40-50%
50-60%
60-70%
70-80%
80-90%
90-100%
Percent of Bank Owned by DMO Family (DMOFAMSH)
Num
ber o
f Ban
ks hired manager
owner-manager
owner-manager banks
34
Endnotes 1 Schranz (1993) found that manager shareholdings and concentrated outsider ownership are partial substitutes for an activetakeover market at bank holding companies. Prowse (1997) concludes that monitoring by stockholders and directors is amore effective than the takeover market as a mechanism for disciplining management at large bank holding companies. Howell (1998) found that bank holding companies are more likely to be acquired if a bank director other than the CEO hasa large ownership block, which suggests that the effectiveness of the market for corporate control depends on the ownershipstructure of the potential takeover target. Demsetz, Saidenberg, and Strahan (1997) found that large, publicly traded bankholding companies tend to use increased managerial shareholdings to address owner-manager agency problems, althoughthey also find that this class of agency problem rarely occurs in these firms.
2 We exclude from this group an oft-cited study by McConnell and Servaes (1990), which examined movements in Tobin'sq at over 1,000 non-financial firms in 1976 and in 1986. The authors found inverted U-shaped associations between insidershareholdings and q that peaked between 37% and 61% insider ownership (depending on the year of observation and thedefinition of insider shareholdings). These results do not support Stulz's theoretical result, however, because in practice alarge firm with over 37% insider shareholdings is being run by its primary owners, not by entrenched managers.
3 Glassman and Rhoades (1980) found that closely held "owner-controlled" financial institutions earned higher profits thandid "manager-controlled" institutions. Hannan and Mavinga (1980) found that widely held banks incurred higher noninterestexpenditures than did closely held banks. Allen and Cebenoyan (1991) found that bank holding companies with both highinsider ownership and high shareholder concentration were most likely to make acquisitions that enhanced firm value. Piand Timme (1993) concluded that insider ownership in bank holding companies tends to discourage utility-maximizingbehavior by managers and reduces owners' monitoring costs. Gropper and Beard (1995) concluded that the diffuseownership structure at mutual thrifts created a disincentive to monitor managers of failing thrifts in the late 1980s, andallowed excess spending by managers at those institutions. Spong, Sullivan, and DeYoung (1995) found that highperformance banks tend to have active major stockholders and tend to be run by managers with large financial stakes in thebank. Cole and Mehran (1996) found higher stock returns at thrift institutions that had either a large inside shareholder ora large non-institutional outside shareholder.
4 Saunders, Strock, and Travlos (1990) found a positive relationship between insider ownership and unsystematic(diversifiable) risk, but no relationship between insider ownership and systematic (undiversifiable) risk, at large commercialbanks. Demsetz, Saidenberg, and Strahan (1997) found a positive relationship between insider ownership and risk(standard deviation of weekly stock returns) at bank holding companies, but only at low levels of insider shareholdings atbanks with low franchise value. Brewer and Saidenberg (1996) found a U-shape relationship between insider shareholdingsand risk (standard deviation of equity returns) at thrift institutions that bottomed-out at about 30% insider ownership. Knopfand Teall (1996) found positive correlations between numerous measures of risk-taking and insider ownership at thrifts. Chen, Steiner, and Whyte (1998) found a negative relationship between managerial ownership and several differentmeasures of risk in publicly traded thrifts and commercial banks. Sullivan and Spong (1998) find a negative relationshipbetween several measures of commercial bank risk and the percentage of managerial wealth invested in the bank.
5 Glassman and Rhoades (1980) found that ownership-performance relationships were particularly strong when ownershipwas concentrated among large stockholders related to each other by family or business ties.
6 In identifying the members of the controlling shareholder group, we were careful to look for groups of shareholders whohad common ties and were likely to act together. Ties were mainly through extended family, but in one instance a formalcontrol agreement existed among non-related shareholders.
7 At small closely held banks, year-end cash bonuses for hired managers may be preferable to on-going managerialownership stakes. In cash bonus arrangements, the hired manager is not guaranteed any particular share of bank earnings;the owners can retain some flexibility in determining the exact bonus amount; and the hired managers may prefer cash overilliquid shares. Conversations with examiners and bankers in the Tenth Federal Reserve District indicate that at least somehired DMOs receive such cash bonus arrangements. To the extent that this practice is wide-spread at hired-manager banks,our results in Section 5 below would imply that cash bonus plans are less effective than managerial shareholdings formotivating hired managers.
8 An entrenched manager will engage in this behavior as long as the marginal utility gained exceeds the corresponding

35
marginal reduction in the value of her ownership claim, holding the (low) probability of dismissal constant.
9 Cole and Mehran (1996) found higher stock returns at thrift institutions with large non-institutional outside shareholders.Cebenoyan, Cooperman, and Register (1996, 1998) found that the presence of large outside investors is associated withreduced risk levels and more cost efficient operations at thrift institutions. Mayers, Shivdasani, and Smith (1997) concludethat mutual insurance companies have relatively low noninterest expenses because they employ more outside directors. Knopf and Teall (1996) found that the presence of large institutional shareholders tends to reduce risk-taking at thriftinstitutions. In contrast, Brewer and Saidenberg (1996) found no relationship between large outside blockholders and riskat thrift institutions.
10 The 10th Federal Reserve District comprises all of Colorado, Kansas, Nebraska, Oklahoma, and Wyoming, and portionsof Missouri and New Mexico. We drew an initial 20 percent random sample of state-chartered banks from the Tenth Districtpopulation. From this initial sample of 304 banks, we excluded 27 banks that experienced a significant ownership change(i.e., the majority ownership of the bank changed hands) between 1991 and 1994. Most of the excluded banks (16 out of27) had earnings that were at or above peer banks near the time when the ownership or management changed. Of theremaining 11 excluded banks, only 5 could be responsibly characterized as having financial difficulties serious enough torequire new owners/managers. The changes in ownership/management were typically not linked to poor bank performance,and included retirement, divorce, estate planning, passing the bank on to a younger generation within the family, an agingBoard of Directors in a small town, and healthy buy-out offers from larger holding companies. Missing data and otherproblems reduced the initial sample by an additional 11 banks. We focus exclusively on state-chartered banks because FDICand Federal Reserve exam reports contained more detailed management and ownership data than did OCC exam reports. We do not believe that this causes a sample bias, because the regulation and supervision of small, established state-charteredbanks differs very little from the regulation and supervision of small, established federally chartered banks.
11 We relied on the judgement of bank examiners to define the POLICY variable. In their examination reports, bankexaminers identify a dominant policy maker or policy makers who play a role in setting bank policy, making majorinvestment and organizational decisions, and establishing the overall objectives of the bank. This policy makingresponsibility may be assumed by the DMO, another top officer, a major shareholder, the chairman of the board, a keydirector, or a combination of such individuals acting together. In cases where the DMO is not the dominant policy maker,or when the DMO shares this task with others, any policy maker other than the DMO could, in part, be viewed as fulfillingan important monitoring function by setting general policies and overseeing the manager's compliance with these policies.
12 The variable DMOSH equals zero at two owner-manager banks in which the DMO's shares were held by other familymembers. The variable BOARD equals zero at four hired-manager banks that were non-lead bank affiliates of multibankholding companies. 13 Of the bank holding companies with affiliates in our sample, only five had stock that was traded on regional or nationalexchanges. None of these banks were the lead banks in their holding company.
14 Akhavein, Berger, and Humphrey (1997), Berger, Hancock, and Humphrey (1993), Berger and Mester (1997), DeYoungand Nolle (1996), Humphrey and Pulley (1997), Akhavein, Swamy, Taubman, and Singamsetti (1997), DeYoung and Hasan(1998), and Berger, DeYoung, Genay, and Udell (1999) have all estimated profit efficiency for banks. In these models,"potential profits" is an empirical measure derived from the observed performance of the best practice banks in the data, anddoes not represent the theoretical absolute profit potential.
15 We use adjusted net income to measure bank profits for three reasons. First, this is the profit measure used by Humphreyand Pulley (1997) in the seminal paper on alternative bank profit functions. Second, because loan loss provisions are notcash flows, and because both loan loss provisions and extraordinary items are subject to accounting discretion andsmoothing, adjusted net income better reflects the economic performance (rather than the accounting performance) of banks. Third, as we shall see below, negative profits are difficult to deal with in efficiency estimation, and using adjusted net incomereduces the number of observations with negative profits, while still maintaining the efficiency ordering across banks.
16 The prices of labor, borrowed funds, and physical capital were truncated at their 1st and 99th percentiles in order to reducethe influence of outlying values of these artificially constructed input prices. Because the non-standard profit functioncontains input prices only, the theoretical restriction that input and output prices be homogeneous of degree one does notapply, and hence was not imposed during estimation.

36
17 Hughes and Mester (1998) describe the relationship between equity capital, bank size, and the benefits of diversificationfor commercial banks. Berger and Mester (1997) show that excluding equity capital from frontier cost and profit functionscan substantially alter the rank ordering of bank efficiency estimates.
18 Branching restrictions had not yet been fully phased-out in all of Tenth District states by 1994. Evanoff and Israilevich(1991) have shown that state-level regulations significantly constrain operational efficiency at banks, and it is not unusualfor bank efficiency models to include such control variables (e.g., Berger and Humphrey 1991).
19 Both Berger, Hancock, and Humphrey (1993) and DeYoung and Nolle (1996) modeled profit efficiency using a quadraticprofit function, and found that the resulting efficiency estimates were highly sensitive to asset size.
20 Berger and Mester (1997) and Bauer, Berger, Ferrier, and Humphrey (1998) estimate translog profit functions for banks. They address this problem by transforming all profits to be positive; they simply increase the measured profits of each bankby the absolute value of the largest loss (i.e., negative profit) incurred by any bank in their sample.
21 See Berger, Leusner, and Mingo (1995) for a detailed description of these transformations.
22 We set EFF = 0 banks with negative p in order to maintain a monotonic efficiency ordering. This was necessary becausea small number of banks (less than 2 percent of the Tenth District population) had both negative actual profits p and negativeestimated potential profits p+u.
23 Note that some risk averse behaviors that reduce profits, such as substituting safe securities for risky loans, or holding highlevels of expensive equity capital, will not be captured in EFFi , because EFFi is measured relative to frontier-efficient bankswith ratios of loans-to-securities and capital levels similar to bank i.
24 Berger, Hancock and Humphrey (1993), DeYoung and Nolle (1996), DeYoung and Hasan (1997), Akhavein, Swamy,Taubman, and Singamsetti (1997), and Berger, DeYoung, Genay, and Udell (1999) each found that the average bank couldat least double its profitability by eliminating all estimated profit inefficiency.
25 Because EFF was truncated for 4 of the sample banks we also estimated equation (1) using Tobit regression techniques. The Tobit results (not shown) were nearly identical to the OLS results reported in the tables.
26 We estimated a variety of additional regression specifications (not shown) to test further for monitoring effects, includingregressions excluded the HIRED dummy interaction term, regressions that included only the HIRED dummy interaction term,and regressions that used slightly different definitions for the OUTCONC and BOARDEXDMO variables. The results wererobust to these changes.
27 Note that we include URBAN in these second-stage regressions, but we include STATE in the first-stage profit frontierregression. STATE is meant to control for state-by-state differences in branching and other regulations that force some banksto choose sub-optimal mixes of inputs (e.g., fewer branch locations). Hence, STATE controls for exogenous constraintsplaced on the production technology estimated in the first-stage regression. In contrast, URBAN controls, in part, fordifferences in competitive conditions which determine the prices that small, price-taking banks receive for their productsafter these products have been produced.
28 Berger, Hancock and Humphrey (1993), DeYoung and Nolle (1996), DeYoung and Hasan (1997), and Akhavein, Swamy,Taubman, and Singamsetti (1997) all found a positive relationship between size and profit efficiency at U.S. banks. Notethat the strong correlation between size and profit efficiency does not indicate a misspecification of the profit efficiencyequation (2), because that model already includes a number of variables (e.g. total loans, total equity capital) that are stronglycorrelated with asset size.
29 The correlation between ASSETS and BOARDEXDMO is -0.24 for all banks; the correlation between ASSETS andBOARDEXDMO is -0.36 for hired-manager banks; and the correlation between ASSETS and POLICY is -0.15 for hired-manager banks. All three correlations are statistically different from zero at the 1% level. Coupled with the well establishedresult that large banks tend to be more profit efficient than small banks, these correlations suggest that the negativecoefficients on BOARDEXDMO and POLICY in regressions [3] and [4] (regressions that contained no controls for assetsize) were due to misspecification error.

37
30 See "Banks Start to Link Board Members' Pay to Corporate Performance," American Banker, March 7, 1997. Houstonand James (1995) find that the reticence to use stock options to control managers also extends to large banks.
31 The result is obtained by solving the equation (.1827)*() lnASSETS) = .0926, adding the value obtained for ) lnASSETSto the mean lnASSETS of 10.9551 for hired-manager banks, and then taking the antilog. 32 Agrawal and Knoeber (1996) argue that a firm will choose the mix of internal control mechanisms that maximizes itsvalue, and that there should be no relationship between such internal mechanisms and firm performance after theirinterdependence is taken into account. They find some support for this argument using a sample of large U.S. firms.