working paper 444 december 2016 - center for global
TRANSCRIPT
Working Paper 444December 2016
Internationally Comparable
Mathematics Scores for Fourteen
African Countries
Abstract
Internationally comparable test scores play a central role in both research and policy debates on education. However, the main international testing regimes, such as PISA, TIMSS, or PIRLS, include very few low-income countries. For instance, most countries in Southern and Eastern Africa have opted instead for a regional assessment known as SACMEQ. This paper exploits an overlap between the SACMEQ and TIMSS tests—in both country coverage, and questions asked—to assesses the feasibility of constructing global learning metrics by equating regional and international scales. I compare three different equating methods and find that learning levels in this sample of African countries are consistently (a) low in absolute terms, with average pupils scoring below the fifth percentile for most developed economies; (b) significantly lower than predicted by African per capita GDP levels; and (c) converging slowly, if at all, to the rest of the world during the 2000s. While these broad patterns are robust, average performance in individual countries is quite sensitive to the method chosen to link scores. Creating test scores which are truly internationally comparable would be a global public good, requiring more concerted effort at the design stage.
JEL Codes: I25, J24, O15, O55
Keywords: learning assessments, education quality, human capital, Africa
www.cgdev.org
Justin Sandefur

Center for Global Development2055 L Street NW
Washington, DC 20036
202.416.4000(f) 202.416.4050
www.cgdev.org
Internationally Comparable Mathematics Scores for Fourteen African Countries
Justin SandefurCenter for Global Development
The analysis here was conceived in discussions with Luis Crouch, Beth King, and Nic Spaull, and has benefited enormously from comments on an earlier draft from Barbara Bruns, Jishnu Das, and Abhijeet Singh. Maryam Akmal and Dev Patel provided excellent research assistance. The views expressed here do not necessarily reflect those of the Center for Global Development, its board, or its funders. All errors are the authors.
The Center for Global Development is grateful for contributions from the UK Department of International Development, as well as our funders and board of directors, in support of this work.
Justin Sandefur. 2016. "Internationally Comparable Mathematics Test Scores for Fourteen African Countries." CGD Working Paper 444. Washington, DC: Center for Global Development. http://www.cgdev.org/publication/math-scores-fourteen-african-countries
The Center for Global Development is an independent, nonprofit policy research organization dedicated to reducing global poverty and inequality and to making globalization work for the poor. Use and dissemination of this Working Paper is encouraged; however, reproduced copies may not be used for commercial purposes. Further usage is permitted under the terms of the Creative Commons License.
The views expressed in CGD Working Papers are those of the authors and should not be attributed to the board of directors or funders of the Center for Global Development.

Contents
1 Introduction 2
2 Data 8
3 Equipercentile linking based on countries taking both tests 10
4 Item-response theory: linking tests based on overlapping items 15
4.1 Imposing TIMSS item parameters . . . . . . . . . . . . . . . . . . . . . . . . 19
4.2 Mean-sigma equating . . . . . . . . . . . . . . . . . . . . . . . . . . . . . . . 27
5 Making sense of contradictory results 31
6 Putting African mathematics scores in context 35
7 Conclusion 38
1 Introduction
Around the developing world, and particularly in East Africa, there is growing evidence
that the expansion of primary school enrollment over the last quarter century has not deliv-
ered concomitant improvements in learning levels (Jones et al., 2014; Pritchett, 2013). The
United Nation’s 2015 global goals seek to address this imbalance by focusing on education
quality, including indicators of proficiency in literacy and numeracy. But these indicators
are not currently measurable on an international scale, particularly in Africa. Notably, only
2
three countries in Sub-Saharan Africa have participated in any of the major international
assessments of learning levels.1
My goal in this paper is to put mathematics test scores from an existing regional learning
assessment covering fourteen African countries on an international scale using both simple
statistical methods, and more formal item response theory methods. This process is known
in the psychometric literature as linking or equating, terms which I use interchangeably
here.2 The regional test is the Southern and Eastern Africa Consortium for Measuring Edu-
cation Quality (SACMEQ) assessment, and the international scale is provided by the Trends
in International Mathematics and Science Study (TIMSS), an international assessment ad-
ministered in grades three and four (population 1) and seven and eight (population 2) in
over sixty countries. This linking is possible because (a) two countries, Botswana and South
Africa, took both tests, and (b) the 2000 and 2007 SACMEQ rounds embedded a number
of items from the TIMSS test. These overlapping items were included in the African tests
with the explicit purpose of facilitating international comparisons (Ross et al., 2005, p. 71).
It appears this ex ante push for comparability was abandoned ex post. To my knowl-
edge, no reporting of SACMEQ scores on an international scale exists in the public domain.
It is widely rumored that these results were withdrawn due to the political sensitivity of
highlighting the enormous learning deficiencies in all fourteen SACMEQ countries relative
to the global distribution. There is mixed evidence to justify this political sensitivity. There
are anecdotal reports that bench-marking student performance on international assessments
has contributed to national political pressure for education reform in the OECD (Breaks-
pear, 2012), as well as some Latin American (Bruns, 2015) and Eastern European countries
1Ghana has participated in PIRLS (primary-level reading assessment), and South Africa and Botswanahave participated in both PIRLS and TIMSS (primary-level mathematics and science assessment).
2See Holland (2007) for a discussion of what makes a linking an equating; the latter generally impliesgreater rigor and comparability. In Hollard’s terminology, this exercise might be termed a ‘calibration’or ‘concordance’, as the pupil populations differ and the test constructs, difficulty, and reliability are notguaranteed to be identical.
3

(Marciniak, 2016). But experimental work in East Africa has found that dissemination of
national assessments results has little effect on local political demands for education reform
(Lieberman et al., 2014).
Politics aside, there are sound technical reasons to be cautious about any comparison of
African learning levels to international benchmarks. When comparing populations with very
different learning levels, traditional methods for test-score equating are subject to sizable
non-sampling error. The size of this ‘linking error’ is inversely proportional to the number
of overlapping items across the two the tests (Michaelides and Haertel, 2004). For instance,
Hastedt and Desa (2015) present simulations using TIMSS data to show that statistically
significant differences in country means may not be detected when the number of overlapping
items falls below roughly thirty, as is the case here.
To address these concerns, I compare the results from three different linking approaches.
The first approach is referred to as equipercentile equating or linking in the psychometric
literature (see Kolen and Brennan, 2014, chapter 4). It does not require any overlapping
test items across the two tests and does not rely on item response theory to link the two test
scales, above and beyond whatever IRT methods may have been used in construction of the
original scores. Instead, equipercentile linking as applied here depends on the existence of
data from both tests for a common population of pupils. In this case, I rely on overlapping
coverage of SACMEQ (2000) and TIMSS (2003) in Botswana and South Africa, matching
each percentile of the SACMEQ distribution to the corresponding percentile of the TIMSS
distribution. Lee and Barro (2001), Altinok and Murseli (2007), and Altinok et al. (2014)
have all applied simpler versions of this approach to link various regional and international
tests, relying only on country means and variances; here I apply non-parametric methods
to the full distribution and take a more conservative approach to identifying comparable
populations of test-takers. Nevertheless, this procedure assumes that SACMEQ and TIMSS
4

true scores are highly predictive of each other, and that this relationship is stable across
countries. The first assumption is not testable with my data, and I find some violation of
the second assumption when comparing results for Botswana and South Africa.3
A second, alternative approach using item-response theory relies on overlapping items
across the two tests, rather than overlapping coverage in the populations tested. Das and
Zajonc (2010) apply IRT methods to estimate TIMSS-equivalent scores for two states in
India, and Singh (2014) applies the same procedure to regions of Ethiopia, India, Peru,
and Vietnam. The two central assumptions here, as in most applications of item response
theory, are unidimensionality and parameter invariance. The linking procedure implicitly
assumes SACMEQ and TIMSS measure the same, singular underlying trait (which I refer to
as math proficiency), and the relationship between a student’s overall math proficiency and
performance on any given test item is invariant across populations and demographic groups.
Violations of these assumptions manifest themselves through differential item functioning
(DIF), in which students with similar proficiency levels in different groups (in this case, the
SACMEQ African sample versus the broader TIMSS sample) perform better or worse on a
given item. While teachers in the SACMEQ sample pool quite well with the TIMSS sample,
SACMEQ pupils exhibit high levels of DIF, casting some doubt on these estimates, which
are considerably higher than the other two approaches – and well above the actual TIMSS
scores measured for Botswana and South Africa.
A complication to this approach is that the SACMEQ pupil test includes only a few
TIMSS items; however, the SACMEQ teacher test includes a longer list of TIMSS items,
and the SACMEQ teacher and pupil tests also share a longer list of items. Thus I present an
3An alternative approach to linking international assessments that has been used and widely cited in theeconomics of education literature (Hanushek and Kimko, 2000; Hanushek and Woessmann, 2012) abstractsentirely from the content of the test or the distribution of pupil scores, and uses assumptions about thevariance of country averages around the world to link the global distributions of various assessments. SeeAltinok et al. (2014) for a critique of this approach.
5

extension of standard linking methodologies, effectively creating a chain linkage from TIMSS
to the SACMEQ teacher test and then, in turn, to the SACMEQ pupil test.
The third approach I employ also relies on item response theory, but is potentially less
sensitive to DIF. This approach, known as mean-sigma equating, is commonly applied to
link, e.g., subsequent rounds of testing regime. Rather than imposing all of the item level
parameters from the reference population (TIMSS) on the target population (SACMEQ), it
ensures only that the average level of difficulty and discrimination for the overlapping items
are held constant across the two populations. Estimates based on the mean-sigma approach
are largely congruent with the equipercentile method as well as the actual TIMSS scores for
Botswana and South Africa.
Substantively, the results here are daunting for African education systems. Most of the
national test-score averages I estimate for the thirteen African countries in my sample fall
more than two standard deviations below the TIMSS average, which places them below the
5th percentile in most European, North American, and East Asian countries. In contrast,
scores from the SACMEQ test administered to math teachers are much higher, but fall only
modestly above the TIMSS sample average for seventh- and eighth-grade pupils, in line with
earlier analysis by Spaull and van der Berg (2013). African test scores appear low relative
to national GDP levels; in a regression of average scores on per capita GDP in PPP terms,
average scores in the SACMEQ sample are significantly below the predicted value using
all three linking methodologies. Furthermore, there is little sign that African scores were
improving rapidly or converging to OECD levels during the 2000s.
A major caveat in interpreting these comparative results is that the SACMEQ test is
administered to pupils in grade 6 in most countries, while TIMSS is administered to pupils
in grades 7 or 8. Thus African pupils are one to two grades below their OECD counterparts
when sitting these tests. However, there is some virtue to this difference. Because pupils
6

in the African sample tend to be much older at a given grade level, the average age of the
pupils in the SACMEQ and TIMSS data is quite similar. In most countries, the modal age
in each case is fourteen.4
Methodologically, this exercise demonstrates the feasibility of comparing regional and
international test scores on a common scale, but also highlights the fragility of this linking
when relying on a very short set of anchoring items and attempting to span populations
with widely disparate learning levels. Results differ across methodologies more than one
might wish for drawing confident policy conclusions. When pooling original TIMSS scores
with SACMEQ scores re-calibrated to the TIMSS scale using each of the three methods
described here, the Spearman rank correlations of the country averages are 0.97 or higher,
but the absolute level of scores varies by more than half a standard deviation in some
cases. I conclude that future efforts to build a global learning metric should clearly focus on
expanding the set of anchoring items across these tests.
The next section describes the SACMEQ and TIMSS data, and the overlapping items.
Section 3 compares scores from the two tests without using (additional) item-response theory
assumptions, based on a simple non-parametric approach known as equipercentile linking.
Section 4 presents my core approach to equating the scales, extending the IRT model used
to estimate TIMSS scores to the SACMEQ sample based on overlapping items. The various
linking approaches do not entirely agree, and I discuss how to reconcile the results in Section
5. Section 6 steps back to examine the basic substantive findings on mathematics scores in
the African sample that are relatively robust across methods. Section 7 concludes.
4Note that while both TIMSS and SACMEQ use grade-based sampling, other major international assess-ments such as PISA use age-based sampling.
7
2 Data
The SACMEQ project is a regional learning assessment sponsored by UNESCO’s Institute for
International Education Planning (IIEP). The test is administered by ministries of education
in the participating countries, with technical assistance from UNESCO. The test is multiple
choice and the content is uniform across countries and not tailored to national curricula. The
range of competencies covered in the mathematics test are described in Hungi et al. (2010).
The sample is school based and grade based, i.e., pupils are sample from those found in the
sampled schools without attempting to reach children not in school, and pupils are sampled
from grade 6, regardless of their age.
Data collection for SACMEQ I was completed in 1995 in seven countries, and the list
of participating countries expanded to thirteen for SACMEQ II in 2000, and fourteen for
SACMEQ III in 2007.5 In round 2, which is the focus of the analysis here, the sample
included roughly 150 schools per country and a total of approximately 40,000 pupils across
the thirteen countries. Country-specific sample sizes are reported in Table 1.
While SACMEQ and TIMSS test different grades, the average age of the sixth-graders
in the SACMEQ sample (13.8 years) is fairly similar to the average age of the seventh- and
eighth-graders in the TIMSS sample (14.4), and considerably older than the TIMSS third-
and fourth-graders (10.3). Note, however, that this is less true when comparing within
countries in South Africa and Botswana, who participated in both SACMEQ and TIMSS
(only at the eighth-grade level). In both cases, the SACMEQ sample is nearly two years
younger than the TIMSS sample.
All SACMEQ scores are based on a Rasch model, with a scale standardized to have a
mean of 500 and a standard deviation of 100 for the full sample in 2000. Looking across
5Note that the Ministry of Education of Zanzibar, a region of Tanzania, is an independent member ofSACMEQ, so project documents typically refer to fourteen Ministries of Education in SACMEQ II ratherthan thirteen countries.
8

Table 1: Summary statistics before equating
Pupils: mean (sd) Teachers Obs.
Age Score Score Pupils Teachers Schools
SACMEQ 2000, grade 6:
Mauritius 11.3 585 2870 147(.5) (140)
Kenya 14 562 967 3296 263 185(1.6) (87) (107)
Seychelles 11.6 554 868 1482 44 24(.4) (107) (78)
Mozambique 14.7 530 789 3136 308 173(1.9) (56) (99)
Swaziland 13.8 518 804 3138 167 168(1.7) (66) (86)
Tanzania 15.1 517 792 2849 184 181(1.5) (85) (82)
Botswana 13.2 513 751 3321 393 170(1.2) (82) (78)
Uganda 14.2 506 827 2619 127 162(1.8) (108) (114)
South Africa 13.1 483 3135 167(1.6) (110)
Zanzibar 14.9 476 686 2459 162 144(1.6) (63) (84)
Lesotho 14.1 448 737 3144 231 176(1.8) (60) (73)
Malawi 14.6 434 770 2323 134 140(2.2) (56) (84)
Zambia 14 432 749 2590 286 172(1.7) (73) (86)
Namibia 13.8 431 731 4990 326 267(1.9) (83) (111)
TIMSS 2003:
All countries, grade 4 10.3 492 127896 3895(.7) (108)
All countries, grade 8 14.4 463 237833 7008(.8) (112)
Botswana (grade 8) 15.1 366 5150 146(1) (65)
South Africa (grade 8) 15.1 264 8952 255(1.3) (100)
The SACMEQ and TIMSS scores reported here are not comparable. The table reportssample means and standard deviations using the IRT scores as reported by SACMEQand TIMSS, respectively, using sample weights reflecting countries’ pupil populations andthe survey design. Note that SACMEQ pupil and teacher scores are comparable acrosscountries, but are not comparable to each other before equating.
9

countries in Table 1, the gap between the highest-scoring country (Mauritius) and the lowest
scoring (Namibia) is approximately 150 points. This scale was maintained to enable trend
analysis between 2000 and 2007 in SACMEQ III, during which time average math scores
increased by roughly 10 points (Makuwa, 2010).
SACMEQ also administers a math test to grade 6 math teachers in sampled schools.
Approximately 3,300 math teachers took this test in 2000. There are very large cross-
country gaps in teacher performance in the data, with Kenyan teachers posting an average
score of 967, while teachers in Zanzibar post scores nearly three standard deviations lower,
with an average of just 686. Note that the teacher test contains an overlapping set of items
with the pupil test, and can be placed on a common scale, but the official scores reported
in Table 1 are not directly comparable between teachers and students before the equating
process developed in the following sections.
Focusing exclusively on the set of common items administered to both pupils and teachers,
pupils answered an average of 28% of items correctly, while teachers answered 73% correctly.
Across countries, pupils’ percent correct ranged from just over 20% in Malawi and Zambia
to 41% in Mauritius (the latter country did not administer the teacher test). Teacher scores
ranged from just 58% in Zanzibar to 91% in Kenya. The full distribution of pupil and teacher
raw scores by country is shown in Figure 10 in the appendix.
3 Equipercentile linking based on countries taking
both tests
Before delving into the item-level data, it is possible to compare SACMEQ and TIMSS
scores at a fairly granular level while taking the official, total, score per student as given.
A common approach to comparing test scales without the use of item response theory is
10

known as equipercentile equating or linking (see Kolen and Brennan, 2014, chapter 4). This
procedure is conceptually simple, but requires strong assumptions that are not testable
without data on both tests from the same sample of test-takers.
The basic approach here is to match each percentile of the test score distribution on
the target test (SACMEQ) to its corresponding percentile on the reference test (TIMSS).
Clearly, the validity of this link hinges on (a) the two populations being tested having the
same distribution of underlying proficiency, and (b) the two tests capturing the same measure
of math proficiency.
To restrict estimation to comparable distributions, I focus on data from the two countries
that participated in both SACMEQ and TIMSS: Botswana and South Africa. Both tests
drew nationally representative populations: SACMEQ of sixth-graders in 2000 and TIMSS
of eighth-graders in 2003. On the question of content, SACMEQ was designed to capture
similar conceptual content to TIMSS at a broad level. Though as I show in the following
sections, performance on TIMSS items in the SACMEQ sample is imperfectly correlated with
overall SACMEQ performance. Nevertheless, for the purpose of the equipercentile equating
in this section, I proceed under the assumption that the two tests would yield a perfect rank
order correlation when applied to pupils at either grade level and at either point in time.
At a practical level, equipercentile equating consists of two basic steps. In the first step,
the researcher estimates the percentiles of the target and reference tests. Here I use one
hundred raw percentiles from each distribution. (An alternative approach common in the
psychometric literature, is to use one of various methods to ‘pre-smooth’ these densities.)
After equating the percentiles from the respective tests, the second step is to estimate a
continuous relationship between the two score distributions, known as post-smoothing. I use
a cubic spline function with knots at the score deciles to post-smooth the SACMEQ-TIMSS
score relationship. The main purpose of post-smoothing in this application is interpolation,
11

to provide a correspondence for test scores not observed in the two country samples used for
equating.
Turning to the results, there is some cause for concern about the adequacy of equiper-
centile linking in this context, and I stress that the results here are intended to be illustrative
of the method, rather than providing a definitive linking.
While Botswanan students score more than a quarter of a standard deviation higher on
SACMEQ than South African students – 513 versus 486 on average – the kernel densities
for the two countries show that their score distributions overlap considerably (Figure 1a).
The performance gap between the countries appears considerably larger on TIMSS, where
Botswana’s average score is a full one-hundred points higher than South Africa’s: 366 versus
263 on average. The South African average falls below the fifth percentile on the Botswana
distribution (Figure 1b). (Interestingly, South Africa outperforms Botswana at the very top
of the distribution in both tests, consistent with South Africa’s highly unequal education
system.)
The fact that relative country performance across most of the distribution differs so
dramatically on the two tests suggests that link between SACMEQ and TIMSS scores is
unlikely to be stable across the two countries. This is indeed what Figure 1c shows. The
figure equates the percentiles of the SACMEQ distribution to the corresponding percentile of
the TIMSS distribution for each country, as well as a combined distribution that gives equal
weight to observations from each country. The circles and crosses on the graph denote raw
percentiles, while the gray lines show a local polynomial fit of the relationship between TIMSS
and SACMEQ percentiles (known as “post-smoothing” in the psychometric literature).
In Botswana, a SACMEQ score of 400 is just below the eighth percentile, which is equiv-
alent to a 279 on the TIMSS scale. In South Africa, the same SACMEQ score would be in
the twentieth percentile, which is equivalent to a score between 180 and 190 on TIMSS. So
12

Figure 1: Equipercentile equating
(a) Kernel densities for SACMEQ
0
.002
.004
.006
Den
sity
0 200 400 600 800 1000SACMEQ 2000 grade 6 math score
South Africa Botswana
(b) Kernel densities for TIMSS
0
.002
.004
.006
Den
sity
0 200 400 600 800TIMSS 2003 grade 8 math score
South Africa Botswana
(c) Matching raw percentiles (and post-smoothing)
100
200
300
400
500
600
TIM
SS 2
003
grad
e 8
mat
h sc
ore
200 400 600 800 1000SACMEQ 2000 grade 6 math score
South Africa Botswana Combined
13

Figure 2: Country rankings: TIMSS grade 8 scale, equipercentile linking
0 200 400 600 800TIMSS grade 4 scale
NamibiaMalawiZambia
South Africa (TIMSS)Lesotho
GhanaSouth Africa
ZanzibarUganda
BotswanaSaudi Arabia
TanzaniaSwaziland
MozambiqueSyria
Botswana (TIMSS)SeychellesPhilippines
KenyaMorocco
ChilePalestineMauritius
BahrainEgypt
TunisiaIndonesia
IranJordan
LebanonFYR Macedonia
CyprusMoldovaNorway
RomaniaBulgaria
SerbiaArmeniaSlovenia
ItalySpain
N. ZealandIsrael
UKSweden
LithuaniaUSA
AustraliaSlovak Republic
RussiaLatvia
MalaysiaCanadaHungaryEstonia
NetherlandsBelgium
JapanTaiwan
Hong KongKorea
Singapore
5th percentile Mean 95th percentile
14

the predicted TIMSS score for children with a given SACMEQ score differs by roughly a full
standard deviation, depending on which country is used to make the link.
The reliability of the link varies across the score distribution, as seen in Figure 1c. The
gap between the Botswana and South Africa results is large at the lower end of the scale and
remains large up until a SACMEQ score of approximately 600 (around the 85th percentile
in both countries); at the very top of the distribution the gap narrows considerably, with
a discrepancy of roughly fifteen points in predicted TIMSS scores (500 versus 485) for a
SACMEQ score of 700 (the 98th percentile in Botswana and the 95th in South Africa).
Setting aside these methodological concerns, equipercentile linking places the African
countries in SACMEQ firmly at the bottom of the TIMSS country rankings. (See Figure
2.) All fourteen countries post average scores with a TIMSS equivalent of less than 400,
and in some cases dramatically lower (e.g., Zambia, Malawi, and Namibia at or below 250).
Based on this simple equating method, the fifteen African countries participating in either
test occupy fifteen of the bottom twenty places on the country ranking in Figure 2, as well
as nine of the bottom ten slots.
4 Item-response theory: linking tests based on over-
lapping items
Both the SACMEQ and TIMSS tests are built on an item response theory (IRT) framework,
which generates test scores by modeling the probability a given pupil answers a given test
item correctly as a function of pupil- and item-specific characteristics. In principle, the same
core assumptions required to estimate these IRT models for a given test also make it possible
to apply the item parameters to a new population and generate comparable scores for pupils
who sit the same test items.
15

Figure 3: Heuristic of overlapping math items
The Venn diagram shows the overlapping or “anchor” items linking the SACMEQ2000 pupil and teacher tests to the TIMSS 1995 test of seventh- and eighth-graders.
For the purposes of this paper, a key feature of SACMEQ II is the inclusion of a sub-set
of items taken from the TIMSS 1995 round. This overlap is documented in an appendix to
a methodological chapter written by the core SACMEQ team and reproduced in each of the
national reports, e.g., Ross et al. (2005).6 I provide a heuristic depiction of the SACMEQ-
TIMSS overlap in Figure 3. The SACMEQ pupil test embeds six anchoring items from the
TIMSS grade 3 and 4 test, and just three items from the TIMSS grade 7 and 8 test. The
SACMEQ teacher test serves as an additional link, however, between the SACMEQ and
TIMSS scales. The teacher test contains thirteen items from the SACMEQ pupil test and
eighteen items from the TIMSS grade 7 and 8 test. Together, these overlapping items form
the basis of the IRT linking methodology described below.
6I’m grateful to Nic Spaull for pointing me to this appendix.
16

Even without any recourse to item response theory, the raw percentage-correct scores
on these overlapping items shows that SACMEQ teachers perform somewhat better than
seventh- and eighth-graders in the TIMSS sample, 58% to 41%, and unsurprisingly, that
SACMEQ teachers perform much better than their pupils, 76% to 29%. (Out of the sev-
enteen overlapping questions between SACMEQ teachers and TIMSS pupils, there is just
one exception where the latter perform better, and on the thirteen overlapping questions
between SACMEQ teachers and pupils, there are no exceptions. See Table 2.) The core of
the IRT linking methodology is to connect those two ratios, though instead of percentage
correct, I rely on parameters from a conditional logit model.
Some direct comparisons between TIMSS and SACMEQ pupils are also possible, without
passing through the teacher test. While I focus here on the TIMSS grade 7 and 8 sample,
the grade 3 and 4 test has more direct overlap with SACMEQ. TIMSS pupil performance
strictly dominates SACMEQ pupils on all overlapping questions, despite the latter being on
average four years older.
The correct answer percentages are also informative about the relative difficulty of the
different tests. One might expect that in designing the SACMEQ test, researchers would
complement the TIMSS items with additional items that were considerably easier, to extend
the TIMSS scale on the low end for a context where learning levels are anticipated to be
low. This did not happen to any great extent. On average SACMEQ pupils answered 32%
of the TIMSS items correctly and 39% of the non-TIMSS items correctly, implying that the
items unique to SACMEQ were not dramatically easier.7
In the following sub-sections I present two IRT-based methods for linking SACMEQ
scores to the TIMSS scale using these overlapping items. Both approaches make use of the
published item-level parameters from the IRT model underlying the TIMSS scale, combined
7These numbers differ from the numbers in Table 2 because they include TIMSS grade 3 and 4 items thatappeared on the SACMEQ pupil test.
17

Table 2: Anchoring items: percent correct
TIMSS SACMEQ SACMEQPupils Teachers Pupils
Item ID (1) (2) (3)
tmath04 61.1 94.1tmath09 53.7 63.7tmath17 41.1 40.4tmath18 43.4 56.1tmath19 41.6 46.8tmath20 38.4 55.9tmath22 38.9 73.7tmath23 32.2 35.9tmath24 31.8 59.1tmath25 22.7 48.6tmath26 47.1 78.4tmath27 33.8 63.2tmath29 41.8 64.1tmath30 44.3 50.7tmath31 40.1 60.6tmath34 40.8 44.2pmath63 38.6 48.6 22.8pmath26 41.9 18.6pmath27 92.0 30.4pmath28 82.5 42.2pmath29 78.6 50.2pmath30 69.3 22.6pmath32 85.0 20.1pmath33 81.7 18.4pmath44 86.5 27.8pmath55 50.8 16.8pmath56 92.5 28.1pmath57 82.9 24.4pmath58 92.0 51.5pmath47 86.8 36.3pmath50 84.5 36.8
Average on overlapTIMSS to SACMEQ teachers 40.7 57.9SACMEQ teachers to pupils 75.7 28.8
Note that one of the 17 items shown in Figure 3 in the overlap betweenTIMSS and the SACMEQ teacher test is not listed here. It is a partialcredit item dropped from the 3PL IRT model used in the analysis.
18

with new estimates of the TIMSS IRT model using the SACMEQ data. In the first approach,
the item-level parameter estimates from the TIMSS sample are imposed as constraints when
performing estimation with the SACMEQ data, following the procedure outlined by Das and
Zajonc (2010). In the second approach, I estimate item-level parameters from the SACMEQ
data without imposing these constraints, then rescale the parameters ex post so that the
average difficulty and discrimination parameters for the overlapping items match the TIMSS
estimates.
In both methods, the linking requires two steps: first to put SACMEQ teacher scores on
the TIMSS scale, then to make SACMEQ pupil scores comparable to the re-scaled teacher
scores.
4.1 Imposing TIMSS item parameters
Taking a step back, TIMSS items differ in their difficulty and in their discrimination. Because
not all students answer the same set of questions, TIMSS relies on item response theory (IRT)
methods to estimate the item-specific and student-specific components of the score. This
requires specification of an item-response function (IRF). The parameters of the IRF are
estimated on a sub-set of TIMSS students, known as the calibration sample, and are then
applied to all students to create scaled scores.
Here I offer only a brief summary of the scaling methodology used in TIMSS; for a full
exposition see Gonzalez et al. (2004). SACMEQ II drew items from the original 1995 TIMSS
round. From 1999 onward, TIMSS has used an IRF based on a three-parameter (3PL) logistic
model, which was applied retrospectively to the 1995 data as well. Let xij ∈ {0, 1} denote
the response of individual i to item j, where 0 indicates an incorrect response and 1 a correct
response. The IRF gives the probability that i answers a given item correctly conditional
on her mathematics proficiency, θi, and the item’s discrimination, aj (i.e., how quickly the
19

probability of a correct answer increases as overall math proficiency increases), difficulty, bj,
and the probability of guessing correctly, cj.
Pr(xij = 1|aj, bj, cj, θi) = cj + (1− cj)exp{ai(θi − bj)}
1 + exp{aj(θi − bj)}. (1)
As an aside on terminology, the latent variable θ is often referred to as “ability” in
the psychometric literature, whereas labor economists typically reserve the term ability for
an innate, unteachable, and often unobservable form of intelligence. To avoid confusion, I
refer to θ as mathematics proficiency, or just proficiency. There is no suggestion here that
proficiency is innate. Rather, it is a measure of a pupil’s learning level as determined by
school quality and other influences. The variable is latent in the sense that a pupil’s true
proficiency is a population parameter, which one might think of as their true score across
infinite attempts on a population of infinite test items on the TIMSS scale.
Parameter estimates for equation (1) for the grade 7 and 8 TIMSS 1995 items were
published in an appendix to the 1999 technical report (Martin et al., 2000). I use these
estimates to link SACMEQ scores to the TIMSS grade 7 and 8 scale used from 1999 onward.
Unfortunately, it is not possible to do this for the grade 3 and 4 test, which I can only
link to the 1995 scale.8 Because linking for these lower grades relies on a smaller set of
overlapping items, is restricted to a one-parameter Rasch model, and uses a TIMSS scale
that was abandoned in the 2000s, I relegate this analysis to an appendix.
Rather than use existing SACMEQ scores, I estimate them using equation (1) and the
item-level micro data.9
8When testing of fourth-graders resumed in 2003, this scale was also updated, and 3PL estimates for thefourth-grade items were published in the 2003 technical report (Mullis et al., 2004). The unique identifiersattached to the items were changed in 1999. The TIMSS codebooks from 1999 provide a link to the original1995 item codes for grades 7 and 8, but the 2003 codebooks do not provide a similar link for grades 3 and 4.
9This is necessary for two reasons. First, to my knowledge, the item parameters for SACMEQ are notpublicly available. The publicly released data does include IRT-based scores (i.e., pupil-level estimates of
20

Das and Zajonc (2010) offer a clear exposition of the challenges to estimating IRT pupil
parameters based on a relatively short list of test items. The central issue they highlight
is that standard maximum likelihood estimates of θi proficiency parameters in equation
(1) will overstate the variance of the test score distribution, combining true variance and
measurement error. An alternative approach based on Bayesian methods (EAP) will tend
to understate the true test score variance. Intuitively, a short list of items provides little
information to update the posterior about the proficiency of any given individual and instead
estimates are clustered near the prior. Mislevy et al. (1992) proposed a method to overcome
this challenge, by drawing a sample of ‘plausible values’ for student i’s true test score from
the posterior estimate of θi. Das and Zajonc (2010) outline a method of estimating these
plausible values using a Markov Chain Monte Carlo (MCMC) method, and provide code
to implement this approach in Stata (Zajonc, 2009), which I employ here. These plausible
values are used to analyze the test score distributions in the tables and figures that follow.
Estimation proceeds in two steps. In the first step, I estimate equation 1 using the
SACMEQ teacher data, holding parameters on the overlapping TIMSS items to match the
published TIMSS estimates. In the second step, I estimate equation 1 again, this time using
the SACMEQ pupil data, holding constant the parameters on the overlapping items from the
teacher test. Estimation at each step yields estimates of the latent variable, math proficiency,
for individual teachers and pupils, respectively.
Item-characteristic curves (ICC) based on the estimated item-level parameters from equa-
tion (1) are shown in Figures 4 (for the TIMSS-SACMEQ teacher link) and Figure 5 (for
the SACMEQ teacher-pupil link) for the overlapping items. Lines show the estimated ICC
θi), which according to the SACMEQ reports are based on a one-parameter Rasch model (equivalent toimposing a = 1 and c = 0 for all j in equation (1)). I can reproduce these published SACMEQ scores byestimating a Rasch model with the SACMEQ item-level microdata, yielding a correlation of 0.99 at the pupillevel. Second, for comparison with TIMSS scores it is preferable to apply the more flexible three-parametermodel that underlies the contemporary TIMSS scale.
21

Figure 4: DIF: SACMEQ teachers vs. IRF from TIMSS 7th- and 8th-graders
(a) Item 4
0
.2
.4
.6
.8
1Pr
obab
ility
corre
ct
-3 -2 -1 0 1 2 3Proficiency (theta)
(b) Item 9
0
.2
.4
.6
.8
1
Prob
abilit
y co
rrect
-3 -2 -1 0 1 2 3Proficiency (theta)
(c) Item 17
0
.2
.4
.6
.8
1
Prob
abilit
y co
rrect
-3 -2 -1 0 1 2 3Proficiency (theta)
(d) Item 18
0
.2
.4
.6
.8
1
Prob
abilit
y co
rrect
-3 -2 -1 0 1 2 3Proficiency (theta)
(e) Item 19
0
.2
.4
.6
.8
1
Prob
abilit
y co
rrect
-3 -2 -1 0 1 2 3Proficiency (theta)
(f) Item 20
0
.2
.4
.6
.8
1
Prob
abilit
y co
rrect
-3 -2 -1 0 1 2 3Proficiency (theta)
(g) Item 22
0
.2
.4
.6
.8
1
Prob
abilit
y co
rrect
-3 -2 -1 0 1 2 3Proficiency (theta)
(h) Item 23
0
.2
.4
.6
.8
1
Prob
abilit
y co
rrect
-3 -2 -1 0 1 2 3Proficiency (theta)
(i) Item 24
0
.2
.4
.6
.8
1
Prob
abilit
y co
rrect
-3 -2 -1 0 1 2 3Proficiency (theta)
(j) Item 25
0
.2
.4
.6
.8
1
Prob
abilit
y co
rrect
-3 -2 -1 0 1 2 3Proficiency (theta)
(k) Item 26
0
.2
.4
.6
.8
1
Prob
abilit
y co
rrect
-3 -2 -1 0 1 2 3Proficiency (theta)
(l) Item 27
0
.2
.4
.6
.8
1
Prob
abilit
y co
rrect-3 -2 -1 0 1 2 3
Proficiency (theta)
(m) Item 28
0
.2
.4
.6
.8
1
Prob
abilit
y co
rrect
-3 -2 -1 0 1 2 3Proficiency (theta)
(n) Item 29
0
.2
.4
.6
.8
1
Prob
abilit
y co
rrect
-3 -2 -1 0 1 2 3Proficiency (theta)
(o) Item 30
0
.2
.4
.6
.8
1
Prob
abilit
y co
rrect
-3 -2 -1 0 1 2 3Proficiency (theta)
(p) Item 31
0
.2
.4
.6
.8
1
Prob
abilit
y co
rrect
-3 -2 -1 0 1 2 3Proficiency (theta)
(q) Item 34
0
.2
.4
.6
.8
1
Prob
abilit
y co
rrect
-3 -2 -1 0 1 2 3Proficiency (theta)
Note: Dots represent the observed percent correct for SACMEQ teachers. Linesshow the predicted percent correct based on the estimated IRF for TIMSS pupilsin grades 7 and 8.
22

Figure 5: DIF: SACMEQ pupils vs. IRF from SACMEQ teachers
(a) Item 26
0
.2
.4
.6
.8
1
Prob
abilit
y co
rrect
-3 -2 -1 0 1 2Proficiency (theta)
(b) Item 27
0
.2
.4
.6
.8
1
Prob
abilit
y co
rrect
-3 -2 -1 0 1 2Proficiency (theta)
(c) Item 28
0
.2
.4
.6
.8
1
Prob
abilit
y co
rrect
-3 -2 -1 0 1 2Proficiency (theta)
(d) Item 29
0
.2
.4
.6
.8
1
Prob
abilit
y co
rrect
-3 -2 -1 0 1 2Proficiency (theta)
(e) Item 30
0
.2
.4
.6
.8
1
Prob
abilit
y co
rrect
-3 -2 -1 0 1 2Proficiency (theta)
(f) Item 32
0
.2
.4
.6
.8
1
Prob
abilit
y co
rrect
-3 -2 -1 0 1 2Proficiency (theta)
(g) Item 33
0
.2
.4
.6
.8
1
Prob
abilit
y co
rrect
-3 -2 -1 0 1 2Proficiency (theta)
(h) Item 44
0
.2
.4
.6
.8
1
Prob
abilit
y co
rrect
-3 -2 -1 0 1 2Proficiency (theta)
(i) Item 55
0
.2
.4
.6
.8
1
Prob
abilit
y co
rrect
-3 -2 -1 0 1 2Proficiency (theta)
(j) Item 56
0
.2
.4
.6
.8
1
Prob
abilit
y co
rrect
-3 -2 -1 0 1 2Proficiency (theta)
(k) Item 57
0
.2
.4
.6
.8
1
Prob
abilit
y co
rrect
-3 -2 -1 0 1 2Proficiency (theta)
(l) Item 58
0
.2
.4
.6
.8
1
Prob
abilit
y co
rrect
-3 -2 -1 0 1 2Proficiency (theta)
(m) Item 63
0
.2
.4
.6
.8
1
Prob
abilit
y co
rrect
-3 -2 -1 0 1 2Proficiency (theta)
(n) Item 47∗
0
.2
.4
.6
.8
1
Prob
abilit
y co
rrect
-3 -2 -1 0 1 2Proficiency (theta)
(o) Item 50∗
0
.2
.4
.6
.8
1
Prob
abilit
y co
rrect
-3 -2 -1 0 1 2Proficiency (theta)
Note: Dots represent the observed percent correct for SACMEQ pupils. Linesshow the predicted percent correct based on the estimated IRF for SACMEQteachers.∗ Items 47 and 50 are not on the teacher test, but are included in both the TIMSSand SACMEQ pupil tests. The IRF shown is based on the TIMSS parameters.
23

based on the fixed parameters from the reference population and circles show the average
percent correct from the ‘target’ or ‘focal’ population.
These figures address the central question in evaluating any IRT modeling exercise,
namely whether the TIMSS parameters produce a reasonable fit when applied to SACMEQ
teacher data, and in turn, whether SACMEQ teacher parameters produce a reasonable fit
when applied to SACMEQ pupil data. The standard approach to this question is to test for
differential item functioning (DIF). If the TIMSS parameters from equation (1) are appro-
priate for the SACMEQ teacher data, then, e.g., a TIMSS pupil and a SACMEQ teacher
with the same estimated proficiency level should have the same probability of answering a
given item correctly, Ptimss(θ) = Psacmeq(θ). If this condition fails to hold, the underlying
assumptions of the IRT model are cast in doubt.
Standard approaches to exploring DIF, such as the Mantel-Haenszel (MH) test statistic,
are not feasible in this context, as they require item-level data for both the reference (e.g.,
TIMSS) and focus (SACMEQ) groups, and the former are not available here.10 Instead, I
rely on a simple area metric similar to that originally proposed by Raju (1988), measuring
the distance between the item-characteristic curve (ICC) for the reference population and
the actual responses for the focal group.
Area =∑
k∈ref,foc
∆θk|Pref (θ)− Pfoc(θ)| (2)
Somewhat surprisingly, DIF is a much greater problem in the second linking step than
the first: it appears more feasible to link SACMEQ teachers to TIMSS pupils than SACMEQ
pupils. This is immediately evident in comparing the graphs in Figures 4 and 5. The area
10I am able to perform MH tests for some grade 3 and 4 TIMSS items, as reported in Table 6 in theappendix. As noted above, TIMSS does publish item level data. However, the required item-level identifiersare not available to link the TIMSS item-level data to the published 3PL parameters for the grade 7 and 8scale for the 1995 round. An additional complication is that the TIMSS grade 7 and 8 items used in SACMEQwere spread across booklets and never administered jointly to the same pupil in the TIMSS sample.
24
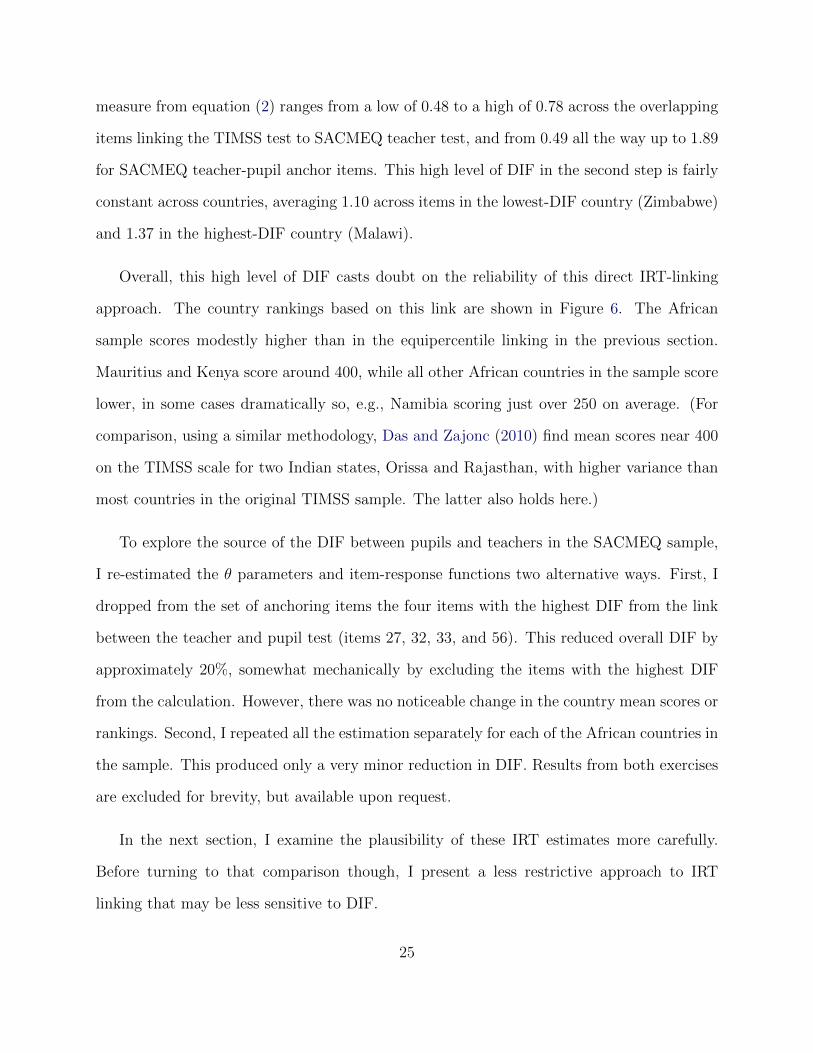
measure from equation (2) ranges from a low of 0.48 to a high of 0.78 across the overlapping
items linking the TIMSS test to SACMEQ teacher test, and from 0.49 all the way up to 1.89
for SACMEQ teacher-pupil anchor items. This high level of DIF in the second step is fairly
constant across countries, averaging 1.10 across items in the lowest-DIF country (Zimbabwe)
and 1.37 in the highest-DIF country (Malawi).
Overall, this high level of DIF casts doubt on the reliability of this direct IRT-linking
approach. The country rankings based on this link are shown in Figure 6. The African
sample scores modestly higher than in the equipercentile linking in the previous section.
Mauritius and Kenya score around 400, while all other African countries in the sample score
lower, in some cases dramatically so, e.g., Namibia scoring just over 250 on average. (For
comparison, using a similar methodology, Das and Zajonc (2010) find mean scores near 400
on the TIMSS scale for two Indian states, Orissa and Rajasthan, with higher variance than
most countries in the original TIMSS sample. The latter also holds here.)
To explore the source of the DIF between pupils and teachers in the SACMEQ sample,
I re-estimated the θ parameters and item-response functions two alternative ways. First, I
dropped from the set of anchoring items the four items with the highest DIF from the link
between the teacher and pupil test (items 27, 32, 33, and 56). This reduced overall DIF by
approximately 20%, somewhat mechanically by excluding the items with the highest DIF
from the calculation. However, there was no noticeable change in the country mean scores or
rankings. Second, I repeated all the estimation separately for each of the African countries in
the sample. This produced only a very minor reduction in DIF. Results from both exercises
are excluded for brevity, but available upon request.
In the next section, I examine the plausibility of these IRT estimates more carefully.
Before turning to that comparison though, I present a less restrictive approach to IRT
linking that may be less sensitive to DIF.
25

Figure 6: Country rankings: IRT linking using TIMSS item parameters
0 200 400 600 800TIMSS grade 7 & 8 scale
NamibiaSouth Africa (TIMSS)
ZambiaGhanaMalawi
South AfricaLesotho
ZanzibarUganda
Saudi ArabiaBotswanaSwaziland
SyriaBotswana (TIMSS)
SeychellesPhilippines
MoroccoChile
TanzaniaPalestine
MozambiqueKenya
BahrainEgypt
TunisiaIndonesia
IranJordan
MauritiusLebanon
FYR MacedoniaCyprus
MoldovaNorway
RomaniaBulgaria
SerbiaArmenia
Zanzibar: TeachersSlovenia
ItalySpain
N. ZealandIsrael
UKSweden
LithuaniaUSA
AustraliaSlovak Republic
RussiaLatvia
MalaysiaNamibia: TeachersLesotho: Teachers
CanadaHungaryEstonia
Botswana: TeachersNetherlands
BelgiumZambia: TeachersMalawi: Teachers
Tanzania: TeachersJapan
Mozambique: TeachersSwaziland: Teachers
Uganda: TeachersTaiwan
Hong KongKorea
SingaporeSeychelles: Teachers
Kenya: Teachers
5th percentile Mean 95th percentile
26

4.2 Mean-sigma equating
The conditional logit parameters from standard IRT models such as equation (1) have an
indeterminate scale up to any linear transformation. Comparing estimates of parameters
from overlapping items resolves this indeterminacy. The previous section imposed the con-
straint that these parameters be identical, item by item. Here I rely on a less restrictive
method that benchmarks the average difficulty and discrimination of the overlapping items
as a whole. This procedure, known as “mean-sigma” equating (Kolen and Brennan, 2014)
in the psychometric literature, produces a single linear transformation to be applied to the
non-overlapping items.11
I begin by estimating equation (1) separately for SACMEQ teachers and pupils, without
imposing parameter constraints. The estimated item-level parameters for the overlapping
parameters are reported in Table 3.
Based on the invariance assumptions at the core of item-response theory (Lord, 1980),
true scores on any two equivalent tests should be related by a linear transformation, such
that θt = A × θr + B, where subscripts r and t denote the ‘reference’ and ‘target’ tests,
respectively. (In this case, TIMSS is the reference test and SACMEQ is the target test.)
This same linear transformation applies to the parameters from the IRF:
ajr =ajtArt
(3)
bjr = Artbjt +Brt (4)
In theory, a single A and B parameter should solve equations (3) and (4) for every item in
the two tests. With overlapping items, this is verifiable and usually false due to measurement
11More flexible alternatives also exist, based on the test characteristic curves rather than first and secondmoments of the item parameters, and future revisions may benefit from exploring these methods.
27

Table 3: Mean-sigma equating: Three-parameter IRT model estimates
TIMSS Pupils SACMEQ Teachers SACMEQ Pupils
ai bi ci ai bi ci ai bi ciItem (1) (2) (3) (4) (5) (6) (7) (8) (9)
M012139 0.86 -1.48 0.20 0.50 -3.14 0.58M012085 1.29 0.34 0.14 0.63 -1.52 0.12M012072 0.95 0.60 0.15 0.78 -0.67 0.30M012123 0.93 0.86 0.22 0.42 -0.54 0.20M012074 0.96 1.03 0.13 0.33 -0.23 0.16M012113 1.31 0.35 0.27 0.59 0.03 0.31M012134 1.37 0.62 0.20 0.81 0.06 0.08M012062 1.06 0.47 0.23 0.86 0.11 0.18M012136 1.35 0.62 0.16 1.05 0.40 0.38M012091 0.99 0.61 0.00 0.63 0.52 0.40M012070 1.14 0.75 0.27 0.72 0.61 0.32M012082 1.03 1.53 0.14 0.67 0.63 0.22M012150 1.09 0.57 0.10 0.48 0.68 0.17M012066 0.73 1.10 0.23 0.56 1.03 0.26M012056 0.94 0.84 0.20 0.34 1.03 0.08M012079 1.98 1.36 0.29 0.46 3.02 0.30M012101 1.46 1.01 0.29 0.87 0.65 0.24 0.27 4.12 0.11pmath29 0.14 -4.36 0.27 0.36 0.64 0.19pmath27 0.43 -4.30 0.04 0.60 1.68 0.12pmath56 0.47 -2.85 0.56 1.07 1.46 0.14pmath28 0.45 -2.08 0.24 0.41 1.28 0.19pmath44 0.59 -1.70 0.34 0.78 1.82 0.16pmath33 0.88 -1.47 0.04 0.77 2.78 0.12pmath57 0.74 -1.27 0.36 0.38 3.17 0.11pmath32 1.22 -1.06 0.32 0.58 3.25 0.12pmath30 0.60 -0.42 0.29 0.21 5.16 0.09pmath26 0.92 0.60 0.13 0.82 4.14 0.17pmath58 0.67 0.63 0.14 0.39 -0.23 0.02pmath55 0.13 1.51 0.16 0.38 4.84 0.13
TIMSS-SACMEQ Teachers: µb 0.657 0.137TIMSS-SACMEQ Teachers: σb 0.623 1.338
A = 0.465, B = 0.592SACMEQ Teachers-Pupils: µb -0.399 2.754SACMEQ Teachers-Pupils: σb 1.531 1.601
A = 0.956, B = −3.033
A = 0.445, B = −2.465
Columns (1)-(3) report estimates using the TIMSS data reproduced from the TIMSS technicalreport (Martin et al., 2000). The remainder of the table reports the author’s Bayesian (EAP)estimates of the item parameters for SACMEQ from a conditional logit (3PL) model. Notethat while esimation uses all items from each test, the table only reports parameters for itemsused in linking. Bottom rows report parameters for mean-sigma equating, as described in thetext.
28

error and an imperfect fit of the model. Thus researchers are forced to select a compromise
among the various values of A and B that would solve these equations for each item. One
of the simpler methods, known as the ‘mean/sigma’ approach, takes the mean and standard
deviation of the b values in equation (4), which produces the following expressions:
Art = σ(br)/σ(bt) (5)
and
Brt = µ(br)− Artµ(bt) (6)
where µ(.) and σ(.) represent the mean and standard deviations of the respective parameters,
taken over the set of overlapping items.
In the current application, I wish to transform SACMEQ pupil scores to the TIMSS
scale, via the SACMEQ teacher scale. Refer to the intermediate exam, or ‘linking’ exam,
by the subscript L. Applying equations (5) and (6) iteratively yields the following linear
transformations:
A′rt = ArlAlt (7)
and
B′rt = AltBrl +Blt (8)
Note that the rl and lt parameters are estimated over different but potentially overlapping
sets of items. Specifically, the rl parameters are estimated using the eighteen items shared
between the SACMEQ teacher and TIMSS tests in Figure 3, while the lt parameters are
estimated using the thirteen items shared between the SACMEQ pupil and teacher tests.
These transformation coefficients can be applied directly to the pupil-level proficiency
parameters, θi, extracted from the 3PL model in Table 3 to convert SACMEQ scores to the
TIMSS scale.
29

Figure 7: Country rankings: ‘mean-sigma’ IRT linking
0 200 400 600 800TIMSS grade 7 & 8 scale
NamibiaZambiaMalawi
South AfricaZanzibarLesothoUganda
BotswanaSouth Africa (TIMSS)
SwazilandGhana
SeychellesTanzania
MozambiqueKenya
MauritiusSaudi Arabia
SyriaBotswana (TIMSS)
PhilippinesMorocco
ChilePalestine
BahrainEgypt
TunisiaIndonesia
IranJordan
LebanonFYR Macedonia
CyprusMoldovaNorway
Zanzibar: TeachersRomaniaBulgaria
SerbiaArmeniaSlovenia
ItalySpain
N. ZealandIsrael
UKSweden
LithuaniaUSA
AustraliaSlovak Republic
RussiaLatvia
MalaysiaNamibia: Teachers
CanadaHungary
Lesotho: TeachersEstonia
Zambia: TeachersBotswana: Teachers
NetherlandsBelgium
Malawi: TeachersTanzania: Teachers
Mozambique: TeachersSwaziland: Teachers
JapanUganda: Teachers
TaiwanHong Kong
KoreaSeychelles: Teachers
SingaporeKenya: Teachers
5th percentile Mean 95th percentile
30

The bottom of Table 3 shows the parameters for this calculation. For instance, the
measured difficulty for the same item is, on average, somewhat higher for TIMSS pupils
(0.657) than for SACMEQ teachers (0.137), though the variance across items is significantly
higher for the teachers. These statistics generate values of ATIMSS,SACMEQ teacher = 0.465 and
BTIMSS,SACMEQ teacher = 0.592. The same procedure applies to the second link, from SACMEQ
teachers to pupils, where average difficulty parameters are dramatically higher for the latter
group (-0.399 versus 2.754). In total, these parameters combine to yield transformation
coefficients of ATIMSS,SACMEQ pupil = 0.445 and BTIMSS,SACMEQ pupil = −2.465.
The final results of this IRT-based linking are mostly congruent with the simpler equiper-
centile linking in the previous section. Ranking countries by their average score in the 2003
TIMSS round, the countries in the SACMEQ sample are at the very bottom of the league
table in Figure 7. The only countries with comparable performance are Ghana and Saudi
Arabia.
5 Making sense of contradictory results
Do the results from the three different approaches to linking African countries’ mathematics
scores to the TIMSS scale produce a consistent picture? Comparing countries, the correlation
between the country-year averages is above 0.9 in each case, but at the pupil level it falls
below 0.9 in two of three cases (see Table 4). Looking at the score distribution for each
country using each of the three linking methodologies highlights the disagreements, and
suggests the mean-sigma results may be the outlier. (See Figure 11 in the appendix.)
It is informative to compare not just three, but four sets of results that are available for
Botswana and South Africa: the validity of the pure IRT and mean-sigma results using IRT
methods and overlapping items can potentially be adjudicated by examining how well they
31
correspond to the equipercentile results based on overlapping population coverage and the
original TIMSS scores for these countries.
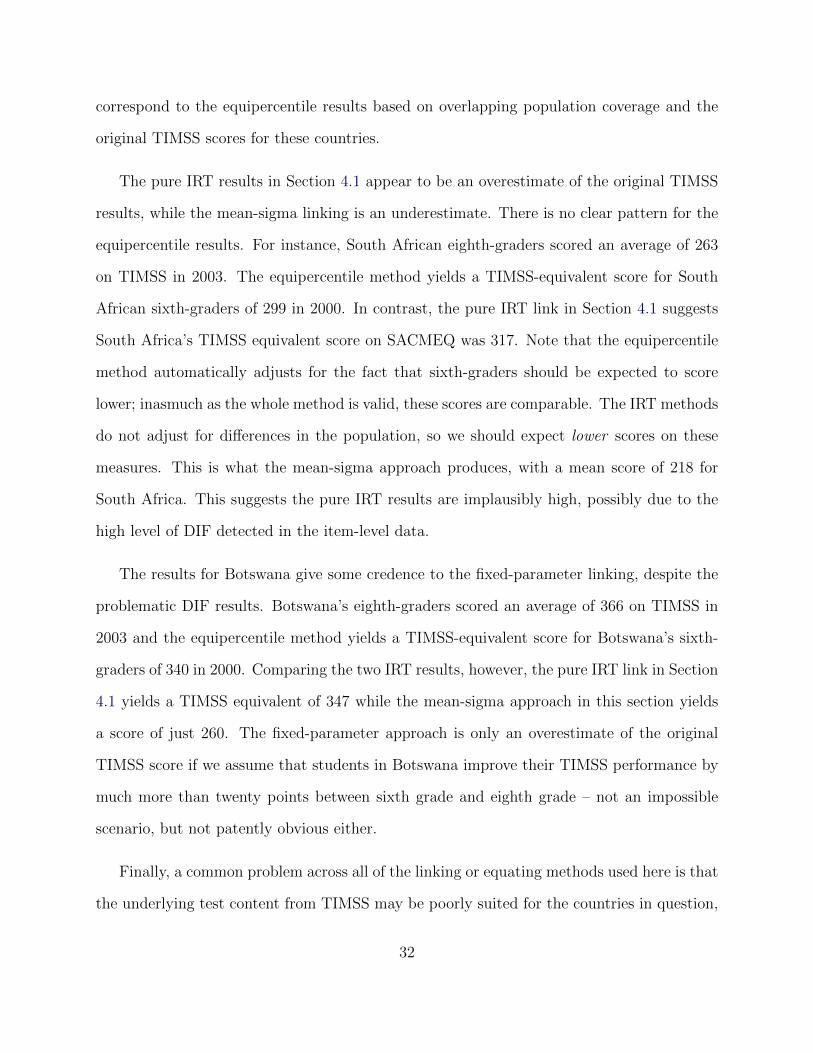
The pure IRT results in Section 4.1 appear to be an overestimate of the original TIMSS
results, while the mean-sigma linking is an underestimate. There is no clear pattern for the
equipercentile results. For instance, South African eighth-graders scored an average of 263
on TIMSS in 2003. The equipercentile method yields a TIMSS-equivalent score for South
African sixth-graders of 299 in 2000. In contrast, the pure IRT link in Section 4.1 suggests
South Africa’s TIMSS equivalent score on SACMEQ was 317. Note that the equipercentile
method automatically adjusts for the fact that sixth-graders should be expected to score
lower; inasmuch as the whole method is valid, these scores are comparable. The IRT methods
do not adjust for differences in the population, so we should expect lower scores on these
measures. This is what the mean-sigma approach produces, with a mean score of 218 for
South Africa. This suggests the pure IRT results are implausibly high, possibly due to the
high level of DIF detected in the item-level data.
The results for Botswana give some credence to the fixed-parameter linking, despite the
problematic DIF results. Botswana’s eighth-graders scored an average of 366 on TIMSS in
2003 and the equipercentile method yields a TIMSS-equivalent score for Botswana’s sixth-
graders of 340 in 2000. Comparing the two IRT results, however, the pure IRT link in Section
4.1 yields a TIMSS equivalent of 347 while the mean-sigma approach in this section yields
a score of just 260. The fixed-parameter approach is only an overestimate of the original
TIMSS score if we assume that students in Botswana improve their TIMSS performance by
much more than twenty points between sixth grade and eighth grade – not an impossible
scenario, but not patently obvious either.
Finally, a common problem across all of the linking or equating methods used here is that
the underlying test content from TIMSS may be poorly suited for the countries in question,
32
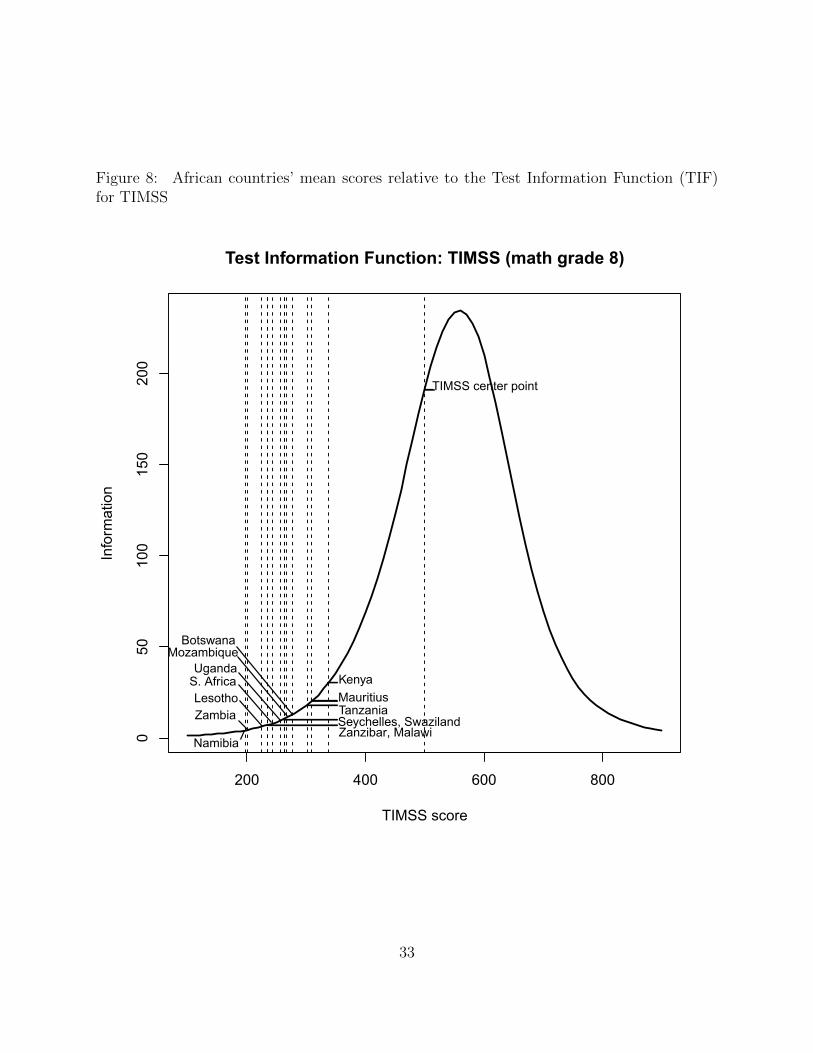
Figure 8: African countries’ mean scores relative to the Test Information Function (TIF)for TIMSS
200 400 600 800
050
100
150
200
Test Information Function: TIMSS (math grade 8)
TIMSS score
Info
rmat
ion
TIMSS center point
KenyaMauritiusTanzania
BotswanaMozambique
Seychelles, Swaziland
UgandaS. Africa
Zanzibar, Malawi
Lesotho
Namibia
Zambia
33

Table 4: Correlation matrices for results based on three linking methods
Variables Equipercentile Fixed parameters Mean-sigmaPupil-level data
Equipercentile 1.00Fixed parameters 0.90 1.00Mean-sigma 0.88 0.84 1.00
Country-year averagesEquipercentile 1.00Fixed parameters 0.97 1.00Mean-sigma 0.98 0.91 1.00
The table shows two separate correlation matrices. In both cases, all threevariables are measures of pupil mathematics proficiency; they differ only in themethodology used to convert SACMEQ data to the TIMSS scale, as describedin the text.
given the mathematics proficiency levels of pupils. In short, the test may simply be too hard.
To see this, Figure 8 overlays the average scores for each African country in the sample (using
the mean-sigma linking results) on top of the test information function (TIF) for the TIMSS
grade 7 and 8 scale.12 The TIF illustrates where, in the proficiency distribution, a test is
able to distinguish student proficiency. Tests comprised of items that are uniformly very
difficult may distinguish variations in proficiency at the top of the distribution but not at
the bottom, and conversely for tests with only easy items.
As seen, average pupils in SACMEQ countries fall in a score range where the TIMSS test
provides quite little information. This major caveat must be kept in mind when comparing
the estimates from various methodologies or attempting detailed analysis of scores from the
African sample. This simple point also highlights a core challenge of international testing
regimes: tests designed to provide information about OECD students may perform poorly
in low-income countries and vice versa.
12I’m grateful to Abhijeet Singh for this suggestion.
34

6 Putting African mathematics scores in context
Whichever linking measure is chosen, math scores in sub-Saharan Africa are clearly very low
relative to countries participating in international assessments. On average using the mean-
sigma estimates from the previous section, African countries in my sample score roughly 300
points on the TIMSS scale, compared to approximately 488 for the rest of the sample. Is this
higher or lower than would be expected given the region’s generally low level of economic
development?
For almost all countries and years, the sub-Saharan African countries in either the
SACMEQ or TIMSS data fall below the regression line of scores on GDP, as seen in Figure
9. In a simple regression of national mean scores on log per capita GDP in 2011 PPP dollars,
scores rise roughly 35 to 40 TIMSS points with each log point of GDP. But Africa’s low GDP
is insufficient to explain its low test scores. Controlling for both log GDP and net primary
enrollment rates, the coefficient on the dummy variable for Africa is negative and significant
using all three linking methodologies, and ranges from approximately two-thirds to one and
a half standard deviations. (See Table 5, columns 2, 4, and 6.)
Up to this point I have focused on score levels at a point in time, and focused the linking
analysis on the 2000 SACMEQ round which contained TIMSS items. The SACMEQ test
also enables trend analysis on the TIMSS scale. The majority of math items in the 2000
SACMEQ round were maintained in the 2007 instrument, and I include this 2007 item-level
data in the estimation of the IRT model from equation (1) to yield scores for both rounds
that are automatically on a comparable footing.
Is there evidence that African mathematics scores are converging to the international
average? The answer is tentatively, no, or at best only slightly. The box plots in Figure 9
show annualized changes of country averages for the African and non-African countries in
35

Figure 9: Score levels and changes over time: African and non-African countries
(a) Equipercentile linking
ARM
ARM AUSAUSAUS
AUT
AUT
BGRBGR
BGRBGR
BHRBHR
CAN
CANCAN
CAN
CANCANCANCAN
COL
COL
CYPCYPCYPCYP
CZE
CZECZE
EGYEGY
GBRGBRGBRGBR
GBRGBRGBR
HKGHKG
HKG
HUNHUNHUN
IDNIDNIDNIRNIRN
IRN
ISR
ISR
ISR
JORJORJOR
JPNJPNJPNJPN
KORKORKORKOR
LBNLBN
LVA
LVA LVAMYS
MYS
MYS
NLDNLDNLD
NOR
NOR
NORNZL
NZLNZL
PSE
PSE
ROUROUROUROU
SGPSGPSGP
SRBSRB
SVNSVN
SVN
THA
THATUN
TUNTUN
USAUSAUSA
BWABWA
BWABWA
GHA
GHA
KENKEN
LSO
LSO
MOZ
MOZ
MUS
MUS
MWIMWI
NAM
NAM
SWZ
SWZ
SYCSYC
TZATZA
TZA
TZA
UGA
UGA ZAFZAF
ZMBZMB
ZWE
200
300
400
500
600
TIM
SS a
vera
ge
6 7 8 9 10 11Log per capita GDP (PPP)
Scores and GDP
-10
-5
0
5
10
Annu
al c
hang
e in
mea
n sc
ore
in 2
000s
, TIM
SS s
cale
Non-African countries African countries
Annual score changes
(b) Fixed parameter IRT linking
ARM
ARM AUSAUSAUS
AUT
AUT
BGRBGR
BGRBGR
BHRBHR
CAN
CANCAN
CAN
CANCANCAN
CAN
COL
COL
CYPCYP
CYPCYP
CZE
CZECZE
EGYEGY
GBRGBRGBRGBR
GBRGBRGBR
HKG
HKG
HKG
HUNHUN
HUN
IDNIDNIDN
IRNIRNIRN
ISR
ISR
ISR
JORJORJOR
JPNJPNJPNJPN
KORKORKORKOR
LBNLBN
LVA
LVA LVA
MYSMYS
MYS
NLDNLDNLD
NOR
NOR
NORNZL
NZLNZL
PSE
PSE
ROUROUROUROU
SGPSGPSGP
SRBSRB
SVNSVN
SVN
THA
THATUN
TUNTUN
USAUSAUSA
BWABWABWABWA
GHA
GHA
KENKEN
LSO
LSO
MOZ
MOZ
MUS
MUS
MWIMWI
NAM
NAM
SWZ
SWZSYC
SYC
TZATZA
TZA
TZA
UGA
UGA ZAFZAF
ZMBZMB
ZWE
300
400
500
600
TIM
SS a
vera
ge
6 7 8 9 10 11Log per capita GDP (PPP)
Scores and GDP
-10
-5
0
5
10An
nual
cha
nge
in m
ean
scor
e in
200
0s, T
IMSS
sca
le
Non-African countries African countries
Annual score changes
(c) Mean-sigma IRT linking
ARM
ARM AUSAUSAUS
AUT
AUT
BGRBGR
BGRBGR
BHRBHR
CAN
CANCAN
CAN
CANCANCANCAN
COL
COL
CYPCYPCYPCYP
CZE
CZECZE
EGYEGY
GBRGBRGBRGBR
GBRGBRGBR
HKGHKG
HKG
HUNHUNHUN
IDNIDNIDNIRNIRN
IRN
ISR
ISR
ISR
JORJORJOR
JPNJPNJPNJPN
KORKORKORKOR
LBNLBN
LVA
LVA LVAMYS
MYS
MYS
NLDNLDNLD
NOR
NOR
NORNZL
NZLNZL
PSE
PSE
ROUROUROUROU
SGPSGPSGP
SRBSRB
SVNSVN
SVN
THA
THATUN
TUNTUN
USAUSAUSA
BWA
BWA
BWABWA
GHA
GHAKENKEN
LSOLSO
MOZ
MOZ
MUSMUS
MWIMWINAM
NAM
SWZ
SWZSYC
SYCTZA TZA
TZA
TZAUGA
UGAZAF
ZAF
ZMBZMB
ZWE
200
300
400
500
600
TIM
SS a
vera
ge
6 7 8 9 10 11Log per capita GDP (PPP)
Scores and GDP
-10
-5
0
5
10
Annu
al c
hang
e in
mea
n sc
ore
in 2
000s
, TIM
SS s
cale
Non-African countries African countries
Annual score changes
Note: In the scatter plots, African countries are shown in black and non-African countries in grey. Theregression lines are fitted using only the non-African sample. The box plots show the average annualchange during the 2000s. For the SACMEQ countries, the changes span 2000 to 2007; for the TIMSSsample the changes span 2003 to 2007.
36

Table 5: Are African mathematics scores lower than other development indicators predict?
Equipercentile Fixed parameter Mean-sigma
(1) (2) (3) (4) (5) (6)
Africa = 1 -155.8*** -79.20*** -142.8*** -65.25*** -224.0*** -153.4***(16.49) (22.43) (16.01) (22.00) (13.61) (22.56)
Log per capita GDP (2011 PPP) 38.15*** 38.10*** 35.93***(8.000) (7.853) (7.928)
Net primary enrollment 0.605 0.684 0.451(0.607) (0.594) (0.621)
Year (2000 = 0) -1.902** -2.260*** -1.932** -2.312*** -2.172*** -2.476***(0.791) (0.745) (0.789) (0.737) (0.788) (0.751)
Obs. 137 137 137 137 137 137R-squared 0.53 0.68 0.49 0.66 0.71 0.80
Note: Each column reports a separate linear regression of average scores in a given country and year on theTIMSS grade 7 and 8 scale. The dependent variable is measured with three different equating methods to linkSACMEQ scores to the TIMSS scale: equipercentile linking (columns 1-2), fixed parameter IRT linking (3-4), mean-sigma IRT linking (5-6). All standard errors are clustered at the country level. Asterisks (∗,∗∗ ,∗∗∗)denote coefficients that are significantly different from zero at the 10, 5 and 1% levels, respectively.
the sample. (In all cases, the non-African results are based on original TIMSS data). From
2000 to 2007, mathematics scores in the original TIMSS sample were essentially unchanged,
rising just 0.02 points per annum. Using both the fixed-parameter IRT methodology and the
equipercentile linking methodology, the African countries reported increases of at least one
point per annum. This does not hold for the mean-sigma linking, however, which shows a
decline of roughly 0.7 points per annum. Notably, none of these differences are statistically
significant, and the absolute rate of change for the African countries is very slow using any
methodology. Given the score gaps reported in Table 5, the most optimistic results would
still imply several decades if not centuries are needed for African countries’ mathematics
performance to converge to OECD levels at current rates of progress.
37

7 Conclusion
The sparse coverage of developing countries by international learning assessments creates
a need for linking or equating methods to compare learning scales between regional and
international assessments. This paper presents the results of applying three different equating
methods to mathematics scores from the international TIMSS program and the SACMEQ
test administered in Southern and Eastern Africa. The first equating approach relies on the
overlap in coverage, due to South Africa and Botswana’s participation in both tests. The
other two equating methods rely on the inclusion of TIMSS items in the SACMEQ test,
applying item-response theory methods to equate scores.
Mathematics scores in the African sample are low, both in absolute terms and relative
to the region’s economic development. These comparisons must be interpreted with the
important caveat that sixth-grade pupils taking the SACMEQ test are two full grades behind
most of their peers taking the TIMSS assessment in grade eight, although they are of similar
ages due to over-age enrollment in the African sample. Furthermore, trends during the 2000s
do not suggest African countries were catching up with the rest of the global sample, despite
(or perhaps because of) significant gains in student enrollment over this period.
A key finding from this exercise is its limitations. The three equating approaches produce
somewhat different results: while these estimates scores are highly correlated, their overall
levels differ significantly. At a technical level, two reasons for the non-robustness of the
results stand out. First, many of the linking items used in the formal IRT analysis exhibit
high levels of differential-item functioning between the SACMEQ pupil and teacher samples
(the teacher test provides a necessary bridge to the TIMSS test in this case). There is
some evidence this is linked to the high difficulty of the TIMSS items for the SACMEQ
pupil sample; DIF is much lower for the SACMEQ teachers, and for the TIMSS grade 3
and 4 items included on the SACMEQ test. Second, the number of linking items is simply
38

quite small, and there is reason to believe that linking errors may become quite large when
comparing populations with very different proficiency levels (e.g., Malawi and Canada) on
the basis of relatively few items.
The implication for the design of future regional and international learning assessments
is clear. If policymakers aim to make broad international comparisons, considerably greater
care must be taken at the design stage. In order to link independent tests ex post, the
number of linking items required may be closer to a few dozen or more, rather than the mere
handful used in many applications at present. Crucially, the difficulty and discrimination
of those items must be suited to the population in question. The TIMSS test, for instance,
simply contains quite little information on pupils with the overall proficiency levels seen in
many countries in Southern and Eastern Africa.
Future research should aim to overcome these deficiencies in test design, fielding instru-
ments that include more anchor items overall, and ensuring that those items are appropriate
to the population’s academic proficiency level. If, with such data in hand, researchers can
show that the various linking methods presented here generate congruent results, policymak-
ers might then be justified in putting much greater faith in global learning metrics.
39

References
Altinok, N., Diebolt, C., and Demeulemeester, J.-L. (2014). A new international database
on education quality: 1965–2010. Applied Economics, 46(11):1212–1247.
Altinok, N. and Murseli, H. (2007). International database on human capital quality.
Economics Letters, 96(2):237–244.
Breakspear, S. (2012). The policy impact of pisa: An exploration of the normative effects
of international benchmarking in school system performance. Technical report. OECD
Education Working Papers, No. 71.
Bruns, B. (2015). Nao ha magica para reformar a educacao so boas praticas. Revista Exame,
September 17.
Das, J. and Zajonc, T. (2010). India shining and Bharat drowning: Comparing two Indian
states to the worldwide distribution in mathematics achievement. Journal of Development
Economics, 92(2):175–187.
Gonzalez, E. J., Galia, J., and Li, I. (2004). Scaling methods and procedures for the timss
2003 mathematics and science scales. In Martin, M. O., Mullis, I. V., and Chrostowski,
S. J., editors, TIMSS 2003 International Mathematics Report: Findings from IEA’s Trends
in International Mathematics and Science Study at the Fourth and Eighth Grades, chap-
ter 11, pages 252–273. TIMSS & PIRLS International Study Center, Lynch School of
Education, Boston College, Boston, USA.
Hanushek, E. A. and Kimko, D. D. (2000). Schooling, labor-force quality, and the growth of
nations. American economic review, pages 1184–1208.
Hanushek, E. A. and Woessmann, L. (2012). Do better schools lead to more growth? cogni-
tive skills, economic outcomes, and causation. Journal of Economic Growth, 17(4):267–321.
40

Hastedt, D. and Desa, D. (2015). Linking errors between two populations and tests: A case
study in international surveys in education. Practical Assessment, Research & Evaluation,
20(14):2.
Holland, P. W. (2007). A framework and history for score linking. In Dorans, N. J., Pom-
merich, M., and Holland, P. W., editors, Linking and aligning scores and scales, pages
5–31. Springer Science & Business Media.
Hungi, N., Makuwa, D., Ross, K., Saito, M., Dolata, S., van Cappelle, F., Paviot, L., and
Vellien, J. (2010). SACMEQ III project results: Pupil achievement levels in reading and
mathematics. Technical report. SACMEQ Working Document, Number 1.
Jones, S., Schipper, Y., Ruto, S., and Rajani, R. (2014). Can your child read and count?
measuring learning outcomes in east africa. Journal of African Economies, 23(5):643–672.
Kolen, M. J. and Brennan, R. L. (2014). Test Equating, Scaling, and Linking: Methods and
Practices, Third Edition. Springer.
Lee, J.-W. and Barro, R. J. (2001). Schooling quality in a cross–section of countries.
Economica, 68(272):465–488.
Lieberman, E. S., Posner, D. N., and Tsai, L. L. (2014). Does information lead to more active
citizenship? evidence from an education intervention in rural kenya. World Development,
60:69–83.
Lord, F. M. (1980). Applications of item response theory to practical testing problems.
Routledge.
Makuwa, D. (2010). What are the levels and trends in reading and mathematics achievement?
Technical report. SACMEQ Policy Issues Series, Number 2.
41

Marciniak, Z. (2016). Polish education reforms. Technical report. Presentation at Mak-
ing Systems Work: A Global Conference on Education Systems February 29-March 02,
2016 Sydney, Australia, World Bank/Department for Foreign Affairs and Trade (Aus-
tralia). Available online at http://pubdocs.worldbank.org/pubdocs/publicdoc/2016/3/
532461457978460166/Session-3-Zbigniew-Marciniak.pdf.
Martin, M. O., Gregory, K. D., and Stemler, S. E. (2000). TIMSS 1999 Technical Report.
International Study Center, Lynch School of Education, Boston College, Boston, USA.
Michaelides, M. P. and Haertel, E. H. (2004). Sampling of common items: An unrecog-
nized source of error in test equating. cse report 636. Center for Research on Evaluation
Standards and Student Testing (CRESST).
Mislevy, R. J., Beaton, A. E., Kaplan, B., and Sheehan, K. M. (1992). Estimating population
characteristics from sparse matrix samples of item responses. Journal of Educational
Measurement, 29(2):133–161.
Mullis, I. V., Martin, M. O., Gonzalez, E. J., and Chrostowski, S. J. (2004). TIMSS
2003 International Mathematics Report: Findings from IEA’s Trends in International
Mathematics and Science Study at the Fourth and Eighth Grades. TIMSS & PIRLS
International Study Center, Lynch School of Education, Boston College, Boston, USA.
Pritchett, L. (2013). The rebirth of education: Schooling ain’t learning. CGD Books.
Raju, N. S. (1988). The area between two item characteristic curves. Psychometrika,
53(4):495–502.
Ross, K. N., Saito, M., Dolata, S., Ikeda, M., Zuze, L., Murimba, S., Postlethwaite, T. N.,
and Griffin, P. (2005). The conduct of the sacmeq ii project. In Onsomu, E., Nzomo, J.,
and Obiero, C., editors, The SACMEQ II Project in Kenya: A Study of the Conditions
42

of Schooling and the Quality of Education, chapter 2, pages 15–142. SACMEQ, Harare,
Zimbabwe.
Singh, A. (2014). Emergence and evolution of learning gaps across countries: Linked panel
evidence from ethiopia, india, peru and vietnam. Technical report, University of Oxford,
Department of Economics.
Spaull, N. and van der Berg, S. (2013). Content knowledge of grade 6 mathematics teachers
in 12 African countries: Composition, levels and comparisons. Technical report. Research
on Socio-Economic Policy (ReSEP), Department of Economics, University of Stellenbosch.
Zajonc, T. (2009). Openirt: Bayesian and maximum likelihood estimation of irt models in
stata. Technical report. https://github.com/tristanz/OpenIRT.
43

Appendix A: Additional figures and tables
Figure 10: Histograms of percent correct by teachers and pupils on overlapping items, bycountry
(a) Botswana
0
1
2
3
Den
sity
0 .2 .4 .6 .8 1TIMSS-equivalent score
(b) Kenya
0
1
2
3
4
Den
sity
0 .2 .4 .6 .8 1TIMSS-equivalent score
(c) Lesotho
0
1
2
3
4
Den
sity
0 .2 .4 .6 .8 1TIMSS-equivalent score
(d) Malawi
0
1
2
3
Den
sity
0 .2 .4 .6 .8 1TIMSS-equivalent score
(e) Mauritius
0
.5
1
1.5
2D
ensi
ty
0 .2 .4 .6 .8 1TIMSS-equivalent score
(f) Mozambique
0
1
2
3
Den
sity
0 .2 .4 .6 .8 1TIMSS-equivalent score
(g) Namibia
0
1
2
3
Den
sity
0 .2 .4 .6 .8 1TIMSS-equivalent score
(h) Seychelles
0
1
2
3
4
5
Den
sity
0 .2 .4 .6 .8 1TIMSS-equivalent score
(i) South Africa
0
1
2
3
Den
sity
0 .2 .4 .6 .8 1TIMSS-equivalent score
(j) Swaziland
0
1
2
3
Den
sity
0 .2 .4 .6 .8 1TIMSS-equivalent score
(k) Tanzania
0
1
2
3
Den
sity
0 .2 .4 .6 .8 1TIMSS-equivalent score
(l) Uganda
0
1
2
3
4
Den
sity
0 .2 .4 .6 .8 1TIMSS-equivalent score
(m) Zambia
0
1
2
3
4
Den
sity
0 .2 .4 .6 .8 1TIMSS-equivalent score
(n) Zanzibar
0
1
2
3
4
Den
sity
0 .2 .4 .6 .8 1TIMSS-equivalent score
(o) Zimbabwe
0
1
2
3
Den
sity
0 .2 .4 .6 .8 1TIMSS-equivalent score
Note: Shaded bars show the distribution of pupil percent correct; hollow barsshow the distribution for teachers on the same set of items.
44

Figure 11: Kernel density of TIMSS-equivalent pupil scores, by country
(a) Botswana
0
.002
.004
.006
.008
Den
sity
0 200 400 600 800TIMSS-equivalent score
(b) Kenya
0
.002
.004
.006
.008
Den
sity
0 200 400 600 800TIMSS-equivalent score
(c) Lesotho
0
.002
.004
.006
.008
Den
sity
0 200 400 600 800TIMSS-equivalent score
(d) Malawi
0
.002
.004
.006
.008
Den
sity
0 200 400 600 800TIMSS-equivalent score
(e) Mauritius
0
.001
.002
.003
.004
Den
sity
0 200 400 600 800TIMSS-equivalent score
(f) Mozambique
0
.002
.004
.006
.008
Den
sity
0 200 400 600 800TIMSS-equivalent score
(g) Namibia
0
.002
.004
.006
.008
Den
sity
0 200 400 600 800TIMSS-equivalent score
(h) Seychelles
0
.001
.002
.003
.004
.005
Den
sity
0 200 400 600 800TIMSS-equivalent score
(i) South Africa
0
.002
.004
.006
Den
sity
0 200 400 600 800TIMSS-equivalent score
(j) Swaziland
0
.002
.004
.006
.008
Den
sity
0 200 400 600 800TIMSS-equivalent score
(k) Tanzania
0
.002
.004
.006
.008
Den
sity
0 200 400 600 800TIMSS-equivalent score
(l) Uganda
0
.002
.004
.006
.008
Den
sity
0 200 400 600 800TIMSS-equivalent score
(m) Zambia
0
.002
.004
.006
.008
.01
Den
sity
0 200 400 600 800TIMSS-equivalent score
(n) Zanzibar
0
.002
.004
.006
.008
Den
sity
0 200 400 600 800TIMSS-equivalent score
(o) Zimbabwe
0
.002
.004
.006
.008
Den
sity
0 200 400 600 800TIMSS-equivalent score
Note: Black lines are based on the equipercentile method; dark gray lines on thefixed parameter IRT linking; and light gray lines on the mean-sigma IRT linking.
45

Table 6: Differential Item Functioning: Mantel-Haenszel Tests
SACMEQ pupils & teachers TIMSS & SACMEQ pupils
Odds Ratio χ2 P-Value Odds Ratio χ2 P-Value
Pupil item 26 0.5 0.00 . .
Pupil item 27 3.3 0.00 1.1 0.00
Pupil item 28 0.7 0.00 . .
Pupil item 29 0.5 0.00 . .
Pupil item 30 0.9 0.19 . .
Pupil item 32 1.7 0.00 . .
Pupil item 33 1.4 0.00 . .
Pupil item 44 1.3 0.00 . .
Pupil item 55 1.1 0.13 0.5 0.00
Pupil item 56 3.0 0.00 2.0 0.00
Pupil item 57 1.5 0.00 . .
Pupil item 58 0.8 0.04 . .
Pupil item 63 0.5 0.00 . .
P-values are reported for a χ2 test for an odds ratio of unity, i.e., no DIF.Note that it is only possible to perform the MH test for three items in theTIMSS and SACMEQ pupil sample (right-hand panel) because the otheranchoring items are spread across multiple booklets in the TIMSS dataand are never administered to the same student.
46

Appendix B: Linking to TIMSS grade 3 and 4 scale
The SACMEQ test contained items from both the TIMSS grade 3 and 4 test (population
1, in TIMSS parlance) as well as the grade 7 and 8 test (population 2). The two tests use
separate scales. In the main text, I focus on linking SACMEQ scores to the TIMSS grade
7 and 8 scale. While SACMEQ pupils and TIMSS grade 7 & 8 pupils are roughly the same
age, SACMEQ pupils are on average four years older than the pupils who took the TIMSS
grade 3 & 4 test (Table 1), so comparing them is somewhat artificial.13
Nevertheless, for completeness, this section presents the link from SACMEQ scores to
the TIMSS grade 3 and 4 scale. One major advantage of this link over the upper grades
used in the main text is that it is direct: there are six overlapping items between the TIMSS
pupil and SACMEQ pupil tests, allowing me to avoid passing through the SACMEQ teacher
test as in the main text. (See Figure 12.) Furthermore, identifiers exist to enable me to link
the item-level TIMSS data to the corresponding items in SACMEQ, which is not possible
for the upper grades.
The African countries in my sample perform surprisingly well on the six items that overlap
from the SACMEQ pupil test and TIMSS grade 3 and 4 test. While it is true that African
countries occupy the bottom spots in the country ranking in Figure 13, it is interesting that
Kenya performs better than the United States – bearing in mind, again, that the pupils in
the Kenyan sample are roughly four years older than their American counterparts.
Notably in Figure 14 , the degree of differential item functioning (DIF) for the items taken
from the TIMSS lower-grade scale appears relatively low compared to what was observed for
the items taken from the upper-grade scale. This is consistent with the hypothesis that the
13Additional motivation for focusing on the upper-grade scale is that there are fewer linking items at thelower grades, and documentation does not exist to link the lower-grade items from the 1995 TIMSS testto the three-parameter IRT model adopted in subsequent years – rendering the results, even if successfullyrescaled on the TIMSS 1995 scale, incomparable to more recent TIMSS scores.
47

Figure 12: Heuristic of overlapping math items
The Venn diagram shows the overlapping or “anchor” items linking the SACMEQ2000 pupil and teacher tests to the TIMSS 1995 test of third- and fourth-graders.
TIMSS upper-grade items were simply too difficult for the SACMEQ sample and resulted in
arbitrary guessing, while the lower-grade items may have been more appropriate.
In contrast, the variance of the TIMSS-scaled scores for the SACMEQ countries appears
quite low in Figure 15. The range from the fifth to the ninety-fifth percentile is much
narrower for the African sample than the original TIMSS countries – exactly the opposite of
the pattern found for the upper-grade scale in the main text. This may be an artifact of the
low number of anchoring items used to link the lower-grade scale. The possible variance is
simply lower with only a handful of items.
48

Figure 13: Country rankings: Percent correct, overlapping TIMSS grade 4 items
0 20 40 60Percent correct
Zambia Malawi
Lesotho Zanzibar
KuwaitIran
Namibia South Africa
Norway Uganda
MozambiqueZIM
Iceland Swaziland
GreeceNew Zealand
ThailandPortugal
BotswanaEnglandCyprus
ScotlandUnited States
SeychellesIreland
TanzaniaAustralia Kenya
IsraelCanada
LatviaAustria
SingaporeHungary
Czech Republic Mauritius
NetherlandsSlovenia
Hong KongSouth Korea
Japan
49

Figure 14: DIF: SACMEQ pupils vs. IRF from TIMSS 4th-graders
(a) Item 27
0
.2
.4
.6
.8
1
Prob
abilit
y co
rrect
-2 -1 0 1 2Pupil ability
(b) Item 28
0
.2
.4
.6
.8
1
Prob
abilit
y co
rrect
-2 -1 0 1 2Pupil ability
(c) Item 29
0
.2
.4
.6
.8
1
Prob
abilit
y co
rrect
-2 -1 0 1 2Pupil ability
(d) Item 30
0
.2
.4
.6
.8
1
Prob
abilit
y co
rrect
-2 -1 0 1 2Pupil ability
(e) Item 56
0
.2
.4
.6
.8
1
Prob
abilit
y co
rrect
-2 -1 0 1 2Pupil ability
(f) Item 57
0
.2
.4
.6
.8
1
Prob
abilit
y co
rrect
-2 -1 0 1 2Pupil ability
Note: Dots represent the observed percent correct for SACMEQ pupils. Linesshow the predicted percent correct based on the estimated IRF for TIMSS pupilsin grades 3 and 4.
50

Figure 15: Country rankings: TIMSS grade 4 scale, IRT linking
0 200 400 600 800TIMSS grade 4 scale
NamibiaZambiaMalawiKuwait
LesothoIran
ZanzibarSouth Africa
UgandaBotswana
IcelandSwazilandTanzania
MozambiquePortugalNorwayGreeceCyprus
ThailandSeychelles
New ZealandKenya
MauritiusEnglandScotland
LatviaCanada
United StatesHungary
IrelandAustraliaSlovenia
AustriaIsrael
Czech RepublicNetherlandsHong Kong
JapanSouth Korea
Singapore
5th percentile Mean 95th percentile
51