working paper 4 – aquaculture & poverty – a case …...working paper 4: aquaculture &...
TRANSCRIPT

DOST – PCAMRD
Research project R8288: Assessing the sustainability of brackish
water aquaculture systems in the Philippines
Working Paper 4 – Aquaculture & Poverty – A Case Study
of Five Coastal Communities in the Philippines
Irz, X.
Stevenson, J. R.
Tanoy, A.
Villarante, P.
Morissens, P.

Working Paper 4: Aquaculture & Poverty – A Case Study of Five Coastal Communities in the Philippines Xavier Irza, James R. Stevensona, Arnold Tanoy, Portia Villarante and Pierre Morissensb
a- Department of Agricultural & Food Economics, University of Reading, PO Box 237, Reading RG6 6AR. b- Coopération Internationale en Recherche Agronomique pour le Développement (CIRAD), Montpellier, France. Correspondence : [email protected] Abstract: After reviewing the rather thin literature on the subject, we investigate the relationship between aquaculture and poverty based on a case study of five coastal communities in the Philippines. The analysis relies on a data set collated through a questionnaire survey of 148 households randomly selected in these five communities. The methodological approach combines the qualitative analysis of how this relationship is perceived by the surveyed households and a quantitative analysis of the levels and determinants of poverty and inequality in these communities. There is overwhelming evidence that aquaculture benefits the poor in important ways and that it is perceived very positively by the poor and non-poor alike. In particular, the poor derive a relatively larger share of their income from aquaculture than the rich, and a lowering of the poverty line only reinforces this result. Further, a Gini decomposition exercise shows unambiguously that aquaculture represents an inequality-reducing source of income. We believe that the pro-poor character of brackish water aquaculture in the study areas is explained by the fact that the sector provides employment to a large number of unskilled workers in communities characterized by large surpluses of labour. Our results also suggest that the analysis of the relationship between aquaculture and poverty should not focus exclusively on the socio-economic status of the farm operator/owner, as has often been the case in the past. Acknowledgments: The authors would like to acknowledge the help of several people in designing this study and preparing this manuscript. In particular, we are grateful to all the participants at the workshop organized in Los Banõs on 22 April 2005 by the University and Reading and PCAMRD on the theme ‘aquaculture and poverty’. We would also like to thank the numerous individuals who helped us set up the survey, including the municipal and barangay officials who authorized and facilitated the collection of data in the five communities described in this paper. 1. Introduction Poverty in the Philippines remains a major problem, which represents a formidable barrier to the country’s development. As will be discussed in the methodological section, there exists multiple ways of measuring poverty, which can explain some of the discrepancies found in the literature regarding its incidence in the Philippines as elsewhere. However, there is little doubt that poverty levels in the Philippines are high both in absolute and relative terms. According to the latest set of World Development Indicators (Table 1), more than one third (37%) of the Philippine population lives under the national poverty line, while 15% finds itself in absolute poverty as defined by the $1 a day criterion of the World Bank. Furthermore, these figures compare unfavourably to those of other countries of the South-East Asian region such as Indonesia, Malaysia and Thailand. This is explained by a relatively low level of income per capita (at least when compared with Malaysia and Thailand) and relatively large income inequalities (when compared with Indonesia). As a consequence, the incidence of poverty in the Philippines is as acute as in countries with much lower income levels, such as Cambodia. Its reduction ranks high on the agenda of the government and other international agencies. Table 1: Incidence of Poverty in South-East Asia Country National Poverty Line International Poverty Line GNI per
1

capita ($) National
% Rural
% Urban
% Population
below $1/day Population
below $2/day
Cambodia 36.1 40.1 21.1 NA NA 310 Indonesia 27.1 NA NA 7.5 52.4 810 Malaysia 15.5 NA NA <2 <0.5 3,780 Philippines 36.8 50.7 21.5 14.6 46.4 1,080 Thailand 13.1 15.5 10.2 <2 <0.5 2,190 Source: World Bank Development Indicators, 2003 How can poverty be reduced in the Philippines? The starting point to answer this question is a realisation that the international consensus on the achievement of poverty alleviation has changed over the last two decades. The view that economic growth represents a sufficient condition for poverty alleviation has proven wrong, and it is now clear that a satisfactory rate of poverty reduction cannot automatically be achieved through the mere trickle-down effect of growth to the poor. Instead, decision makers need to design policies with a clear pro-poor focus, i.e. policies that benefit the poor disproportionately. This thinking has also modified the way in which development agencies function, in particular with respect to the funding of research in/for developing countries. It is no longer sufficient for researchers to claim that their activities will lead to productivity gains and economic growth; instead, demonstrating the effect on the poor of particular projects has become paramount. This general statement is reflected in DFID’s Renewable Natural Resources Research Strategy (RNRRS), which no longer focuses only on the generation of new knowledge in natural and social sciences, but also on the promotion of the use of this knowledge to improve the livelihoods of poor people. In this context, investment in aquaculture R&D for developing countries can only be justified to the extent that the resulting knowledge and technologies make a positive contribution to the livelihoods of the poor. This paper aims at testing whether this is actually the case based on a community-level analysis of poverty in several coastal areas of the Philippines where brackish water aquaculture is present. We start with a brief literature review of the relationship between aquaculture and poverty; move on to present an overview of the methodology and data collection; and, finally, present the qualitative and quantitative analysis of the relationship between aquaculture and poverty. 2. Aquaculture and Poverty: The State of Knowledge At a conceptual level, the potential contributions of aquaculture to poverty reduction are relatively well understood (Edwards, 1999; Muir, 1999). Several opportunities can arise for the poor from the improved use of aquatic resources that aquaculture development permits. There are, first, the direct effects generated by this development, i.e. effects that can be directly related to the farm’s activities. Aquaculture growth generates new income, calculated as production sales minus variable costs, which accrues to the owner(s) of the fixed factors of the fish farm (mainly the pond/land, family labour, management and other necessary equipment such as boats and nets). The impact on poverty of this additional income flow depends on the socio-economic status of the farm operator/owner and will only be significant if the poor themselves participate in aquaculture. Obstacles to this participation are potentially numerous and include the capital and skill intensity of the activity as well as its riskiness. At this level, it is usually thought that extensive or semi-intensive forms of aquaculture are relatively more pro-poor than intensive systems, due to the fact that the poor usually lack access to credit, which prevents them from purchasing the intermediate inputs used in large amounts in intensive systems. Aquaculture development can also generate employment on the farm, either on a full-time basis when a ‘caretaker’ is responsible for the day-to-day farm operations, or on a more occasional basis for seasonal tasks, such as harvest. This is likely to benefit the poor in countries with large labour surpluses, such as the Philippines, because a poor person’s labour often represents his main asset and, by the same token, his main source of livelihood. When comparing different forms of aquaculture, it is also likely that their relative labour intensities have an important bearing on their relative potentials for poverty reduction.
2

However, small direct effects would not necessarily imply that aquaculture is not ‘pro-poor’. It is possible that the additional income stream and employment generated by aquaculture development trickles down to the poor through a series of linkages within rural communities. These include production links, both ‘upstream’ from the farm in demand for inputs and services for aquaculture, as well as ‘downstream’ from the farm in the demand for processing, storage, and transport of production. There are also consumption links as fish farmers and farm labourers spend their increased incomes on goods and services that are provided outside of aquaculture. While conceptually simple, these growth linkages are difficult to measure but, in agriculture at least, most empirical studies have estimated large multipliers, explained primarily by the strength of the consumption linkages (Irz et al., 2001)1. This implies that our study should not focus exclusively on the farm but, instead, should take a broader view of the relationship between aquaculture and poverty. Many authors also argue that aquaculture development can have a positive nutritional effect on the poor as a supplier of high quality animal proteins and essential nutrients (Prein and Ahmed, 2000). If the poor adopt aquaculture, own-consumption of fish by the farm household can increase its nutrition and food security. In addition, aquaculture growth increases the supply of fish, which reduces its price and makes it more affordable to the poor. Note, however, that the argument depends on the size of the market where production is sold as well as on the nature of the fish produced. If aquaculture production is sold locally on small and poorly integrated markets, it is likely that the price decrease resulting from additional supply will be large; on the other hand, if production is exported, the nutritional benefits to the country’s poor will be non-existent. In a similar vein, these benefits will only materialise if the poor, either locally or nationally, do indeed consume the species produced by aquaculture and, in the case where only high-value species are farmed, no such nutritional benefits can be claimed. Sometimes, it can also be argued that aquaculture improves the nutrition of the poor through other channels. For instance, caretakers are sometimes allowed to catch fish in the ponds that they supervise to satisfy their family’s consumption needs. A common practice in the Philippines is also to allow poor people to catch any residual production after the main harvest has taken place in large brackish water ponds. Altogether, the arguments supporting the pro-poor nature of aquaculture rely on the income stream, employment and nutritional benefits that it can potentially generate. To some extent, these arguments apply to any agricultural enterprise as well as fishing, but aquaculture presents some advantages over these activities. First, it often represents the only option to farm land under saline conditions, which is precisely the case in the large areas of brackish water of the Philippines. Second, the productivity of fisheries is often limited by its open-access nature, which results in the well-known ‘tragedy of the commons’ that some identify as a cause of poverty (Hardin, 1968). By contrast, aquaculture development involves the creation of well-defined property rights that form, arguably, a pre-condition for productivity growth and represents an important developmental option for many coastal communities characterized by high levels of poverty. Finally, fish is a nutrient efficient protein source, in comparison to livestock, so there is an underlying biological reason for claiming that aquaculture represents a particularly attractive way of producing cheap proteins for the poor and the malnourished. In fact, so intuitive is the previous set of arguments that aquaculture generated massive enthusiasm in the last two decades, with some viewing its development as a ‘blue revolution’ with tremendous potential for fostering food security, generating economic growth in rural areas and alleviating poverty. However, the empirical evidence regarding the ability of aquaculture to reduce poverty is mixed at best (Edwards and Demaine, 1997). The assessment of this potential is made all the more difficult that while there are many studies of poverty in farming communities and among the urban poor, few empirical studies have focused specifically on aquaculture (FAO, 2003). Yet, there is a general view in the literature that the promotion of aquaculture in Africa and Latin America has largely been
1 These ideas have been formalised in so-called agriculture-led industrialisation strategies that stress the importance of agriculture in creating a market for industrial products (Adelman, 1995).
3
unsuccessful (Edwards and Demaine, 1997). In Asia, while commercial scale aquaculture has recently experienced a spectacular expansion, it is households with better resource bases rather than the poor who have benefited. As a result, donor support for aquaculture development has declined in the past ten years (Hlwart et al., 2003). However, there is also anecdotal evidence that coastal aquaculture can represent an important source of employment for the rural poor, through the demand for labour input, seed and feed (Edwards, 1999; Tacon, 2001). On the other hand, several case studies have documented the fact that aquaculture development can, in some cases, have a detrimental effect on the poor due to its environmental impact or its role in triggering social conflicts. The shrimp industry, in particular, has been blamed for a whole series of problems that, it is argued, have sometimes made the poor strictly worse off (Stonich et al., 1997). 3. Methodology & Data
3.1 Methodological Overview The literature review on the relationship between aquaculture and poverty reveals the need for further empirical inquiry. Several methodological approaches could be used to support this inquiry and these were discussed during a workshop organized by PCAMRD and the University of Reading on 22 April 2004 in Los Banõs, Philippines. Following the workshop that generated invaluable insights, the following methodological choices were made by the project leaders:
• The unit of analysis for this study should be the whole ‘community’. It was felt that
focusing solely on fish farms would be too restrictive in the sense that it would limit our understanding of poverty in the coastal areas of the Philippines. In particular, a farm-level analysis would make it very difficult to investigate how important aquaculture really is for the livelihoods of poor people in these communities, or to put into light any negative impact of aquaculture on the poor. By contrast, focusing on a few communities allows us to gain in depth understanding of the economic, institutional and social characteristics of these communities that are essential to investigate rural livelihoods and rural poverty in a holistic manner (Bebbington, 1999).
• The analysis adopts primarily a ‘traditional’ approach to poverty measurement and
evaluation. By that, we simply mean that the identification of the poor relies on quantitative consumption and income data that are collected through a survey. Although this approach has undoubtedly some shortcomings, there is little evidence that the more qualitative alternatives that have been proposed in recent years are superior (Ravallion, 1996, p. 124). In short, the methodology aims at defining profiles of poor and non-poor households in the chosen communities, hence establishing how the two groups differ in terms of their involvement in aquaculture (or aquaculture-related activities).
• However, it is also clear that the acceptability and effectiveness of development and
poverty policies depends in large part on the perceptions by the stakeholders themselves of poverty and poverty reducing measures. Hence, we also decided to investigate the subjective notion of poverty through participatory methods (see Hentschel and Waters (2003) for a recent application of that approach).
3.2. The Study Area and Data Collection 3.2.1. Regional Context
Brackish water aquaculture in the Philippines represents a traditional activity which has grown over the last few decades. Although uncertain, the total surface area of fishponds is large and has increased until recently through the conversion of mangroves and swamps. Yap (1999) suggests that there are 239,323 hectares of brackishwater fishponds in the Philippines, while the electronic data that we obtained from the Bureau of Agricultural Statistics (BAS) records a total harvested area of 415,272 hectares in year 2000, although this latter figure might be accounted for by joint or multiple owners of a single fishpond, each having featured in the survey separately. The ponds are distributed unequally across the country, with Region 3 covering the central part of the Northern island of Luzon and Region 6 in the Western Visayas (central Philippines) dominating the industry. Hence, Region 3 accounts for
4

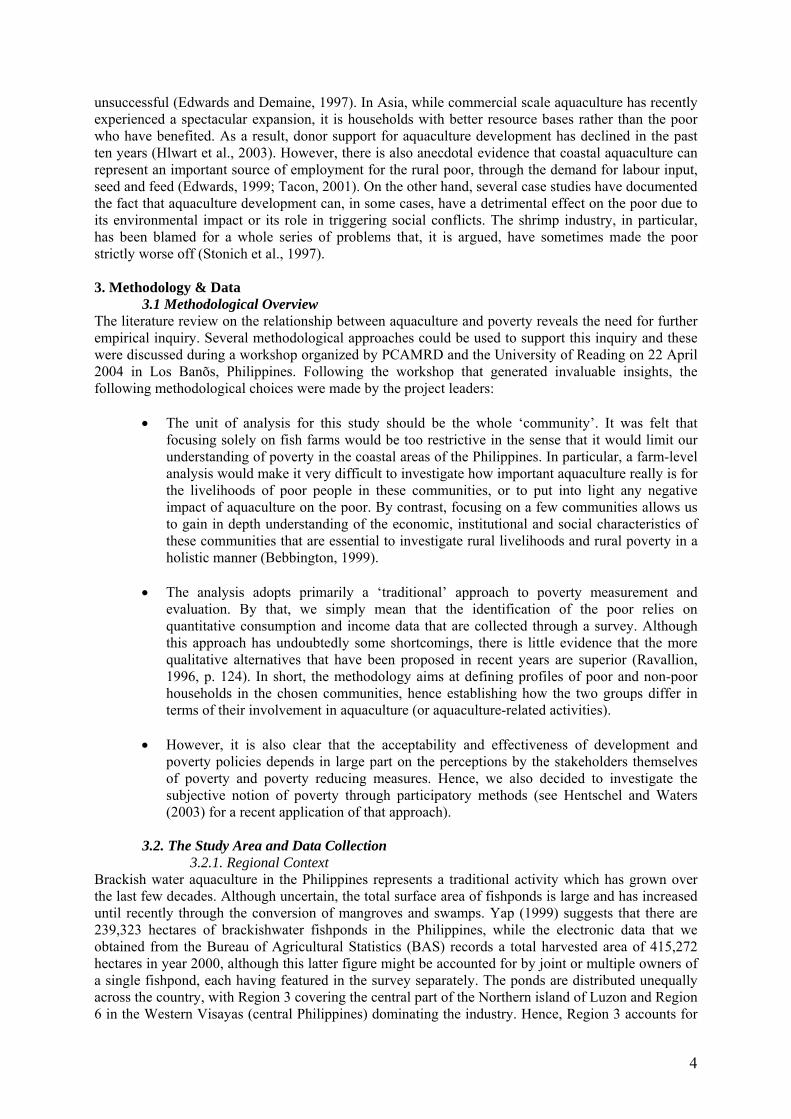
28% of the total area of fish ponds and 39% of the national production in value terms, while the corresponding figures for Region 6 are 24% and 14% (BAS). We therefore decided to concentrate the study on these two regions where the economic importance of brackish water aquaculture is largest. The situation with regard to poverty appears significantly different in the two selected regions. Figure 1 reveals that Central Luzon is characterized by the lowest incidence of regional poverty in the country at less than 20%. This can be related to the relative economic prosperity of the region due to the proximity of the national capital, Manila, and its many industries. By contrast, poverty incidence is high in the Western Visayas, with close to half of the population classified as poor ; only regions in Bicol and Mindanao fare worse in terms of poverty nationally. The literature establishes that poverty is really a multi-dimensional concept and that it should therefore be evaluated from a variety of angles. One such angle is the prevalence of malnutrition among young children, presented in the second map (Figure 2). The indicator of malnutrition selected measures the proportion of children under the age of 59 months with a weight for age ratio smaller than the population average by at least two standard deviations. The national picture of poverty that emerges from this second map differs slightly from that described in Figure 1. Consistent with the previous results, the incidence of child malnutrition in Central Luzon appears relatively low, but in the Western Visayas region, more than one third of the children are seriously underweight. The ability of aquaculture to improve nutrition, as postulated in the literature, seems therefore particularly relevant in Region 6.
Region 6
Region 3
% Population under poverty line
< 20 21 - 30 31 - 40 41 - 50 > 50 Missing Data
Figure 1: Poverty Map of the Philippines, 1997 Source: 1997 Philippine Poverty Estimates, NSCB 1998
5
% Children with weight for age < -2SD 26 – 30
31 – 35
> 36
Region 6
Region 3
Figure 2: Proportion of Underweight Children (0-59 Months), 1998 Source: National Nutrition Survey of 1998, FNRI-DOST
3.2.2 Data collection and overview of selected communities
A survey collected household-level data based on a questionnaire presented in the Appendix. Its core was inspired by the questionnaire developed by the World Bank’s Living Standards Measurement Survey (LSMS) team (Grosh & Glewwe, 2000) but we also had to make important adjustments because of specific objectives as well as time and financial constraints. The questionnaire is divided into ten sections that give a fairly comprehensive overview of a household’s socio-economic situation (household composition, education, employment, land-based activities (aquaculture & agriculture), fishing activities, other sources of income (transfers, remittances, rental earnings), consumption, asset ownership, housing, access to healthcare and credit). In addition, it contains a whole section investigating how the respondent perceives poverty and its relationship to aquaculture. The questionnaire was piloted by the research team in May 2004, which led to major revisions, and the survey proper was carried out from June to October 2004 in the two selected regions. The data was collected by enumerators during two face-to-face interviews taking place at a week’s interval, with all the recall data on consumption being collected during the second visit. An important step in implementing the methodology involves specifying precisely what is understood by the term ‘community’. For our purposes, we chose the smallest administrative unit in the Phillipines, called a barangay, which corresponds roughly to the borough of a municipality. Residents appear to have a real sense of belonging to their barangay, which has its own institutions (in particular, a barangay council and captain, who are elected) and social events (in particular, the annual fiesta which is organized on the day of the barangay’s saint). Participants at the workshop confirmed that barangays represent appropriate communities for our study.
6
Sampling followed a three-stage strategy. The first stage, discussed previously, selected the two regions with the most developed aquaculture sectors (Regions 3 & 6). The second stage selected a few barangays in each region. Our initial intent was to select those randomly but discussions at the workshop made clear that a purposive strategy would in fact be preferable. There were several suggestions at the workshop that the impact of aquaculture on the poor probably depends on the type of community considered. Relevant characteristics include the remoteness of the community, its distance to the town/village centre, the level of urbanization of the barangay and its surroundings, the importance of fishing as an economic activity in that community, and the presence of mangroves. A brief description of the five selected communities follows:
• San Antonio (SA) is a barangay of the ‘partially urban’ municipality of Sasmuan, in the
Pampanga province of Region 3 (NSCB Philippine Standard Geographic Codes, July 2004). It is part of the town centre, close to the market, municipal hall and other basic institutions of the municipality. However, its total land area of more than 800 hectares is occupied primarily by fishponds. The barangay has a total population of 1,603 individuals spread across 286 households (2000 National Statistics Census).
• Barangay Sapang Kawayan (SK) is a rural community under the jurisdiction of the municipality of Masantol in the Pampanga province of Region 3. Masantaol is classified as ‘partially urban’ and has 32,464 registered voters (National Statistical Coordination Board, 2004). The community of SK is located to the South of Masantol proper and is only accessible by boat (one hour from Masantol and 20 minutes from another town, Haganoy, in the nearby province of Bulacan). It is surrounded by fishponds and river systems and has a total land area of 265 hectares (Provincial Agriculturalist’s Office), which supports a population of 2,676 individuals in 559 households (2000 National Statistics Census).
• Barangay Nandin Lopez (NL) is located in the province of Iloilo (Region 6), municipality of Dumangas. Three major rivers traverse the area and the barangay is almost bounded by water except for a strip of land that connects it to the rest of the municipality. About 97% of the 797 hectares of land in the barangay are occupied by fish ponds and discussions with key informants suggested that aquaculture and fishing represented the two main sources of livelihood for the population of 1,359 individuals (as of 2003).
• Barangay Lat-Asan (LA) is located in the province of Capiz (Region 6), municipality of Pan-
ay. It is a small island (46 hectares) which can only be reached by boat from the barangay of Pawa. Most of the land (30 ha) is occupied by aquaculture ponds but there are also substantial mangrove areas in the barangay (15 ha). With a population of 680 spread in 139 households (1999 survey), this is by far the smallest community in our sample.
• Barangay New Buswang (NB) belongs to the municipality of Kalibo, Province of Aklan,
Region 6. It differs from the other four barangays in the sense that the area has no major waterways (except for small creeks & man-made canals) and no fishponds. The ponds that used to border the barangay have been converted to residential lots for the most part following the collapse of the aquaculture sector due to diseases and lack of access to markets. There are, however, fishponds remaining in bordering barangays (Old Buswang in particular). The second particularity of the barangay is that it contains a 20 hectare area of natural and replanted mangroves, which is part of the Bhakawan project of SEAFDEC. The total population of 8,127 is spread over 223 hectares of land.
Altogether, these five barangays differ in terms of their geographical location, importance of aquaculture and fishing as economic activities, remoteness, level of urbanization, and share of area occupied by mangroves. Barangay NB serves as a reference to get some insights into the poverty situation of coastal communities with no fish farming industry that make alternative uses of the land (in particular, developing mangrove-related activities).
7
The last step of the sampling strategy selected households randomly from an exhaustive list compiled in each barangay from official records, which sometimes had to be amended to include recently settled households and households living in remote parts of the barangay (e.g., migrant caretaker families living in houses built on the dykes of fish ponds). In the end, 36 households were surveyed in SA, 37 in SK and 25 in each of the three remaining barangays (NL, LA, ND) , for a total of 148. If we exclude NB, which has no aquaculture, our sample accounts for roughly 10% of the population of households in barangays SA, SK, NL and LA on which most of our analysis focuses. 4. Poverty & aquaculture: perceptions
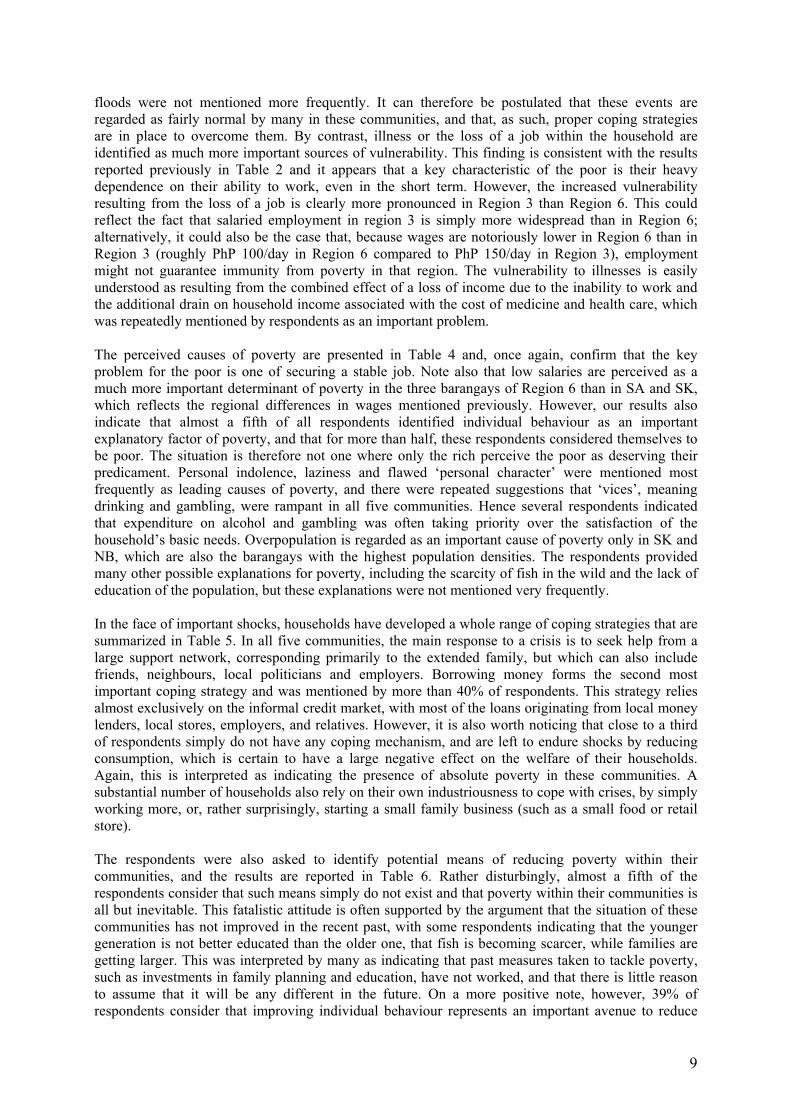
4.1 Defining the context: general perceptions of poverty Our study reveals that a vast majority of households consider themselves to be poor, although the data indicates some regional differences. In the province of Pampanga, around two thirds of the respondents see themselves as poor (75% in SA and 62% in SK), while in the Visayas region this proportion is even larger (92% in NL and LA, 100% in NB). These regional differences are consistent with the poverty maps presented above, but the very high levels of perceived poverty incidence observed in both regions suggest that the coastal communities that we study are also much poorer than the regions to which they belong. Clearly, poverty is perceived as a major problem for all the coastal communities under scrutiny, which gives relevance to our investigation. As the recent literature on poverty and livelihoods has moved away from single indicators of poverty to emphasize its multi-dimensional nature, the study attempted to identify how the respondents themselves would define the concept2 and Table 2 summarizes the results3. The large number of answers to the question confirms that poverty is interpreted in very different ways by individuals, although it could also reflect the open-ended nature of the question. More than half of the respondents identified having an insufficient income as the key characteristic of poverty, followed by the inability to purchase enough food to meet the household’s needs, the lack of a regular income, and, finally, the fact that one is unemployed. The emphasis on food consumption indicates that people in these communities face absolute, rather than relative, poverty. It also gives some relevance to the analysis of the potential nutritional benefits that the literature suggests can be associated with the development of aquaculture. In a similar vein, the fact that unemployment is identified as a key characteristic of the poor implies that the potential of aquaculture to reduce poverty is closely linked to its ability to create jobs in the communities studied here. The results also indicate, in line with the literature, that poverty should be analysed in a dynamic rather than static framework, because poor households are identified by their vulnerability to external shocks. Hence, income poverty is not only related to the low level of household earnings but also to their variability and the poor are identified by a substantial number of respondents as being unable to secure a stable/permanent job. Table 2 suggests further that asset poverty, though present, does not represent the main dimension of poverty in these three communities. A few respondents associated household poverty with the inability to own a house, land or durable goods, and the issue of indebtedness of the poor was also mentioned. Similarly, the lack of social status of the poor, as indicated by their lack of influence in these communities and their dependence on others for their livelihoods, was rarely identified as a key characteristic of poverty. Altogether, the data indicates that in the coastal communities investigated here, it is the income and consumption dimensions of poverty that tend to dominate, as opposed to the concepts of asset and social poverty that have become very popular in the recent livelihoods literature. We also note that the perceived meaning of poverty seems fairly homogenous across communities. Table 3 explores the vulnerability of the surveyed households. Weather shocks were reported by a substantial number of respondents as a cause of crisis but, given that some of these communities can be flooded for several weeks a year during the rainy season, it is rather surprising that typhoons and
2 The exact question was: In your opinion, what does it mean for a household to be poor? What is the main characteristic of poverty? 3 From hereon, all tables are presented at the end.
8
floods were not mentioned more frequently. It can therefore be postulated that these events are regarded as fairly normal by many in these communities, and that, as such, proper coping strategies are in place to overcome them. By contrast, illness or the loss of a job within the household are identified as much more important sources of vulnerability. This finding is consistent with the results reported previously in Table 2 and it appears that a key characteristic of the poor is their heavy dependence on their ability to work, even in the short term. However, the increased vulnerability resulting from the loss of a job is clearly more pronounced in Region 3 than Region 6. This could reflect the fact that salaried employment in region 3 is simply more widespread than in Region 6; alternatively, it could also be the case that, because wages are notoriously lower in Region 6 than in Region 3 (roughly PhP 100/day in Region 6 compared to PhP 150/day in Region 3), employment might not guarantee immunity from poverty in that region. The vulnerability to illnesses is easily understood as resulting from the combined effect of a loss of income due to the inability to work and the additional drain on household income associated with the cost of medicine and health care, which was repeatedly mentioned by respondents as an important problem. The perceived causes of poverty are presented in Table 4 and, once again, confirm that the key problem for the poor is one of securing a stable job. Note also that low salaries are perceived as a much more important determinant of poverty in the three barangays of Region 6 than in SA and SK, which reflects the regional differences in wages mentioned previously. However, our results also indicate that almost a fifth of all respondents identified individual behaviour as an important explanatory factor of poverty, and that for more than half, these respondents considered themselves to be poor. The situation is therefore not one where only the rich perceive the poor as deserving their predicament. Personal indolence, laziness and flawed ‘personal character’ were mentioned most frequently as leading causes of poverty, and there were repeated suggestions that ‘vices’, meaning drinking and gambling, were rampant in all five communities. Hence several respondents indicated that expenditure on alcohol and gambling was often taking priority over the satisfaction of the household’s basic needs. Overpopulation is regarded as an important cause of poverty only in SK and NB, which are also the barangays with the highest population densities. The respondents provided many other possible explanations for poverty, including the scarcity of fish in the wild and the lack of education of the population, but these explanations were not mentioned very frequently. In the face of important shocks, households have developed a whole range of coping strategies that are summarized in Table 5. In all five communities, the main response to a crisis is to seek help from a large support network, corresponding primarily to the extended family, but which can also include friends, neighbours, local politicians and employers. Borrowing money forms the second most important coping strategy and was mentioned by more than 40% of respondents. This strategy relies almost exclusively on the informal credit market, with most of the loans originating from local money lenders, local stores, employers, and relatives. However, it is also worth noticing that close to a third of respondents simply do not have any coping mechanism, and are left to endure shocks by reducing consumption, which is certain to have a large negative effect on the welfare of their households. Again, this is interpreted as indicating the presence of absolute poverty in these communities. A substantial number of households also rely on their own industriousness to cope with crises, by simply working more, or, rather surprisingly, starting a small family business (such as a small food or retail store). The respondents were also asked to identify potential means of reducing poverty within their communities, and the results are reported in Table 6. Rather disturbingly, almost a fifth of the respondents consider that such means simply do not exist and that poverty within their communities is all but inevitable. This fatalistic attitude is often supported by the argument that the situation of these communities has not improved in the recent past, with some respondents indicating that the younger generation is not better educated than the older one, that fish is becoming scarcer, while families are getting larger. This was interpreted by many as indicating that past measures taken to tackle poverty, such as investments in family planning and education, have not worked, and that there is little reason to assume that it will be any different in the future. On a more positive note, however, 39% of respondents consider that improving individual behaviour represents an important avenue to reduce
9

poverty, which suggests that some of the solutions exist within these communities. In line with the discussion on the causes of poverty, ‘improved behaviour’ includes the reduction of vices, an increase in the number of hours worked, or more careful budgeting at household level (that would allow the accumulation of savings). Creating more job opportunities also ranks high as a method of reducing poverty within these communities, as might have been expected from answers to the other questions. It is interesting to note that the government is not perceived as being central to poverty reduction, although 14% of respondents mentioned its role. This could be interpreted in several ways, but might suggest that most in these communities consider the central state to be either weak or corrupt. Altogether, we conclude that the communities under scrutiny consider poverty to be widespread and of major importance. Poverty, which is defined primarily in terms of its income and consumption dimensions by the respondents, is perceived as relating primarily to the issue of unemployment, but individual behaviour is also recognized as a major contributing factor. The main sources of vulnerability (illness & loss of job) are dealt with by mobilizing an extensive support network and borrowing from the informal credit market, although a substantial number of households simply have to reduce consumption. A majority of respondents believe that poverty can be reduced, primarily through job creation within the community, as well as improved individual behaviour. All of these characteristics define the context in which we now analyse the relationship between aquaculture and poverty.
4.2 Aquaculture & poverty: the views from five communities Aquaculture development has often been criticised for the inequities that it apparently generates (Alauddin and Tisdell, 1998; Coull, 1993) and has even been blamed for the marginalisation of and increased unemployment in some coastal communities (Primavera, 1997). It therefore seems relevant to identify how aquaculture is perceived not only by those directly involved in it (i.e., the fish farmers) but by the entire community. The survey first asked respondents to evaluate whether, in their view, aquaculture benefited the rich and/or the poor in their community and the results are summarized in Table 7. A very large majority considers that aquaculture is mutually beneficial to the poor and the rich, but there is also a small minority (23%), particularly in Region 6, that believe that only the rich benefit. The regional difference could be explained by the fact that land ownership in the Visayas region is typically more inequitably distributed than in Central Luzon, and that the salaries offered to caretakers and daily workers are also noticeably lower in Region 6 (see section 5.5). We then investigated what form the benefits from aquaculture to the poor might take by asking whether the poor themselves practiced fish farming. Informal discussions with aquaculture experts and local officials seemed to indicate that fish farming in the brackish water areas of the Philippines was mainly a rich-man activity, but this contention is not supported by the results of our survey. Indeed, Table 8 reveals that more than half of respondents consider that some poor people operate fish farms. The interviewees repeatedly mentioned examples of individuals who, having started as caretakers, managed to acquire small fishponds and, from thereon, developed profitable aquaculture operations. There is therefore some level of social mobility within the studied communities, and aquaculture might be regarded as an instrument of that mobility. Further, it seems that escape from poverty via aquaculture is only possible when the caretaker earns a substantial share of the farm’s profit, as is often the case in Region 3, but much more rare in Region 6. However, there are also some clear barriers to entry into the sector, as indicated by the fact that 82% of respondents consider that it would be impossible for them to start a fish farming operation (Table 9), although the problem seems more severe in Region 3 than in Region 6. When probed further about why the poor might not be able to start a fish farming operation, the third of respondents who had expressed that view overwhelmingly mentioned the lack of access to credit and financial capital as the key hurdle, while a few (8) also thought that access to land was a problem. The lack of access to credit is also by far the main reason given by the respondents who felt that they would be unable to start their own fish farm, although lack of knowledge or land were also mentioned. Hence, it appears that financial capital represents the scarce factor in these communities that limits entry into the fish farming industry. This is explained by the fact that the type of aquaculture practiced in these
10

communities requires the purchase of large amounts of intermediate inputs (prawn fry and fingerlings in particular) and also by the level of risk involved. Flooding of fish ponds is a frequent occurrence, as is mass mortality (particularly of prawns), so that the returns to invested capital are highly uncertain (many respondents made a parallel between fish farming and gambling). As a consequence, only those in a strong financial position are willing to take the risk associated with brackish water aquaculture. Because part of the literature suggests that aquaculture can be detrimental to some particularly vulnerable social groups, we did explicitly ask respondents whether, in their opinion, fish farming might have a negative impact on the poor (Table 10). More than two thirds of the interviewees thought that it was not the case. The large minority (30%) that disagreed usually believed that aquaculture had a negative impact on fishing, which represents an important source of livelihood for the poor. The blame was put primarily on the feeds used in large quantities to grow milkfish, and a few individuals, particularly in barangay Lat-Asan, also suggested that the chemicals employed to fight diseases as well as the pesticides used between cycles were responsible for the observed decline in wild fish stocks. Note, however, that perceptions of these negative impacts vary widely across communities, in a way that is consistent with the importance of fishing as an economic activity. In particular, aquaculture is perceived as being most detrimental to the poor in the two barangays supporting a large number of fishermen (SK and LA). Further, barangay SK was purposely selected on the outer edge of the Pampanga estuary, hence downstream from most fishponds and relatively more exposed to the negative externalities generated by aquaculture than the other barangays. This may explain why a majority of respondents in SK thought that aquaculture had a negative impact on the poor. In view of the previous set of results, it is not surprising that aquaculture is perceived positively by an overwhelming majority (95%) within these five communities (Table 11). The number one perceived benefit is the creation of jobs that are crucially needed in these communities. More details about the employment generated by aquaculture will be presented in section 5.5. The second major perceived benefit from aquaculture for these communities is the provision of fish for human consumption. In particular, the practice of allowing the collection of ‘free fish’ from fish ponds, i.e. any residual fish or crustaceans left after the main harvest, was mentioned as an important benefit from aquaculture by a large number of respondents in Region 3. As the gains from such an activity are rather limited, it is mainly the young and the poor who partake in it, which is likely to substantially improve nutrition in their households. Many respondents also emphasized the importance of payments in fish that are made for various tasks (harvest for instance), as well as the traditional practice by farm operators to give fish as gifts at the time of harvest to neighbours, friends and family. Hence, there appears to be important nutritional benefits to these communities from aquaculture, which materialize through a variety of non-market mechanisms that make fish available to residents. Some other indirect benefits from aquaculture to these communities were mentioned but only infrequently, including the generation of local tax revenues, or the provision of credit by farm operators. The last section of the questionnaire investigating perceptions of the relationship between aquaculture and poverty deepened the analysis by attempting to get a sense of the magnitude of the perceived benefits from aquaculture as well as related problems. This was achieved by asking respondents to choose a step on a ladder, presented to them on a piece of paper, after explaining that the first step was describing the worst possible situation and the highest step the best possible situation (see Questionnaire in Appendix)4. The ladder presenting ten steps, admissible answers range from 1 to 10, and Table 12 presents the mean scores together with their standard deviations for a series of question. The first two questions were aimed at evaluating the potential nutritional benefits that aquaculture could generate in these communities. Respondents were asked to evaluate their overall food security situation by choosing a step on the ladder, where the first step was described as a situation where all household members barely have anything to eat, and the highest step as a situation where every member of the household eats three nutritious meals daily. The average score (5.05) indicates clearly that a majority of households feel far from fully food secure, and the table also indicates that the 4 We are thankful to Dr Peter Edwards for suggesting the use of this tool.
11

situation is worse in Region 6, as was expected from the poverty maps (Figure 2). Worryingly, the results also suggest that the food security situation of these three communities has slightly worsened over the last five years, but respondents expect this trend to be reversed in the near future. The second question5 allows us to quantify the importance of fish in the diet of these communities and the relatively high average score (5.80) confirms that fish is an important food item in most households. Further, there is little indication that availability of fish in these communities has changed in the last five years, and respondents do not anticipate major changes at that level in the short future either. Altogether, we interpret this set of results as indicating that aquaculture could potentially make an important contribution to the improvement of nutrition in these communities, since most households are not fully food secure, while fish plays an important role in their diets. Given the crucial role that employment plays for the poor, it is interesting to analyse how respondents judge the importance of aquaculture as a source of jobs for their household6. The average score of 3.88 establishes that aquaculture represents an important source of employment in these communities, although the situation varies across barangays. In region 3, households are much more dependent on aquaculture for employment in SK (average score of 7.53) than in SA (average score of 3.75). We believe that this simply reflects the relative remoteness of barangay SK compared to SA, which is located close to the city centre where various forms of employment are potentially available. In Region 6, aquaculture is a significant source of employment in barangay NL (average score of 5.96) but appears unimportant in the two other barangays. This was expected in NB, which was selected as a reference community with no fish farming industry, but not in LA, where we thought that the community’s economy would be equally divided between fishing and aquaculture. The data also reveals that in barangays SK and NL, very few households (6 out of 62) replied that none of their employment was related to aquaculture, while almost half of respondents gave that answer in SA. Hence, in three of the barangays under study, involvement of the household in aquaculture represents the rule rather than the exception. Finally, the last question was aimed at measuring the overall importance of aquaculture as a source of household cash income and the results closely mirror those obtained with regard to employment. This gives a final confirmation that in these communities, income and employment are closely related to each other. Altogether, this part of the survey draws a fairly clear picture of poverty in these communities and how it relates to aquaculture. There is little doubt that most households are poor, a situation that is defined primarily by low and variable income and consumption, as well as some degree of food insecurity. The main coping mechanism during crises consists in requesting help from an extensive support network and taking loans from the informal credit market. Although unemployment is identified as the main cause of poverty, many respondents also consider that its reduction requires improvement in individual behaviour. In this context, aquaculture is perceived overwhelmingly as being beneficial to the entire community and, more specifically, to the poor. Although ownership of fish farms might be very concentrated in the communities under scrutiny, most households derive some employment from aquaculture and the sector is identified as a key source of income. In addition, distribution of ‘free fish’, which is a by-product of the farming activity, is important to a large number of respondents and one can logically suggest that this benefit is particularly pro-poor. Contradicting a large volume of recent literature, few negative effects of aquaculture on these communities are identified by their residents. There are suggestions that the industry imposes some negative externalities on the fishing industry, but these costs are judged to be largely outweighed by the benefits of increased employment and increased availability of fish from aquaculture. However, there
5 The exact question is: ‘The first step on the ladder shows a situation where fish/seafood does not form part of your household’s diet at all, even if your household members wanted to eat fish. The highest step on the ladder represents a situation where your household members can eat as much fish as they want.’ 6 The exact question is: ‘The first step on the ladder describes a situation where no household member earns from any aquaculture-related activity. The highest step on the ladder represents a situation where members of your household obtain all their earnings from various aquaculture-related activities (production, marketing, harvesting, processing, input supply etc.).’
12

are important barriers to the adoption of aquaculture by the poor, most notably the lack of access to credit, but the study also reveals some level of social mobility within these communities, sometimes facilitated by aquaculture itself.
5. Levels and Determinants of Poverty and Inequality in the Selected Communities 5.1 Approach to Poverty Measurement The steps involved in measuring and explaining poverty are well understood. In a first step, an indicator of household welfare or well-being is constructed, and that indicator can then be compared to a poverty line to identify the poor (Ravallion, 1996). Once the poor and the non-poor are distinguished, the correlates of poverty are analysed in an attempt to explain why some households are poor, and draw policy conclusions on how to facilitate escape from poverty. Although the underlying logic is straightforward, each step of the methodology is unfortunately fraught with problems. A fundamental issue arises from the fact that well-being is not directly observable, so that a proxy needs to be defined to measure household welfare. Total current income is a popular choice in poverty studies, but it is also recognised that it suffers from important theoretical shortcomings (Balisacan, 1999). Most importantly, current income does not constrain consumption when households can borrow or use savings, which is the rule even in low-income countries where financial markets fail. In fact, the previous section identified borrowing as a key coping mechanism of households in the study areas and Fafchamps and Gubert (2003) showed how most informal loans within social networks in the Philippines attract no interest rate, thus making a debt trap impossible. It follows that consumption is theoretically a better welfare indicator than income. A more fundamental critique of the standard approach to poverty measurement, which was first formulated by Sen (1985), considers that income and consumption indicators are too limited as concepts of welfare, and that it would therefore be more appropriate to replace them with various social indicators, such as life expectancy, literacy and infant mortality. In a similar vein, the recent livelihoods literature emphasizes the multi-dimensional nature of poverty and the need to analyse it at a disaggregated level. For this particular study, we note the previous set of limitations and choose to adopt a traditional approach to poverty measurement that we complement with additional indicators of household welfare, such as access to non-market goods, as suggested by Ravallion (1996). Our initial intention was to derive a consumption-based index of welfare, but the pilot survey revealed numerous difficulties in collecting the necessary data: respondents were often unable to recall what they had consumed or were getting impatient/annoyed with the dozens of questions on consumption of individual items. By contrast, and contrary to what the literature suggests (Ravallion and Chen, 1997; Lipton, 1997), it proved much easier to obtain information on household income, which most respondents were happy to share. We therefore rely for this particular study on an income-based poverty measure. Although practical considerations drove this methodological choice, we feel warranted in our approach by the results in Section 4.1, which established that income represents the main dimension of poverty in the eyes of a large majority of respondents in all five communities. Our income measure includes earnings accruing to all household members from salaried employment, self-employment in activities such as fishing or retailing, rents of physical assets (land, houses, tri-cycles, boats etc.) as well as transfers from the state and individuals. A common practice in the study areas consists of making payments in nature (principally in the form of rice or fish), and their values were imputed on the basis of the prevailing market prices for these commodities. Further, it is clear that a household’s needs depend on its demographic composition so that total household income should be adjusted accordingly. Conceptually, the construction of so-called equivalence scales is relatively simple as it should mainly take into account two key factors: first, the number of children in the household, because a child’s needs are likely to be substantially less than an adult’s7; and second,
7 Balisacan (1992) establishes for the Philippines that a rural couple with one child needs 20% more income than a childless household to achieve the same welfare level. However, it is also true that food need per unit of body weight is higher for children than adults; and that children need food of higher quality (in terms of energy density and protein balance) than adults. We are grateful to Dr Peter Edwards for that last point.
13

overall household size, because the presence of fixed household costs is likely to cause economies of scale in consumption. Empirically, however, the problem is complex and has generated an extensive literature (Banks & Johnson, 1994; Coulter et al., 1992) from which no consensus emerges (Balisacan, 1999). In this context, we simply define our welfare measure as household income per capita, which is clearly preferable to the use of unadjusted household income. The next step in the analysis consists in comparing the income-based welfare indicator to a reference level in order to identify poor households, but, here again, the construction of a poverty line raises a number of additional issues8. A common practice involves setting the poverty line as a constant proportion of the mean income, but, because the analysis then loses meaning in terms of absolute standards of living, it is unlikely to be of much relevance to anti-poverty policies (Ravallion, 1996). Clearly, in a country such as the Philippines, it is absolute poverty that matters, and it is preferable to build a poverty line interpretable in terms of the subsistence needs of the population. In the present context, we simply rely on the official poverty line, reported online by the Philippines National Statistics Office (PNSO) for individual regions in year 20009, which we adjust for inflation by using the national Consumer Price Index (CPI) also reported on the PNSO website. The poverty line is defined by the National Statistical Coordination Board (NSCB)10 as the annual per capita food threshold plus the cost of other basic non-food requirements, and hence clearly relates to absolute poverty. For Central Luzon, the poverty line in year 2000 was PhP14,200, and the CPI increased from 152.1 in July 2000 to 183.3 in July 04, when the survey took place. The adjusted poverty line for Region 3 is therefore set at PhP17,113, or $305 at the current exchange rate. The corresponding value in Region 6 is PhP14,703, or $262 at the current exchange rate. The PNSO also reports a food threshold, defined by the NSCB as the annual per capita cost of basic food requirements which meet 100% adequacy of the recommended dietary allowance for protein and energy and 80% of all other nutrients. This measure of survival needs was PhP9,183 nationally in 2000, which translates to PhP11,067 in 2004 after taking into account the effect of inflation.
5.2 Levels of Poverty Table 13 presents summary measures of income levels in the five communities under scrutiny. Mean household income in our sample, expressed on an annual and per capita basis, is equal to PhP18,889, while the median amounts to PhP12,925, and the standard deviation to PhP21,892. These figures do not describe the entire distribution of income very well but, nonetheless, suggest, when compared to the poverty lines calculated for each region, that poverty levels in the studied communities are substantial and that inequalities within these communities are relatively large as well. The table also reveals some differences across barangays. While the three communities SK, SA and NL appear relatively similar in terms of income levels, barangay LA is much poorer (mean income of only PhP9,379) and NB stands out from its particularly unequal distribution of income, as revealed by a relatively large mean (PhP23,673) but a very low median (PhP11,742) and an extremely large standard deviation (PhP40,344). Going further in our assessment requires the choice of an aggregate poverty measure and the most popular one is the headcount index, defined as the percentage of the population below the poverty line. The index is used mainly because of its simplicity of interpretation but suffers from severe theoretical shortcomings (Ravallion, 1996), the main issue relating to its invariance with respect to a change in the distribution of income among the poor. For instance, a clearly undesirable evolution where all poor people become poorer while the non-poor maintain their income levels does not result in any change in the headcount index. The issue has also relevance when evaluating policies because, for instance, if a project manages to raise the income of the extremely poor, but not enough to lift them above the poverty line, success will not be reflected in the head-count measure of poverty.
8 In fact, some authors consider that the exercise introduces so much arbitrariness into the analysis that the poverty line should simply be set to plus infinity (Deaton, 1996). 9 The address is www.census.gov.ph/data/sectordata/2000/ie00pftx.html. 10 http://www.nscb.gov.ph/ru8/default.asp
14

These problems led researchers to develop alternative ‘distribution-sensitive’ poverty indicators, such as the poverty gap, which is the mean distance separating the population from the poverty line, with the non-poor being given a distance of zero. It measures the poverty deficit or depth of poverty of the population, i.e. the resources that would be needed to lift all the poor out of poverty through perfectly targeted cash transfers. Mathematically, it is defined as:
∑=
⎥⎦
⎤⎢⎣
⎡ −=
q
i
i
zyz
nPG
1
1 (1)
where n denotes the size of the population, yi the income of individual i, q the number of poor people and z the poverty line. Even though this measure represents an improvement over the headcount index, it has some restrictive properties, in particular the fact that, when judging the impact of an increase in income of a poor person, the distance of that poor person’s income from the poverty line is not taken into account (i.e., it does not matter how poor that person is). If it is believed that society or policy makers should place a larger weight on the welfare of extremely poor people, the squared poverty gap, which is often described as a measure of the severity of poverty, might be preferable. It is defined mathematically as:
∑=
⎥⎦
⎤⎢⎣
⎡ −=
q
i
i
zyz
nP
1
212 (2)
Hence, it can simply be interpreted as a weighted poverty gap, where the weights are calculated as the distance of each poor person’s income to the poverty line. We note in passing that all three aggregate measures of poverty relate to each other in the sense that they represent special cases of a class of indicators first proposed by Foster et al. (1984) defined as11:
∑=
⎥⎦
⎤⎢⎣
⎡ −=
q
i
i
zyz
nP
1
1)(α
α (3)
The aggregate poverty measures are reported in Table 13, which indicates that 59% of the sample population falls below the poverty line. Hence, the incidence of poverty in the five communities is clearly high and exceeds by far the national average, as the headcount reported in Table 1 for the whole of the rural areas of the Philippines is only 40.1%. It was expected to find a higher poverty incidence in Region 6 than in Region 3, but that is not the case. In fact, barangay NL has the lowest poverty headcount, while barangay LA has the highest one, and both are located in Region 6. More relevant than regional differences might be the remoteness of the communities, because barangays SK and LA, which are both relatively difficult to access, have a relatively high poverty incidence. Table 13 also presents estimates of the poverty gap and squared poverty gap for each community and the whole sample. It is reassuring to find that the ranking of the five barangays does not depend on the choice of aggregate poverty measure . Poverty is the least prevalent in barangay NL, followed by barangay SA, barangay SK, barangay NB, and, finally, barangay LA. The poverty gap for the whole sample (0.28) indicates that the depth of poverty is relatively large among our sample households as it means that eliminating poverty completely in these communities would require cash transfers amounting to 28% of the poverty line for every individual. Finally, Table 13 presents a measure of extreme poverty, which is simply the headcount index calculated not with respect to the poverty line, but, instead, the food threshold. The sample average of 0.43% confirms that absolute poverty represents a major problem for these coastal communities. Comparison of the five barangays once again confirms that poverty is worst in LA, but the ranking is slightly modified for the three communities with the lowest poverty incidence (SK, SA and NL). In conclusion, these aggregate figures indicate clearly that all five communities are poor, with a high incidence of extreme poverty defined as a situation where households are unable to satisfy even their most basic needs for food. Barangays LA and NB stand out as being particularly poor, while no clear regional differences regarding the incidence of poverty can be established from our sample.
5.3 Is Aquaculture Pro-poor?
11 The head count index is obtained for α=0, the poverty gap for α=1, and the squared poverty gap for α=2.
15

Our analysis of the relationship between aquaculture and poverty starts by evaluating the quantitative importance of fish-farming related activities in generating income in the three barangays (SK, SA, and NL) where the industry is present12. Table 14 reports total income from aquaculture for each barangay and the whole sample, expressed per household and per capita, as well as the aggregate and average shares of aquaculture in household income13. It is clear that aquaculture represents a quantitatively important economic activity in all three communities, as the table reveals that aquaculture generates an income of, on average, PhP27,194 per household or PhP5,038 per capita. This income stream represents 29% of total income accruing to the sample households, while the average income share from aquaculture amounts to 39%. On the other hand, these figures indicate that households in these communities are also able to diversify their sources of income, and the previous percentages can be compared to an average non-farm share of rural household income of 42% in the whole of the Philippines (FAO, 1998). Hence, aquaculture is economically significant in these coastal communities, but it is one of many important activities, including fishing, retailing and construction. The table further reveals that fish-farming is much more important in barangay SK than in the other two areas. This is explained by the fact that barangay SA is close to the relatively urban centre of Sasmuan, which offers job opportunities, while workers from barangay NL can find jobs in agriculture as the barangay is connected to the mainland. By contrast, barangay SK is relatively remote so that fishing and aquaculture represent the main economic activities. Indeed, the share of income from aquaculture in SK is on average 58%, so that the activity is obviously an essential source of livelihood in that community. These results also confirm that the economic environments of the three barangays differ substantially, which was deemed desirable when setting up the survey and suggests that our purposive sampling strategy was, from that point of view, relatively successful. Next, we investigate the pro-poor nature of aquaculture by distinguishing the income generated by aquaculture that accrues to the poor and the non-poor. Table 14 establishes clearly that both groups benefit substantially from the activity: a poor household derives, on average, an income of PhP23,863 from aquaculture, which translates into PhP3,951 per capita, or roughly a quarter of the poverty line. A non-poor household benefits even more, with an average income of PhP30,809, or PhP6,552 in per capita terms. These results are consistent with the opinions expressed by respondents about the distributional properties of aquaculture (see section 4.2): clearly, both the poor and the rich14 benefit from the activity. Furthermore, while the poor benefit less from fish-farming in absolute terms, they benefit a lot more in relative terms. Thus, Table 14 reveals that aquaculture accounts for 44% of income for the poor, but only half as much (23%) for the rich. This is a key result of our analysis that gives strong empirical support to the idea that brackish water aquaculture is indeed pro-poor in the Philippines. Further, this conclusion appears robust to the choice of community and poverty line and can therefore be stated with confidence. First, with regard to the choice of barangay, the aggregate shares of income from aquaculture for the poor and non-poor are 34% and 11% respectively in SA, 31% and 12% in NL, while both are equal to 57% in SK. Then, the pro-poor character of aquaculture becomes even more evident when focusing on the subset of extremely poor households, i.e. those with an income below the food threshold. For the whole sample, these extremely poor households derive more than half their income (54%) from aquaculture, as opposed to only 25% for the remaining households and, here again, the same pattern emerges within each barangay. In particular, in SK where aquaculture benefits the poor and the rich equally in relative terms, the activity accounts for a massive 71% of income of the extremely poor, as opposed to only 53% for the remaining households. The corresponding percentages in SA are 43% versus 13%, while they are 42% and 12% in NL.
12 Barangay Lat-asan was selected to represent a community where only part of the land was occupied by fishponds. However, we found that only a negligible income stream was attributable to aquaculture in that community, in part due to the small area of ponds, and could therefore not include the barangay in this analysis. 13 The aggregate share is the sum of aquacultural incomes divided by the sum of household incomes for the group of households considered. The average share is the arithmetic average of the ratio aquaculture income/household income for each household in the group. 14 We take ‘rich’ as simply meaning non-poor. Most households in that category are in fact far from being rich by any standards.
16

We pursue this investigation by carrying out a simple experiment that assesses by how much poverty would increase if the sample households were not receiving any income from aquaculture. That is, we reproduce the poverty evaluation of section 5.2 by replacing total household income by non-aquacultural income and the results are presented in aggregate form in Table 15. Concentrating on the poverty measures, it is clear that poverty would increase substantially to reach very high levels in all three communities, and that this conclusion does not hinge on the choice of index or poverty line. The headcount is simulated to rise from 54% to a massive 70%, indicating that more than two thirds of households would be poor in the absence of aquaculture. The poverty gap almost doubles from 24% to 47%, which means that eliminating poverty in the absence of aquaculture would require perfectly targeted cash transfers amounting to almost half of the poverty line for every member of these three communities. Finally, the squared poverty gap would almost triple from 0.14 to 0.39. The fact that the relative increase in the squared poverty gap exceeds that of the poverty gap, which is itself larger than that of the headcount index, reveals that eliminating aquacultural income would represent a particularly regressive change, or, in other words, that it would have a particularly detrimental impact on the extremely poor. This interpretation is confirmed by the observation that the increase in the head count index is larger when calculated at the food threshold (19%) than when calculated at the poverty line (16%). Of course, the above simulation represents an over-simplification of reality because, if aquaculture was to disappear from a particular community, individuals deriving income from the sector would be able to reallocate labour and assets to other sectors to generate alternative income. Hence, the above figures represent upper bounds of the likely impact of the disappearance of aquaculture on poverty. Yet, we believe that in reality there would be major obstacles to such a reallocation of household resources, as the Philippines are usually described as a ‘labour surplus economy’ where unemployment and under-employment represent important problems. This view was also shared by most of the respondents, as they identified the lack of jobs as the main cause of poverty in their communities. Further, the previous simulation reinforces the conclusion that aquaculture benefits the poor and the extremely poor disproportionately.
5.4 Measuring and Explaining Income Inequality
The extent of poverty in a particular group of households is simply a function of mean income and the distribution of income within that group. Hence, there is an obvious relationship between income inequality and poverty, and the pro-poor nature of aquaculture depends in large part on how the income generated by the sector is distributed among households. This motivates our investigation of inequality in the three study areas and how it relates to aquaculture. For this purpose, we rely on a large literature that has developed adequate measures of inequality as well as ways of attributing total inequality to different income sources. The analysis starts with the Lorenz curve, which plots the cumulative percentage of the population to the cumulative share of income they control and hence provides a complete geometric characterization of the distribution of income (Sadoulet & de Janvry, 1995). For the 98 households in barangays SA, SK and NL, the Lorenz curve is depicted by the blue line in Figure 3. The Gini coefficient, which represents the most popular summary measure of income inequality, is then defined as the area between the Lorenz curve and the first diagonal (pink line in Figure 3), expressed as a percentage of the total area below the first diagonal. Admissible values therefore range from zero to unity, with larger values of the coefficient indicating larger levels of income inequality.
17

0
20
40
60
80
100
0 20 40 60 80 10
Cumulative Households (%)
Cum
ulat
ive
Hou
seho
ld
Inco
me
(%)
0
Figure 3: Lorenz Curve
The Gini coefficient takes different mathematical expressions and we opt for that proposed by Pyatt, Chen and Fei (1980):
),cov(2_ ryyn
G = (4)
where yi and ri denote the income and rank of household i when the population is ordered by
increasing income, n is the total number of households, is the mean population income, and cov(.) denotes the covariance operator. In the case of our 98 households, the Gini coefficient takes a value of 0.36, which is indicative of significant but modest inequalities. However, when this level of inequality is applied to a mean income that is marginally larger than the poverty line (Table 13), it results in a large number of households being poor.
_y
A very useful property of the Gini coefficient is that it can be broken down according to each particular source of income, which can then be compared in equity terms. The approach was pioneered by Stark, Taylor and Yitzhaki (1986), who investigated the effect of remittances on inequality in two Mexican villages, and derived the following expressions (Sadoulet and de Janvry, 1995, p. 22):
∑=s
sss GRSG (5)
where Ss denotes the share of source s in total income, Gs is the Gini coefficient of the sth source of income, and Rs denotes the Gini correlation coefficient between income source s and total income expressed as15:
),cov(
),cov(ss
s
sryryR = (6)
Expression (5) is fairly intuitive as it states that the effect of income source s on the level of inequality is a function of three factors:
• The relative importance of income source s in total income Ss. Clearly, a source of income accounting for a very small share of total income can only have a minor impact on overall inequality.
• The distribution of income from source s among all households, as measured by Gs. If
only a few households derive a large income from source s (large value of Gs), that source of income will tend to increase overall inequality in the community.
15 By analogy with the previous notations, rs is the rank of household i when the population is ordered by increasing income from source s, denoted ys.
18
• The correlation between income from source s and total income across households. A
low level of correlation indicates that households deriving a relatively large (small) income from source s are not necessarily rich (poor), which therefore tends to reduce overall inequality.
The analysis can be pursued to investigate whether a particular source of income increases or decreases inequality in a group of households. First, it is important to notice that quantities Ss and Gs are both positive and smaller than unity, while Rs can take values in the -1 to +1 range. It is therefore clear from equation (5) that a negative Gini correlation coefficient Rs implies that income source s unambiguously reduces inequality. To determine the overall effect of income source s on inequality when Rs is positive, it is useful to re-write the Gini decomposition as (Sadoulet & de Janvry, 1995):
1=∑s
sss G
GRS (7)
This expression can be interpreted as a weighted average of each source of income’s ‘concentration coefficient’ and indicates that a source of income is inequality increasing (decreasing) if and only if this coefficient is greater (smaller) than unity.
GGR ss /
The above formulae help characterize the overall inequality effect of a particular income source, but it is also interesting to determine the marginal effect, i.e. whether a small change in income source s would increase or decrease inequality. This is motivated by the observation that most policies aim at changing the magnitude of an income source rather than removing it completely or creating it where it did not previously exist. Stark, Taylor and Yitzhaki (1986) derived the change in the Gini coefficient as a result of one percent increase in income from source s as:
)(ln
GGRSy
Gsss
s−=
∂∂ (8)
or, in relative terms:
)1(lnln
−=∂∂
GGR
SyG ss
ss
(9)
These expressions imply that, at the margin, income source s is inequality increasing (decreasing) if and only if the concentration coefficient for that income source is greater (smaller) than unity. The Gini decomposition was used to investigate the impact of aquacultural income on inequality in each barangay as well as the whole sample (Table 16). Focusing on the aggregate results first, while aquaculture represents almost a third of household income, it accounts for less than 3% of the total Gini coefficient of 36%, with non-aquaculture therefore accounting for more than 33%. In other words, only 8% of overall inequality is attributable to aquaculture, while 92% is attributable to other income sources. This limited impact of aquaculture on inequality occurs in spite of the fact that aquacultural income is, on the whole, relatively unequally distributed: its Gini coefficient is 66%, as compared to 57% for income unrelated to fish farming. However, consistent with expression (5), the result is explained primarily by the fact that the Gini correlation coefficient for aquaculture is positive but very small, at 5%, as compared to 90% for non-aquaculture. This decomposition is therefore extremely useful in understanding the impact of aquaculture in these coastal communities. First, the relatively large Gini coefficient for aquaculture simply reflects the fact that a substantial number of households derive no income from this activity. However, the key result relates to the Gini correlation coefficient, which indicates that there is little relation between total household income and aquacultural income. This means that relatively rich (poor) households are not much more likely to derive large (small) incomes from aquaculture than poor (rich) households. We are therefore left, once again, with the conclusion that both poor and rich people benefit substantially from aquaculture in these communities.
19
From the previous set of results, it should come as no surprise that the overall effect of aquaculture is to decrease inequality in these communities, as indicated by a concentration coefficient of 0.11, which is clearly smaller than unity (see equation (7)). Hence, aquaculture is a more equitable source of income than the available alternatives taken together. The inequality reducing nature of aquaculture is also apparent at the margin: a one percent increase in aquacultural income in these communities results in a decrease in the Gini coefficient of 0.08, or more than 21% when expressed in relative terms. This supports the view that aquacultural growth has a strong levelling effect on the distribution of income in these communities. The previous set of conclusions applies broadly to each barangay taken individually, although some interesting nuances are also evident. Most remarkably, in all three communities the decomposition establishes that aquaculture reduces inequality both overall and at the margin, which is an indication of the robustness of our results. Hence, the three concentration coefficients are smaller than unity at 0.11 in SA, 0.81 in SK and -0.41 in NL. In all three communities, the inequality reducing impact of aquaculture is explained primarily by the low or negative correlation between total household income and fish-farming income. Barangay NL stands out in this regard because of its negative Gini correlation coefficient for aquaculture, which indicates that, on average, the poorer a household in that community, the larger the income that it derives from fish-farming activities. It follows that aquaculture is particularly pro-poor in NL, which is consistent with the observation reported in Table 16 that a one percent change in fish-farming income in that community decreases the Gini coefficient by a massive 9% (the corresponding values in SA and SK are 6% and 3% respectively). Finally, the table also reveals that the distribution of aquacultural income varies substantially in the three communities: the Gini coefficient for that source of income is larger than that for other sources of income in SA and NL but smaller in SK. We believe that this simply confirms our interpretation, stated above, that the main determinant of the Gini coefficient for aquacultural income is the number of households deriving no income from the sector. In SA and NL, this number is relatively large, hence justifying the large Gini coefficients. 5.5 Discussion The quantitative analysis presented in this section suggests that aquaculture in the study areas represents a source of income which is both pro-poor and inequality-reducing. This result deserves an explanation which we now seek through an investigation of how the sample households derive income from aquaculture. The data reveals first that very few owners (or operators) of fish farms are represented in our random sample and we interpret this finding as indicating that the industry is concentrated in the hands of a few individuals who tend to live away from the communities where production takes place. In spite of this feature, aquaculture in the coastal areas of the Philippines represents an important source of employment through the direct and indirect demand for labour that it generates. Hence, more than half of the households in barangays SK, SA and NL are involved in at least one aquaculture-related activity. Table 17 gives additional details about the income and employment generated by aquaculture in the three barangay and shows that a large number of economic activities are related to the operation of fish farms:
• Labourers are hired on a daily basis for a wage of approximately PhP150 in Region 3 and PhP100 in Region 6. They usually carry out maintenance tasks related to the fishponds, and most importantly the consolidation of dykes, which involves taking mud by hand from the bottom of the pond and applying it where the dykes need reinforcement16. This operation appears particularly labour intensive in Region 3, where the dykes need to be high and strong to resist tides and seasonal floods. Hired workers in Region 3 are also used in large numbers to remove an invasive weed (local name ‘digman’), which is thought to be detrimental to the survival of prawns. Table 17 indicates that 46% of the sample households derive some income from the sale of wage labour, which accounts for more than a quarter of the total aquacultural income accruing to the three barangays. Hence, the demand for wage labour generated by
16 In recent years, mechanical diggers have been introduced but their use remains rare.
20

aquaculture appears particularly pro-poor because most households can apparently benefit from it.
• Harvests, which take place two to three times a year, also mobilize a large number of workers (usually ten to twenty for a ten-hectare pond) for a full day, at a wage rate of approximately PhP250 in Region 3 and PhP150 in Region 6, which is, sometime, supplemented by a small quantity a fish. Almost one in five households in our sample participates in that activity, but the related income is limited (PhP4,499) because harvests provide at best a few weeks of employment annually for any given individual.
• ‘Caretaking’, which corresponds to the supervision of aquaculture ponds, provides
employment to 23% of households in our sample. The task is usually carried out by a permanent employee who lives on the dykes of the fish pond together with his family. The remuneration of caretakers has several components, including a base monthly salary (around P4,000 in Region 3 and P3,000 in Region 6), incentive payments in the form of a percentage of the harvest, as well as payments in nature (provision of free housing, rice and fish) but arrangements vary from farm to farm and region to region. For instance, incentive payments range from zero to 20% of the harvest and are a lot more frequent in Region 3 than in Region 6. Caretaking is important for the three studied communities because it provides permanent employment to a significant number of workers, a rule of thumb being that one caretaker is usually hired to manage ten hectares of fish ponds. The mean income of participating households is relatively large (PhP51,354) and the activity accounts for 44% of total aquacultural income in the three communities. Notice however that a family of four earning the mean caretaking income would still fall below the poverty line.
• The data reveals that the collection of shells and molluscs which are used as feeds in fish
ponds represents another important activity directly related to aquaculture, in which 14% of households partake. It is usually carried out as an own-account activity but large farms sometime hire full-time workers solely for the purpose of collecting these ‘natural feeds’. Further, the activity appears relatively lucrative with the mean income of participating households amounting to PhP26,621. The importance of this type of feeds is a reflection of the polyculture and extensive nature of the production systems considered here, which often makes it uneconomical to use high quality feeds to, say, grow prawns, when most of the feeds are actually consumed by other species.
• The collection of ‘free fish’, i.e. left-overs after the harvest, appears qualitatively unimportant
as a source of income but it might generate substantial nutritional benefits to poor households.
• The survey finally reveals that there is a whole range of other activities related to aquaculture, directly or indirectly, which provide income and employment to the coastal areas of the Philippines, although they are not listed individually in Table 17. They include the marketing of feeds, seeds (‘fingerling agents’), fish, prawns and crabs; the collection of wild fry and fingerlings; boat transportation of workers, inputs and outputs; and even the construction and maintenance of boats used in the operation of fish ponds. It is likely that Table 17 underestimates the income stream generated by aquaculture through these activities because it is often difficult to attribute a particular activity, such as transportation, solely to aquaculture.
6. Conclusion This paper has investigated the relationship between aquaculture and poverty from several perspectives based on a household survey of five costal communities. We started by examining how this relationship was perceived by the residents of these communities themselves and pursued with a quantitative assessment of the determinants of poverty and inequality. The findings can be summarized as follows:
21

• Aquaculture in the studied communities generates a substantial income stream that benefits both the poor and the rich. This quantitative result confirms the view expressed by a large majority of households, and the perception of aquaculture in the five barangays is overwhelmingly positive.
• While the rich benefit slightly more in absolute terms, the poor benefit a lot more in relative
terms and it is in that sense that aquaculture can be considered pro-poor. Further, the pro-poor nature of aquaculture is evident in different economic environments and only increases when the poverty line is lowered. In particular, the group of extremely poor households that struggles to meet even its basic food needs derives more than half of its income from aquaculture.
• A Gini decomposition exercise established unambiguously that aquaculture represents an
inequality-reducing source of income in these communities. This is explained primarily by a low level of correlation between total income and aquaculture income. In other words, it is not necessarily richer households that derive large incomes from fish farming in these communities.
• Our study does not support the view, present in the literature, that aquaculture contributes to
the marginalisation of the poor. Some residents in coastal communities are aware of possible negative impacts of aquaculture, most notably on fishing, but consider them to be more than offset by job creation in aquaculture.
This set of results might seem surprising at first as brackish water aquaculture in the Philippines is usually considered a rich-man activity. We believe that it is explained primarily by the fact that, while the industry remains relatively concentrated in the hands of rich owners/operators, it is still generating a large demand for relatively unskilled labour. In the context of communities where the primary cause of poverty is the lack of employment opportunities, the jobs directly or indirectly related to fish farming represent an essential source of livelihood for the poor. This also means that policy makers concerned with developing the sector, if aiming to have an impact on poverty, should pay attention to the employment effects of new policies and technologies. While intuitive, this recommendation contrasts with the emphasis that is usually put on production and land productivity growth in the debate about aquaculture development in developing countries.
22
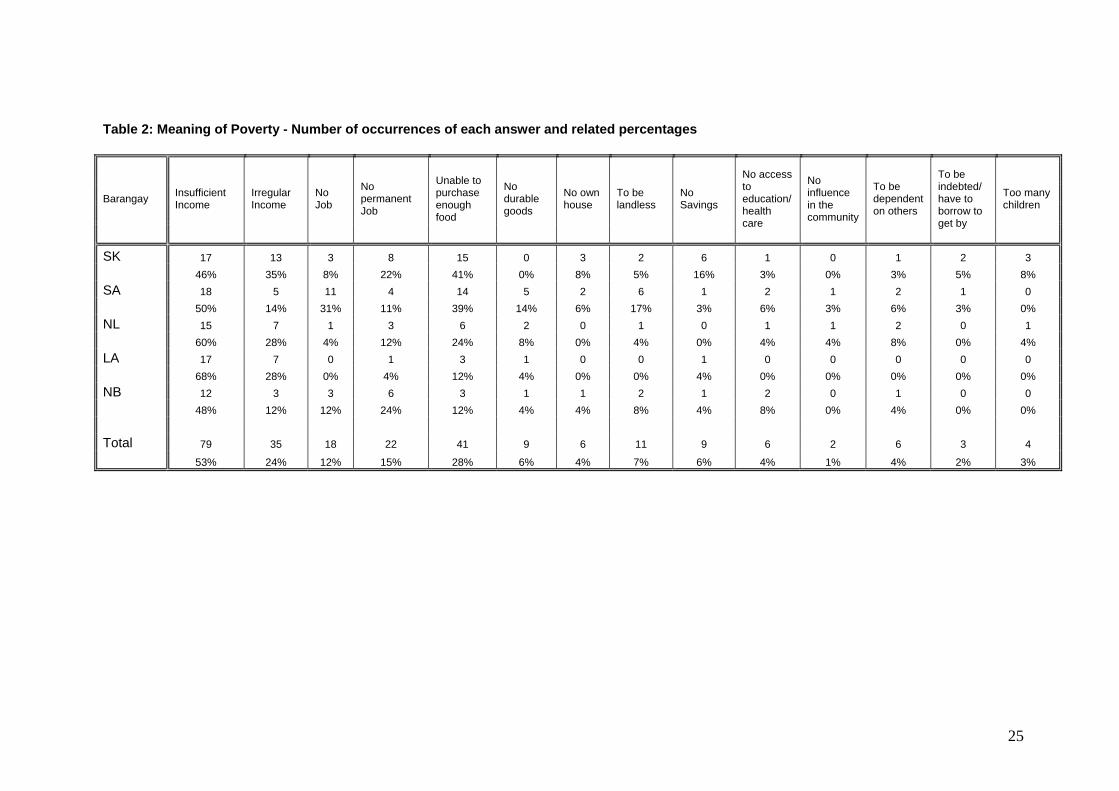
25
Table 2: Meaning of Poverty - Number of occurrences of each answer and related percentages
Barangay Insufficient Income
Irregular Income
No Job
No permanent Job
Unable to purchase enough food
No durable goods
No own house
To be landless
No Savings
No access to education/ health care
No influence in the community
To be dependent on others
To be indebted/ have to borrow to get by
Too many children
SK 17 13 3 8 15 0 3 2 6 1 0 1 2 3 46% 35% 8% 22% 41% 0% 8% 5% 16% 3% 0% 3% 5% 8% SA 18 5 11 4 14 5 2 6 1 2 1 2 1 0 50% 14% 31% 11% 39% 14% 6% 17% 3% 6% 3% 6% 3% 0% NL 15 7 1 3 6 2 0 1 0 1 1 2 0 1 60% 28% 4% 12% 24% 8% 0% 4% 0% 4% 4% 8% 0% 4% LA 17 7 0 1 3 1 0 0 1 0 0 0 0 0 68% 28% 0% 4% 12% 4% 0% 0% 4% 0% 0% 0% 0% 0% NB 12 3 3 6 3 1 1 2 1 2 0 1 0 0 48% 12% 12% 24% 12% 4% 4% 8% 4% 8% 0% 4% 0% 0% Total 79 35 18 22 41 9 6 11 9 6 2 6 3 4 53% 24% 12% 15% 28% 6% 4% 7% 6% 4% 1% 4% 2% 3%

26
Table 3: Sources of Vulnerability Flood Drought Typhon Illness Death Job loss Other
SK 3 1 1 17 1 17 5 8% 3% 3% 46% 3% 46% 14% SA 2 0 4 10 1 11 2 6% 0% 11% 28% 3% 31% 6% NL 5 0 3 11 1 0 1 20% 0% 12% 44% 4% 0% 4% LA 4 0 1 8 1 0 0 16% 0% 4% 32% 4% 0% 0% NB 5 0 0 9 4 0 0 20% 0% 0% 36% 16% 0% 0% Total 19 1 9 55 8 28 8 13% 1% 6% 37% 5% 19% 5%
Table 4: Perceived causes of poverty
Barangay Low Salaries
Unemployment/ No stable jobs
Hig Prices of Necessities
Lack of Education
Lack of Physical Assets
Scarcity of Fish
Dependence on Fishing/ Farming
Over-population/ Too Many Children
Vices/ Laziness/ Irresponsible Behaviour
SK 5 24 6 4 3 3 1 13 12 14% 65% 16% 11% 8% 8% 3% 35% 32% SA 0 25 1 5 3 7 7 1 6 0% 69% 3% 14% 8% 19% 19% 3% 17% NL 5 19 0 0 2 0 2 1 5 20% 76% 0% 0% 8% 0% 8% 4% 20% LA 4 11 2 0 8 9 14 1 0 16% 44% 8% 0% 32% 36% 56% 4% 0% NB 10 15 2 5 1 0 0 5 5 40% 60% 8% 20% 4% 0% 0% 20% 20% Total 24 94 11 14 17 19 24 21 28 16% 64% 7% 9% 11% 13% 16% 14% 19%

27
Table 5: Coping Strategies
Barangay Work More Borrow
Sell Assets
Help from Support Network
Help from Government
Reduce Consumption/ no coping mechanism
Rely on Own Savings
Start Family Business
SK 5 22 7 24 0 6 2 4 14% 59% 19% 65% 0% 16% 5% 11% SA 5 15 1 18 3 6 1 0 14% 42% 3% 50% 8% 3% 3% 0% NL 1 6 1 12 2 12 0 0 4% 24% 4% 48% 8% 8% 0% 0% LA 1 7 2 9 2 11 0 0 4% 28% 8% 36% 8% 44% 0% 0% NB 0 10 2 12 2 13 0 0 0% 40% 8% 48% 8% 52% 0% 0% Total 12 60 13 75 9 48 3 4 8% 41% 9% 51% 6% 32% 2% 3%
Table 6: How Can Poverty Be Reduced? Barangay
Create More Job
Opportunities
Create Livelihood
Opportunities for Women
Improve Individual Behaviour
More Investment/
credit Government
Help
Improve Access to Education
Improve Family
Planning Develop
Aquaculture None
SK 10 4 11 0 2 0 1 4 14 27% 11% 30% 0% 5% 0% 3% 11% 38% SA 11 0 10 7 2 3 3 0 9 31% 0% 28% 19% 6% 8% 8% 0% 25% NL 6 0 16 2 6 0 0 1 0 24% 0% 64% 8% 24% 0% 0% 4% 0% LA 4 0 7 4 6 0 0 0 5 16% 0% 28% 16% 24% 0% 0% 0% 20% NB 9 0 14 2 4 1 1 0 0 36% 0% 56% 8% 16% 4% 4% 0% 0% Total 40 4 58 15 20 4 5 5 28 27% 3% 39% 10% 14% 3% 3% 3% 19%
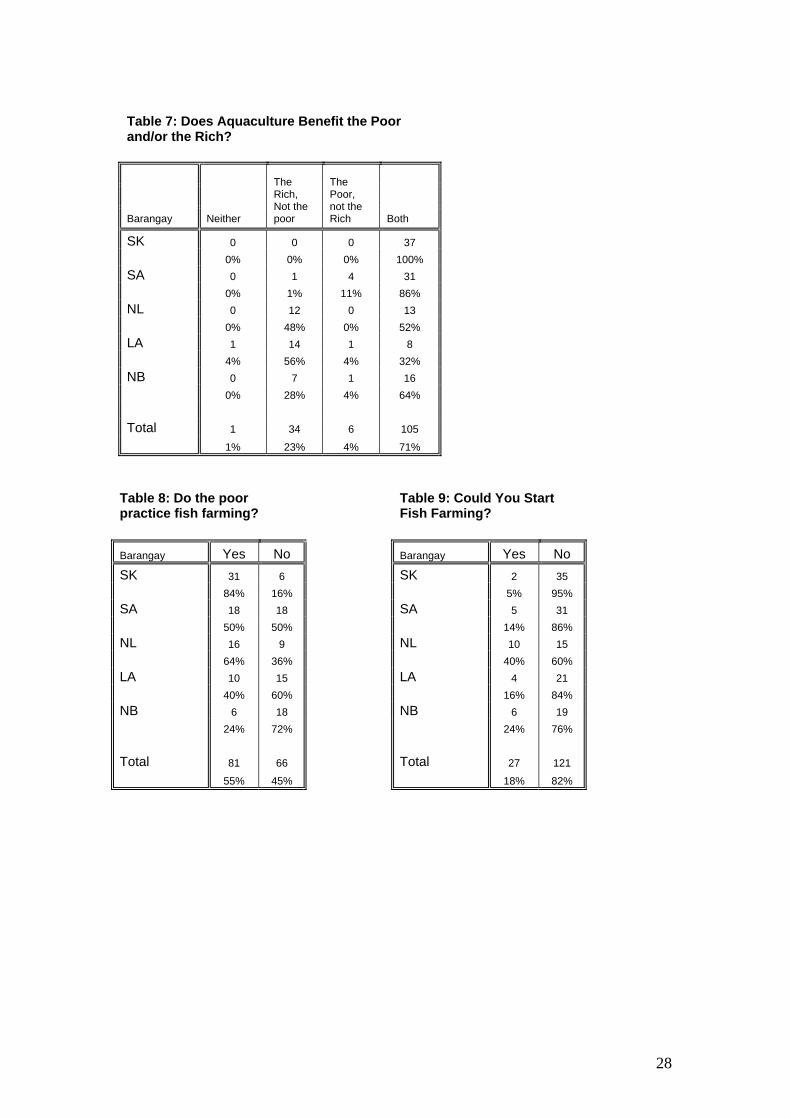
28
Table 7: Does Aquaculture Benefit the Poor and/or the Rich?
Barangay Neither
The Rich, Not the poor
The Poor, not the Rich Both
SK 0 0 0 37 0% 0% 0% 100% SA 0 1 4 31 0% 1% 11% 86% NL 0 12 0 13 0% 48% 0% 52% LA 1 14 1 8 4% 56% 4% 32% NB 0 7 1 16 0% 28% 4% 64% Total 1 34 6 105 1% 23% 4% 71%
Table 8: Do the poor practice fish farming?
Barangay Yes No SK 31 6 84% 16% SA 18 18 50% 50% NL 16 9 64% 36% LA 10 15 40% 60% NB 6 18 24% 72% Total 81 66 55% 45%
Table 9: Could You Start Fish Farming?
Barangay Yes No SK 2 35 5% 95% SA 5 31 14% 86% NL 10 15 40% 60% LA 4 21 16% 84% NB 6 19 24% 76% Total 27 121 18% 82%

29
Table 10: Does Fish Farming Have Any negative Impact on the Poor? No Yes
Barangay Total Negative Impact on fishing Exploitation of the Poor Arduous work Irregular Income
SK 12 25 24 1 1 0 32% 68% 65% 3% 3% 0% SA 27 9 3 1 0 4 75% 25% 8% 3% 0% 11% NL 23 2 1 1 1 0 92% 8% 4% 4% 4% 0% LA 18 7 7 0 0 0 72% 28% 28% 0% 0% 0% NB 24 1 0 1 0 0 96% 4% 0% 4% 0% 0% Total 104 44 35 4 2 4 70% 30% 24% 3% 1% 3%
Table 11: Overall, Is Aquaculture a Good Thing in Your Community? No Yes Main benefit from aquaculture Barangay Total Employment Income Fish/Food Indirect
SK 4 33 26 4 14 1 11% 89% 70% 11% 38% 3% SA 0 36 32 4 17 3 0% 100% 89% 11% 47% 8% NL 0 25 19 14 5 2 0% 100% 76% 56% 20% 8% LA 3 22 3 10 8 1 12% 88% 12% 40% 32% 4% NB 0 25 16 2 15 0 0% 100% 64% 8% 60% 0% Total 7 141 96 34 59 7 5% 95% 65% 23% 40% 5%

30
Table 13: Aggregate Income & Poverty in the Five Communities Barangay Income Poverty
Mean Median SD HC PG P2 HC (Food)
SK 17,214 14,633 12,134 0.59 0.26 0.15 0.35 SA 24,242 17,182 21,555 0.50 0.22 0.12 0.31 NL 18,383 17,974 11,638 0.44 0.21 0.12 0.36 LA 9,379 5,600 10,413 0.84 0.50 0.33 0.76 NB 23,673 11,742 40,344 0.60 0.28 0.17 0.44
Total 18,889 12,925 21,892 0.59 0.28 0.17 0.43
Table 12: Ladder Diagram Barangay Food Fish Employment Cash
-5 years Now + 5 years -5 years Now + 5 years
SK Average 6.55 6.09 6.46 7.88 7.26 7.00 7.53 7.69 SD 2.11 1.91 1.84 2.19 2.26 2.22 3.14 3.11 SA Average 7.11 6.44 7.45 7.19 7.28 7.91 3.75 3.72 SD 1.75 1.81 2.06 2.07 1.86 2.13 3.59 3.57 NL Average 4.46 4.17 4.71 5.21 4.42 4.71 5.96 5.42 SD 2.15 1.24 1.55 1.74 1.47 1.52 3.24 3.08 LA Average 3.60 3.44 3.24 4.16 4.16 3.52 0.60 0.52 SD 1.29 1.23 1.20 1.52 1.37 1.16 2.08 1.71 NB Average 4.12 4.08 4.48 4.72 4.64 4.72 0.40 0.32 SD 1.76 1.66 1.83 1.51 1.47 1.51 2.00 1.60 Total Average 5.40 5.05 5.43 6.06 5.80 5.74 3.88 3.80
SD 2.32 2.03 2.31 2.36 2.27 2.43 4.05 3.98

31
Table 14: Aquaculture and Income Generation Income From Aquaculture (PhP)
Barangay Households Per
Household Per
Capita
Average Share of
household Income
Aggregate Share of
Household Income
SK All 43,927 8,167 0.58 0.57 Poor 32,535 5,342 0.58 0.57 Non-Poor 60,636 13,993 0.58 0.57 Extremely Poor 30,872 4,778 0.65 0.71 Non-Extremely Poor 50,999 10,643 0.54 0.53 SA All 19,282 3,403 0.23 0.17 Poor 18,877 2,763 0.31 0.34 Non-Poor 19,686 3,730 0.16 0.11 Extremely Poor 21,072 3,175 0.35 0.43 Non-Extremely Poor 18,494 4,203 0.18 0.13 NL All 13,823 2,743 0.33 0.17 Poor 14,676 2,484 0.41 0.31 Non-Poor 13,153 3,019 0.26 0.12 Extremely Poor 16,056 2,779 0.48 0.42 Non-Extremely Poor 12,567 2,717 0.24 0.12 All All 27,194 5,038 0.39 0.29 Poor 23,863 3,951 0.45 0.44 Non-Poor 30,809 6,552 0.32 0.23 Extremely Poor 23,564 3,721 0.51 0.54
Non-Extremely Poor 29,037 5,898 0.33 0.25
Table 15: Simulated Poverty Levels (No Aquaculture) Barangay Income Poverty
Mean Median SD HC PG P2 HC (Food)
SK 7,869 2,833 10,778 0.86 0.64 0.54 0.70 SA 20,698 13,555 22,878 0.58 0.35 0.27 0.44 NL 12,631 11,667 11,522 0.64 0.41 0.34 0.48
Total 13,796 8,179 17,212 0.70 0.47 0.39 0.55
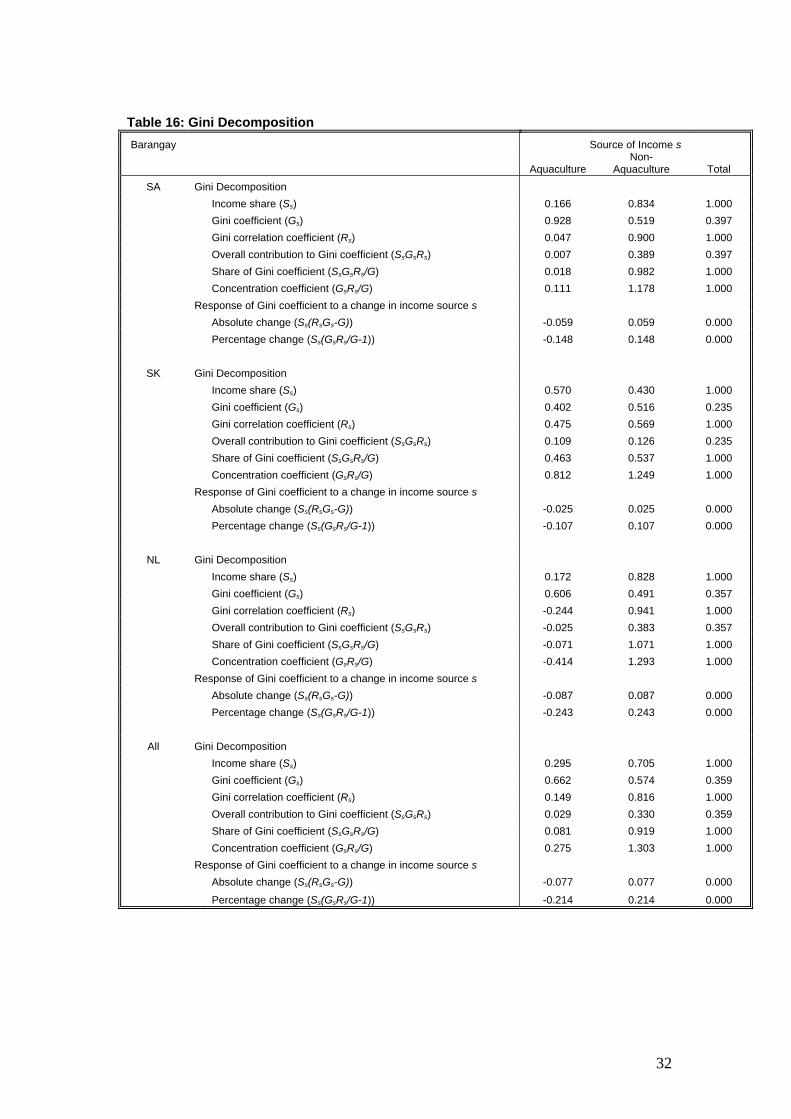
32
Table 16: Gini Decomposition Barangay Source of Income s
Aquaculture Non-
Aquaculture Total
SA Gini Decomposition Income share (Ss) 0.166 0.834 1.000 Gini coefficient (Gs) 0.928 0.519 0.397 Gini correlation coefficient (Rs) 0.047 0.900 1.000 Overall contribution to Gini coefficient (SsGsRs) 0.007 0.389 0.397 Share of Gini coefficient (SsGsRs/G) 0.018 0.982 1.000 Concentration coefficient (GsRs/G) 0.111 1.178 1.000 Response of Gini coefficient to a change in income source s Absolute change (Ss(RsGs-G)) -0.059 0.059 0.000 Percentage change (Ss(GsRs/G-1)) -0.148 0.148 0.000
SK Gini Decomposition Income share (Ss) 0.570 0.430 1.000 Gini coefficient (Gs) 0.402 0.516 0.235 Gini correlation coefficient (Rs) 0.475 0.569 1.000 Overall contribution to Gini coefficient (SsGsRs) 0.109 0.126 0.235 Share of Gini coefficient (SsGsRs/G) 0.463 0.537 1.000 Concentration coefficient (GsRs/G) 0.812 1.249 1.000 Response of Gini coefficient to a change in income source s Absolute change (Ss(RsGs-G)) -0.025 0.025 0.000 Percentage change (Ss(GsRs/G-1)) -0.107 0.107 0.000
NL Gini Decomposition Income share (Ss) 0.172 0.828 1.000 Gini coefficient (Gs) 0.606 0.491 0.357 Gini correlation coefficient (Rs) -0.244 0.941 1.000 Overall contribution to Gini coefficient (SsGsRs) -0.025 0.383 0.357 Share of Gini coefficient (SsGsRs/G) -0.071 1.071 1.000 Concentration coefficient (GsRs/G) -0.414 1.293 1.000 Response of Gini coefficient to a change in income source s Absolute change (Ss(RsGs-G)) -0.087 0.087 0.000 Percentage change (Ss(GsRs/G-1)) -0.243 0.243 0.000
All Gini Decomposition Income share (Ss) 0.295 0.705 1.000 Gini coefficient (Gs) 0.662 0.574 0.359 Gini correlation coefficient (Rs) 0.149 0.816 1.000 Overall contribution to Gini coefficient (SsGsRs) 0.029 0.330 0.359 Share of Gini coefficient (SsGsRs/G) 0.081 0.919 1.000 Concentration coefficient (GsRs/G) 0.275 1.303 1.000 Response of Gini coefficient to a change in income source s Absolute change (Ss(RsGs-G)) -0.077 0.077 0.000
Percentage change (Ss(GsRs/G-1)) -0.214 0.214 0.000
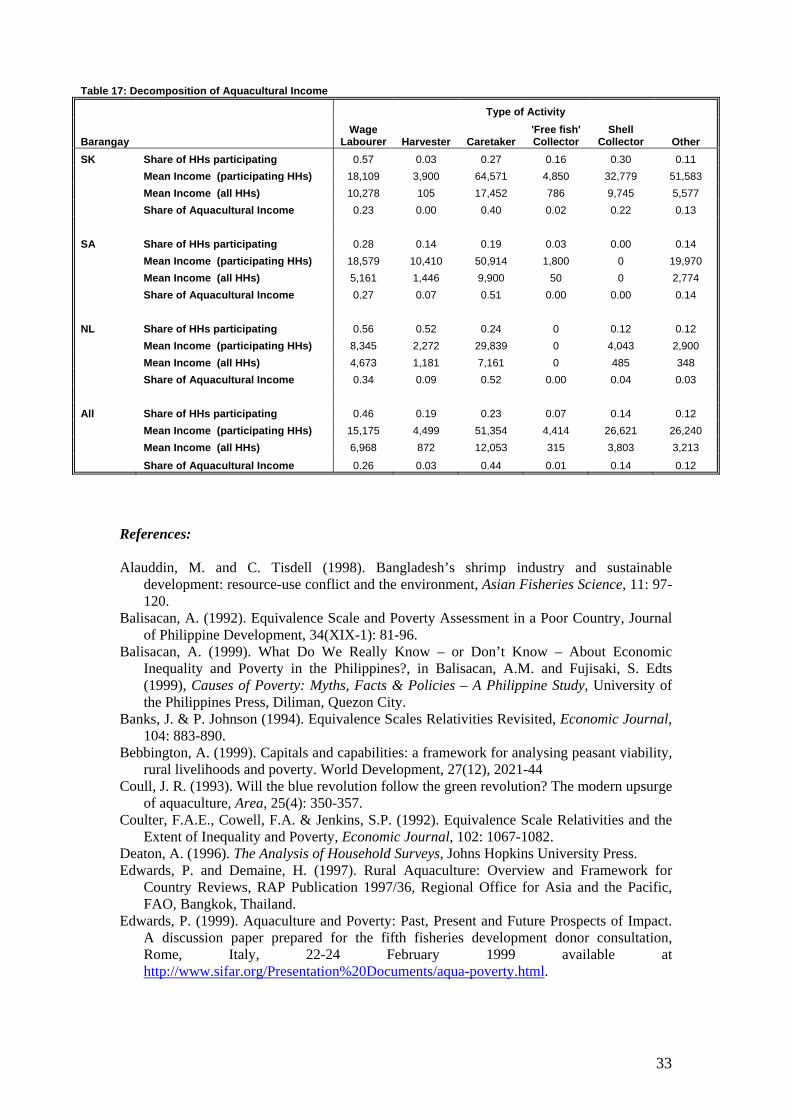
33
References: Alauddin, M. and C. Tisdell (1998). Bangladesh’s shrimp industry and sustainable
development: resource-use conflict and the environment, Asian Fisheries Science, 11: 97-120.
Balisacan, A. (1992). Equivalence Scale and Poverty Assessment in a Poor Country, Journal of Philippine Development, 34(XIX-1): 81-96.
Balisacan, A. (1999). What Do We Really Know – or Don’t Know – About Economic Inequality and Poverty in the Philippines?, in Balisacan, A.M. and Fujisaki, S. Edts (1999), Causes of Poverty: Myths, Facts & Policies – A Philippine Study, University of the Philippines Press, Diliman, Quezon City.
Banks, J. & P. Johnson (1994). Equivalence Scales Relativities Revisited, Economic Journal, 104: 883-890.
Bebbington, A. (1999). Capitals and capabilities: a framework for analysing peasant viability, rural livelihoods and poverty. World Development, 27(12), 2021-44
Coull, J. R. (1993). Will the blue revolution follow the green revolution? The modern upsurge of aquaculture, Area, 25(4): 350-357.
Coulter, F.A.E., Cowell, F.A. & Jenkins, S.P. (1992). Equivalence Scale Relativities and the Extent of Inequality and Poverty, Economic Journal, 102: 1067-1082.
Deaton, A. (1996). The Analysis of Household Surveys, Johns Hopkins University Press. Edwards, P. and Demaine, H. (1997). Rural Aquaculture: Overview and Framework for
Country Reviews, RAP Publication 1997/36, Regional Office for Asia and the Pacific, FAO, Bangkok, Thailand.
Edwards, P. (1999). Aquaculture and Poverty: Past, Present and Future Prospects of Impact. A discussion paper prepared for the fifth fisheries development donor consultation, Rome, Italy, 22-24 February 1999 available at http://www.sifar.org/Presentation%20Documents/aqua-poverty.html.
Table 17: Decomposition of Aquacultural Income
Type of Activity
Barangay Wage
Labourer Harvester Caretaker 'Free fish' Collector
Shell Collector Other
SK Share of HHs participating 0.57 0.03 0.27 0.16 0.30 0.11 Mean Income (participating HHs) 18,109 3,900 64,571 4,850 32,779 51,583 Mean Income (all HHs) 10,278 105 17,452 786 9,745 5,577 Share of Aquacultural Income 0.23 0.00 0.40 0.02 0.22 0.13 SA Share of HHs participating 0.28 0.14 0.19 0.03 0.00 0.14 Mean Income (participating HHs) 18,579 10,410 50,914 1,800 0 19,970 Mean Income (all HHs) 5,161 1,446 9,900 50 0 2,774 Share of Aquacultural Income 0.27 0.07 0.51 0.00 0.00 0.14 NL Share of HHs participating 0.56 0.52 0.24 0 0.12 0.12 Mean Income (participating HHs) 8,345 2,272 29,839 0 4,043 2,900 Mean Income (all HHs) 4,673 1,181 7,161 0 485 348 Share of Aquacultural Income 0.34 0.09 0.52 0.00 0.04 0.03 All Share of HHs participating 0.46 0.19 0.23 0.07 0.14 0.12 Mean Income (participating HHs) 15,175 4,499 51,354 4,414 26,621 26,240 Mean Income (all HHs) 6,968 872 12,053 315 3,803 3,213
Share of Aquacultural Income 0.26 0.03 0.44 0.01 0.14 0.12

34
Estudillo, J.P. & Otsuka, K. (1999) ‘Green Revolution, Human Capital, and Off-farm Employment: Changing Sources of Income Among Farm Households in Central Luzon, 1966-1994’, Economic Development and Cultural Change 47: 497-523.
Fafchamps, M. & Gubert, F. (2003) Contingent loan repayment in the Philippines, Working paper, Department of Economics, University of Oxford, 51 pp.
FAO (1998). The State of Food and Agriculture 1998, FAP, Rome. FAO (2003). The State of the World Fisheries and Aquaculture 2002, FAO, Rome. Foster, J., Greer, J., & Thorbecke, E. (1984). A class of decomposable poverty measures,
Econometrica, 52(3): 761-766. Grosh, M. & Glewwe, P. (2000). Designing Household Survey Questionnaires for Developing
Countries: Lessons from 15 Years of the Living Standards Measurement Study, Washington, The World Bank.
Halwart, M., Funge-Smith, S. and Moehl, J. (2003). The Role of Aquaculture in Rural Development, in FAO (2003), The State of the World Fisheries and Aquaculture 2002, FAO, Rome.
Hardin, G. (1968). The Tragedy of the Commons, Science, 162: 1243-1248. Irz, X., Lin, L., Thirtle, C. & Wiggins, S. (2001). Agricultural growth and poverty alleviation,
Development Policy Review, 19(4): 449-466. Lipton, M. (1997). Poverty – Are There Holes in the Consensus? World Development, 25(7):
1003-1007. Muir, J. (1999). Aquaculture and Poverty: Full Baskets or Empty Promises? Perspectives
from the DfID Aquaculture Research Program, Contributed paper, Fifth Fisheries Development Donor Consultation.
Pyatt, G., Chen, C.-H. & Fei, J. (1980). The Distribution of Income by Factor Components, Quarterly Journal of Economics, 95: 451-73.
Prein, M. and Ahmed, M. (2000). Integration of Aquaculture into Smallholder Farming Systems for Improved Food Security and Household Nutrition. Food Nutrition Bulletin, 21: 466-471.
Primavera, J. H. (1997). Socio-economic impacts of shrimp culture, Aquaculture Research, 28(10): 815-827.
Ravallion, M. (1996). Issues in Measuring and Modelling Poverty, Economic Journal 106: 1328-1343.
Ravallion, M. and Chen, S. (1997) What Can New Survey Data Tell Us About Recent Changes in Distribution of Poverty?, World Bank Economic Review, 11: 282-357.
Sadoulet, E. & de Janvry, A. (1995). Quantitative Development Policy Analysis, Johns Hopkins University Press, Baltimore & London.
Sen, A. (1985). Commodities and Capabilities. Amsterdam, North-Holland. Stark, O., Taylor, J.E. & Yitzhaki, S. (1986). Remittances and Inequality, Economic Journal,
96:722-740. Stonich, S.C., Bort, J.R. and Ovares, L.L. (1997). Globalization of the Shrimp Mariculture:
The Impact on Social Justice and Environmental Quality in Central America, Society and Natural Resources, 10(2): 161-179.
Tacon, A.G.J. (2001). Increasing the Contribution of Aquaculture for Food Security and Poverty Alleviation. In Subasinghe, R.P., Bueno, P.B., Phillips, M.J., Hough, C., McGladdery, S.E. and Arthur, J.R. (eds), Aquaculture in the Third Millenium, Bangkok, Thailand, 20-25 February 2000, pp. 63-72. NACA, Bangkok, Thailand, and FAO, Rome, Italy.
Yap, W. G. (1999). Rural aquaculture in the Philippines, FAO, Rome.

Appendix: Questionnaire Survey SURVEY OF HOUSEHOLDS IN THE COASTAL AREAS OF THE PHILIPPINES Municipality: Barangay: Date of first visit: Date of second visit:

Part 1. HOUSEHOLD ROSTER PERSON INTERVIEWED: PREFERABLY THE HEAD OF THE HOUSEHOLD. IF HE/SHE IS NOT AVAILABLE, FIND A “PRINCIPAL RESPONDENT” TO ANSWER THE QUESTIONS IN HIS/HER PLACE. THE PERSON SELECTED MUST BE A MEMBER OF THE HOUSEHOLD WHO IS ABLE TO GIVE INFORMATION ON THE OTHER HOUSEHOLD MEMBERS. A person is considered part of the household: - If he/she normally lives and eats his/her meals in the household’s dwelling - If he/she is not away from the household more than 9 months a year 1. 2. 3. 4. 5. 6. ID
CO
DE
MAKE A COMPLETE LIST OF ALL CONCERNED BEFORE GOING TO QUESTIONS 2-6
SEX RELATIONSHIP TO HEAD: HEAD.................1WIFE/HUSBAND.........2CHILD/ADOPTED CHILD..3GRANDCHILD...........4NIECE/NEPHEW.........5FATHER/MOTHER........6SISTER/BROTHER.......7SON/DAUGHT.-IN-LAW...8BROTHER/SISTER-IN-LAW..................9GRANDFATHER/MOTHER..10FATHER/MOTHER-IN-LAW.11 OTHER RELATIVE......12SERVANT OR SERVANT'S RELATIVE...........13TENANT OR TENANT'S RELATIVE...........14OTHER(SPECIFY_____).15
AGE What is the present marital status of [NAME]? MARRIED..1 DIVORCED.2 SEPARATED.3 WIDOW OR WIDOWER..4 NEVER MARRIED..5
Religion CATHOLIC..1 PROTESTANT...2 MUSLIM….3 OTHER….4
MALE.1
NAME FEMALE 2 YEARS
1
2
3
4
5
6
7
8
9
10
11
12

PART 2. EDUCATION
1. 2. 3. 4. 5. 6. ID C
OD
E
Are you currently enrolled in school?
What is the highest level you have completed in school? Codes: Elementary: 1-6 High school: 7-10 College: 11-16 Vocational: V1-V3
In what grade are you currently enrolled in school? Use same codes as for Q2.
Is the school you are currently enrolled in public or private? PUBLIC.1PRIVATE SECU- LAR..2 PRIVATE RELIG- IOUS..3
How far away from your home is the school you have been attending in the last 12 months?
How do you go to school? WALK.1 BICYCLE.....2 CAR...3 Public Transport...…4 BOAT..5 OTHER (SPE- CIFY).6
YES..1(»3-7)
>>next person
NO..0 DISTANCE
1
2
3
4
5
6
7
8
9
10
11
12
Do you face any major problem to send your children to school?
No……………………………………………………………………………..1 Yes, fees are too high........................................................................................2 Yes, costs (textbooks, uniforms, etc.) other than fees are too high……….…...3 Yes, transportation to school…………………………………………………..4 Other (Specify)………………...………………………………………………5

PART 3: EMPLOYMENT I would like to ask each household member questions about the work that he/she did the last 12 months, whether work on a farm, on his/her own account, in a household business enterprise, or for someone else.
1. 2. 3. 4. 5. 6. 7. ID C
OD
E
For what type of business were you working? Household/own account enterprise…………....... 1 Business owned by a family member outside the household .2Business owned by non-household/non-family member……3
For how many weeks in the last 12 months did you do this work?
During these weeks, how many hours per week did you usually do this work?
How much was your last payment? If respondent has not been paid, ask: What payment do you expect? What period of time did this payment cover?
If you received fish as a form of payment, how much did you receive? Over what time interval?
If you received a non-monetary payment for this work other than fish, what was the value of this payment?
WRITTEN DESCRIPTION WEEKS/ YEAR
HOURS/ WEEK
Pesos (Specify time
period)
Kg (Specify
time period)
Pesos (Specify time
period)
What did you do?
For own-account fish-farming, farming and fishing, do not ask questions on payments (i.e., stop at column 5 (included)).

PART 4. LAND-BASED ACTIVITIES 4.1. ACCESS TO LAND
1. 2. 3. 4. 5. PLO
T CO
DE
Please tell me about each plot of land owned, rented or leased by your household?
What is the area of the plot?
What kind of land is this? Brackish water Fish Pond..1 Fresh water fishpond….2 Non-irrigated agricultural land…….....3 Irrigated agricultural land…………………4 OTHER(SPE- CIFY_)....5
Is this land owned and used by your household, rented/leased in or rented out? Owned and used…….1 Owned and rented out……….2Leased under FLA…..3 Rented in from private owner…………….4
How did your household acquire this land? INHERITED...1 CLEARED.....2 PURCHASED...3 (SPECIFY__).4
NAME OF PLOT (Ha)
1
2
3
4
5
6
7
8
9
10
7. Is it difficult to have access to a fish pond to practice aquaculture? Very difficult…………….1 Rather difficult…………..2 Relatively easy…………...3 Very easy ………………...4 If difficult, why? ____________________________________________________
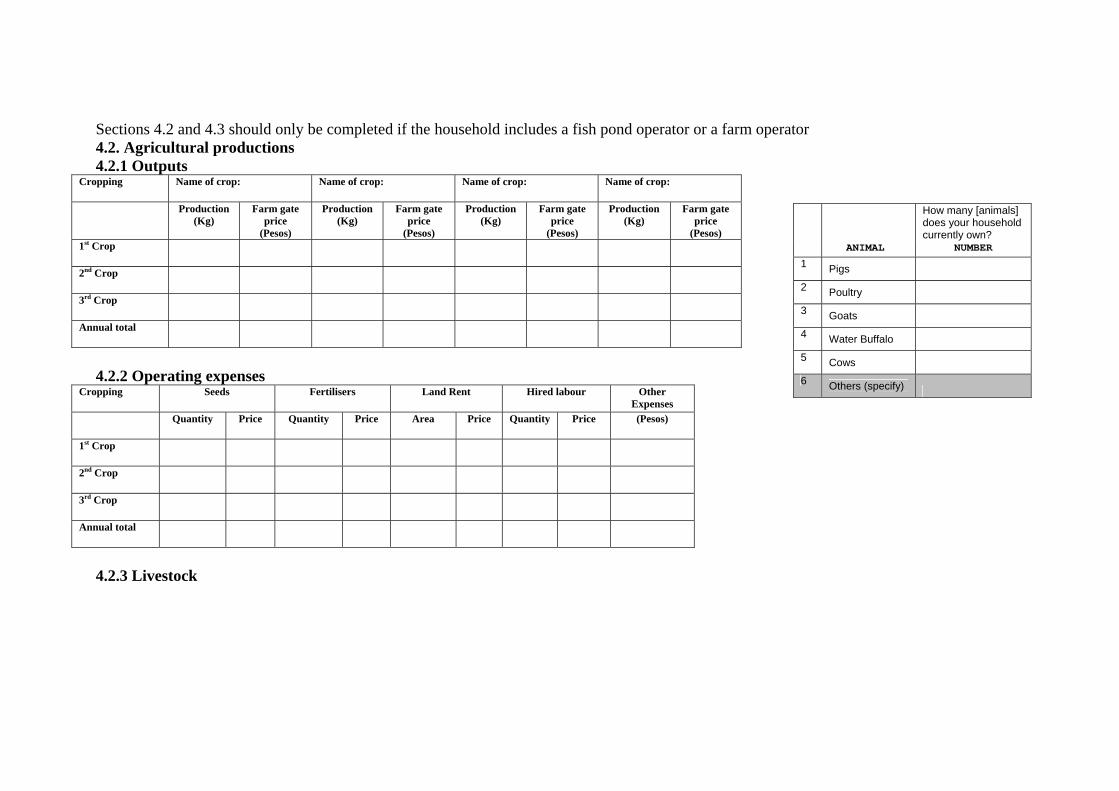
Sections 4.2 and 4.3 should only be completed if the household includes a fish pond operator or a farm operator 4.2. Agricultural productions 4.2.1 Outputs
Cropping Name of crop: Name of crop: Name of crop: Name of crop:
Production Farm gate price (Kg)
(Pesos)
Production (Kg)
Farm gate price
(Pesos)
Production (Kg)
Farm gate price
(Pesos)
Production (Kg)
Farm gate price
(Pesos) 1st Crop
2nd Crop
3rd Crop
Annual total How many [animals]
does your household currently own?
ANIMAL NUMBER
1 Pigs 2 Poultry 3 Goats 4 Water Buffalo 5 Cows 6 Others (specify)
4.2.2 Operating expenses
Cropping Seeds Fertilisers Land Rent Hired labour Other Expenses
Quantity Price Quantity Price Area Price Quantity Price (Pesos)
1st Crop 2nd Crop 3rd Crop Annual total
4.2.3 Livestock

4.3. Aquaculture productions 4.3.1 Output
Harvests Name of fish: Name of fish: Name of fish: Name of fish:
Production Farm gate price (Kg)
(Pesos)
Production (Kg)
Farm gate price
(Pesos)
Production (Kg)
Farm gate price
(Pesos)
Production (Kg)
Farm gate price
(Pesos) 1st Harvest
2nd Harvest
3rd Harvest
Annual total
4.3.2 Operating expenses
Cropping Fry/fingerlings Feeds Fertilsers Land Fertilisers Land Rent Hired labour Other Expenses
Quantity Price Quantity Price Quantity Price Quantity Price Quantity Price Area Price Quantity Price (Pesos)
1st Crop 2nd Crop 3rd Crop Annual total
4.3.3 Extension 1. How many times during the last 12 months did members of your household visit an aquacultural extension agent or an agricultural extension center to discuss fish/prawn/crab production? Times 2. How many times in the last 12 months did any aquacultural cultural extension agent visit? Times

Part 5. FISHING 1. How many months a year can do you fish (as a professional activity reported in Part3)? (Note: answer should be consistent with answer in the ‘employment’ table) 2. If there are months when you cannot fish, why is that? (No fish, bad weather etc.) 3. In the months when you fish, how much do you typically catch in a week/day? 4. What is the sale price of each product? 5. What are the costs involved in fishing? Specify time period over which those apply.
- Boat rental - Boat maintenance
- Fuel cost
- Fishing gear replacement
- Hired labour
- Other (specify)

Part 6. OTHER SOURCES OF INCOME 1. During the past 12 months has your household or any of its members received any money or goods from persons who are not members of your household? For example for relatives living elsewhere, child support or alimony, or from friends or neighbours? Yes=1, No=0 2. If answer to Q.1 was positive, fill out the table below:
1. 2. 3. 4. DO
NO
R
What is the relationship of donor to this household? 1=spouse 2=sibling 3=son/daughter 4=parent/s 5=other
How much money have members of the household received from[DONOR] in the past 12 months?
Where does the donor earn his/her money?
Pesos Place
1
2
3
4
5
6
7
8
9
10
11
12

3. Other sources of income over the last 12 months
How much did your household receive in the last 12
months from [SOURCE] including the value of any payment in the form of goods?
SOURCE PESOS
1 Transfers from the state
Pension
Illness/disability Payment
Social assistance payment
Other (specify)
2 Rental income:
Land
House
Car
Boat
Tricycle
Other (specify)
3 Revenue from sale of assets:
Source 1(Specify)
Source 2
Source 3
Etc..
4 Other Income:
Private pension
Source 2
Source 3
Etc.
5 Other: (Specify)
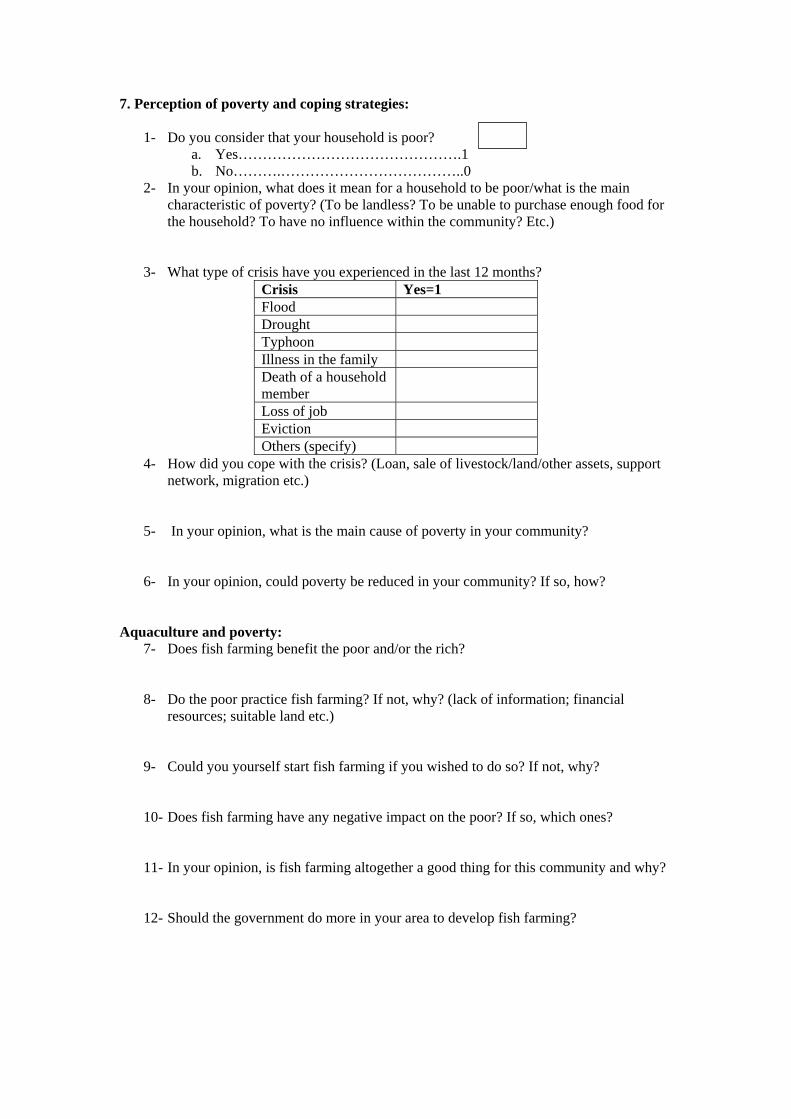
7. Perception of poverty and coping strategies:
1- Do you consider that your household is poor? a. Yes……………………………………….1 b. No……….………………………………..0
2- In your opinion, what does it mean for a household to be poor/what is the main characteristic of poverty? (To be landless? To be unable to purchase enough food for the household? To have no influence within the community? Etc.)
3- What type of crisis have you experienced in the last 12 months? Crisis Yes=1 Flood Drought Typhoon Illness in the family Death of a household member
Loss of job Eviction Others (specify)
4- How did you cope with the crisis? (Loan, sale of livestock/land/other assets, support network, migration etc.)
5- In your opinion, what is the main cause of poverty in your community? 6- In your opinion, could poverty be reduced in your community? If so, how?
Aquaculture and poverty:
7- Does fish farming benefit the poor and/or the rich? 8- Do the poor practice fish farming? If not, why? (lack of information; financial
resources; suitable land etc.) 9- Could you yourself start fish farming if you wished to do so? If not, why? 10- Does fish farming have any negative impact on the poor? If so, which ones? 11- In your opinion, is fish farming altogether a good thing for this community and why?
12- Should the government do more in your area to develop fish farming?

I will now show you a ladder diagram. Please choose a step on the ladder that realistically describes your situation. The first step on the ladder describes the worst possible situation. As the step goes higher, the situation gets better. Thus, the highest step on the ladder represents the best situation that you can have.
Ladder Diagram
10 9 8 7 6 5 4 3 2
Step 1
13- Overall food consumption. The first step on the ladder represents a situation where all household members barely have anything to eat. You hardly know where the next meal is coming from. The highest step indicates a situation where every member of your household eats three nutritious meals daily. Five years ago ______ At present_____ Five years from now_____
13- Fish consumption The first step on the ladder shows a situation where fish/seafood does not form part of you household’s diet at all, even if your household members wanted to eat fish. The highest step on the ladder represents a situation where your household members can eat as much fish as they want. Five years ago ______ At present_____ Five years from now_____ 14- Employment The first step on the ladder describes a situation where no household member earns from any aquaculture-related activity. The highest step on the ladder represents a situation where members of your household obtain all their earnings from various aquaculture-related activities (production, marketing, harvesting, processing, input supply etc.). At present_____ 15- Cash income from aquaculture The first step shows no cash income from aquaculture for your household. The highest step on the ladder shows cash income from aquaculture-related activities that is more than adequate to provide for you household’s needs At present_____

PART 8: CONSUMPTION 8.1 FOOD CONSUMPTION EXCLUDING FISH - MOST KNOWLEDGEABLE MEMBER Number of days since last visit: In the following questions, I want to ask about all purchases made for your household, regardless of which person made them. Q1. Has your household consumed [FOOD] since my last visit? Please exclude from your answer any [FOOD] purchased for processing or resale in a household enterprise.
PURCHASE SINCE LAST VISIT HOME PRODUCTION GIFTS
1. 2. 3. 4. 5.
PUT AN X (X) IN THE APPROPRIATE BOX FOR EACH FOOD ITEM. IF THE ANSWER TO Q.1 IS YES, ASK Q.2-5.
How much of [FOOD] have you or any other member of the household bought since my last visit, that is since []?
What was the total value of your purchase?
Since my last visit, how much [FOOD] did your household consume that you grew or produced at home?
Since my last visit, how much [FOOD] did your household consume that you received as a gift?
Quantity Value Quantity Quantity
NO YES (Specify unit) (Pesos) (Specify
Unit) (Specify Unit)
1 Rice
2 Other cereals
3 Roots/tubers
4 Fruits
5 Vegetables
6 Poultry
7 Pork
8 Beef
9 Other meats and meat products
10 Dairy products and eggs
11 Coffee/cocoa/tea
12 Non-alcoholic beverages
13 Other foods
14 Alcoholic beverages
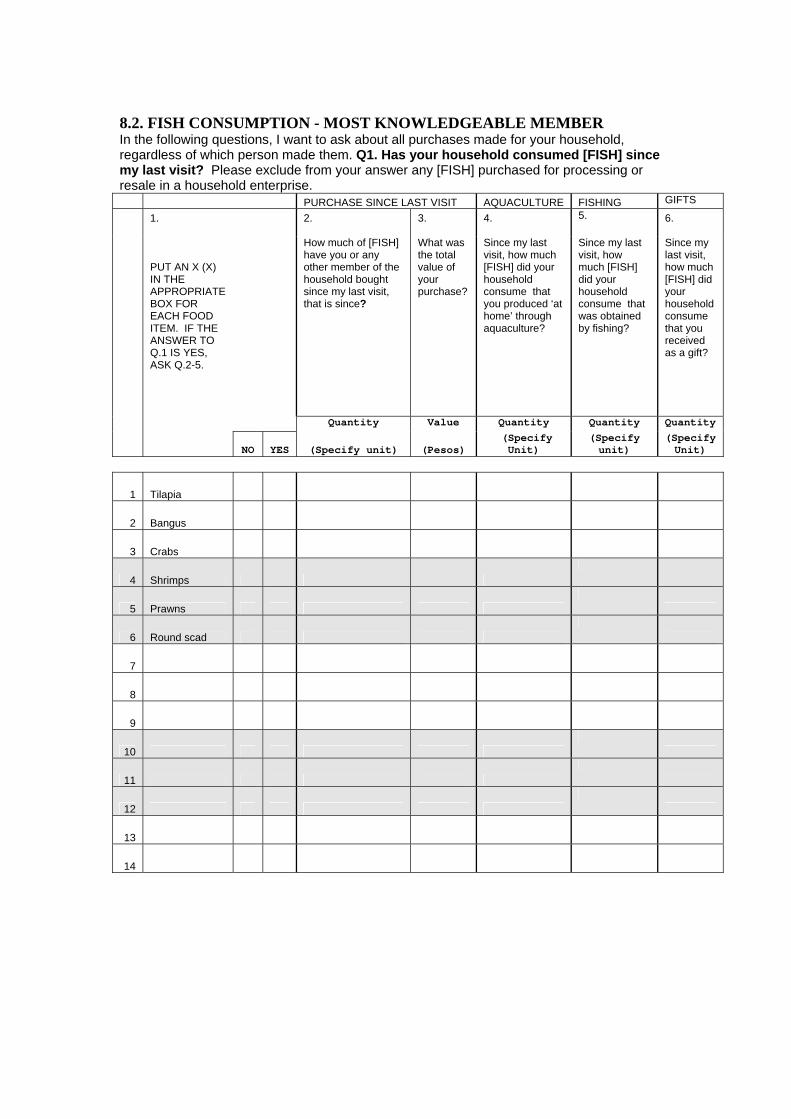
8.2. FISH CONSUMPTION - MOST KNOWLEDGEABLE MEMBER In the following questions, I want to ask about all purchases made for your household, regardless of which person made them. Q1. Has your household consumed [FISH] since my last visit? Please exclude from your answer any [FISH] purchased for processing or resale in a household enterprise. PURCHASE SINCE LAST VISIT AQUACULTURE FISHING GIFTS
1. 2. 3. 4. 5. 6.
PUT AN X (X) IN THE APPROPRIATE BOX FOR EACH FOOD ITEM. IF THE ANSWER TO Q.1 IS YES, ASK Q.2-5.
How much of [FISH] have you or any other member of the household bought since my last visit, that is since?
What was the total value of your purchase?
Since my last visit, how much [FISH] did your household consume that you produced ‘at home’ through aquaculture?
Since my last visit, how much [FISH] did your household consume that was obtained by fishing?
Since my last visit, how much [FISH] did your household consume that you received as a gift?
Quantity Value Quantity Quantity Quantity
NO YES (Specify unit) (Pesos) (Specify
Unit) (Specify unit)
(Specify Unit)
1 Tilapia
2 Bangus
3 Crabs
4 Shrimps
5 Prawns
6 Round scad
7
8
9
10
11
12
13
14

8.3. OTHER 1. Total consumption – Please refer back to the ladder diagram. The first step on the ladder represents the (unrealistic) situation where your household would not spend any of its cash-income on food (including fish). The highest step indicates a situation, unrealistic as well, where all cash income would be spent on food. Please characterize your current situation
At present_____
2. Over the last 12 months, in what month was it most difficult to provide adequate food for your household? Why?
8.4. CONSUMER DURABLES – MOST KNOWLEDGEABLE PERSON
1. 2. 3.
LIST OF ITEMS
Do you own [ITEM]
Yes..1
DESCRIPTION No…0
1
Stove 2
Refrigerator 3
Washing Machine 4
Sewing/knitting machine 5
Fan 6
Television 7
Radio 8
Tape player/CD player 9
Camera, video camera 10
Bicycle 11
Motorcycle/scooter 12
Tricycle 13
Car 14
Truck 15
Water pump/tube well 16
Fish pond equipment 17
Farm equipment 18
Non-motorized boat 19
Motorized boat 20
Phone/cell phone

Part 9. HOUSING MODULE – SHORT -- PART A. DESCRIPTION OF THE DWELLING Now I would like to ask you about your housing conditions. I mean by housing all the rooms and all separate buildings used by your household members. What buildings or rooms do the members of your household occupy? 1. WHAT IS THE MAJOR CONSTRUCTION MATERIAL OF THE EXTERNAL WALLS? BRICK .........................................................................1 CONCRETE BLOCKS ................................................2 WOOD, LOGS.............................................................3 TIN, ZINC, GI SHEETING...........................................4 BAMBOO ....................................................................5 SACS/PLASTIC ………………………………………….6 OTHER (SPECIFY____________________).............7 2. WHAT IS THE MAJOR MATERIAL OF THE ROOF? CONCRETE ................................................................1 METAL SHEETS.........................................................2 WOOD.........................................................................3 NIPA ...........................................................................4 OTHER (SPECIFY ___________________)............ 5 3. WHAT IS THE PRIMARY MATERIAL OF THE FLOOR?
WOOD.........................................................................1 TILE.............................................................................2 CONCRETE ................................................................3 CLAY/EARTHEN FLOOR ...........................................4 BAMBOO ....................................................................5 LINOLEUM..................................................................6 OTHERS(SPECIFY ___________________) ............7
4. How many rooms do the members of your household occupy, including bedrooms, living rooms and rooms used for household enterprises? DO NOT COUNT BATHROOMS, KITCHENS, BALCONIES AND CORRIDORS NUMBER OF ROOMS 5. What is the space of your dwelling including living and accessory rooms? SQUARE METERS 6.. In approximately what year was this dwelling built? ASK THE RESPONDENT TO PROVIDE AN ESTIMATE IF UNSURE OF THE EXACT YEAR YEAR BUILT 7. Do you own or rent this house? OWN ........................................................................... 1 RENT .......................................................................... 2 OTHER (SPECIFY)..................................................... 3 PART B. HOUSING SERVICES 1 What is the main source of water for drinking and cooking for your household? PRIVATE CONNECTION TO PIPELINE ............... 1 PRIVATE WELL..................................................... 2 PUBLIC TAPS/ STANDPIPE ................................. 3 PUBLIC WELL ....................................................... 4 NEIGHBORS ......................................................... 5 WATER VENDOR ................................................. 6 OTHER (SPECIFY _____________________) .... 7 2. How do you usually treat your drinking water? NO TREATMENT………………………………………………1 BOIL IT............................................................................... 2 FILTER IT (ONLY) ....................................................... .. . 3 OTHER (SPECIFY)…………………………………………….4 3. What is the main source of water for bathing and washing for your household?

PRIVATE CONNECTION TO PIPELINE ............... 1 PRIVATE WELL ..................................................... 2 PUBLIC TAPS/ STANDPIPE ................................. 3 PUBLIC WELL ....................................................... 4 NEIGHBORS.......................................................... 5 WATER VENDOR ................................................. 6 RIVER, SEA, POND…………………………………..7 OTHER (SPECIFY _____________________)…….8 4. What is the type of toilet that is used in your household? FLUSH TOILET ............................................................1 WATER SEALED…………………………………………..2 OUT HOUSE OVER PIT ...............................................3 OUT HOUSE CONNECTED TO SEWAGE ..................4 OTHER (SPECIFY ______________________)..........5 NO TOILET ...................................................................6 5. What is the main source of lighting in your dwelling ? ELECTRICITY.............................................................1 KEROSENE, OIL OR GAS LAMPS ............................2 CANDLES OR BATTERY FLASHLIGHTS..................3 OTHER (SPECIFY____________________).............4 6. What fuel do you use most often for cooking? GAS.............................................................................1 ELECTRICITY.............................................................2 WOOD.........................................................................3 CHARCOAL ................................................................4 KEROSENE ................................................................5 OTHER (SPECIFY _____________________)..........7

Part 10. HEALTH 1. During the last four weeks, how many days of primary activity did you miss due to poor health? ID Code Number of days 2. How far away is the closest surgery/hospital/health station? Km 3. Is medical care easily available to your family members? Yes……. ............................................................ 1 No....................................................................... 2 4. If not, why? Part 11. CREDIT
1. Can you borrow money if you need it? Yes…….. ........................................................... 1 No....................................................................... 2
2. If your answer is positive, from which sources? Source of credit Yes=1
No=0 Cooperative Agricultural Bank
Other Bank Money lender Savers’ group Viillage Fund Family Friends Other (specify)
3. How far is the closest bank? km