working paper 187 - the real exchange rate and external ... · the real exchange rate and external...
TRANSCRIPT

The Real Exchange Rate and External Competitiveness in Egypt, Morocco and Tunisia
Zuzana Brixiova, Balázs Égert, and Thouraya Hadj Amor Essid
No 187 – November 2013
Correct citation: Brixiova, Z.; Égert, B. and Hadj Amor Essid, T. (2013), The Real Exchange Rate and
External Competitiveness in Egypt, Morocco and Tunisia, Working Paper Series N° 187 African
Development Bank, Tunis, Tunisia.
Steve Kayizzi-Mugerwa (Chair) Anyanwu, John C. Faye, Issa Ngaruko, Floribert Shimeles, Abebe Salami, Adeleke Verdier-Chouchane, Audrey
Coordinator
Working Papers are available online at
http:/www.afdb.org/
Copyright © 2013
African Development Bank
Angle de l’avenue du Ghana et des rues
Pierre de Coubertin et Hédi Nouira
BP 323 -1002 TUNIS Belvédère (Tunisia)
Tel: +216 71 333 511
Fax: +216 71 351 933
E-mail: [email protected]
Salami, Adeleke
Editorial Committee Rights and Permissions
All rights reserved.
The text and data in this publication may be
reproduced as long as the source is cited.
Reproduction for commercial purposes is
forbidden.
The Working Paper Series (WPS) is produced
by the Development Research Department
of the African Development Bank. The WPS
disseminates the findings of work in progress,
preliminary research results, and development
experience and lessons, to encourage the
exchange of ideas and innovative thinking
among researchers, development
practitioners, policy makers, and donors. The
findings, interpretations, and conclusions
expressed in the Bank’s WPS are entirely
those of the author(s) and do not necessarily
represent the view of the African Development
Bank, its Board of Directors, or the countries
they represent.
The Real Exchange Rate and External Competitiveness in
Egypt, Morocco and Tunisia
Zuzana Brixiova, Balázs Égert, and Thouraya Hadj Amor Essid 1
1 Zuzana Brixiova (African Development Bank, Tunis, Tunisia), Balázs Égert (Organization for Economic Cooperation and
Development, Paris, France), and Thouraya Hadj Amor Essid (Monastir University, Monastir, Tunisia). This research started when Zuzana Brixiova and Thouraya Hadj Amor Essid were with the Research Department of the African Development Bank. The authors thank especially Mthuli Ncube, the Chief Economist and Vice President, for insightful comments and discussions. Thanks go also to Kaouther Abderrahim, Hassan Aly, Jan Babecky, Zorobabel Bicaba, Daniel Gurara, Basil Jones, Abdul Kamara, Peter Ondiege and an anonymous referee for comments. Earlier versions were presented at the 12th Mediterranean Research Meeting and at the 2012 ASSA Meetings. The views expressed are those of the authors and do not necessarily reflect views of the AfDB or OECD.
AFRICAN DEVELOPMENT BANK GROUP
Working Paper No. 187
November 2013
Office of the Chief Economist
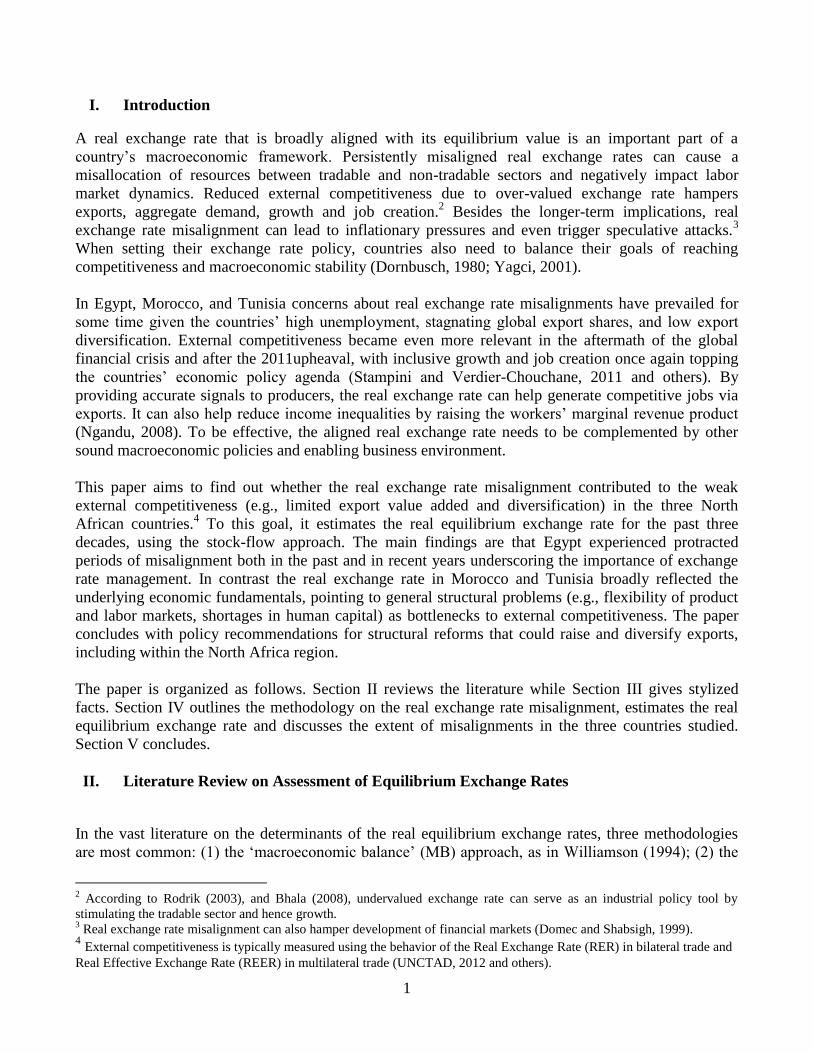
Abstract
Egypt, Morocco and Tunisia face challenges
competing on the global markets, as shown
by their relatively low and stagnant export
shares. The limited export competitiveness
has hampered external demand, growth and
employment. Applying, for the first time to
North Africa, the stock-flow approach to the
real equilibrium exchange rate, this paper
evaluates the countries’ real exchange rate
misalignments during the past three
decades. While Egypt experienced periods
of substantial misalignment, including in
recent years, the exchange rates in Morocco
and Tunisia have broadly reflected the
underlying fundamentals. In all three
countries structural factors are key to
boosting exports, alongside of avoiding
sizeable future misalignments. Intra-
regional trade – both with North Africa and
the rest of the continent – together with
greater orientation to fast growing emerging
markets could also raise countries’ external
competitiveness.
Keywords: real exchange rate misalignment, stock-flow model, competitiveness, trade,
Africa
JEL classification: F3, F41, F63, C5, O1
1
I. Introduction
A real exchange rate that is broadly aligned with its equilibrium value is an important part of a
country’s macroeconomic framework. Persistently misaligned real exchange rates can cause a
misallocation of resources between tradable and non-tradable sectors and negatively impact labor
market dynamics. Reduced external competitiveness due to over-valued exchange rate hampers
exports, aggregate demand, growth and job creation.2 Besides the longer-term implications, real
exchange rate misalignment can lead to inflationary pressures and even trigger speculative attacks.3
When setting their exchange rate policy, countries also need to balance their goals of reaching
competitiveness and macroeconomic stability (Dornbusch, 1980; Yagci, 2001).
In Egypt, Morocco, and Tunisia concerns about real exchange rate misalignments have prevailed for
some time given the countries’ high unemployment, stagnating global export shares, and low export
diversification. External competitiveness became even more relevant in the aftermath of the global
financial crisis and after the 2011upheaval, with inclusive growth and job creation once again topping
the countries’ economic policy agenda (Stampini and Verdier-Chouchane, 2011 and others). By
providing accurate signals to producers, the real exchange rate can help generate competitive jobs via
exports. It can also help reduce income inequalities by raising the workers’ marginal revenue product
(Ngandu, 2008). To be effective, the aligned real exchange rate needs to be complemented by other
sound macroeconomic policies and enabling business environment.
This paper aims to find out whether the real exchange rate misalignment contributed to the weak
external competitiveness (e.g., limited export value added and diversification) in the three North
African countries.4 To this goal, it estimates the real equilibrium exchange rate for the past three
decades, using the stock-flow approach. The main findings are that Egypt experienced protracted
periods of misalignment both in the past and in recent years underscoring the importance of exchange
rate management. In contrast the real exchange rate in Morocco and Tunisia broadly reflected the
underlying economic fundamentals, pointing to general structural problems (e.g., flexibility of product
and labor markets, shortages in human capital) as bottlenecks to external competitiveness. The paper
concludes with policy recommendations for structural reforms that could raise and diversify exports,
including within the North Africa region.
The paper is organized as follows. Section II reviews the literature while Section III gives stylized
facts. Section IV outlines the methodology on the real exchange rate misalignment, estimates the real
equilibrium exchange rate and discusses the extent of misalignments in the three countries studied.
Section V concludes.
II. Literature Review on Assessment of Equilibrium Exchange Rates
In the vast literature on the determinants of the real equilibrium exchange rates, three methodologies
are most common: (1) the ‘macroeconomic balance’ (MB) approach, as in Williamson (1994); (2) the
2 According to Rodrik (2003), and Bhala (2008), undervalued exchange rate can serve as an industrial policy tool by
stimulating the tradable sector and hence growth. 3 Real exchange rate misalignment can also hamper development of financial markets (Domec and Shabsigh, 1999).
4 External competitiveness is typically measured using the behavior of the Real Exchange Rate (RER) in bilateral trade and
Real Effective Exchange Rate (REER) in multilateral trade (UNCTAD, 2012 and others).
2
‘behavioral equilibrium exchange rate’ (BEER) approach (Edwards, 1994); and (3) the natural rate of
exchange (NATREX) approach, as in Stein (1995).5
The MB approach defines the equilibrium exchange rate as the real exchange rate that meets
simultaneously conditions of internal and external balances.6 It particularly focuses on medium-term
sustainability of the external current account and the impact of fundamental variables. In advanced and
emerging market economies, the targeted current account gaps are often dependent on the level of
potential output. The real equilibrium exchange rate is then estimated as a rate that would lead to the
required adjustment in the current account to the potential (trend) output.
The BEER approach estimates directly the structural (long-run) relationship between economic
fundamentals and the real equilibrium exchange rate and interprets it as the equilibrium relationship. It
searches for a statistically significant relationship between the variables (e.g., productivity differentials,
net foreign assets, terms of trade, etc.) and the real exchange rate without specifying the structure that
the relationship should take. In contrast to the MB approach, which imposes normative assumptions,
the BEER approach is less rigorous, but allows the analysis to be tailored to country-specific
circumstances (Al Shehabi and Ding, 2008).7
The NATREX approach is also based on concepts of internal and external balances. In contrast to MB
approach it also analyzes determinants of the long-run (steady state) real exchange rate equilibrium. In
its reduced form it resembles the BEER approach.
This paper utilizes the stock-flow approach to the real equilibrium exchange rate, and applies it, for the
first time, to North Africa. The approach was first used in Faruqee (1995), Aglietta et al. (1997) and
Alberola et al. (2002) for advanced economies and in Alberola, 2003; and Égert et al. (2006) for
transition economies. It has theoretical underpinning, where the real equilibrium exchange rate is
determined by the stock and flow of net foreign assets between countries. First, a country’s long-run
target for the stock of net foreign assets is set. The real equilibrium exchange rate then corresponds to a
current account balance consistent with the income flows from this stock. The approach also considers
productivity as a channel through which changes in the price-based real exchange rate can occur. This
is because higher productivity reflects non-price competitiveness and can cause appreciation of the real
exchange rate (Égert et al., 2004).8
In sum, the stock-flow approach differentiates between (i) the medium-term undervaluation caused by
the Balassa-Samuelson effect (productivity catch up) that is unlikely to cause abrupt adjustments and
(ii) misalignment caused by other factors than productivity differentials. The stock-flow approach is
particularly suitable to emerging market countries that often go through structural and productivity
changes that may impact the medium-term path of the real exchange rate. To our knowledge, this is the
first time the method is applied to the North African countries.
5 Bussiẻre et al. (2010) review recent methodological advances in estimating the real equilibrium exchange rate.
6 This approach is referred to as the fundamental equilibrium exchange rate (FEER). Internal balance means that the
economy operates at the full-capacity output, while the external balance refers to the current account sustainability. 7 Edwards (1994) defined the REER as the relative price of non-tradables to tradables that results in the attainment of
internal and external equilibrium. Internal equilibrium is defined as the clearing of all non-tradable markets. External
equilibrium is attained when the net present value of future current account balances is nonnegative, given the level of
exogenous long-run capital inflows. These two equilibrium conditions identify a unique REER. 8 The theoretical underpinnings of the stock-flow approach are discussed further below and in Annex I.
3
III. External Competitiveness in Egypt, Morocco and Tunisia: The Facts
1. Exchange Regimes
The choice of an exchange rate regime is key for countries’ macroeconomic frameworks. It impacts the
monetary regime a country can adopt and the extent to which the exchange rate helps absorb shocks.
Both fixed and flexible regimes have their pros and cons, with trade-offs ranging from reduced
transaction cost in the case of fixed regimes to ability to adjust to shocks in the case of flexible ones. In
developing countries, fixed exchange rate regimes often generate a greater risk of real exchange rate
misalignment than flexible regimes, as their real exchange rates tend to appreciate due to inflationary
pressures (Coudert and Couharde, 2005).
In our three North African countries studied, the exchange rate regimes have evolved over time from
fixed to more flexible, as the ability to adjust to shocks gained in priority:
Egypt’s exchange rate was characterized by a substantial rigidity – de facto crawling band
around US$ during 1980 – 1990 and peg to the dollar – during 1991 – 2003 (Elbadawi and
Kamar, 2006). In 2003, the floating regime was announced (Selim, 2012). However, Egypt’s
nominal exchange rate experienced only limited changes/gradual depreciation during 2003 –
2012, pointing to a de facto crawling peg regime. In 2012, IMF reclassified Egypt as having a
stabilized exchange rate arrangement (IMF, 2012a).9
Morocco has also maintained de facto fixed exchange rate regime throughout the years, with the
dirham being pegged to the French franc until 1996 (but devalued in 1986), to a basket of
currencies until 1999; and the basket of currencies included €, £ and $ since 1999. During the
1990s, Morocco was targeting real exchange rate. In 2012, the IMF classified Morocco as
having a conventional fixed exchange rate regime (IMF, 2012a).
Tunisia pegged its currency to a basket of currencies until 1994, and has a crawling peg since
then according to the IMF, even though the country classifies its regime as a managed float.
Between 1992 and 2000, Tunisia targeted the real exchange rate, but introduced more flexibility
afterwards (Dropsy and Grand, 2004). In 2012, the Tunisian exchange rate regime was
classified as crawling peg by the IMF (IMF, 2012a).
Inflation played a key difference in the evolutions of real exchange rates – Morocco and Tunisia
avoided major inflationary pressures, but Egypt did not (Elbadawi and Kamar, 2006).
2. External Price Competitiveness
While a variety of alternative indicators of external price competitiveness exists, the most common one
is the real effective exchange rate (RER), which measures the change in the relative price levels
(domestic and foreign prices expressed in the same currency unit). Implications of movements in the
RER for external price competitiveness need to be interpreted with caution though. In some countries
an appreciation of the RER indeed reflects a deterioration of competitiveness, but in others it may
9 At the end of 2012, the Central Bank of Egypt introduced to a more flexible exchange system via daily foreign exchange
auctions and tighter restrictions on foreign currency outflows (Abed and Idarian, 2013).
4
reflect changes in economic fundamentals, such as productivity gains that countries often experience
during the catch up phase with more advanced economies resulting from the Balassa-Samuelson effect
or a shift towards higher value added (higher quality) production. To gain meaningful insights into
competitiveness trends, the RER indices need to be accompanied by other indicators and analysis.
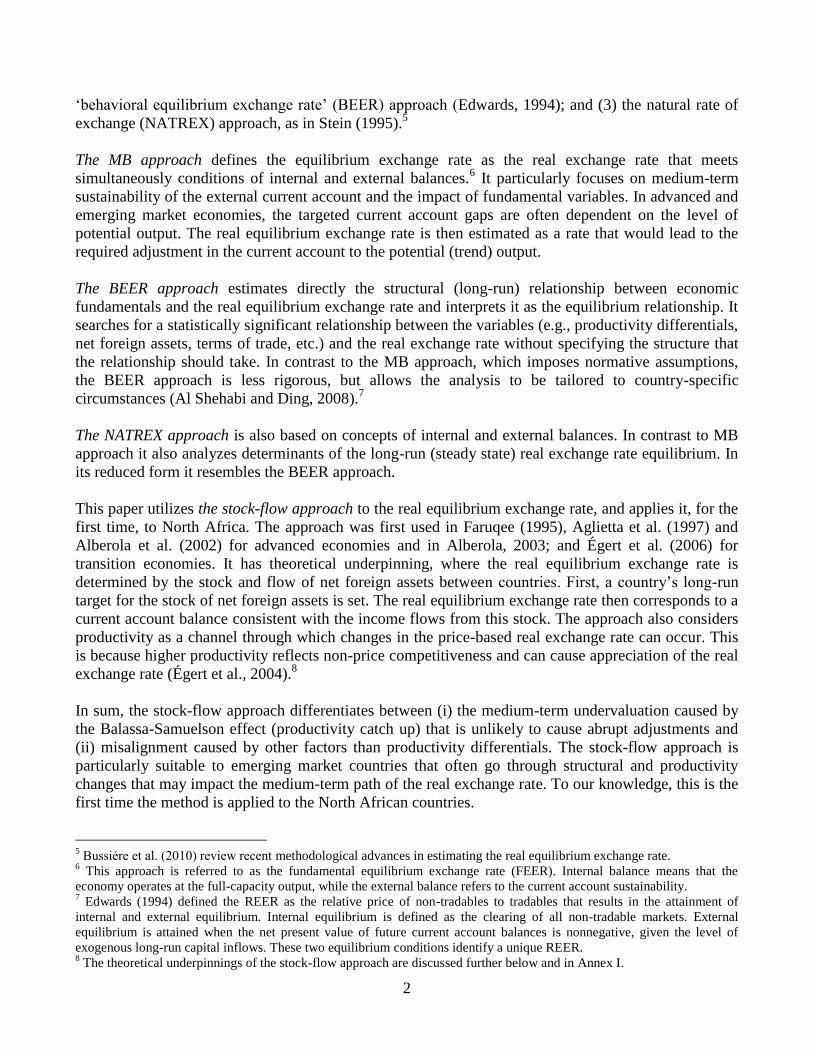
Figure 1 shows (CPI-based) RER developments in the three countries. Having experienced several
sizeable appreciation episodes of its bilateral RER since the early 1980s, Egypt is an interesting case to
examine whether the appreciation led to an overvaluation of the real exchange rate and a deterioration
of external price competitiveness. In contrast, Tunisian RER depreciated steadily for most of the period
studied, with the exception of the 1990s, when a constant real exchange rate rule was applied (Fanizza
et al, 2002). In Morocco, the RER exhibited mixed patters – appreciation in the 1990s followed by
depreciation during 2000s due to lower inflation than in trading partners (Sab, Sensenbrenner and
Diouf, 2008). Over the longer term, both Morocco and Tunisia have experienced RER depreciation,
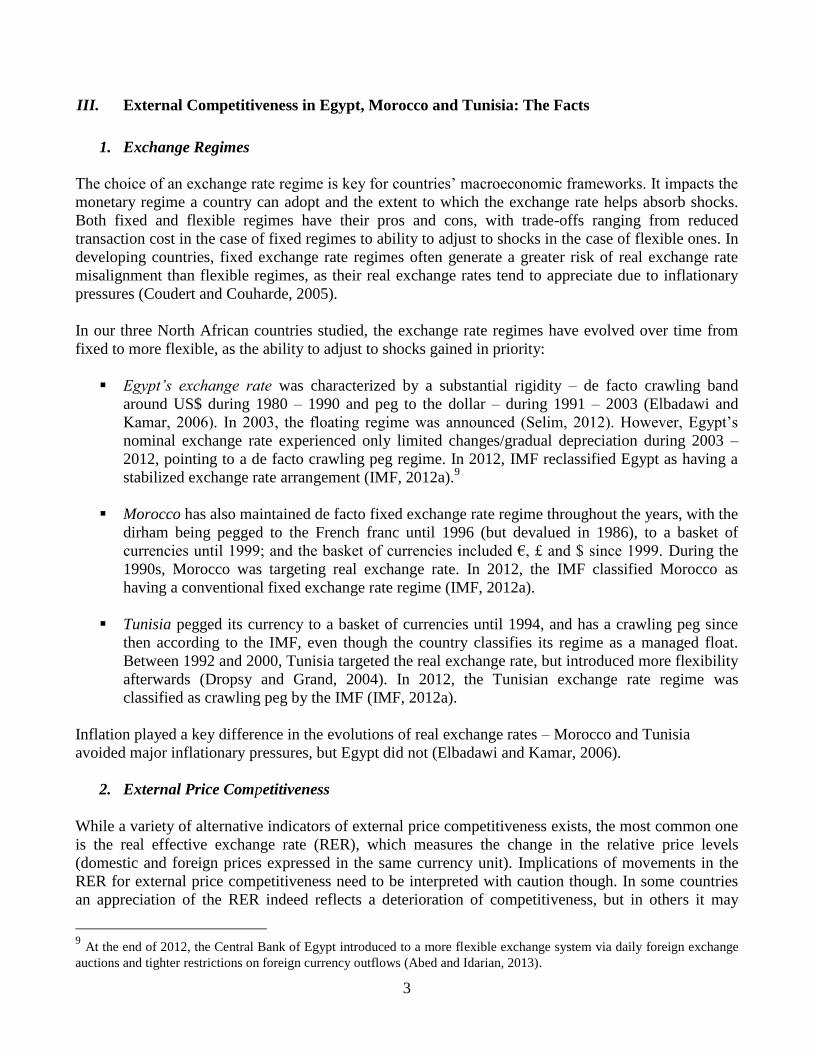
reflecting declines in their real GDP per capita relative to trading partners. Relatedly, labor productivity
was also lagging behind other emerging and frontier markets in Middle East and North Africa (MENA)
and Asia (Figure 2).
Figure 1. Real exchange rate and productivity (Indices, 1980 – 2011; 2005 = 100) 1/
Figure 1a. Morocco Figure 1b. Tunisia
Figure 1c. Egypt
Source: Authors’ calculations based on the IMF IFS and IIF statistics. 1/ Increase (decrease) means appreciation
(depreciation). Productivity is measured in terms of difference from the EU.
60
80
100
120
140
160
180
200
198
01
98
21
98
41
98
61
98
81
99
01
99
21
99
41
99
61
99
82
00
02
00
22
00
42
00
62
00
82
01
0
Productivity - MOR
REER - MOR
60
80
100
120
140
160
180
200
19
80
19
83
19
86
19
89
19
92
19
95
19
98
20
01
20
04
20
07
20
10
Productivity - TUN
REER - TUN
60
80
100
120
140
160
180
200
19
80
19
82
19
84
19
86
19
88
19
90
19
92
19
94
19
96
19
98
20
00
20
02
20
04
20
06
20
08
20
10
Productivity - EGY
REER - EGY
5
Figure 2. Labor productivity in selected economies, 1991 – 2010 (Indices; 1991=100)
Source: Authors’ calculations based on the IMF and ILO databases.
3. Export Performance
Growth, Market Share and Composition
On a more positive note, Egypt’s, Morocco’s and Tunisia’s volumes of exports grew by 186%, 182%
and 165%, respectively, during 2000 and 2011 – close or slightly above the global average of 169%.
However, these figures are less favorable when compared to other emerging market countries exporting
heavily to the EU: Turkey’s exports grew by 237% while those of Poland and Romania by 228% and
266%, respectively, during the same period.10
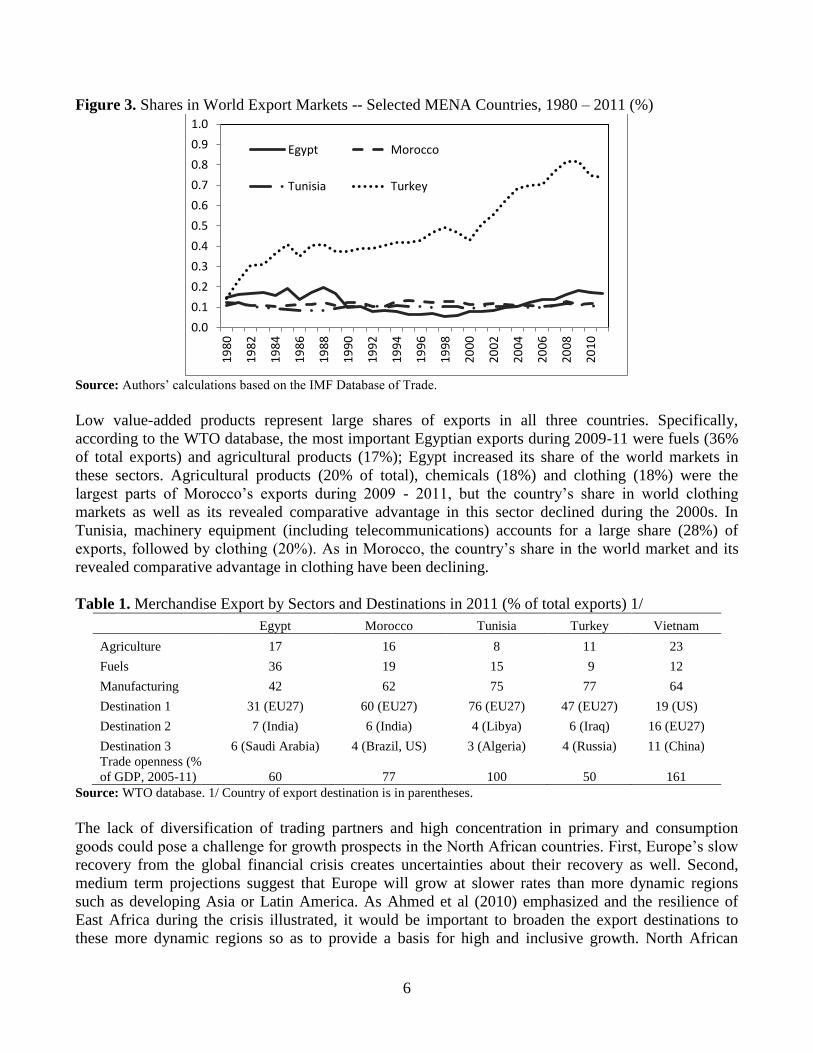
As shown by their low and stagnating shares in global exports, Egypt, Morocco and Tunisia have been
facing external competitiveness challenges (Figure 3). Low and constant (or marginally rising, as was
the case of Egypt) export shares help explain why the aggregate demand growth in these countries has
remained subdued and not generated enough ‘decent’ jobs in export sectors.
Diversification of Exports
The three North African economies are less diversified than some other emerging market economies at
comparable levels of development (e.g., Turkey). In particular, Europe has accounted for a
disproportionate share as an export destination in all three countries, reflecting geographical closeness
and long-established business ties (Table 1). Exports were also overly concentrated in primary products
(fuel and agriculture). More broadly, consumption goods and primary products accounted for most of
exports in the MENA region, while capital goods have a share of only about 7 percent in total exports
(Ahmed et al., 2010).
10
Calculations are based on the October 2012 IMF WEO database. The MENA region’s subdued GDP growth goes hand in
hand with its trade performance. Specifically, exports per capita of Morocco, Tunisia, and Egypt grew at slower rate than
the average of emerging market economies since 1990 (Rasmussen, 2010).
80
100
120
140
160
180
200
220
240
260
280
199
1
199
2
199
3
199
4
199
5
199
6
199
7
199
8
199
9
200
0
200
1
200
2
200
3
200
4
200
5
200
6
200
7
200
8
200
9
201
0
Egypt Morocco Tunisia
Turkey Vietnam
6
Figure 3. Shares in World Export Markets -- Selected MENA Countries, 1980 – 2011 (%)
Source: Authors’ calculations based on the IMF Database of Trade.
Low value-added products represent large shares of exports in all three countries. Specifically,
according to the WTO database, the most important Egyptian exports during 2009-11 were fuels (36%
of total exports) and agricultural products (17%); Egypt increased its share of the world markets in
these sectors. Agricultural products (20% of total), chemicals (18%) and clothing (18%) were the
largest parts of Morocco’s exports during 2009 - 2011, but the country’s share in world clothing
markets as well as its revealed comparative advantage in this sector declined during the 2000s. In
Tunisia, machinery equipment (including telecommunications) accounts for a large share (28%) of
exports, followed by clothing (20%). As in Morocco, the country’s share in the world market and its
revealed comparative advantage in clothing have been declining.
Table 1. Merchandise Export by Sectors and Destinations in 2011 (% of total exports) 1/
Egypt Morocco Tunisia Turkey Vietnam
Agriculture 17 16 8 11 23
Fuels 36 19 15 9 12
Manufacturing 42 62 75 77 64
Destination 1 31 (EU27) 60 (EU27) 76 (EU27) 47 (EU27) 19 (US)
Destination 2 7 (India) 6 (India) 4 (Libya) 6 (Iraq) 16 (EU27)
Destination 3 6 (Saudi Arabia) 4 (Brazil, US) 3 (Algeria) 4 (Russia) 11 (China)
Trade openness (%
of GDP, 2005-11) 60 77 100 50 161
Source: WTO database. 1/ Country of export destination is in parentheses.
The lack of diversification of trading partners and high concentration in primary and consumption
goods could pose a challenge for growth prospects in the North African countries. First, Europe’s slow
recovery from the global financial crisis creates uncertainties about their recovery as well. Second,
medium term projections suggest that Europe will grow at slower rates than more dynamic regions
such as developing Asia or Latin America. As Ahmed et al (2010) emphasized and the resilience of
East Africa during the crisis illustrated, it would be important to broaden the export destinations to
these more dynamic regions so as to provide a basis for high and inclusive growth. North African
0.0
0.1
0.2
0.3
0.4
0.5
0.6
0.7
0.8
0.9
1.0
19
80
19
82
19
84
19
86
19
88
19
90
19
92
19
94
19
96
19
98
20
00
20
02
20
04
20
06
20
08
20
10
Egypt Morocco
Tunisia Turkey
7
countries could benefit from deeper integration with Sub-Saharan Africa, which continues to be among
the world’s fastest growing regions.
Intra-regional Trade
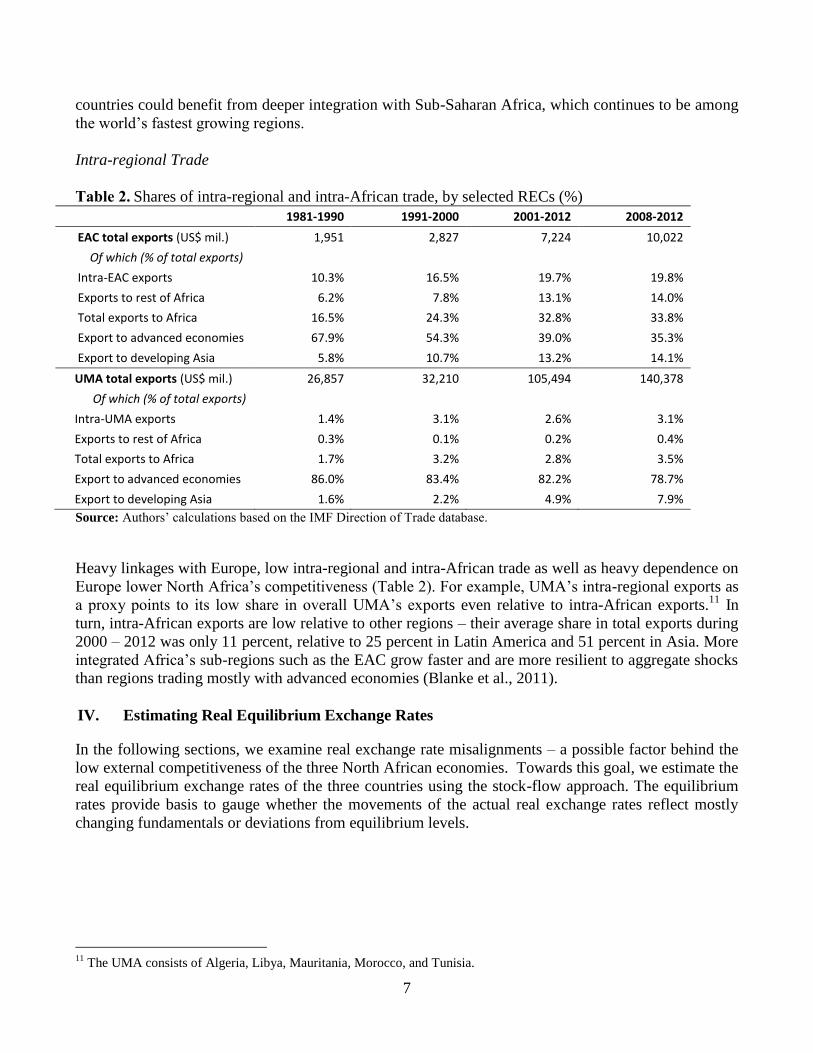
Table 2. Shares of intra-regional and intra-African trade, by selected RECs (%)
1981-1990 1991-2000 2001-2012 2008-2012
EAC total exports (US$ mil.) 1,951 2,827 7,224 10,022
Of which (% of total exports)
Intra-EAC exports 10.3% 16.5% 19.7% 19.8%
Exports to rest of Africa 6.2% 7.8% 13.1% 14.0%
Total exports to Africa 16.5% 24.3% 32.8% 33.8%
Export to advanced economies 67.9% 54.3% 39.0% 35.3%
Export to developing Asia 5.8% 10.7% 13.2% 14.1%
UMA total exports (US$ mil.) 26,857 32,210 105,494 140,378
Of which (% of total exports)
Intra-UMA exports 1.4% 3.1% 2.6% 3.1%
Exports to rest of Africa 0.3% 0.1% 0.2% 0.4%
Total exports to Africa 1.7% 3.2% 2.8% 3.5%
Export to advanced economies 86.0% 83.4% 82.2% 78.7%
Export to developing Asia 1.6% 2.2% 4.9% 7.9%
Source: Authors’ calculations based on the IMF Direction of Trade database.
Heavy linkages with Europe, low intra-regional and intra-African trade as well as heavy dependence on
Europe lower North Africa’s competitiveness (Table 2). For example, UMA’s intra-regional exports as
a proxy points to its low share in overall UMA’s exports even relative to intra-African exports.11
In
turn, intra-African exports are low relative to other regions – their average share in total exports during
2000 – 2012 was only 11 percent, relative to 25 percent in Latin America and 51 percent in Asia. More
integrated Africa’s sub-regions such as the EAC grow faster and are more resilient to aggregate shocks
than regions trading mostly with advanced economies (Blanke et al., 2011).
IV. Estimating Real Equilibrium Exchange Rates
In the following sections, we examine real exchange rate misalignments – a possible factor behind the
low external competitiveness of the three North African economies. Towards this goal, we estimate the
real equilibrium exchange rates of the three countries using the stock-flow approach. The equilibrium
rates provide basis to gauge whether the movements of the actual real exchange rates reflect mostly
changing fundamentals or deviations from equilibrium levels.
11
The UMA consists of Algeria, Libya, Mauritania, Morocco, and Tunisia.
8
1. Modeling Framework
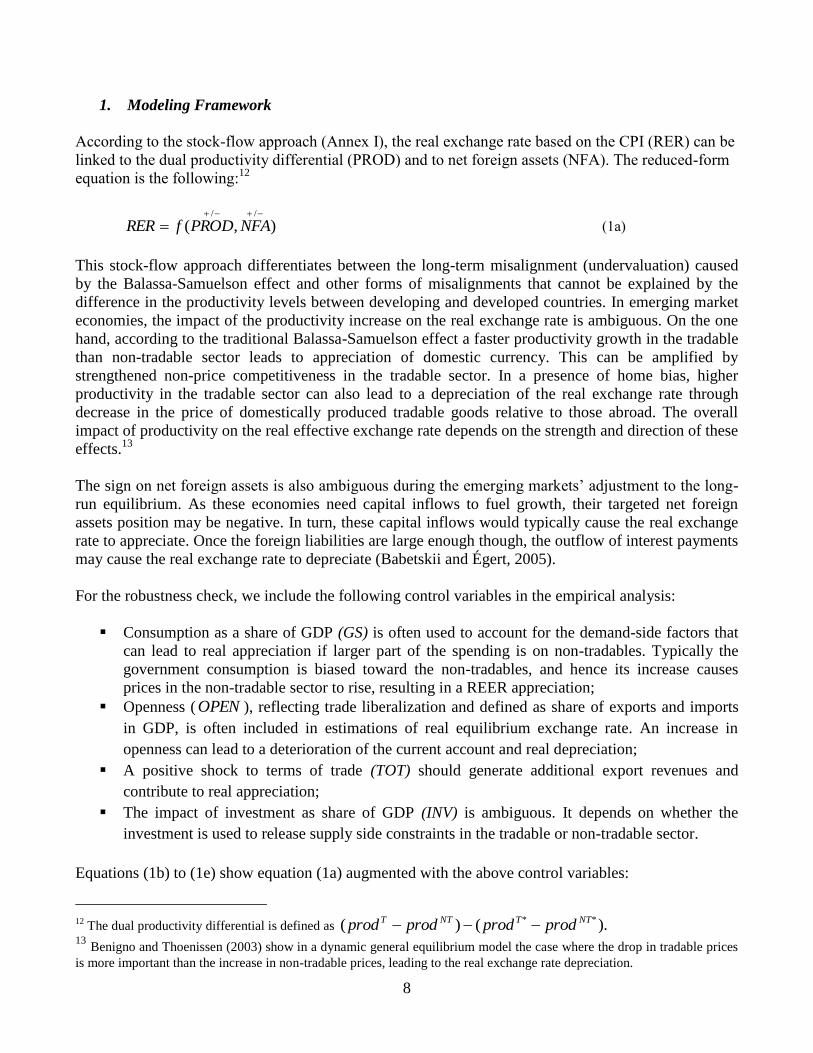
According to the stock-flow approach (Annex I), the real exchange rate based on the CPI (RER) can be
linked to the dual productivity differential (PROD) and to net foreign assets (NFA). The reduced-form
equation is the following:12
),(//
NFAPRODfRER (1a)
This stock-flow approach differentiates between the long-term misalignment (undervaluation) caused
by the Balassa-Samuelson effect and other forms of misalignments that cannot be explained by the
difference in the productivity levels between developing and developed countries. In emerging market
economies, the impact of the productivity increase on the real exchange rate is ambiguous. On the one
hand, according to the traditional Balassa-Samuelson effect a faster productivity growth in the tradable
than non-tradable sector leads to appreciation of domestic currency. This can be amplified by
strengthened non-price competitiveness in the tradable sector. In a presence of home bias, higher
productivity in the tradable sector can also lead to a depreciation of the real exchange rate through
decrease in the price of domestically produced tradable goods relative to those abroad. The overall
impact of productivity on the real effective exchange rate depends on the strength and direction of these
effects.13
The sign on net foreign assets is also ambiguous during the emerging markets’ adjustment to the long-
run equilibrium. As these economies need capital inflows to fuel growth, their targeted net foreign
assets position may be negative. In turn, these capital inflows would typically cause the real exchange
rate to appreciate. Once the foreign liabilities are large enough though, the outflow of interest payments
may cause the real exchange rate to depreciate (Babetskii and Égert, 2005).
For the robustness check, we include the following control variables in the empirical analysis:
Consumption as a share of GDP (GS) is often used to account for the demand-side factors that
can lead to real appreciation if larger part of the spending is on non-tradables. Typically the
government consumption is biased toward the non-tradables, and hence its increase causes
prices in the non-tradable sector to rise, resulting in a REER appreciation;
Openness ( OPEN ), reflecting trade liberalization and defined as share of exports and imports
in GDP, is often included in estimations of real equilibrium exchange rate. An increase in
openness can lead to a deterioration of the current account and real depreciation;
A positive shock to terms of trade (TOT) should generate additional export revenues and
contribute to real appreciation;
The impact of investment as share of GDP (INV) is ambiguous. It depends on whether the
investment is used to release supply side constraints in the tradable or non-tradable sector.
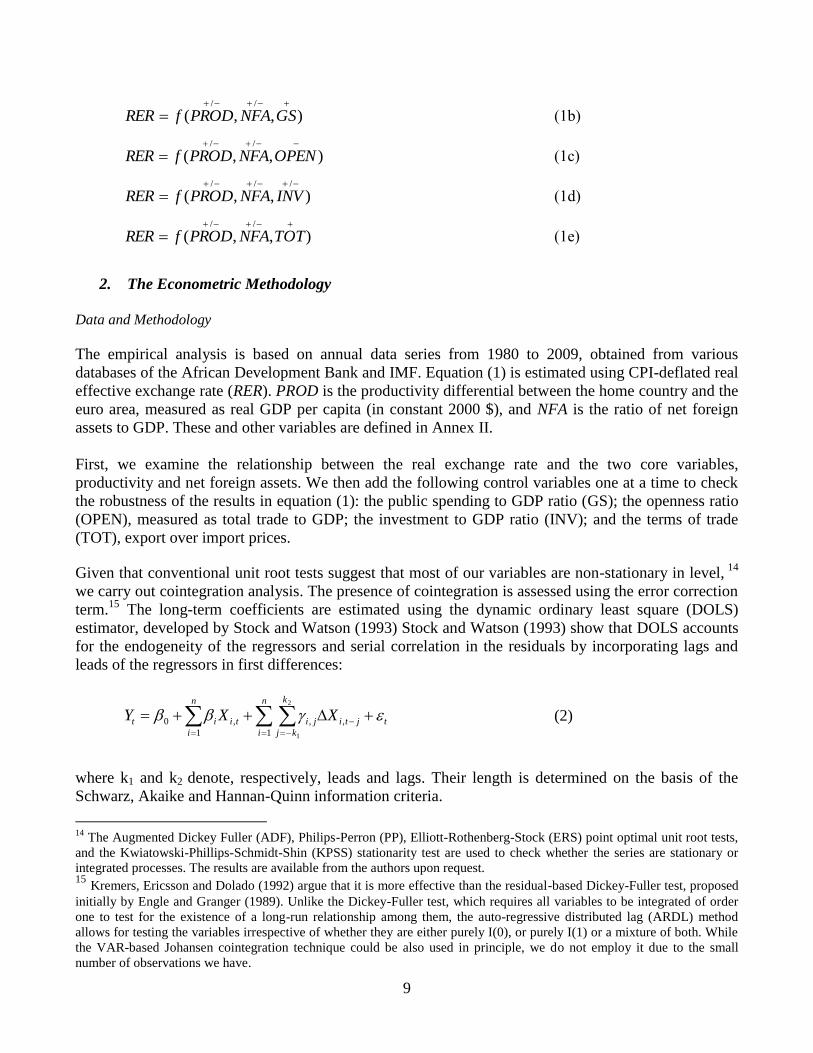
Equations (1b) to (1e) show equation (1a) augmented with the above control variables:
12
The dual productivity differential is defined as ).()( ** NTTNTT prodprodprodprod 13
Benigno and Thoenissen (2003) show in a dynamic general equilibrium model the case where the drop in tradable prices
is more important than the increase in non-tradable prices, leading to the real exchange rate depreciation.
9
),,(//
GSNFAPRODfRER (1b)
),,(//
OPENNFAPRODfRER (1c)
),,(///
INVNFAPRODfRER (1d)
),,(//
TOTNFAPRODfRER (1e)
2. The Econometric Methodology
Data and Methodology
The empirical analysis is based on annual data series from 1980 to 2009, obtained from various
databases of the African Development Bank and IMF. Equation (1) is estimated using CPI-deflated real
effective exchange rate (RER). PROD is the productivity differential between the home country and the
euro area, measured as real GDP per capita (in constant 2000 $), and NFA is the ratio of net foreign
assets to GDP. These and other variables are defined in Annex II.
First, we examine the relationship between the real exchange rate and the two core variables,
productivity and net foreign assets. We then add the following control variables one at a time to check
the robustness of the results in equation (1): the public spending to GDP ratio (GS); the openness ratio
(OPEN), measured as total trade to GDP; the investment to GDP ratio (INV); and the terms of trade
(TOT), export over import prices.
Given that conventional unit root tests suggest that most of our variables are non-stationary in level, 14
we carry out cointegration analysis. The presence of cointegration is assessed using the error correction
term.15
The long-term coefficients are estimated using the dynamic ordinary least square (DOLS)
estimator, developed by Stock and Watson (1993) Stock and Watson (1993) show that DOLS accounts
for the endogeneity of the regressors and serial correlation in the residuals by incorporating lags and
leads of the regressors in first differences:
tjti
n
i
k
kj
jiti
n
i
it XXY
,
1
,,
1
0
2
1
(2)
where k1 and k2 denote, respectively, leads and lags. Their length is determined on the basis of the
Schwarz, Akaike and Hannan-Quinn information criteria.
14
The Augmented Dickey Fuller (ADF), Philips-Perron (PP), Elliott-Rothenberg-Stock (ERS) point optimal unit root tests,
and the Kwiatowski-Phillips-Schmidt-Shin (KPSS) stationarity test are used to check whether the series are stationary or
integrated processes. The results are available from the authors upon request. 15
Kremers, Ericsson and Dolado (1992) argue that it is more effective than the residual-based Dickey-Fuller test, proposed
initially by Engle and Granger (1989). Unlike the Dickey-Fuller test, which requires all variables to be integrated of order
one to test for the existence of a long-run relationship among them, the auto-regressive distributed lag (ARDL) method
allows for testing the variables irrespective of whether they are either purely I(0), or purely I(1) or a mixture of both. While
the VAR-based Johansen cointegration technique could be also used in principle, we do not employ it due to the small
number of observations we have.
10
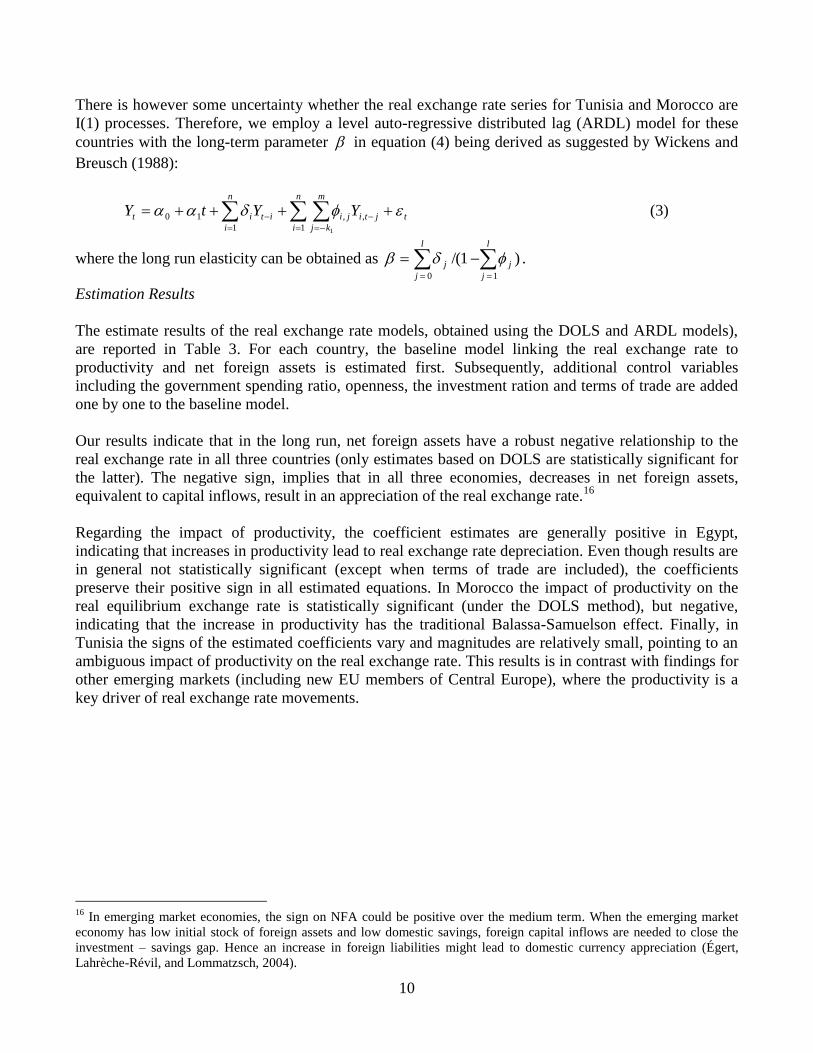
There is however some uncertainty whether the real exchange rate series for Tunisia and Morocco are
I(1) processes. Therefore, we employ a level auto-regressive distributed lag (ARDL) model for these
countries with the long-term parameter in equation (4) being derived as suggested by Wickens and
Breusch (1988):
tjti
n
i
m
kj
jiit
n
i
it YYtY
,
1
,
1
10
1
(3)
where the long run elasticity can be obtained as )1/(10
l
j
j
l
j
j .
Estimation Results
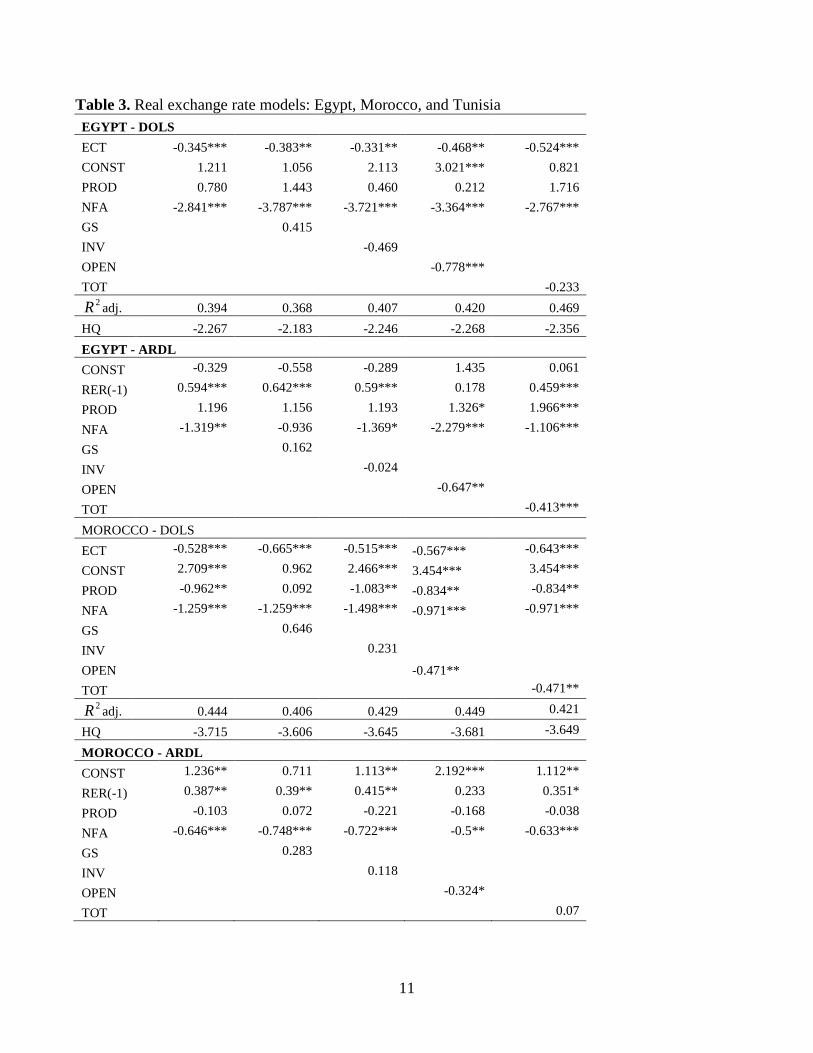
The estimate results of the real exchange rate models, obtained using the DOLS and ARDL models),
are reported in Table 3. For each country, the baseline model linking the real exchange rate to
productivity and net foreign assets is estimated first. Subsequently, additional control variables
including the government spending ratio, openness, the investment ration and terms of trade are added
one by one to the baseline model.
Our results indicate that in the long run, net foreign assets have a robust negative relationship to the
real exchange rate in all three countries (only estimates based on DOLS are statistically significant for
the latter). The negative sign, implies that in all three economies, decreases in net foreign assets,
equivalent to capital inflows, result in an appreciation of the real exchange rate.16
Regarding the impact of productivity, the coefficient estimates are generally positive in Egypt,
indicating that increases in productivity lead to real exchange rate depreciation. Even though results are
in general not statistically significant (except when terms of trade are included), the coefficients
preserve their positive sign in all estimated equations. In Morocco the impact of productivity on the
real equilibrium exchange rate is statistically significant (under the DOLS method), but negative,
indicating that the increase in productivity has the traditional Balassa-Samuelson effect. Finally, in
Tunisia the signs of the estimated coefficients vary and magnitudes are relatively small, pointing to an
ambiguous impact of productivity on the real exchange rate. This results is in contrast with findings for
other emerging markets (including new EU members of Central Europe), where the productivity is a
key driver of real exchange rate movements.
16
In emerging market economies, the sign on NFA could be positive over the medium term. When the emerging market
economy has low initial stock of foreign assets and low domestic savings, foreign capital inflows are needed to close the
investment – savings gap. Hence an increase in foreign liabilities might lead to domestic currency appreciation (Égert,
Lahrèche-Révil, and Lommatzsch, 2004).
11
Table 3. Real exchange rate models: Egypt, Morocco, and Tunisia
EGYPT - DOLS
ECT -0.345*** -0.383** -0.331** -0.468** -0.524***
CONST 1.211 1.056 2.113 3.021*** 0.821
PROD 0.780 1.443 0.460 0.212 1.716
NFA -2.841*** -3.787*** -3.721*** -3.364*** -2.767***
GS
0.415
INV
-0.469
OPEN
-0.778***
TOT -0.233 2R adj. 0.394 0.368 0.407 0.420 0.469
HQ -2.267 -2.183 -2.246 -2.268 -2.356
EGYPT - ARDL
CONST -0.329 -0.558 -0.289 1.435 0.061
RER(-1) 0.594*** 0.642*** 0.59*** 0.178 0.459***
PROD 1.196 1.156 1.193 1.326* 1.966***
NFA -1.319** -0.936 -1.369* -2.279*** -1.106***
GS
0.162
INV
-0.024
OPEN
-0.647**
TOT -0.413***
MOROCCO - DOLS
ECT -0.528*** -0.665*** -0.515*** -0.567*** -0.643***
CONST 2.709*** 0.962 2.466*** 3.454*** 3.454***
PROD -0.962** 0.092 -1.083** -0.834** -0.834**
NFA -1.259*** -1.259*** -1.498*** -0.971*** -0.971***
GS
0.646
INV
0.231
OPEN
-0.471**
TOT -0.471**
2R adj. 0.444 0.406 0.429 0.449 0.421
HQ -3.715 -3.606 -3.645 -3.681 -3.649
MOROCCO - ARDL
CONST 1.236** 0.711 1.113** 2.192*** 1.112**
RER(-1) 0.387** 0.39** 0.415** 0.233 0.351*
PROD -0.103 0.072 -0.221 -0.168 -0.038
NFA -0.646*** -0.748*** -0.722*** -0.5** -0.633***
GS
0.283
INV
0.118
OPEN
-0.324*
TOT 0.07

12
TUNISIA - DOLS
ECT -0.456*** -0.289 -0.614*** -0.464*** -0.434**
CONST 2.033*** -0.65 0.548 2.244*** 2.244***
PROD -0.05 0.562 -0.034 0.079 0.079
NFA -0.35** -0.726*** -0.646*** -0.372** -0.372**
GS
1.639**
INV
1.002***
OPEN
-0.178
TOT -0.178
2R adj. 0.214 0.048 0.313 0.321 0.273
HQ -3.636 -3.401 -3.728 -3.739 -3.670
TUNISIA - ARDL
CONST 1.021** 0.995 0.707 1.381*** 1.269**
RER(-1) 0.532*** 0.531*** 0.522*** 0.474*** 0.514***
PROD -0.086 -0.077 -0.139 0.099 0.016
NFA -0.147 -0.148 -0.299* -0.219 -0.214
GS
0.016
INV
0.255
OPEN
-0.231
TOT -0.166
Source: Authors’ estimations. Note: Results are robust to other specifications (available upon request).
The estimated coefficient for openness shows that a greater openness would lead to a depreciation of
the real exchange rate in all three countries. The relationship is statistically significant only for Egypt
and Morocco, but has the negative sign also for Tunisia. It is also consistent with the actual
developments in Morocco and Tunisia since mid-2000s. Another useful finding is that terms of trade
impact the real exchange rate. Specifically, improvements in terms of trade would lead to real exchange
rate appreciation in Egypt and Morocco, most likely via inflation differentials.
3. Real Exchange Rate Misalignment
The misalignment between the actual real exchange rate (RER) and the long run real equilibrium
exchange rate (REER) can be calculated from the following formula:
Misalignment = (RER – REER) (4)
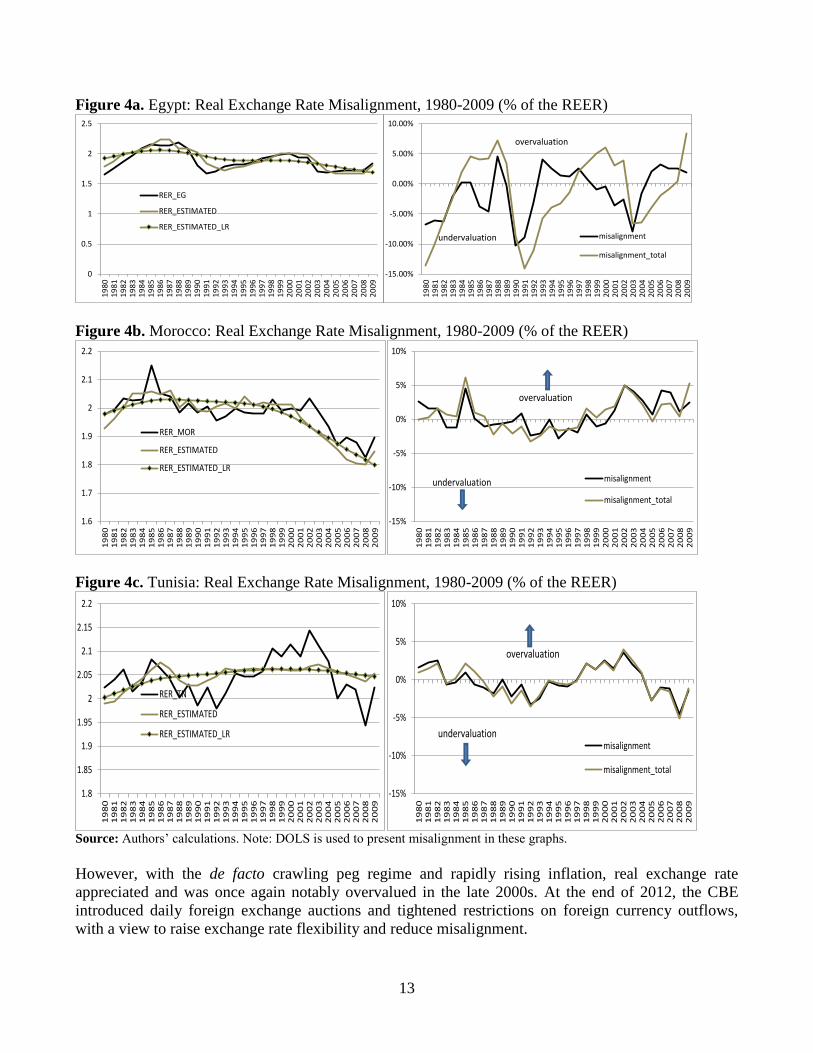
The results are illustrated in Figures 4a – 4c. It is interesting to note that the RER of Egypt was
overvalued from the mid-1990s until mid-2000s, following the increasing inflation rate and current
account deficits. To mitigate the appreciation pressures and decline in reserves, extensive foreign
exchange controls were put in place at the end of 1990s. This has led to low growth, a decline in central
bank reserves, and import compression. In 2006 and 2007, the real exchange rate was again relatively
closely to its equilibrium value, consistently with Almekinders (2007).17
17
The resulting strengthening of the balance of payments allowed a gradual abolition of the exchange controls and a strong
recovery of import growth.
13
Figure 4a. Egypt: Real Exchange Rate Misalignment, 1980-2009 (% of the REER)
Figure 4b. Morocco: Real Exchange Rate Misalignment, 1980-2009 (% of the REER)
Figure 4c. Tunisia: Real Exchange Rate Misalignment, 1980-2009 (% of the REER)
Source: Authors’ calculations. Note: DOLS is used to present misalignment in these graphs.
However, with the de facto crawling peg regime and rapidly rising inflation, real exchange rate
appreciated and was once again notably overvalued in the late 2000s. At the end of 2012, the CBE
introduced daily foreign exchange auctions and tightened restrictions on foreign currency outflows,
with a view to raise exchange rate flexibility and reduce misalignment.
0
0.5
1
1.5
2
2.5
19
80
19
81
19
82
19
83
19
84
19
85
19
86
19
87
19
88
19
89
19
90
19
91
19
92
19
93
19
94
19
95
19
96
19
97
19
98
19
99
20
00
20
01
20
02
20
03
20
04
20
05
20
06
20
07
20
08
20
09
RER_EG
RER_ESTIMATED
RER_ESTIMATED_LR
-15.00%
-10.00%
-5.00%
0.00%
5.00%
10.00%
19
80
19
81
19
82
19
83
19
84
19
85
19
86
19
87
19
88
19
89
19
90
19
91
19
92
19
93
19
94
19
95
19
96
19
97
19
98
19
99
20
00
20
01
20
02
20
03
20
04
20
05
20
06
20
07
20
08
20
09
misalignment
misalignment_total
overvaluation
undervaluation
1.6
1.7
1.8
1.9
2
2.1
2.2
19
80
19
81
19
82
19
83
19
84
19
85
19
86
19
87
19
88
19
89
19
90
19
91
19
92
19
93
19
94
19
95
19
96
19
97
19
98
19
99
20
00
20
01
20
02
20
03
20
04
20
05
20
06
20
07
20
08
20
09
RER_MOR
RER_ESTIMATED
RER_ESTIMATED_LR
-15%
-10%
-5%
0%
5%
10%
19
80
19
81
19
82
19
83
19
84
19
85
19
86
19
87
19
88
19
89
19
90
19
91
19
92
19
93
19
94
19
95
19
96
19
97
19
98
19
99
20
00
20
01
20
02
20
03
20
04
20
05
20
06
20
07
20
08
20
09
misalignment
misalignment_total
overvaluation
undervaluation
1.8
1.85
1.9
1.95
2
2.05
2.1
2.15
2.2
19
80
19
81
19
82
19
83
19
84
19
85
19
86
19
87
19
88
19
89
19
90
19
91
19
92
19
93
19
94
19
95
19
96
19
97
19
98
19
99
20
00
20
01
20
02
20
03
20
04
20
05
20
06
20
07
20
08
20
09
RER_TN
RER_ESTIMATED
RER_ESTIMATED_LR
-15%
-10%
-5%
0%
5%
10%
19
80
19
81
19
82
19
83
19
84
19
85
19
86
19
87
19
88
19
89
19
90
19
91
19
92
19
93
19
94
19
95
19
96
19
97
19
98
19
99
20
00
20
01
20
02
20
03
20
04
20
05
20
06
20
07
20
08
20
09
misalignment
misalignment_total
overvaluation
undervaluation
14
For Tunisia, the low misalignment in recent years can be explained by the abandonment of the real
exchange rate targeting and gradual introduction of the exchange rate flexibility, with a view to
introduce a floating system and complete capital mobility over the medium term. This goal had initially
been set for 2010 but was postponed to 2014 because of the global crisis. The relative flexibility of the
exchange-rate system resulted in a depreciating trend for the REER, fed by negative terms of trade
shocks and by increased openness of the economy. Depreciation reinforced the price competitiveness
of exports, but structural bottlenecks remained. Tunisia’s policy of opening to the global economy
weathered the impact of the global economic and financial crisis. The authorities continued lowering
custom duties to comply with international commitments such as World Trade Organization, Agadir
Agreement, and Arab Maghreb Union (AMU) free-trade agreements, etc. and to stimulate trade across
borders. Since January 2008, Tunisia has established a free-trade zone for industrial products with the
EU.18
In Morocco, misalignment has been low in recent years. The county experienced a short overvaluation
in mid- 80s entailed by the current account deficit, followed by the devaluation in the late 1980s. It’s
important to note that Morocco’s equilibrium exchange rate’s was not affected by the latest global
economic crises, in part due to prudent monetary policy (Figure 4b).
Overall, periods of major exchange rate misalignments in Egypt are associated with country’s changes
in inflation.19
Specifically, episodes of overvaluation are associated with Egypt’s episodes of high
inflation. For example, during the period 1984-1990 (overvaluation period), the average inflation was
almost 20 percent (above the sample’s average inflation of 12 percent). Similarly, episodes of
undervaluation correspond to periods of decreasing inflation – during 1998-2002, the inflation rate
reached its lowest level (average rate was 3.3 percent). Moreover, until recently Egypt’s exchange rate
was de facto fixed (various changes to the official regimes notwithstanding) which has contributed to
the real exchange rate misalignment (Figure 4a).20
In contrast, relatively low misalignments in Morocco and Tunisia owe in part to maintaining inflation
at moderate levels since mid-1990s, as pointed in Elbadawi and Kamar (2006). As, inflation has been
decreasing since the early 1980s, it is not clear how to associate a specific overvaluation to an episode
of high inflation.21
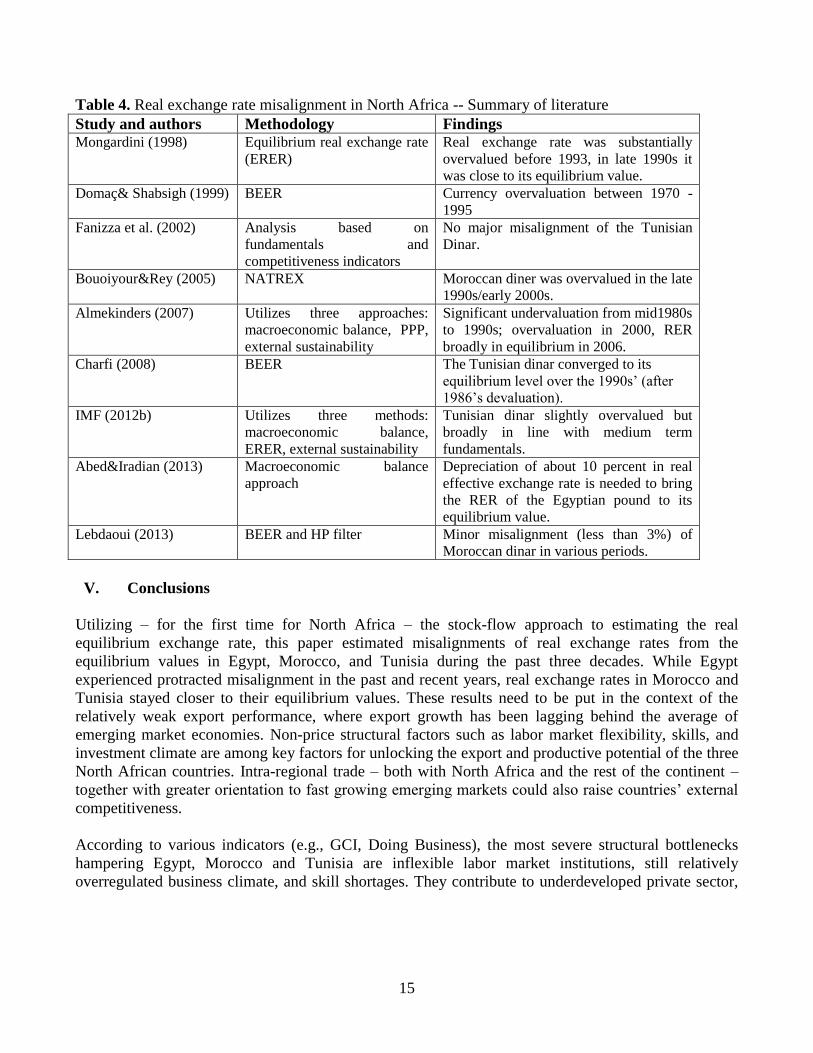
4. Comparison of Results with the Empirical Literature
Findings of earlier studies on the real exchange rate misalignment in North Africa, utilizing mostly the
behavioral equilibrium exchange rate but also other approaches, are summarized in Table 4. The results
of our paper, which uses the stock-flow approach to estimating the real equilibrium exchange rate, are
broadly consistent with most of the empirical literature.22
18
Daly (2006) found real exchange rate fluctuations in Tunisia to be driven mostly by real shocks. 19
This is despite the de facto fixed exchange rate regime, which in MENA countries is usually associated with low inflation
(Ghanem, 2012). 20
By targeting the real exchange rate in the 1990s, Morocco and Tunisia introduced some flexibility to the rate. Nabli and
Véganzonès-Varoudakis (2004) attribute the periods of high real exchange rate misalignments in MENA countries to rigid
exchange rates and the lack of reforms. 21
Still, for the case of Morocco, the overvaluation observed in 1984 and 1985 coincides with an episode of higher inflation
(Morocco’s economy reached one of its highest inflation rate – 12.5 percent – during this period). 22
Robustness checks conducted with HP filter are in Annex III.
15
Table 4. Real exchange rate misalignment in North Africa -- Summary of literature
Study and authors Methodology Findings Mongardini (1998) Equilibrium real exchange rate
(ERER)
Real exchange rate was substantially
overvalued before 1993, in late 1990s it
was close to its equilibrium value.
Domaç& Shabsigh (1999) BEER Currency overvaluation between 1970 -
1995
Fanizza et al. (2002) Analysis based on
fundamentals and
competitiveness indicators
No major misalignment of the Tunisian
Dinar.
Bouoiyour&Rey (2005) NATREX Moroccan diner was overvalued in the late
1990s/early 2000s.
Almekinders (2007) Utilizes three approaches:
macroeconomic balance, PPP,
external sustainability
Significant undervaluation from mid1980s
to 1990s; overvaluation in 2000, RER
broadly in equilibrium in 2006.
Charfi (2008) BEER The Tunisian dinar converged to its
equilibrium level over the 1990s’ (after
1986’s devaluation).
IMF (2012b) Utilizes three methods:
macroeconomic balance,
ERER, external sustainability
Tunisian dinar slightly overvalued but
broadly in line with medium term
fundamentals.
Abed&Iradian (2013) Macroeconomic balance
approach
Depreciation of about 10 percent in real
effective exchange rate is needed to bring
the RER of the Egyptian pound to its
equilibrium value.
Lebdaoui (2013) BEER and HP filter Minor misalignment (less than 3%) of
Moroccan dinar in various periods.
V. Conclusions
Utilizing – for the first time for North Africa – the stock-flow approach to estimating the real
equilibrium exchange rate, this paper estimated misalignments of real exchange rates from the
equilibrium values in Egypt, Morocco, and Tunisia during the past three decades. While Egypt
experienced protracted misalignment in the past and recent years, real exchange rates in Morocco and
Tunisia stayed closer to their equilibrium values. These results need to be put in the context of the
relatively weak export performance, where export growth has been lagging behind the average of
emerging market economies. Non-price structural factors such as labor market flexibility, skills, and
investment climate are among key factors for unlocking the export and productive potential of the three
North African countries. Intra-regional trade – both with North Africa and the rest of the continent –
together with greater orientation to fast growing emerging markets could also raise countries’ external
competitiveness.
According to various indicators (e.g., GCI, Doing Business), the most severe structural bottlenecks
hampering Egypt, Morocco and Tunisia are inflexible labor market institutions, still relatively
overregulated business climate, and skill shortages. They contribute to underdeveloped private sector,
16
slow growth and high and persistent unemployment.23
To address these constrains, further progress
needs to be made with reducing skill mismatch (e.g., revamping educational systems to reflect labor
market demand); improving the business environment; and increasing labor market flexibility.
Regarding the job creation part, measures could shift from establishing enabling environment (e.g.
limiting rigidities) to more pro-active ones such as support to entrepreneurship in high-value added
sectors and activities. This would be particularly important in the aftermath of the global economic
crisis and in the context of ongoing domestic transitions, which put inclusive growth and job creation
high on the countries’ policy agenda.
23
Blanke et al. (2011) elaborate. As Rasmussen (2010) states, the MENA region’s subdued GDP growth goes hand in hand
with its weak trade performance. Specifically, exports per capita of Morocco, Tunisia, and Egypt grew at slower rate than
the average of emerging market economies since 1990.
17
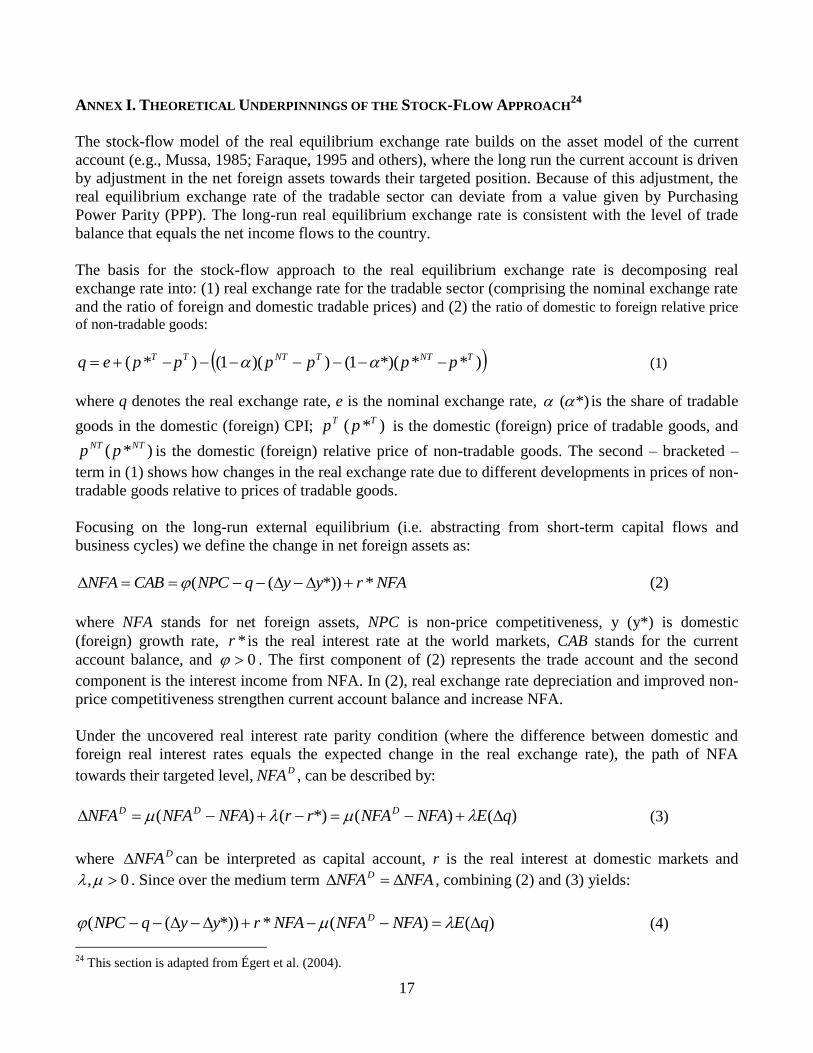
ANNEX I. THEORETICAL UNDERPINNINGS OF THE STOCK-FLOW APPROACH24
The stock-flow model of the real equilibrium exchange rate builds on the asset model of the current
account (e.g., Mussa, 1985; Faraque, 1995 and others), where the long run the current account is driven
by adjustment in the net foreign assets towards their targeted position. Because of this adjustment, the
real equilibrium exchange rate of the tradable sector can deviate from a value given by Purchasing
Power Parity (PPP). The long-run real equilibrium exchange rate is consistent with the level of trade
balance that equals the net income flows to the country.
The basis for the stock-flow approach to the real equilibrium exchange rate is decomposing real
exchange rate into: (1) real exchange rate for the tradable sector (comprising the nominal exchange rate
and the ratio of foreign and domestic tradable prices) and (2) the ratio of domestic to foreign relative price
of non-tradable goods:
)***)(1())(1()*( TNTTNTTT ppppppeq (1)
where q denotes the real exchange rate, e is the nominal exchange rate, *)( is the share of tradable
goods in the domestic (foreign) CPI; Tp )*( Tp is the domestic (foreign) price of tradable goods, and
)*( NTNT pp is the domestic (foreign) relative price of non-tradable goods. The second – bracketed –
term in (1) shows how changes in the real exchange rate due to different developments in prices of non-
tradable goods relative to prices of tradable goods.
Focusing on the long-run external equilibrium (i.e. abstracting from short-term capital flows and
business cycles) we define the change in net foreign assets as:
NFAryyqNPCCABNFA **))(( (2)
where NFA stands for net foreign assets, NPC is non-price competitiveness, y (y*) is domestic
(foreign) growth rate, *r is the real interest rate at the world markets, CAB stands for the current
account balance, and 0 . The first component of (2) represents the trade account and the second
component is the interest income from NFA. In (2), real exchange rate depreciation and improved non-
price competitiveness strengthen current account balance and increase NFA.
Under the uncovered real interest rate parity condition (where the difference between domestic and
foreign real interest rates equals the expected change in the real exchange rate), the path of NFA
towards their targeted level, DNFA , can be described by:
)()(*)()( qENFANFArrNFANFANFA DDD (3)
where DNFA can be interpreted as capital account, r is the real interest at domestic markets and
0, . Since over the medium term NFANFAD , combining (2) and (3) yields:
)()(**))(( qENFANFANFAryyqNPC D (4)
24
This section is adapted from Égert et al. (2004).
18
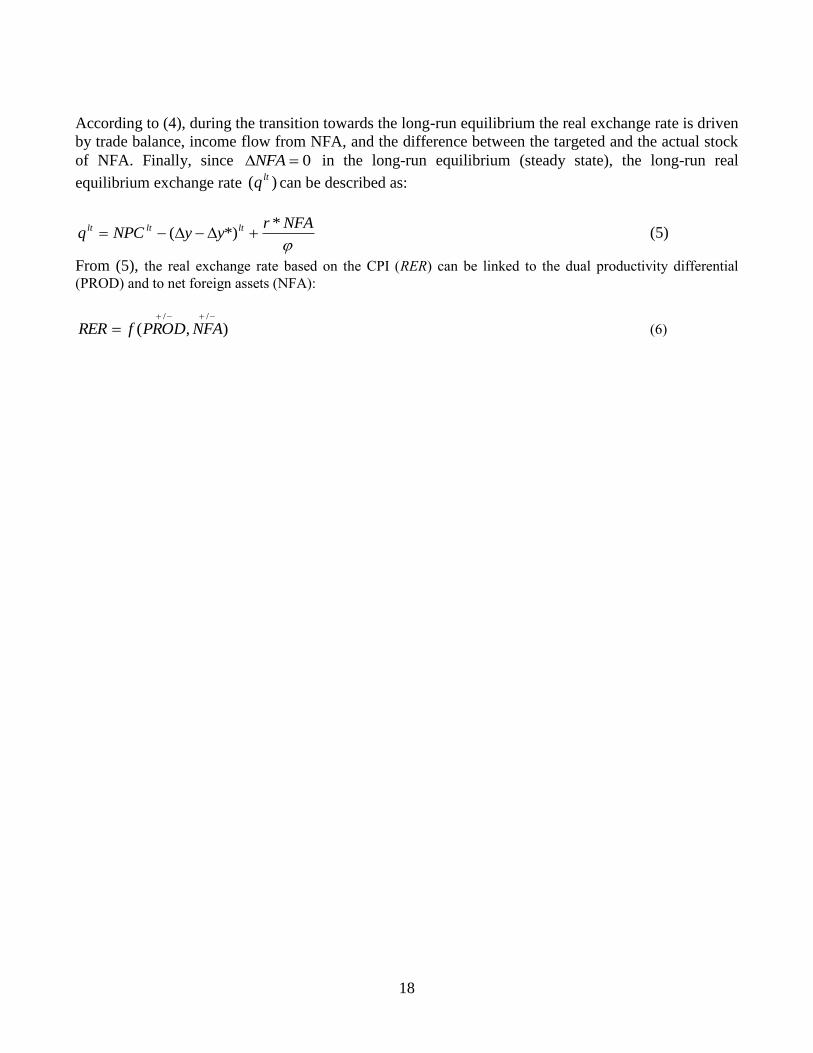
According to (4), during the transition towards the long-run equilibrium the real exchange rate is driven
by trade balance, income flow from NFA, and the difference between the targeted and the actual stock
of NFA. Finally, since 0NFA in the long-run equilibrium (steady state), the long-run real
equilibrium exchange rate )( ltq can be described as:
NFAryyNPCq ltltlt **)( (5)
From (5), the real exchange rate based on the CPI (RER) can be linked to the dual productivity differential
(PROD) and to net foreign assets (NFA):
),(//
NFAPRODfRER (6)
19
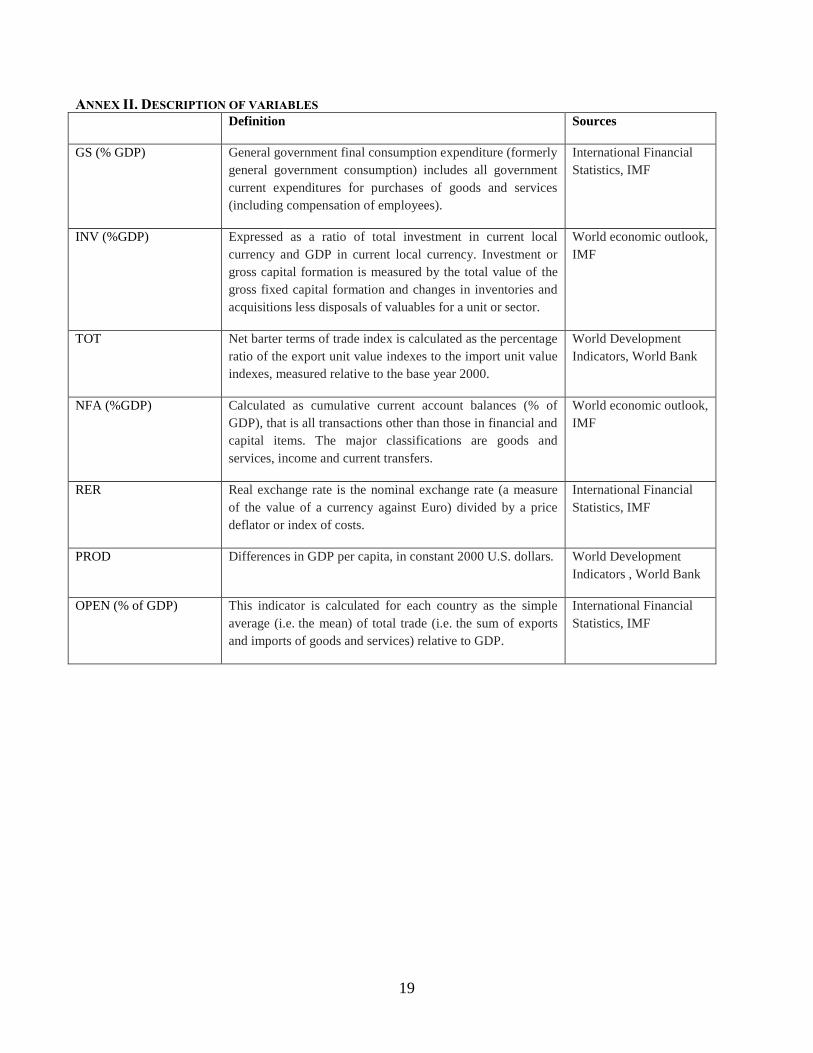
ANNEX II. DESCRIPTION OF VARIABLES Definition Sources
GS (% GDP) General government final consumption expenditure (formerly
general government consumption) includes all government
current expenditures for purchases of goods and services
(including compensation of employees).
International Financial
Statistics, IMF
INV (%GDP) Expressed as a ratio of total investment in current local
currency and GDP in current local currency. Investment or
gross capital formation is measured by the total value of the
gross fixed capital formation and changes in inventories and
acquisitions less disposals of valuables for a unit or sector.
World economic outlook,
IMF
TOT Net barter terms of trade index is calculated as the percentage
ratio of the export unit value indexes to the import unit value
indexes, measured relative to the base year 2000.
World Development
Indicators, World Bank
NFA (%GDP) Calculated as cumulative current account balances (% of
GDP), that is all transactions other than those in financial and
capital items. The major classifications are goods and
services, income and current transfers.
World economic outlook,
IMF
RER Real exchange rate is the nominal exchange rate (a measure
of the value of a currency against Euro) divided by a price
deflator or index of costs.
International Financial
Statistics, IMF
PROD Differences in GDP per capita, in constant 2000 U.S. dollars. World Development
Indicators , World Bank
OPEN (% of GDP) This indicator is calculated for each country as the simple
average (i.e. the mean) of total trade (i.e. the sum of exports
and imports of goods and services) relative to GDP.
International Financial
Statistics, IMF

20
ANNEX III. REAL EXCHANGE RATE MISALIGNMENT – ROBUSTNESS CHECK
In this Annex, we conduct robustness check of our empirical results utilizing a purely statistical method of
estimating the real equilibrium exchange rate by de-trending the actual series with HP filter. The
assumption behind this approach, utilized in Csajbok (2003), Frait et al. (2006), Lebdaoui (2013) and
others, is that over the longer term, the real exchange rate is on average in equilibrium.
Results utilizing this method confirm those derived with the stock-flow approach. Egypt has experienced
periods of sizeable real exchange rate misalignments, including overvaluation of the real exchange rate in
recent years. In contrast, real exchange rates of Morocco and Tunisia have been broadly aligned with their
equilibrium values (Figure 1, Annex II).
Figure 1a. Egypt: Real Exchange Rate Misalignment, 1980-2009 (% of the REER)
Figure 1b. Morocco: Real Exchange Rate Misalignment, 1980-2009 (% of the REER)
1.6
1.7
1.8
1.9
2.0
2.1
2.2
1980 1984 1988 1992 1996 2000 2004 2008
Actual REER -15%
-10%
-5%
0%
5%
10%
1980 1984 1988 1992 1996 2000 2004 2008
1.6
1.7
1.8
1.9
2
2.1
2.2
1980 1984 1988 1992 1996 2000 2004 2008
Actual REER
-15%
-10%
-5%
0%
5%
10%
1980 1984 1988 1992 1996 2000 2004 2008

21
Figure 1c. Tunisia: Real Exchange Rate Misalignment, 1980-2009 (% of the REER)
Source: Authors’ calculations. REER is computed with HP filter.
1.6
1.7
1.8
1.9
2
2.1
2.2
1980 1984 1988 1992 1996 2000 2004 2008
Actual REER
-15%
-10%
-5%
0%
5%
10%
1980 1984 1988 1992 1996 2000 2004 2008
22
References
Abed, G. T. and Iradian, G. (2013), ‘Egypt: Is the Exchange Rate Still Misaligned?’, Institute for
International Finance: Washington, DC.
Ahmed, M. and et al. (2010), ‘Trade Competitiveness and Growth in the MENA Region’, in Hanouz
and Khatib (eds.), Arab World Competitiveness Review 2010, World Economic Forum: Geneva.
Almekinders, G. (2007), ‘External Competitiveness and Real Exchange Rate in Egypt’, in Egypt –
Selected Issues, IMF country Report No. 07/381.
Al Shehabi O. and Ding S., (2008), ‘Estimating Equilibrium Exchange Rates for Armenia and
Georgia’, IMF Working Paper No. WP/08/111.
Alberola, E. (2003), ‘Real Convergence, External Disequilibria and Equilibrium Exchange Rates in EU
Acceding Countries’, Banco de España, mimeo.
Alberola, E.; Cervero, S. G.; Lopez, H. and Ubide, A. (2002), Quo vadis Euro? The European Journal
of Finance, Vol. 8, 352-370.
Babetskii, I. and Égert, B. (2005), ‘Equilibrium Exchange Rate in the Czech Republic: How Good is
the Czech BEER?’, Czech Journal of Economics and Finance (Finance and Úver), Vol. 55 (5-6), 232 –
252.
Benigno, G. and C. Thoenissen, (2003), ‘Equilibrium Exchange Rates and Capital and Supply Side
Performance’, Economic Journal, Vol. 113 (486), 103–124.
Bhala, S. (2008), ‘Economic Development and the Role of Currency Undervaluation’, Cato Journal
Vol. 28(1).
Blanke, J.; Brixiova, Z.; Dadush, U.; Gurcanlar, T. and Iarossi, G. (2011), ‘Exports, FDI and
Competitiveness in Africa’, in 2011 Africa Competitiveness Report, World Economic Forum: Geneva,
World Bank: Washington, DC and African Development Bank: Tunis.
Bouoiyour, J. and Rey, S. (2005), ‘Exchange Rate Regime, Real Exchange Rate, Trade Flows and
Foreign Direct Investments: The Case of Morocco’, African Development Review Vol. 17(2), 302 –
334.
Bussiẻre, M.; Zorzi, M.; Chudik, A.; and Dieppe, A. (2010), ‘Methodological Advances in the
Assessment of Equilibrium Exchange Rates’, European Central Bank Working Paper No. 1151.
Coudert, V. and Couharde, C. (2005), ‘Exchange Rate Regimes and Misalignments in Emerging
Countries’, Paper presented at the 10th International Conference on Macroeconomic Analysis and
International Finance, University of Crete (May 25 – 27).
23
Csajbok A. (2003), ‘The Equilibrium Real Exchange Rate in Hungary: Results from Alternative
Approaches’, Paper presented at the 2nd workshop on Macroeconomic Policy Research. Magyar
Nemzeti Bank, October.
Charfi, F. M. (2008), ‘Equilibrium real exchange rate and misalignments: Lessons from a VAR-ECM
model applied to Tunisia’, Panoeconomicus, Vol. 55(4), 439–464.
Daly, S. M. (2006), ‘Tunisia: Sources of Real Exchange Rate Fluctuations’, William Davidson Institute
Working Paper No. 880, University of Michigan.
Domaç, I. and Shabsigh, G. (1999), ‘Real Exchange Rate Behavior and Economic Growth - Evidence
from Egypt, Jordan, Morocco, and Tunisia’, IMF Working Paper No. 99/40.
Dornbusch, R. (1980), ‘Exchange Rate Economics: Where Do We Stand?’, Brookings Papers on
Economics Activity, Economic Studies Program, The Brookings Institution, Vol. 11(1), 143-206.
Dropsy, V. and Grand, N. (2004), ‘Exchange Rate and Inflation Targeting in Morocco and Tunisia’,
Economic Forum Research Paper No. 421.
Edwards, S. (1994), ‘Real and Monetary Determinants of Real Exchange Rate Behavior: Theory and
Evidence from Developing Countries’, in J. Williamson (editor), Estimating Equilibrium Exchange
Rates, Institute for International Economics: Washington, DC.
Égert, B., A. Lahrèche-Révil and K. Lommatzsch (2004), ‘The Stock-Flow Approach to the Real
Exchange Rate of CEE Transition Economies’, Centre D’Etudes Prospectives et D’Informations
Internationales (CEPII), No 2004 – 15.
Égert, B., Lommatzsch, K. and A. Lahrèche-Révil (2006), ‘Real Exchange Rates in Small Open OECD
and Transition Economies: Comparing Apples with Oranges?’, Journal of Banking & Finance, Vol. 30
(12), 3393-3406.
Elbadawi, I. A. and Kamar, B. (2006), ‘The Great Debate on Exchange Rate Regimes: Why Should the
MENA Region Care?’ Paper presented at the 12th Annual Conference of the Economic Research
Forum for the Arab Countries, Iran and Turkey: Cairo, December 18-22.
Engle R.F. and Granger C.W.J., (1987), ‘Cointegration and Error Correction: Representation,
Estimation and Testing’, Econometrica, Vol. 55, 251-- 276.
Fanizza, D. et al. (2002), ‘Tunisia’s Experience with Real Exchange Rate Targeting and the Transition
to a Flexible Exchange Rate Regime’, IMF Working Paper WP/02/190.
Faruqee, H. (1995), ‘Long-Run Determinants of the Real Exchange Rate: A Stock-Flow Perspective’,
IMF Staff Papers, Vol. 42(1), pp. 80-107.
Frait, J.; Komarek, L.; and Melecký, M. (2006), ‘The Real Exchange Rate Misalignment in the Five
Central European Countries’, Warwick Economic Research Paper No. 739.
24
Ghanem, D. (2012), ‘Fixed Exchange Rate Regimes and Inflation Performance: Evidence from MENA
Countries’, Review of Middle East Economics and Finance, Vol. 8(1), 1 – 30.
International Monetary Fund (2012a), Annual Report on Exchange Rate Arrangements and Exchange
Rate Restrictions, IMF: Washington, DC.
International Monetary Fund (2012b), ‘Tunisia: 2012 Article IV Consultation’, IMF Country Report
No. 12/255.
Kremers, J.; Ericsson, N. and Dolado, J. (1992), ‘The Power of Cointegrating Test’, Oxford Bulletin of
Economics and Statistics, Vol. 54(3), 325 – 348.
Lebdaoui, H. (2013), ‘The Real Exchange Rate Misalignment: Application of Behavioral Equilibrium
Exchange Rate BEER to Morocco1980Q1–2012Q4’, International Journal of Economics and Finance;
Vol. 5 (10), 36 – 50.
Montgardini, J. (1998), ‘Estimating Egypt’s Equilibrium Exchange Rate’, IMF Working Paper No.
98/5.
Mussa, M. (1984), ‘The Theory of Exchange Rate Determination’, in Exchange Rate Theory and
Practice, J. F. O Bilson and R. C. Marston, eds. (13 – 78), NBER and University of Chicago Press.
Nabli, M. K. and Veganzones-Varoudakis, M. (2004), ‘How does exchange rate policy affect
manufactured exports in MENA countries?’, Applied Economics, Vol. 36 (19), 2209 – 2219.
Ngandu, S. (2008), ‘Exchange Rates and Employment’, South African Journal of Economics, Vol. 76,
Supplement 2, 205 – 221.
Rasmussen, T. (2010), ‘MENAP Oil Importers: Adjusting to New Global Growth Patterns’, in
Regional Economic Outlook—Middle East and Central Asia, IMF: Washington, DC.
Rodrik, D. (2003), ‘Growth strategies’, NBER Working Paper 10050, National Bureau of Economic
Research, Cambridge, USA
Sab, R.; Sensenbrenner, G. and Diouf, M. A. (2008), ‘Assessment of Morocco’s Real Exchange Rate’,
in Morocco: Selected Issues, IMF Country Report No. 08/311.
Selim, H. (2012), ‘Has Egypt’s Exchange Rate Policy Changed after the Float?’ Middle East
Development Journal, Vol. 4 (1), 1 - 27.
Stampini, M. and Verdier-Chouchane, A. (2011), ‘Labor Market Dynamics in Tunisia: The Issue of
Youth Unemployment’, Review of Middle East Economics and Finance, Vol. 11(2), 1-35.
Stein, J. L. (1995), ‘The Natural Real Exchange Rate of the United States Dollar, and Determination of
Capital Flows’, in J. L. Stein, P. Reynolds Allen et al., 1995, Fundamental Determinants of Exchange
Rates, Oxford University Press.
25
Stock, J. H. and Watson, M. W. (1993), ‘A Simple Estimator of Co-integrated Vectors in Higher Order
Integrated Systems’, Econometrica, Vol. 61(4), 783 – 820.
UNCTAD (2012), Development and Globalization: Facts and Figures 2012, UNCTAD: Geneva.
Wickens, M. R. and Breusch, T. S. (1988), 'Dynamic Specification, the Long-Run and the Estimation
of Transformed Regression Models', The Economic Journal, Vol. 98 (Conference 1988), 189-205.
Williamson, J., (1994), Estimating Equilibrium Exchange Rates, Washington: Institute for International
Economics.
Yagci, F. (2001), ‘Choice of Exchange Rate Regimes for Developing Countries’, World Bank, Africa
Region Working Paper Series No. 16.
26
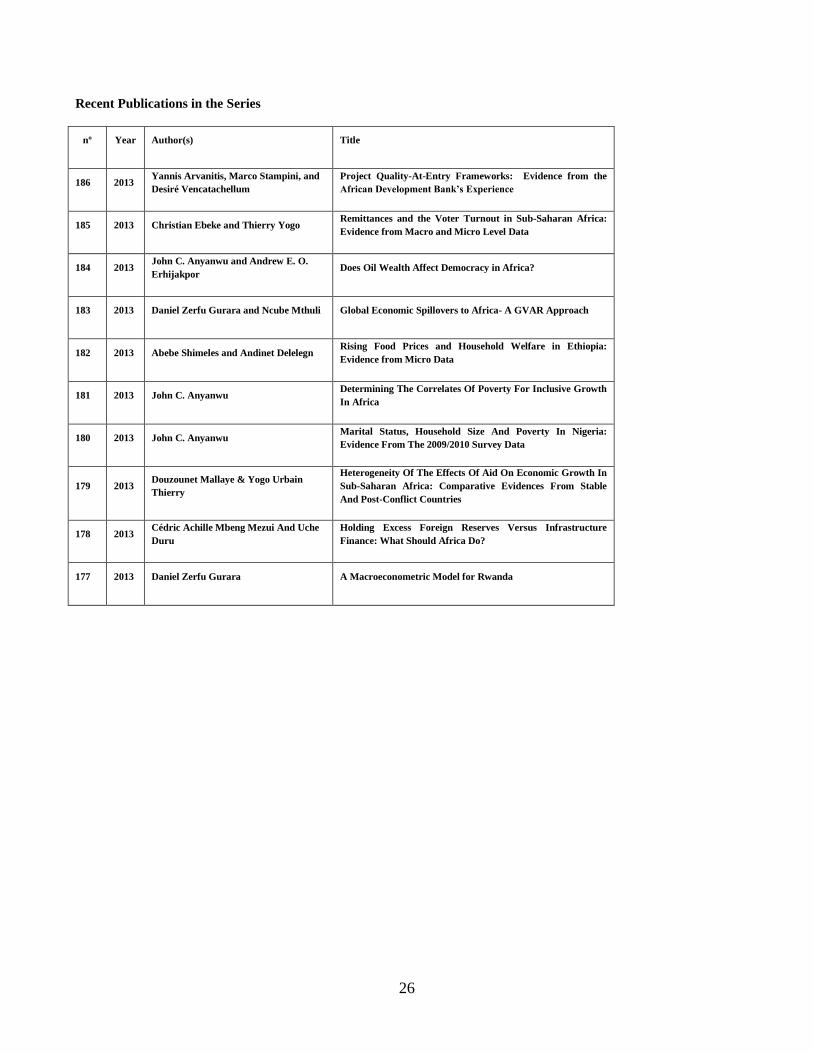
Recent Publications in the Series
nº Year Author(s) Title
186 2013 Yannis Arvanitis, Marco Stampini, and
Desiré Vencatachellum
Project Quality-At-Entry Frameworks: Evidence from the
African Development Bank’s Experience
185 2013 Christian Ebeke and Thierry Yogo Remittances and the Voter Turnout in Sub-Saharan Africa:
Evidence from Macro and Micro Level Data
184 2013 John C. Anyanwu and Andrew E. O.
Erhijakpor Does Oil Wealth Affect Democracy in Africa?
183 2013 Daniel Zerfu Gurara and Ncube Mthuli Global Economic Spillovers to Africa- A GVAR Approach
182 2013 Abebe Shimeles and Andinet Delelegn Rising Food Prices and Household Welfare in Ethiopia:
Evidence from Micro Data
181 2013 John C. Anyanwu Determining The Correlates Of Poverty For Inclusive Growth
In Africa
180 2013 John C. Anyanwu Marital Status, Household Size And Poverty In Nigeria:
Evidence From The 2009/2010 Survey Data
179 2013 Douzounet Mallaye & Yogo Urbain
Thierry
Heterogeneity Of The Effects Of Aid On Economic Growth In
Sub-Saharan Africa: Comparative Evidences From Stable
And Post-Conflict Countries
178 2013 Cédric Achille Mbeng Mezui And Uche
Duru
Holding Excess Foreign Reserves Versus Infrastructure
Finance: What Should Africa Do?
177 2013 Daniel Zerfu Gurara A Macroeconometric Model for Rwanda
