workforce performance report august 2013 jayne halford deputy director of hr caring, safe and...
TRANSCRIPT

Workforce Performance ReportAugust 2013
Jayne HalfordDeputy Director of HR
Caring, safe and excellent1
Recruitment KPIs
4
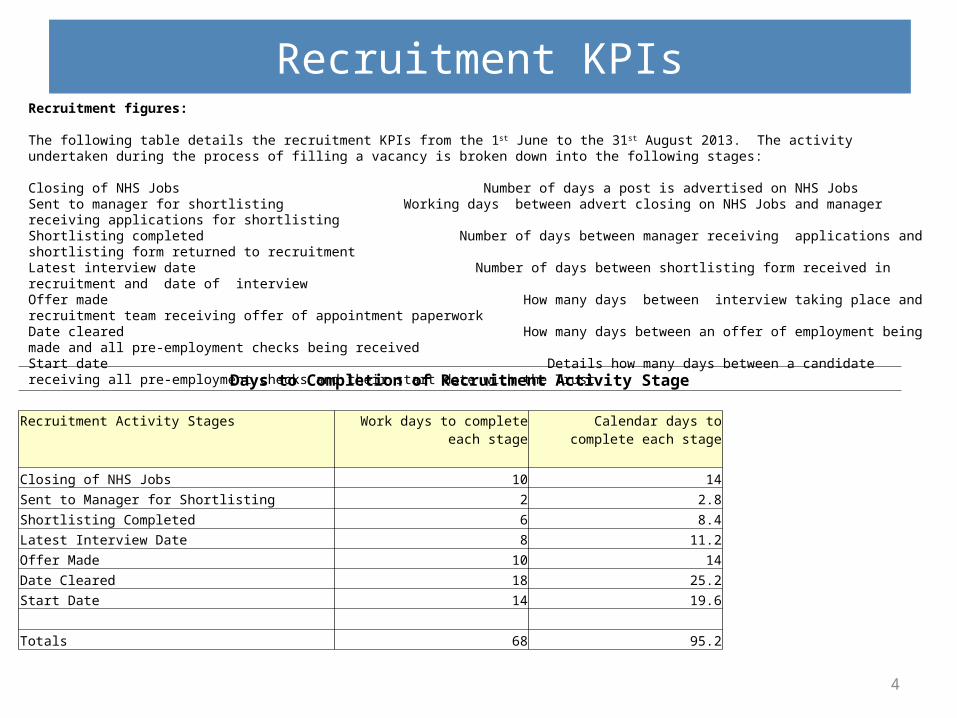
Days to Completion of Recruitment Activity Stage
Recruitment Activity Stages Work days to complete each stage
Calendar days to complete each stage
Closing of NHS Jobs 10 14
Sent to Manager for Shortlisting 2 2.8
Shortlisting Completed 6 8.4
Latest Interview Date 8 11.2
Offer Made 10 14
Date Cleared 18 25.2
Start Date 14 19.6
Totals 68 95.2
Recruitment figures: The following table details the recruitment KPIs from the 1st June to the 31st August 2013. The activity undertaken during the process of filling a vacancy is broken down into the following stages: Closing of NHS Jobs Number of days a post is advertised on NHS JobsSent to manager for shortlisting Working days between advert closing on NHS Jobs and manager receiving applications for shortlistingShortlisting completed Number of days between manager receiving applications and shortlisting form returned to recruitmentLatest interview date Number of days between shortlisting form received in recruitment and date of interviewOffer made How many days between interview taking place and recruitment team receiving offer of appointment paperworkDate cleared How many days between an offer of employment being made and all pre-employment checks being receivedStart date Details how many days between a candidate receiving all pre-employment checks and their start date with the Trust

5
Recruitment KPIs
Staff group Establishment Figure
Total Average per Month Average per Year% Average per year
Add Prof Scientific and Technic 586 5 1.3 15.0 2.55
Additional Clinical Services 1446 31 7.8 93.0 6.43
Administrative and Clerical 1205 27 6.8 81.0 6.72
Allied Health Professionals 606 14 3.5 42.0 6.93
Medical and Dental 329 3 0.8 9.0 2.73
Nursing and Midwifery Registered 1975 34 8.5 102.0 5.16
Honorary N/A 37 9.3 111.0 N/A
Grand Total 6147 159 39.8 477.0 7.75
Vacancies by staff group: This data is from the 1st June to the 31st August 2013
Exit Questionnaire Data
6
Division Percent CountCorporate ||||||||||||||||||||||||||||||||||||||||||||||||||||||||||||
||||||||||||||||||||16% 16
Children and Families ||||||||||||||||||||||||||||||||||||||||||||||||||||||||||||||||||||||||||||||||||||||||||||||||||||||||||||||||||||||||
25% 24
Community |||||||||||||||||||||||||||||||||||||||||||||||||||||||||||||||||||||||||||||||||||||||||||||||||||||||||||||||||||||||||||||||||||||||
28% 27
Specialised ||||||||||||||||||||||||| 5% 5
Mental Health ||||||||||||||||||||||||||||||||||||||||||||||||||||||||||||||||||||||||||||||||||||||||||||||||||||
21% 20
Unspecified ||||||||||||||||||||||||| 5% 5
Staff Group Percent Count
Add Prof Scientific and Technic |||||||||||| 3% 3
Additional Clinical Services ||||||||||||||||||||||||||||||||||||||||||||||||||||||||||||||||
16% 16
Administrative and Clerical ||||||||||||||||||||||||||||||||||||||||||||||||||||||||||||||||||||||||||||||||||||||||||||||||||||||||
27% 26
Allied Health Professionals ||||||||||||||||||||||||||||||||||||||||||||||||||||||||||||||||||||
18% 17
Medical and Dental |||||||||||| 3% 3
Nursing and Midwifery Registered
||||||||||||||||||||||||||||||||||||||||||||||||||||||||||||||||||||||||||||||||||||||||||||||||||||||||||||||||||||
30% 29
Unspecified |||||||||||| 3% 3
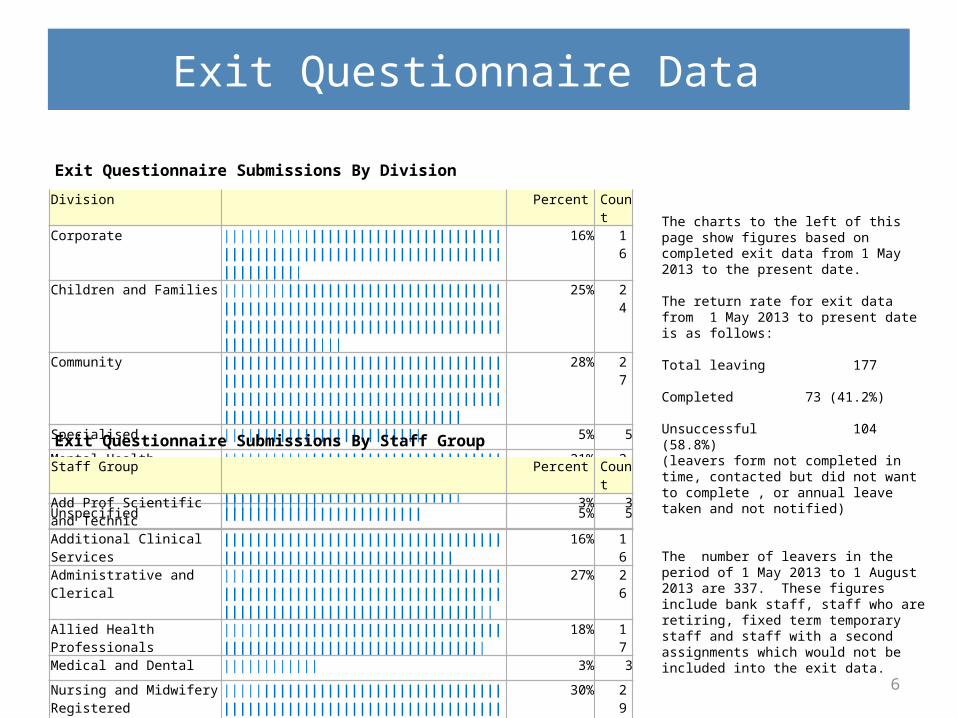
Exit Questionnaire Submissions By Division
Exit Questionnaire Submissions By Staff Group
The charts to the left of this page show figures based on completed exit data from 1 May 2013 to the present date.
The return rate for exit data from 1 May 2013 to present date is as follows:
Total leaving 177
Completed 73 (41.2%)
Unsuccessful 104 (58.8%)(leavers form not completed in time, contacted but did not want to complete , or annual leave taken and not notified)
The number of leavers in the period of 1 May 2013 to 1 August 2013 are 337. These figures include bank staff, staff who are retiring, fixed term temporary staff and staff with a second assignments which would not be included into the exit data.
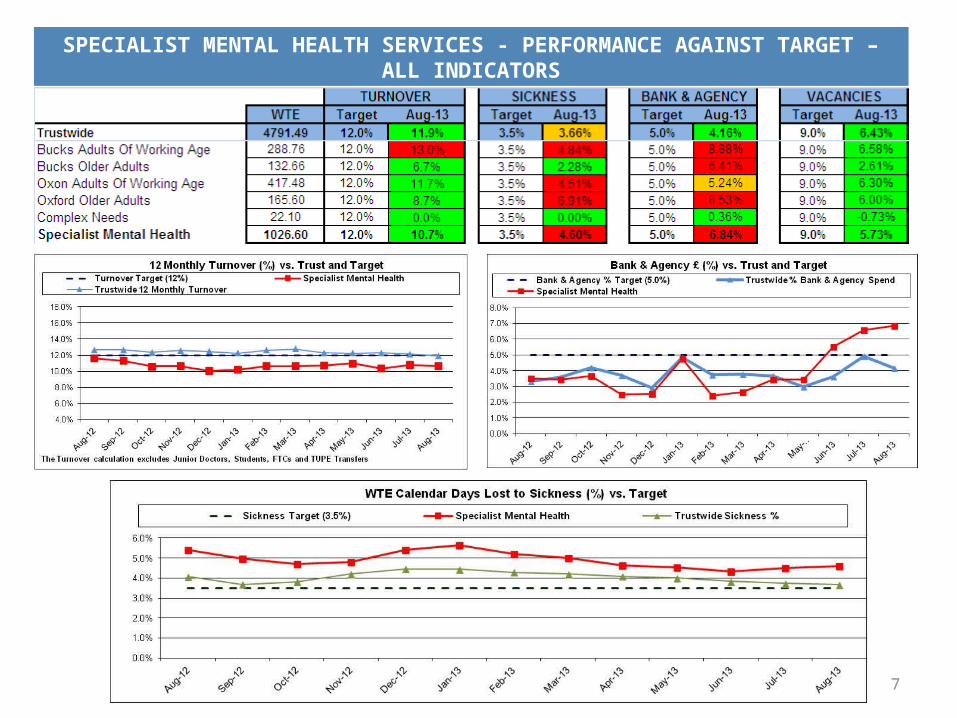
SPECIALIST MENTAL HEALTH SERVICES - PERFORMANCE AGAINST TARGET – ALL INDICATORS
7
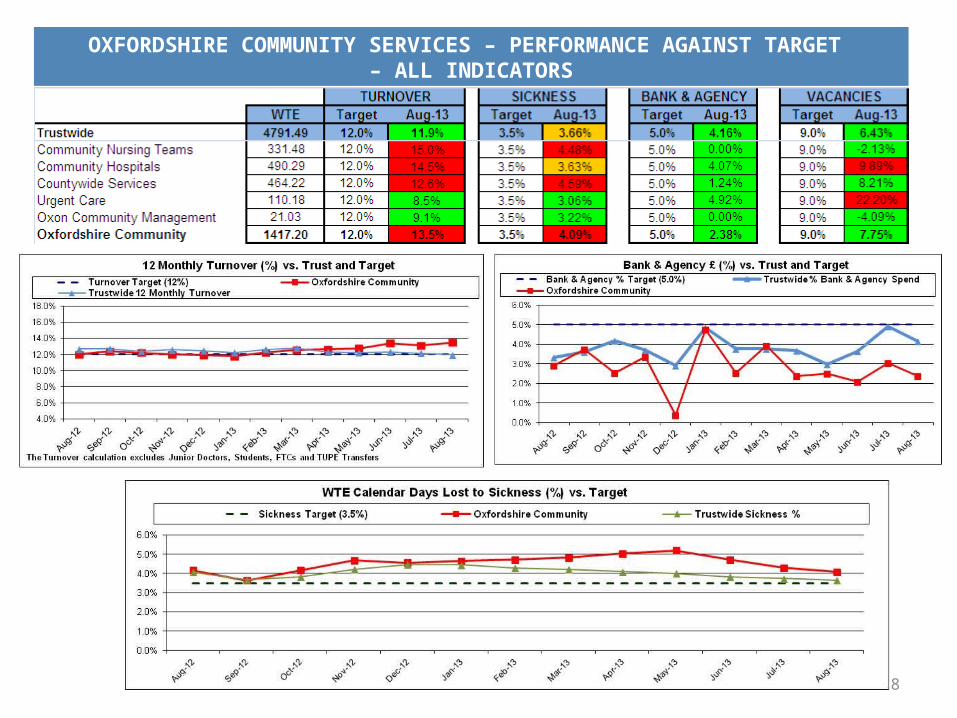
OXFORDSHIRE COMMUNITY SERVICES – PERFORMANCE AGAINST TARGET – ALL INDICATORS
8
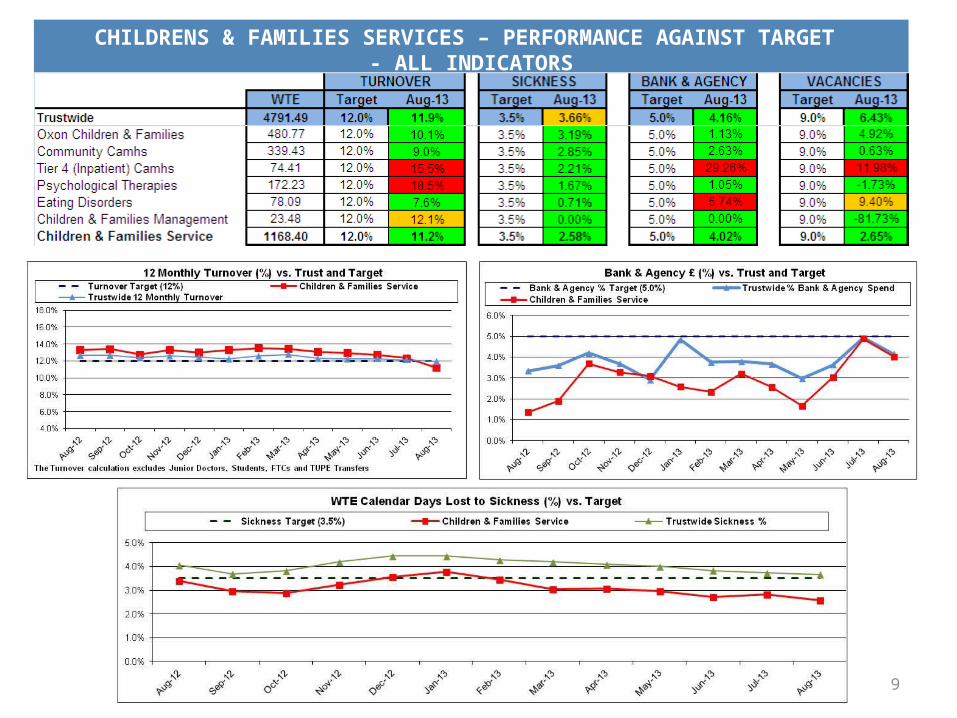
CHILDRENS & FAMILIES SERVICES – PERFORMANCE AGAINST TARGET - ALL INDICATORS
9
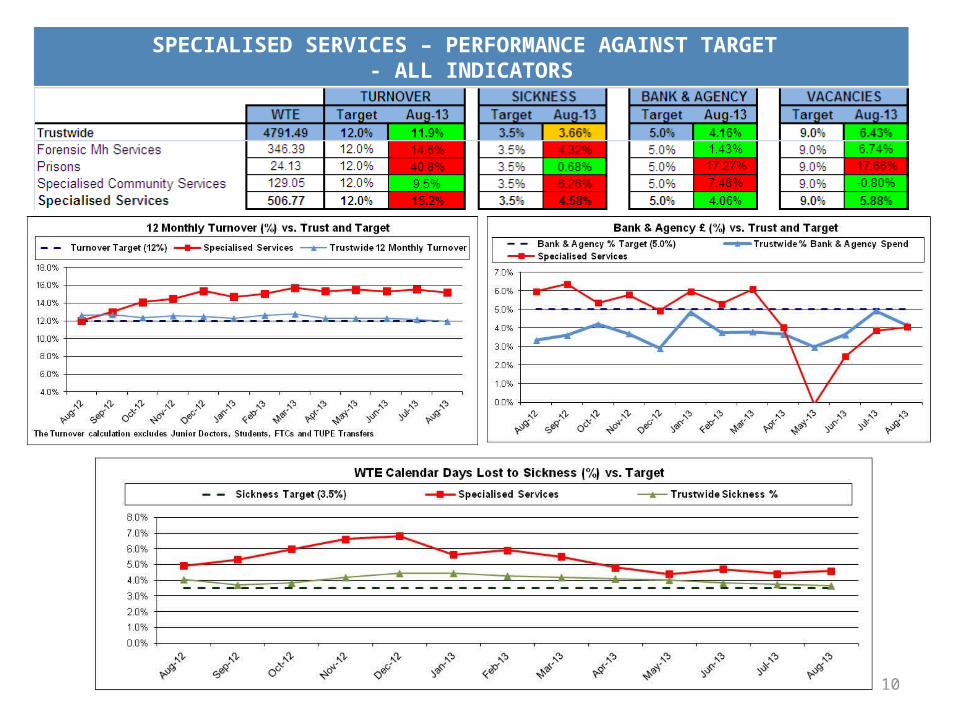
SPECIALISED SERVICES – PERFORMANCE AGAINST TARGET - ALL INDICATORS
10
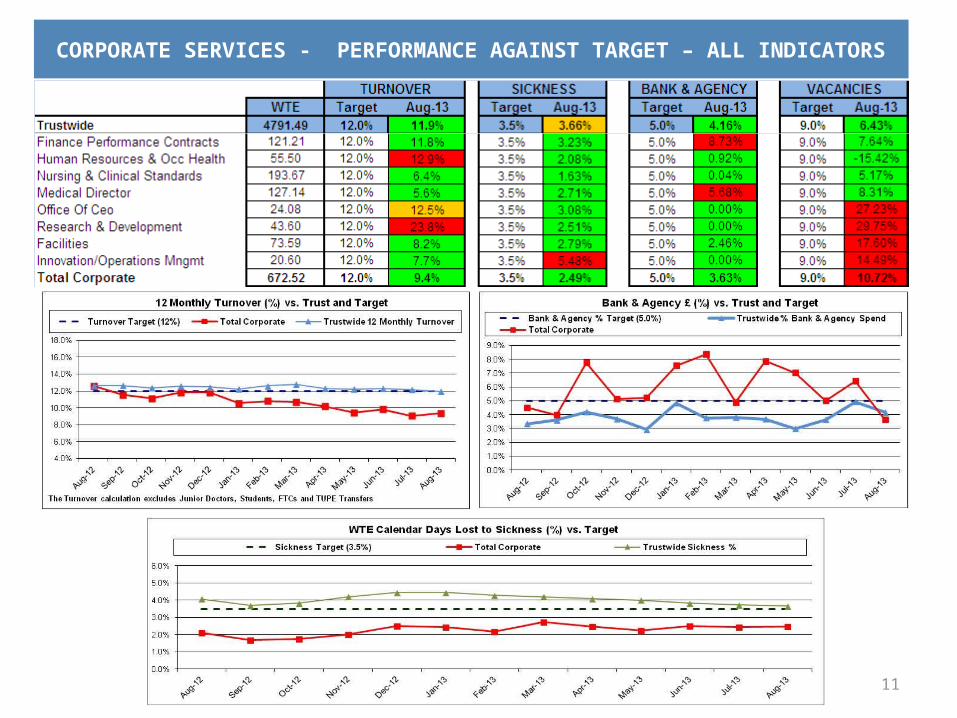
CORPORATE SERVICES - PERFORMANCE AGAINST TARGET – ALL INDICATORS
11
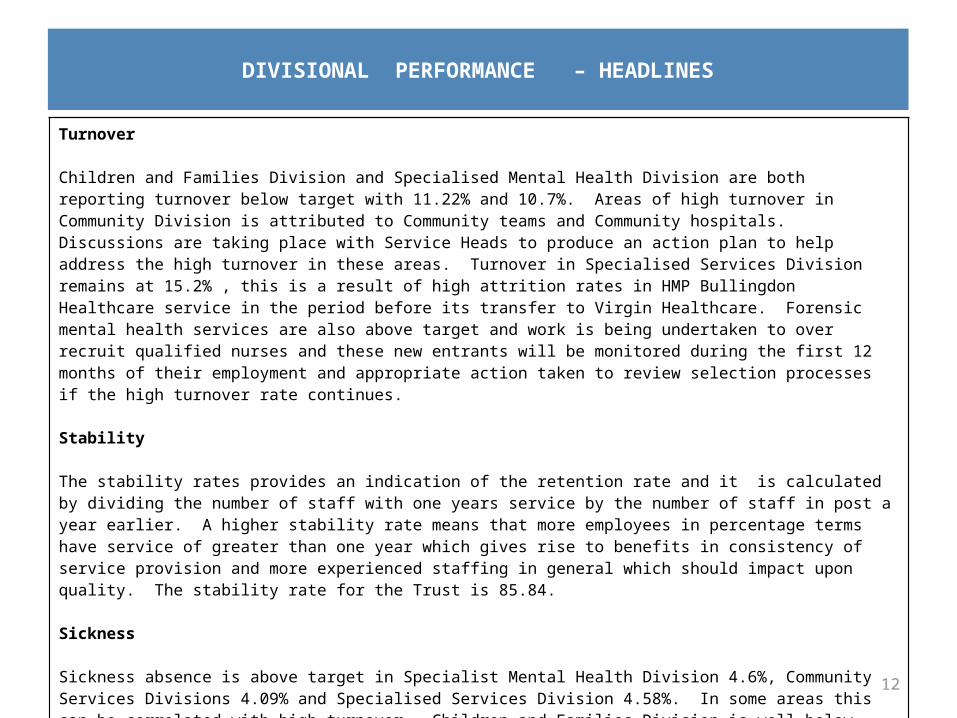
DIVISIONAL PERFORMANCE – HEADLINES
12
Turnover
Children and Families Division and Specialised Mental Health Division are both reporting turnover below target with 11.22% and 10.7%. Areas of high turnover in Community Division is attributed to Community teams and Community hospitals. Discussions are taking place with Service Heads to produce an action plan to help address the high turnover in these areas. Turnover in Specialised Services Division remains at 15.2% , this is a result of high attrition rates in HMP Bullingdon Healthcare service in the period before its transfer to Virgin Healthcare. Forensic mental health services are also above target and work is being undertaken to over recruit qualified nurses and these new entrants will be monitored during the first 12 months of their employment and appropriate action taken to review selection processes if the high turnover rate continues.
Stability
The stability rates provides an indication of the retention rate and it is calculated by dividing the number of staff with one years service by the number of staff in post a year earlier. A higher stability rate means that more employees in percentage terms have service of greater than one year which gives rise to benefits in consistency of service provision and more experienced staffing in general which should impact upon quality. The stability rate for the Trust is 85.84.
Sickness
Sickness absence is above target in Specialist Mental Health Division 4.6%, Community Services Divisions 4.09% and Specialised Services Division 4.58%. In some areas this can be correlated with high turnover. Children and Families Division is well below target at 2.58%. A new sickness absence policy has been developed and introduced. In addition Manager’s sickness absence guidelines are being revised. Refresher sickness and absence courses have been rolled out in Community Division and HR are working closely with managers in Re-ablement to develop a comprehensive action plan to address high absence levels in this area.
DIVISIONAL PERFORMANCE – HEADLINES
13
Bank & Agency
Bank and Agency is below target in Community Services Division 2.38%, Children and Families Division 4.02% and Specialised Services Division 4.06%. Specialist Mental Health Division has seen an increase to 6.84%. This increase is mainly in Older Adults and Adults of Working Age (Bucks). Increases in 2 of these areas correlates to high levels of sickness absence. HR are exploring options to try and attract additional sessional staff to services.
Vacancies
Vacancies in Corporate are highest at 10.7% which reflects scrutiny of all posts and freezing of some posts as part of the cost improvement programme.
There are still some areas in which it is difficult to recruit such as Henley community Hospital. Recruitment events are planned for September 2013 to target recruitment of qualified staff for Community and Older Adult Mental Health. Oxford Health has attended the RCN National Recruitment Fair in London on 10th and 11th September and has organised a bespoke recruitment event in Ireland on 26th September to try and attract qualified staff in preparation for winter escalation – if successful this should help to ensure that bank and agency usage remains below target in some areas over the winter period. Thames House in Specialised has successfully over recruited and will monitor new staff to ensure the revised recruitment process was successful.
Using lessons learned from the above events, further bespoke events may be planned and the format tweaked to try and cover other staff groups such as Re-ablement.
Over performance activity in Mental Health, district nursing and community hospitals is adding pressure to the staffing situation.