workforce investment act title i-b program for youth · or 2010-11. on among f completed the workfo...
TRANSCRIPT

2012 WoWorkforc
Workf
PrograThe WIA services, needing emploympotentiastamp refamily wliving sta Eligible yskill levedeveloperesults. T
C T Jo M W
Other stra GED orone-stopprogrameligible o The Emplocal woroversee W
orkforce Traice Investme
force In
am DetaiYouth progyouth mustadditional a
ment. To be l participant
ecipient, homith income b
andard incom
youth are asl, and suppoed for each
They may rec
Counseling. utoring. ob training.
Mentoring. Work experie
rategies inclr equivalent.p career cent
ms. At least 3out-of-schoo
ployment Serkforce deveWIA activitie
ning Resultsent Act—You
nvestme
ils gram prepart be 14 throuassistance toconsidered ts must be ameless, a fosbelow 70 peme level.
sessed to deort service nperson baseceive:
ence.
ude summe. Youth mayter system. Y0 percent ofol youth.
curity Depaelopment coes in local ar
s uth
ent Act T
es youth forugh 21 yearo complete low income
a welfare or ster child, orercent of the
etermine aceeds. Strate
ed on the as
er employmy access infoYouth ages f the WIA Yo
rtment admouncils, in coreas. Local y
Title I-B
r academic ars old, low inan educatio
e, food r in a e lower
cademic, egies are sessment
ent, study sormation ser
18 through outh funds m
ministers theonsultation
youth counc
Progra
and employncome, and onal program
kills trainingrvices throug
21 may be cmust be use
e program atwith chief lo
cils assist wit
Every yeBoard mperformprogramfind outprogramthe metperformprogram
m for Y
yment succemeet other
m or to secu
g, or instructgh WorkSouco-enrolled
ed to provide
t the state leocal electedth the WIA p
ear, the Wormeasures themance of keyms. In this ret more aboum and who istrics used to
mance and hom performed
outh
ess. To receivcriteria such
ure and hold
tion in obtaiurce, the sta
in WIA Adue activities f
evel. Twelved officials, program.
rkforce e y workforce eport, you’ll ut the is served,
o measure how the d.
1
ve h as
ining te’s lt
for
e

2012 WoWorkforc
ParticipFor this 2Youth prparticipathe amoeight mo WIA Youpopulati12 perceAmerican
Source: WISurvey.
Among t
1 The 2012programs 2 In this repindividual Hispanics)Islanders (referred towhites (alsAmerican American;
orkforce Traice Investme
pant Profi2012 report,rogram duriant was in thunt of time
onths, while
th program on.2 Among
ent were Afrin.
WIA Standardize
those leavin
2 Workforce Tra
during 2009-1port, unless otbelongs to on; non-Hispanicalso referred t
o as Native Amso referred to aCommunity Su8 percent are
ning Resultsent Act—You
le , researchersng the most
he program participantsanother qu
participantg program pican Americ
ed Record Data
g the progr
aining Results 0.
therwise statedne group only. c African Amero as Asians/Pa
mericans); non-as whites). Accurvey, 73 percAsians/Pacific
s uth
s studied thet recent repowas 14 mons spent in tharter enrolle
s were morearticipants, an, 4 percen
ta (WIASRD) an
am, 58 perc
reports are ba
d, racial and etThe groups in
ricans (also refacific IslandersHispanic mult
cording to the ent are white;
c Islander; 4 pe
e results of 2orting year.1
nths. There we program. ed for over 2
e racially and55 percent w
nt were Asia
nd 2010 U.S. Ce
ent were fem
ased on data o
thnic minority nclude the folloferred to as Afr); non-Hispaniiracial (also ref2010 U.S. Cen3 percent are
ercent are mult
2,184 partic1 The mediawas, howeveOne quarte
22 months.
d ethnicallywere white,
an/Pacific Isl
ensus Data fro
male—the s
observed in 20
groups are mowing: Hispanrican Americanic Native Amerferred to as m
nsus Bureau esAfrican Ameri
tiracial; and 11
cipants who an length of er, considera
er enrolled fo
y diverse tha, 23 percentander and 3
om the America
same as last
010-11 for indiv
utually exclusnics of any racens); non-Hisparicans and Alaultiracial); andtimates for Waican; 1 percent1 percent are H
left the WIAtime a able variatioor less than
an the state were Hispa
3 percent Na
can Community
t year.
viduals exiting
ive; that is, an e (also referredanic Asians/Pacskan Natives (a
d non-Hispanicashington fromt are Native
Hispanic.
2
A
on in
anic, ative
ty
g
d to as cific also c m the

2012 WoWorkforc
Source: WI
Many WImarket.
3 1 1 3
State CThe WorprogramWorkforceducatiotaxpayer The Wor
D D W H D
3 These are4 Those onAssistanceAssistance
orkforce Traice Investme
WIA Standardize
A Youth par
39 percent w8 percent ha6 percent re5 percent liv
Core Meakforce Board
ms. As a custoce Board str
on and trainirs.
kforce Train
Did participaDid participaWere employHas the progDid participa
e defined as yon public assistae, Refugee Case to Needy Fam
ning Resultsent Act—You
ed Record Data
rticipants fa
were high scad records o
eported a dived in house
asures: Td routinely momer-focuseives to proving program
ing Results
nts get the nts get a job
yers satisfiedram made ants and the
outh who had ance includes 3h Assistance, o
milies (TANF); a
s uth
ta (WIASRD).
ced substan
chool dropoof arrest or csability. eholds that
Tracking measures thed advocate
vide performms provide a
report seeks
skills they nb and how md with the pa difference
public rece
no high schoo35 percent whor Supplementand 3 percent
ntial barriers
uts when thconviction.
were receiv
WIA Youhe performae for Washin
mance accou return on in
s to answer
eeded? much were treparation win the particive a return
ol degree and wo received castal Security Incwho received
s to success
hey entered
ving public a
uth Prognce of our sgton’s work
untability, venvestment f
five core qu
they paid? workers rececipant’s succon their inv
who were notsh assistance fcome; 6 perceboth.
in school an
the program
assistance.4
ress state’s largeskers and emerifying whefor participa
uestions:
eived? cess?
vestment?
t enrolled in scfrom state or lont who receive
nd the labor
m.3
st workforceployers, the
ether workerants and
chool at registrocal General ed Temporary
3
r
e e r
ration.
y

2012 WoWorkforc
Data CoThe 2012Security records fsatisfactirecently through Survey.5 Net ImpProgramIn additiocomprehshort- antrends, dis used inyears, thto-head participain obtainparticipathe Net Iworkforcalso allowa return Did ParPromotinrecords pyounger school thfewer pa
5 The Empprograms:6 These recmaintaine7 These yo
orkforce Traice Investme
omes From2 WorkforceDepartmen
for 2010-11.ion among fcompleted the Workfo
pact Studm Performon, this yearhensive Net nd long-termdata on partin the Net Imis in-depth, comparison
ants to help ning a job, oants with simmpact Stud
ce programsws for a moron their inve
rticipants ng academicprovide infoparticipant
han in the 20articipants w
loyer Survey in Adult, Disloca
cords are colled by ESD. uth were ages
ning Resultsent Act—You
m State W Training Ret wage files Information
firms that hia WIA progrrce Board’s
y Adds Mmance r’s report incImpact Stud
m employmeicipant expe
mpact Study.detailed stu
n of participaanswer a cer a higher w
milar individy indicates w
s, or if workere detailed aestment in t
Get the Sc success is
ormation on s,7 data indi011 report—
who were no
ncludes emploated Worker, octed through
s 14 to 18 whe
s uth
Wage Filesesults includ
in Washingn on employred new emram was ass2012 Emplo
ore Insigh
cludes a dy. To assessent and earneriences thro Conducted
udy providesants and no
entral questiwage, is due
uals who didwhether em
ers could havanalysis as tothe program
Skills they an objectiveschool enrocate substan
—which hadot in school a
oyers who hireor Youth.
the Service, Kn
n registering i
, Employedes informat
ton, Idaho, ayer
mployees essed
oyer
ht into
s both nings ough 2009
d every four s a head-n-on: How muto the workd not partic
mployment ave made thio whether th
m.
Needed?e of the WIAollment andntially more the lowest
and who did
ed a participan
nowledge, and
n WIA.
er Surveytion obtaineand Oregon
uch of a workforce progra
ipate in a wand earningis progress ohe participa
A Youth prog high schoo
e youth wereenrollment
d not have a
nt who comple
d Information
Turn tImpacevery reportWorkfThe stside covs. simanswewhethmakin
ed from Empn, and federa
rkforce partam? By com
workforce tras gains are don their ownant and the p
gram. Adminol completioe still enrollesince 2004.
a diploma or
eted at least on
Exchange Syst
to page 19 foct Study. Confour years, t
t adds extra kforce Trainin
tudy providecomparison omilar non-paering the quher the progng a differen
ployment al employm
icipant’s sucmparing progaining progrdue to n. This reseapublic receiv
nistrative on.6 Among ed in high There werer GED.
ne of the three
tem (SKIES)
for the Net onducted
this in-deptha value to 20ng Results. es a side-byof participan
articipants, uestion of gram is nce.
4
ent
ccess gram am,
arch ved
e also
e WIA
th 012
-nts

2012 Workforce Training Results Workforce Investment Act—Youth
5
Educational Status of WIA Youth Upon Leaving the Program
2004 2006 2008 2010 2011 2012
Obtained a High School Diploma 23% 38% 31% 31% 28% 30% Obtained a GED 13% 4% 10% 21% 28% 25% Still Enrolled in High School at Exit 25% 33% 24% 12% 6% 12% Not in School, no Diploma or GED 39% 26% 35% 35% 38% 33% Note: the "Not in School, no Diploma, or GED" data was missing for 2008. The percent that was missing was equivalent to the Drop-out percent obtained from another data element and was assumed to be valid for this category.
Source: WIA Standardized Record Data (WIASRD). Did Participants Have a Job and How Much Were They Paid? To find out about the participants’ post-program employment and earnings, participant records were matched with Employment Security Department wage files from Washington and neighboring states.8 The study looks at employment and earnings of participants who left the program during the most recent reporting year. Some 45 percent of all participants were employed. The employment rate remains the same when the 12 percent of the WIA Youth participants still enrolled in high school upon exiting the program were removed from consideration. Of those employed, 25 percent of participants were working full time. Were Participants Enrolled in Higher Education? When it comes to young people, a measure of success isn’t only employment but whether they continued with their education. As can be seen in the chart below, 56 percent of WIA Youth were either employed or enrolled in higher education.9
8 These files contain quarterly earnings and hours worked information on those individuals with employment reported for unemployment insurance (UI) benefits purposes (approximately 90 percent of in-state employment, with self-employment, active duty military, and those working for religious nonprofit organizations being the major groups of employers not included). 9 Higher education enrollment figures obtained from data matches with the State Board for Community and Technical Colleges and National Student Clearinghouse.

2012 Workforce Training Results Workforce Investment Act—Youth
6
Employment and Earnings for WIA Youth Participants, 2012
Performance Measure Results
Employment or Higher Education* 56%
Full Time Employed** 25%
Median Hours Worked Quarterly 306 hours
Median Hourly Wage*** $9.95
Median Annualized Earnings*** $11,784 * These figures apply to those with employment reported to state employment agencies six to nine months after leaving the program. Rate does not include self-employment, employment outside the Northwest or military service and thus understates total employment by approximately 10 percent. **Full-time employment averages 30 or more hours per week for those not enrolled in high school or higher education. ***Earnings/wages are for those not enrolled in high school or higher education and are expressed in first quarter 2011 dollars in order to account for inflation . Earnings of WIA Youth Participants To better gauge the financial effectiveness of Washington’s workforce programs, it helps to frame income levels. One common yardstick is the federal poverty level. In 2011, the federal poverty level for one person was $10,890 per year.10 In 2012, WIA Youth participants were able to support a median of one person at poverty level—meaning they could support themselves. They did not have enough earnings to support themselves, let alone others, at 200 percent of the poverty level (.5 people). Number of People Supported at Poverty Level by Participant Income
Performance Measure
2004 2006 2008 2010 2011 2012
Number of people supported at poverty level
0.8 people
0.9 people
0.9 people
1.0 people
1.0 people
1.0 people
Number of people supported at 200 percent poverty
0.4 people
0.5 people
0.5 people
0.5 people
0.5 people
0.5 people
10 Poverty levels from 2011 were used in this edition of Workforce Training Results to measure the results of workforce programs on participants observed in 2010-11. The federal poverty level is determined by the Department of Health and Human Services. The level varies according to family size. The number is adjusted for inflation and reported annually in the form of poverty guidelines. Public assistance programs typically define eligibility income limits as some percentage of the federal poverty level.
2012 Workforce Training Results Workforce Investment Act—Youth
7
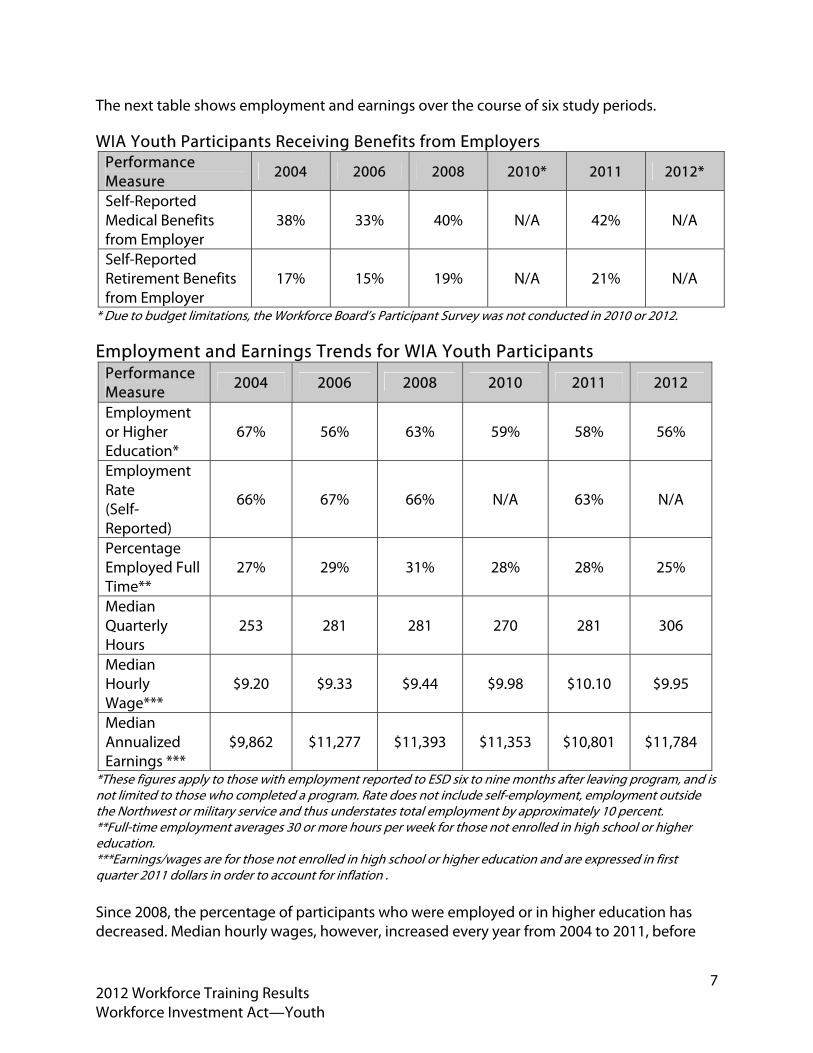
The next table shows employment and earnings over the course of six study periods.
WIA Youth Participants Receiving Benefits from Employers Performance Measure
2004 2006 2008 2010* 2011 2012*
Self-Reported Medical Benefits from Employer
38% 33% 40% N/A 42% N/A
Self-Reported Retirement Benefits from Employer
17% 15% 19% N/A 21% N/A
* Due to budget limitations, the Workforce Board’s Participant Survey was not conducted in 2010 or 2012.
Employment and Earnings Trends for WIA Youth Participants Performance Measure 2004 2006 2008 2010 2011 2012
Employment or Higher Education*
67% 56% 63% 59% 58% 56%
Employment Rate (Self-Reported)
66% 67% 66% N/A 63% N/A
Percentage Employed Full Time**
27% 29% 31% 28% 28% 25%
Median Quarterly Hours
253 281 281 270 281 306
Median Hourly Wage***
$9.20 $9.33 $9.44 $9.98 $10.10 $9.95
Median Annualized Earnings ***
$9,862 $11,277 $11,393 $11,353 $10,801 $11,784
*These figures apply to those with employment reported to ESD six to nine months after leaving program, and is not limited to those who completed a program. Rate does not include self-employment, employment outside the Northwest or military service and thus understates total employment by approximately 10 percent. **Full-time employment averages 30 or more hours per week for those not enrolled in high school or higher education. ***Earnings/wages are for those not enrolled in high school or higher education and are expressed in first quarter 2011 dollars in order to account for inflation . Since 2008, the percentage of participants who were employed or in higher education has decreased. Median hourly wages, however, increased every year from 2004 to 2011, before

2012 WoWorkforc
declining$10,801 Among t$9.85, anneed to bworkers,
Source: Wo
Source: Wo
11 Annual ehourly wagfirst quarte
0
20
40
60
80
Perc
ent E
mpl
oyed
Po
$3
$6
$9
$12
$15
Med
ian
Earn
ings
InflatioEducat
orkforce Traice Investme
g to $9.95 inin 2011.
those not ennd median abe considerand faced s
Workforce Train
Workforce Train
earnings are cage rates and ther 2011 dollars
67%
%
%
%
%
%
2004
WPercent of all por enrolled in
$9,
$0
3,000
6,000
9,000
2,000
5,000
2
on adjusted antion with repor
ning Resultsent Act—You
n 2012. Medi
nrolled in hignnualized eed within th
substantial b
ning Results 20
ning Results 20
alculated as thhe number of s.
%
4 20
WIA Youthparticipants whigher educat
862
004
nnualized earnirted employm
s uth
ian annualiz
gh school oearnings werhe proper cobarriers to su
004-12.
004-12.
hird quarter eahours worked
006
h Employmwith reported e
tion
2006
WIA ings to 2011 fi
ment in the third
zed earnings
r higher edure $10,569.1
ontext: theseuccess in the
rnings multiplin a calendar
2008
ment/Enroemployment in
2008
Youth Earfirst quarter dolrd quarter after
s increased t
ucation, the 1 These earne participane labor mark
lied by four. Qquarter. All wa
2010
ollment Rn the third qua
2010
rningsollars for those er exit from pro
to $11,784 i
median hounings levels ts were youket.
Quarterly earninages and earn
2011
Ratearter after exit f
2011
not in High Scogram.
in 2012 from
urly wage ware low, but
ung, entry-le
ngs are the resings are stated
56%
2012
from program
$11,784
2012
chool or in Hig
8
m
was t
evel
sult of d in
m
gher

2012 Workforce Training Results Workforce Investment Act—Youth
9
Wage rates among WIA Youth participants reflected less variation than programs serving adults. One-quarter of participations had median hourly wages above $11.11, while another quarter had wages below $9.12—slightly above the 2010 state minimum wage of $8.55. WIA Youth Participant Employment by Industry Employment among WIA Youth continues to be heavily concentrated in services and retail trade.
Source: Matches with Employment Security Department data in third quarter after exiting program. Industry groups based on North American Industry Classification System codes.
Quartile Hourly WageHighest Above $11.11
Third $9.88 – $11.10Second $9.13 - $9.87Lowest Below $9.12
Distribution of Hourly Wages of WIA Youth in the Third Quarter After Leaving Program
52.8% Services24.1% Retail Trade4.7% Manufacturing3.6% Natural Resources and Mining3.2% Construction3.0% Public Administration2.9% Financial Activities2.3% Wholesale Trade2.3% Transportation and Warehousing and Utilities1.1% Information
28.2% All Other Services13.7% Health Care7.2% Social Assistance3.7% Accommodation and Food Services
15.7% All Other Retail Trade4.8% Food & Beverage Stores3.6% Department Stores
Industry Group
Breakout of the Services Industry
Breakout of the Retail Trade Industry

2012 Workforce Training Results Workforce Investment Act—Youth
10
Wages and Employment Results Vary by Population Employment and earnings outcomes by gender, race/ethnicity, and disability status were less likely to be significant for WIA youth participants than for participants in other programs.12 Women were slightly more likely than men to be employed in the third quarter after program exit (48 percent compared to 43 percent), and also more likely to be employed full-time (31 percent versus 27 percent). Of those employed, women had median hourly wages ($10.01) that were 102 percent of men’s wages ($9.84), and median annualized earnings that were 111 percent of males ($12,213 compared to $11,096).
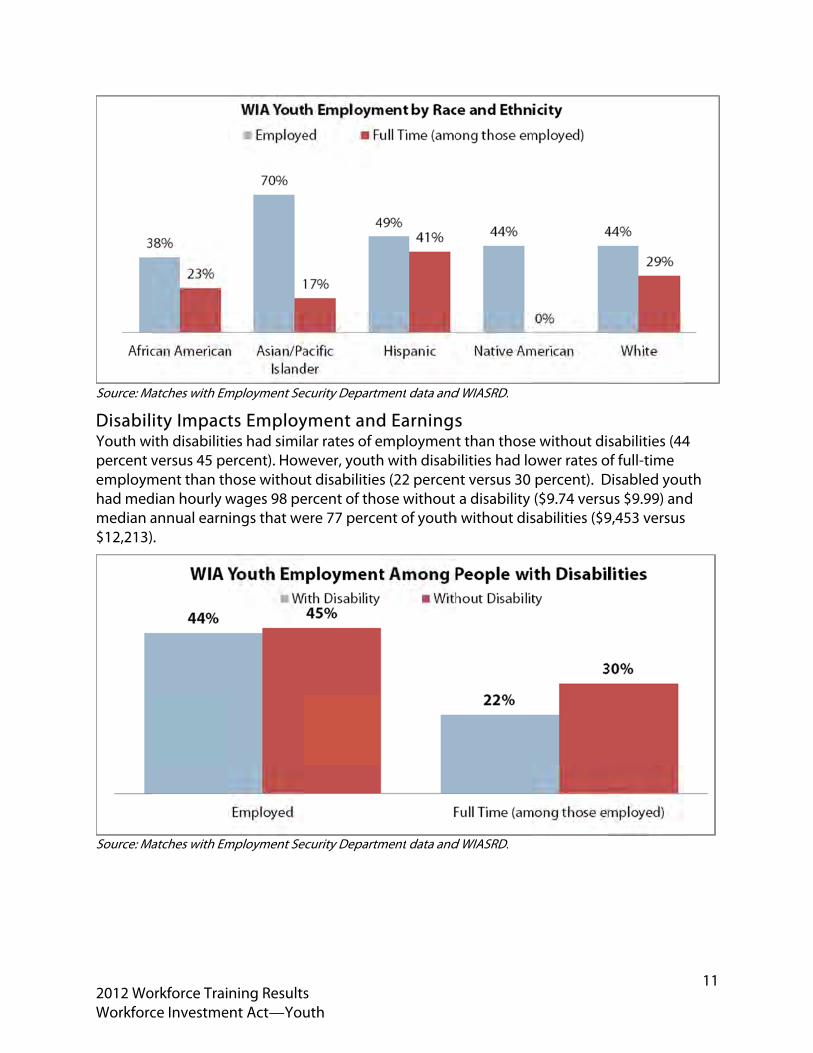
Source: Matches with Employment Security Department data and WIASRD. Race and Ethnicity Plays a Role Asian/Pacific Islanders had the highest employment rate (70 percent) among different race/ethnic groups. Hispanics followed with an employment rate of 49 percent. Whites and Native Americans had employment rates of 44 percent. African Americans had the lowest employment rate of 38 percent. Among those working, Hispanics had the highest rate of full-time employment (41percent), followed by whites (29 percent), African Americans (23 percent) and Asian/Pacific Islanders (17 percent). Hispanics had the highest median hourly wage at $10.29, followed closely by Native Americans at $10.08, whites at $9.98, and Asian/Pacific Islanders at $9.75. African Americans had the lowest median hourly wage at $9.63. There was more variation in the median annual earnings than there was with hourly wages. Hispanics earned the most, with median annual earnings of $13,900, followed by Asian/Pacific Islanders ($12,590), whites ($11,904), Native Americans ($11,840), and African Americans ($10,392).
12 These employment and earnings group comparisons were based on data from youth who were not in high school at exit.
43%
27%
48%
31%
Employed Full Time (among those employed)
WIA Youth Employment by Gender
Men Women
2012 WoWorkforc
Source: Ma
DisabilYouth wpercent vemploymhad medmedian a$12,213)
Source: Ma
orkforce Traice Investme
Matches with Em
ity Impactith disabilitiversus 45 pe
ment than thdian hourly wannual earn.
Matches with Em
ning Resultsent Act—You
mployment Se
ts Employes had similercent). Howhose withouwages 98 peings that we
mployment Se
s uth
ecurity Departm
yment andlar rates of e
wever, youthut disabilitiesercent of thoere 77 perce
ecurity Departm
ment data and
d Earningsemploymenth with disabs (22 percenose without ent of youth
ment data and
d WIASRD.
s t than those
bilities had lont versus 30
a disability h without dis
d WIASRD.
e without diower rates opercent). D($9.74 versu
sabilities ($9
sabilities (44of full-time Disabled youus $9.99) an9,453 versus
11
4
uth d
s

2012 Workforce Training Results Workforce Investment Act—Youth
12
Were Employers Satisfied with the Preparation Workers Received? The Workforce Board’s Employer Survey, administered during 2012, asked firms to evaluate new employees who had recently completed a WIA program. All three WIA Title I programs (Adult, Dislocated Worker, and Youth) were grouped together because there are relatively few participants in each category and employers would find it difficult to distinguish one from another. This section presents findings on employer satisfaction with new employees who completed any type of WIA program. Some 89 percent of employers said they were either “somewhat satisfied” or “very satisfied” with the overall work quality of these new employees. Employer satisfaction is broken down into three categories: Basic Skills, Job Skills and Work Place Skills. Basic skills refer to reading, writing, math, communication and computer skills. Job skills refer to skills specific to the job, as well as overall work quality and productivity. Work place skills refer to the skills necessary to get along in the workplace such as the ability to accept supervision, the ability to adapt to changes in duties and responsibilities, teamwork, customer service, problem solving or critical thinking skills, and having positive work habits and attitudes. In 2012, employers report highest overall satisfaction in the basic skills category with reading, and writing. For job skills, their highest overall satisfaction was with overall productivity. Among work place skills, employers were most satisfied with WIA participant’s adaptability.
Source: Workforce Board Employer Survey conducted in 2012.
44% 41% 46% 46% 46% 39% 48% 44% 52% 50% 40% 46% 45% 44%
42% 46% 42% 45% 46% 46%44% 45% 39% 39% 45% 44% 44% 37%
Com
pute
r
Com
mun
icat
ions
Mat
h
Read
ing
Writ
ing
Job-
Spec
ific
Skill
s
Ove
rall
Prod
uctiv
ityO
vera
llW
ork
Qua
lity
Ada
ptab
ility
Cust
omer
Serv
ice
Skill
s
Prob
lem
Sol
ving
Supe
rvis
ion
Team
wor
k
Wor
k H
abits
Basic Skills Job Skills Work Place Skills
Employers Very or Somewhat Satisfied With New Employees who Completed a WIA Program
Very Satisfied Somewhat Satisfied

2012 Workforce Training Results Workforce Investment Act—Youth
13
Overall, the levels of employer satisfaction reported in the Workforce Board’s 2012 Employer Survey are lower than on the previous survey, conducted in 2010. The following three charts show the overall satisfaction of employers with new employees who recently completed WIA program.
Source: Workforce Board’s biennial Employer Surveys from 2002 through 2012.
Source: Workforce Board’s biennial Employer Surveys from 2002 through 2012.
0%
20%
40%
60%
80%
100%
Communications Computer Math Reading Writing
Employer Satisfaction of WIA Participants with Basic Skills
2002 2004 2006 2008 2010 2012
0%
20%
40%
60%
80%
100%
Adaptability ProblemSolving
Supervision Teamwork Work Habits
Employer Satisfaction of WIA Participants with Work Place Skills
2002 2004 2006 2008 2010 2012

2012 Workforce Training Results Workforce Investment Act—Youth
14
Source: Workforce Board’s biennial Employer Surveys from 2002 through 2012.
Participant Survey In 2011, the Workforce Board surveyed WIA Youth participants who had left their program in 2009-10. The Participant Satisfaction Survey provided data on employment and documented how satisfied participants were with the training. The survey was conducted by telephone and was completed by 309 participants. Based on survey results, most WIA Youth participants entered the program for employment-related reasons: 85 percent enrolled to get work experience and 84 percent to learn skills for a new job. Some 82 percent also enrolled for personal improvement.
The majority of WIA Youth participants reported they received some type of training (60 percent). As in the previous study, the two most common types of training received were teamwork (76 percent among those who received training) and job-specific skills (74 percent among those who received training). This is an increase from the previous Participant Survey, when only 50 percent received teamwork training, and only 45 percent in job specific skills. Similar to the previous survey, fewer participants received training in basic skills like reading and English speaking.
0%
20%
40%
60%
80%
100%
Job Skills Productivity Work Quality
Employer Satisfaction of WIA Participants with Job Specific Skills
2002 2004 2006 2008 2010 2012

2012 WoWorkforc
Source: Wo
As in thetraining. in basic straining helped “participabut thostraining tpercent i
Source: Wo
orkforce Traice Investme
Workforce Board
e past, nearlyHigher perc
skills. The pehelped “a loa little” incre
ants who saie reporting that helpedin 2008 to 6
Workforce Board
ning Resultsent Act—You
d’s Participant
y all WIA Youcentages repercentage ofot” fell 10 peeased 11 ped job-specifit helped “a “a lot” was 1 percent in
d’s Participant
s uth
t Satisfaction S
uth participported “a lof WIA Youth
ercentage poercentage pofic skills train little” declincomputer s
n 2011.
t Satisfaction S
Survey 2011.
ants reportet” of improv
h participantoints. Howevoints. In a simning helpedned by the skills, which r
Survey 2011.
ed their skillvement in jots who repover, the percmilar fashion
d “a lot” incresame percenrose 17 perc
s improved ob-specific srted that thcentage than, the perceeased 7 percntage. Anotcentage poi
as a result okills than die diversity
at reported ientage of centage poiher increasents from 44
15
of d so
t
ints, e in

2012 WoWorkforc
Survey reservices tparticipathe same2008 (96was highadvice se
Source: WoMost of tpreviousjob openneeds mpercent i
13 Unmet nwhat was p
orkforce Traice Investme
esults reveathey receive
ants surveyee as in 2008.
6 percent verhest with proelecting the
Workforce Boardthe participas studies, panings, assistaet in these ain 2008 vs. 7
need refers to cprovided did n
ning Resultsent Act—You
led participaed as part ofed said they . Overall satirsus 93 percogram facilitprogram. S
d’s Participant ants who nerticipants saance with inareas. The g7 percent in
cases where thnot meet their
s uth
ants were qf their WIA Yhad met theisfaction wit
cent). When ties and cosatisfaction w
t Satisfaction Seeded suppoaid the servinterviewing,reatest unm2011).
he student rep needs.
uite satisfiedYouth prograeir educatioth the prograsked abou
st followed bwas lower th
Survey 2011. ort services wces most fre and job sea
met need13 re
ports that eithe
d with the tram. Some 9
onal objectivram was alsout specific prby times, lochis year with
while enrollequently neearch assistanemains job o
er they did not
raining and 93 percent oves in the pro higher tharogram featcations, equh career usef
led receivededed were ince. Most yoopening info
t receive the re
support f the ogram, abo
an reported ures, satisfaipment andfulness.
d them. As innformation
outh had theormation (1
equired servic
16
ut in ction
d
n on eir 0
e or

2012 WoWorkforc
Source: Wo
The percdeclinedassistancneed dro
Source: WoRelatioTo measemploym
1. H2. H3. A
orkforce Traice Investme
Workforce Board
centage of Wd since 2004.ce and careeopped from
Workforce Boardnship of Ture the exte
ment, we ask
How related How importaAre the skills
ning Resultsent Act—You
d’s Participant
WIA Youth pa. The largest
er or job cou8 percent to
d’s Participant Training toent to whichked particip
was the proant was the t
they learne
s uth
t Satisfaction S
articipants wt declines sinunseling. Theo 3 percent
t Satisfaction So Employ
h a participanants three q
ogram to thetraining in gd useful in t
Survey 2011.
who left thence the 200e percentagin each of th
Survey s 2004-1ment nt’s educatio
questions:
eir job? getting hiredtheir job?
eir program w8 Participan
ge of participhese catego
11.
on program
d?
with an unmnt Survey wepants indica
ories.
m and trainin
met need haere in financating an unm
ng related to
17
as cial met
o

2012 WoWorkforc
Asking aproduce not relat Among ptheir trai“somewhreportedindicated Participatheir jobrequiremit was “mindicated Most partheir jobsaid “mowere em When cowhether to both. Jthey rece
Source: Wo
orkforce Traice Investme
bout the relmore comped to their j
participants ning was “vhat related”
d their trainind the trainin
ants intervie. Of those p
ment,” anothmoderately imd their traini
rticipants sa. Some 40 p
oderately usemployed indi
ombining twthe skills acJust 6 perceeived was ne
Workforce Board
ning Resultsent Act—You
lationship bplete informob, but neve
employed sery related”to their job
ng was “veryng was “som
wed in 2011participants, her 28 percemportant.” Ning was “no
id the skills ercent of paeful,” and 17cated the sk
wo of the quecquired wereent of partici
neither helpf
d’s Participant
s uth
etween traiation. For exertheless fo
seven to nin” to their job. In 2008, a ly related” to
mewhat relat
1 also indica28 percent nt indicatedNine percent important
they learnedarticipants in7 percent “akills were “no
estions aboe helpful, a sipants empl
ful in their jo
t Satisfaction S
ning and emxample, somund the skil
ne months ab. A further 2
ower perceo their job (2ed” (35 perc
ated the traiindicated th
d it was “verynt said it was
at all” to ge
d in their trandicated the little usefulot useful at
ut the progrsmall percenoyed the th
ob nor relate
Survey 2011.
mployment me participa
ls acquired
fter leaving 25 percent rentage of em
27 percent), cent).
ning was heheir trainingy importants “a little hel
etting their j
aining progre skills werel.” Only 9 peall.”
ram’s relationtage of par
hird quarter ed to the job
in different ants said thewere useful
a program,eported the
mployed partwhile a high
elpful to theg was an “esst,” and 20 pelpful.” Only ob.
ram were use “very usefuercent of par
onship to thrticipants anafter exit sa
b they obtai
ways can eir training wl on the job.
35 percent e training waticipants her percent
m in gettingsential ercent repor13 percent
seful in doinul,” 32 percerticipants wh
e job and abnswer negatid the trainined.
18
was
said as
age
g
rted
ng nt ho
bout tively ng
2012 WoWorkforc
Net ImpEvery fouworkforcparticipamade a dconduct The net iResearchUpjohn sresults wcompareparticipawere selecareer ce The mosYouth prin 2008-0through ImpactParticipIn the nerate in ththan the participaemploymthan theoccupatiretraininwhen deeducatio
Similarlythe amo
orkforce Traice Investme
pact - Didur years the ce developmants. The netdifference inrigorous ne
impact analyh (Upjohn), astudies prog
with a controed to individate in any of ected from aenter system
t recent netrogram thro09, while the2008-09.
on Emplopants vs. Cext table, thehe short-term
rate of thosants who recment rate thir comparisoional skills trg, on-the-jo
elivered in coon.
y, the averagunts listed b
ning Resultsent Act—You
d the ProgWorkforce B
ment prograt impact par
n the participet impact ev
ysis was cona national legram participol group. Indduals who haf the programamong thos
m.
t impact anaough 2009. Te long-term
oyment anControl Gre WIA Youthm was 8 perse in the comceived trainiat was 13.1 on group. Trraining, skill
ob training, aombination
ge annualizebelow) than
s uth
ram MakeBoard condums. This detrt of this stupant’s succealuations of
nducted by teader in evalpants to see
dividuals whad similar dems includedse who regis
alyses examiThe short-ter impact (Pro
nd Earninroup
h participantcentage poi
mparison gring achievedpercentage
raining inclu upgrading and Adult Bawith career
ed earnings othose non-p
e a Differeucts net imptailed study dy attempts
ess. Washingf its workforc
the W.E. Upjuating train
e what resultho participatemographic
d in the studstered with W
ined experierm impact (
ogram Year 2
gs:
t employmeints higher oup. WIA d an
e points highuded and asic Educatir and technic
of WIA partiparticipants
ence in Papact and cos
compares ps to measuregton is the oce program
john Institutning programts they achieted in a WIAc characterisy. The compWorkSource
ences of parProgram Ye2005-06) wa
ent
her
on cal
cipants whos who were e
Theproimphoearincear
articipant st-benefit anparticipants e whether th
only state tos.
te for Emploms. To do theved and co
A Youth progstics, but whparison groue, Washingto
rticipants whear 2007-08)as observed
o found jobsemployed.
he WIA Title Iogram has p
mpacts on emours worked
rnings. Particreases lifetirnings.
Success nalyses of and non-
he program periodically
oyment he analysis, ompared thegram were ho did not up memberson’s one-sto
ho left the W was observ
d from 2006-
s is higher (b
I-B Youth positive net mployment, d and ticipation ime
19
m y
ese
s op
WIA ved -07
by

2012 Workforce Training Results Workforce Investment Act—Youth
20
WIA Youth All WIA Youth Participants Received Training
Short-term^ Long-term^ Short Term^ Long-term^
Net Employment Impact*
8 percentage points
4.3 percentage points
13.1 percentage points
4.5 percentage points
Net Hourly Wage Impact**
No significant positive impact
No significant positive impact
No significant positive impact
$1.13
Net Hours Employed per Quarter Impact
46.5 30.8
52.2 50.5
Net Annualized Earnings Impact**
$1,643 $1,963 $3,204 $4,473
^Short-term is 3 quarters after program exit; Long-term is average across 3 years since program exit. *Percentages listed are employment percentage points above those of the control group of non-participants. **Wages and earnings, expressed in first quarter 2011 dollars, represent the average difference between WIA Youth participants who got jobs and those in the control group who were employed.
The WIA Youth program serves young people with substantial barriers to success in school and employment. This affects the program's outcomes. After participation, 38 percent still did not possess a high school diploma or GED and were not enrolled in school. The median earnings of those working and not enrolled in education was $11,784.
These results may seem mild, but they should be viewed in the context of the population served. Comparing the results to demographically similar individuals who did not participate in a workforce development program, the study found a positive net impact of 4.5 percentage points on their rate of employment and a $1,963 net impact on annual earnings. Moreover, the net impact on annual earnings for those who received training was $4,473—a very strong result.
2012 Workforce Training Results Workforce Investment Act—Youth
21
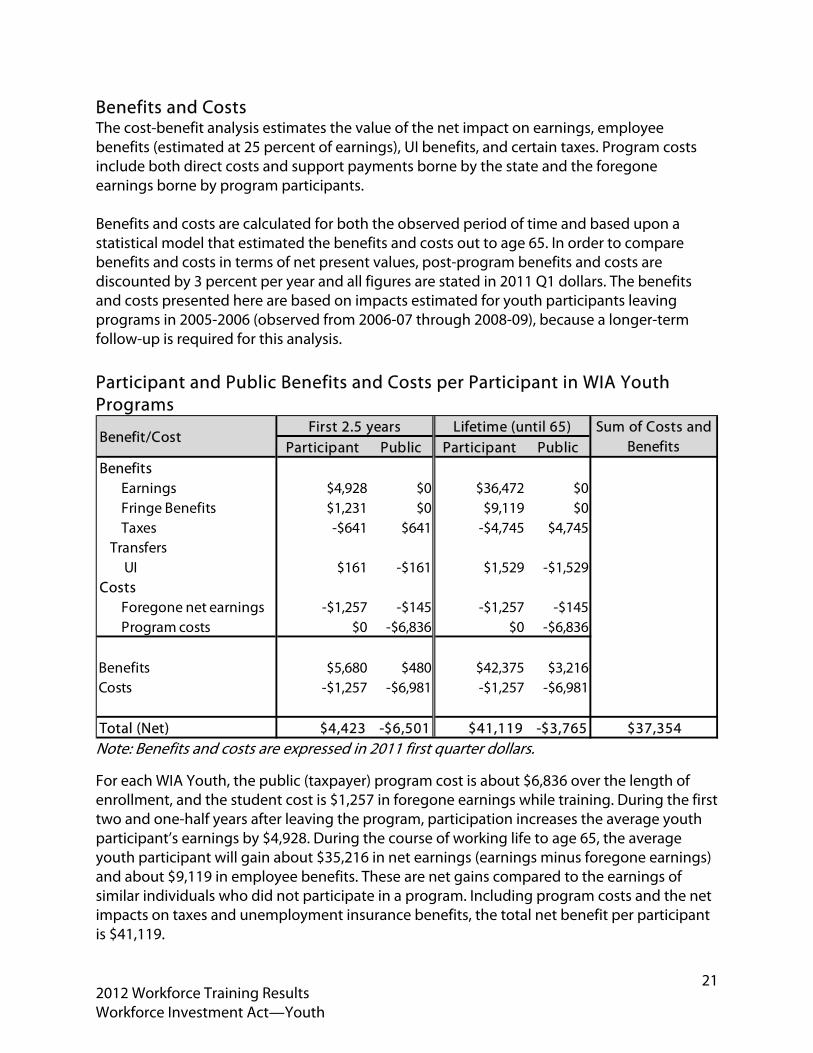
Benefits and Costs The cost-benefit analysis estimates the value of the net impact on earnings, employee benefits (estimated at 25 percent of earnings), UI benefits, and certain taxes. Program costs include both direct costs and support payments borne by the state and the foregone earnings borne by program participants. Benefits and costs are calculated for both the observed period of time and based upon a statistical model that estimated the benefits and costs out to age 65. In order to compare benefits and costs in terms of net present values, post-program benefits and costs are discounted by 3 percent per year and all figures are stated in 2011 Q1 dollars. The benefits and costs presented here are based on impacts estimated for youth participants leaving programs in 2005-2006 (observed from 2006-07 through 2008-09), because a longer-term follow-up is required for this analysis. Participant and Public Benefits and Costs per Participant in WIA Youth Programs
Note: Benefits and costs are expressed in 2011 first quarter dollars.
For each WIA Youth, the public (taxpayer) program cost is about $6,836 over the length of enrollment, and the student cost is $1,257 in foregone earnings while training. During the first two and one-half years after leaving the program, participation increases the average youth participant’s earnings by $4,928. During the course of working life to age 65, the average youth participant will gain about $35,216 in net earnings (earnings minus foregone earnings) and about $9,119 in employee benefits. These are net gains compared to the earnings of similar individuals who did not participate in a program. Including program costs and the net impacts on taxes and unemployment insurance benefits, the total net benefit per participant is $41,119.
Participant Public Participant PublicBenefits
Earnings $4,928 $0 $36,472 $0Fringe Benefits $1,231 $0 $9,119 $0Taxes -$641 $641 -$4,745 $4,745
Transfers UI $161 -$161 $1,529 -$1,529
CostsForegone net earnings -$1,257 -$145 -$1,257 -$145Program costs $0 -$6,836 $0 -$6,836
Benefits $5,680 $480 $42,375 $3,216Costs -$1,257 -$6,981 -$1,257 -$6,981
Total (Net) $4,423 -$6,501 $41,119 -$3,765 $37,354
Benefit/CostFirst 2.5 years Lifetime (until 65) Sum of Costs and
Benefits
2012 Workforce Training Results Workforce Investment Act—Youth
22
Projected participant benefits to age 65 outweigh public costs for the WIA Youth program by a ratio of $6 to 1, or $41,119to $6,836.
From the time of leaving the program to age 65, the public is expected to gain about $4, 745 per youth participant in net additional Social Security, Medicare, federal income, and state sales taxes. However, the public is expected to spend about $1,529 per youth participant in UI benefits. The estimated lifetime net cost to taxpayers is $3,765 per participant. Projected taxpayer net benefits to age 65 are less than public costs invested in WIA Youth services by a ratio of .47 to 1 or $3,216 to $6,836.