workers’ compensation data book 2002
TRANSCRIPT

STATE OF HAWAII DEPARTMENT OF LABOR AND INDUSTRIAL RELATIONS
RESEARCH AND STATISTICS OFFICE
WORKERS’ COMPENSATION
DATA BOOK 2002
STATE OF HAWAII LINDA LINGLE, GOVERNOR
DEPARTMENT OF LABOR AND INDUSTRIAL RELATIONS
NELSON B. BEFITEL, DIRECTOR COLLEEN Y. LaCLAIR, DEPUTY DIRECTOR
RESEARCH AND STATISTICS OFFICE
NAOMI HARADA, Chief Prepared by: OPERATIONS MANAGEMENT INFORMATION DAYLE KOBASHIGAWA, Supervisor In Cooperation with: DISABILITY COMPENSATION DIVISION GARY HAMADA, Administrator
WORKERS' COMPENSATION DATA BOOK
2002
INTRODUCTION
The WORKERS’ COMPENSATION DATA BOOK presents a summary of information on injuries and illnesses reported to the Disability Compensation Division of the State Department of Labor and Industrial Relations. This publication is available on the Internet at www.loihi.state.hi.us. The 2002 Workers’ Compensation Data Book is the first annual report that provides tabulations of reported cases and processed cases and cost based on the North American Industry Classification System 2002 (NAICS). Previous publications were tabulated based on the Standard Industrial Classification (SIC) industry coding system. Please call the following numbers for your inquiries: Data contained in this report – 586-9014 Copies of this report – 586-8999
TABLE OF CONTENTS
Highlights 2002................................................................................................... 3 2002 Hawaii Reported Injuries and Illnesses ..................................................... 4 2002 Reported Injuries and Illnesses: Frequency by Industry ........................... 5 2002 Hawaii Processed Cases and Cost ........................................................... 6 Average Cost by Part of Body ............................................................................ 7 2002 Hawaii Workers’ Compensation Statistics
Reported Cases: Part of Body Affected by Nature of Injury or Illness ........................................ 8 Type of Accident or Exposure by Source of Injury or Illness .......................... 8
Reported & Processed Cases, Cost, Days Lost: State ................................................................................................................ 9 Oahu.............................................................................................................. 12 Maui County .................................................................................................. 14 Hawaii County ............................................................................................... 16 Kauai County................................................................................................. 18
2002 Hawaii Reported Fatalities ...................................................................... 20 2002 Hearings and Decisions Issued............................................................... 21 Maximum Weekly Wage Base and Maximum Weekly Benefit Amount History ....................................................... 21 Digest of the Workers' Compensation Law ...................................................... 22 Definitions ........................................................................................................ 23 Technical Notes................................................................................................ 24

3
HIGHLIGHTS 2002
STATE OF HAWAII REPORTED CASES: 29,757
PROCESSED CASES WITH COST: 43,465 TOTAL COST: $267,827,254
COST PER CASE: $6,162 MEDICAL COST: $105,926,608
DAYS LOST: 1,277,863 REPORTED FATALITY: 31
Hawaii County
Reported Cases: 3,765 Processed Cases with Cost: 6,005
Total Cost: $40,715,619 Cost Per Case: $6,780
Medical Cost: $15,523,832 Days Lost: 208,099 Reported Fatality: 5
Kauai County
Reported Cases: 1,781 Processed Cases with Cost: 2,587
Total Cost: $11,145,177 Cost Per Case: $4,308
Medical Cost: $5,004,278 Days Lost: 60,207
Reported Fatality: 4
Oahu
Reported Cases: 19,667 Processed Cases with Cost: 28,273
Total Cost: $176,460,724 Cost Per Case: $6,241
Medical Cost: $69,278,123 Days Lost: 833,266
Reported Fatality: 18
Maui County
Reported Cases: 4,544 Processed Cases with Cost: 6,600
Total Cost: $39,505,734 Cost Per Case: $5,986
Medical Cost: $16,120,375 Days Lost: 176,291 Reported Fatality: 4

2002 HAWAII REPORTED INJURIES AND ILLNESSES
In 2002, reported cases decreased by 422 or 1.4% to 29,757. Employment increased by 1,006 to 527,823. Public administration had the largest number of reported cases at 5,237 followed by accommodation and food service with 4,663. Management of companies and enterprises had the largest percentage increase in reported cases going from 67 to 101 or 50.8 percent. They also had the largest employment increase of 9.7 percent from 2001. Arts, entertainment, and recreation had the largest percentage decrease in reported cases dropping 20.8 percent to 593 from 749 in 2001. Employment for this same industry decreased by only 1.4 percent from 2001.
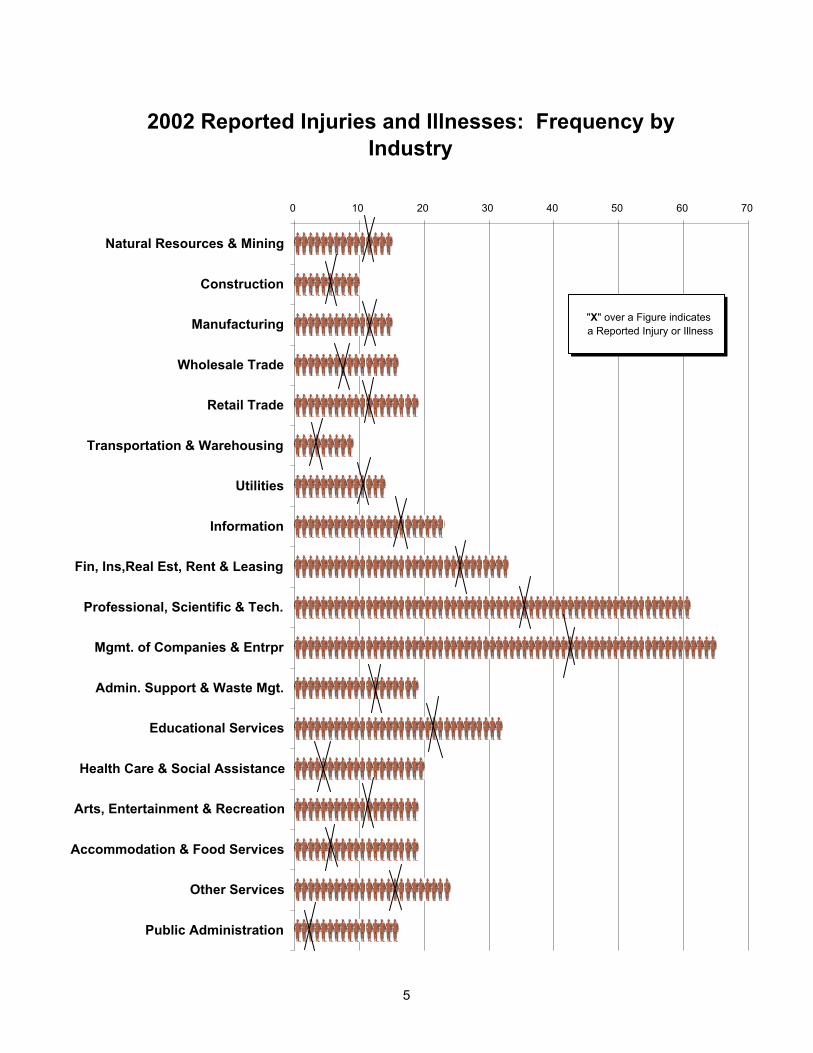
The frequency of injury or illness declined or remained the same in every industry except for manufacturing, transportation and warehousing, information, and management of companies and enterprises. Transportation and warehousing had the highest frequency with one reported injury or illness for every nine workers. Construction was next highest with a rate of one in ten. Management of companies and enterprises had the lowest frequency of cases with only one injury or illness for every 65 workers. The professional, scientific and technical services group had the next lowest frequency with one in 61.
Employment and Reported Cases by Industry for Hawaii
2001 2002 INDUSTRY
Employment Reported
Cases Frequency Employment Reported
Cases Frequency Goods Producing
Natural Resources & Mining 7,994 628 1 in 13 7,855 525 1 in 15
Construction 24,483 2,479 1 in 10 25,631 2,577 1 in 10
Manufacturing 16,459 989 1 in 17 15,240 1,037 1 in 15
Service Providing
Wholesale Trade 16,391 1,071 1 in 15 16,294 1,014 1 in 16
Retail Trade 66,357 3,494 1 in 19 64,255 3,422 1 in 19
Transportation & Warehousing 25,593 2,476 1 in 10 23,647 2,493 1 in 9
Utilities 2,668 235 1 in 11 2,698 190 1 in 14
Information 11,859 481 1 in 25 11,690 499 1 in 23
Finance, Insurance, Real Estate, Rent & Leasing 28,180 973 1 in 29 27,694 847 1 in 33
Professional, Scientific & Technical Services 21,093 441 1 in 48 21,822 356 1 in 61
Management of Companies & Enterprises 5,944 67 1 in 89 6,519 101 1 in 65
Administrative Support & Waste Management 36,605 1,963 1 in 19 38,810 2,020 1 in 19
Educational Services 10,474 385 1 in 27 10,914 346 1 in 32
Health Care & Social Assistance 49,726 2,475 1 in 20 50,865 2,549 1 in 20
Arts, Entertainment & Recreation 11,176 749 1 in 15 11,023 593 1 in 19
Accommodation & Food Services 87,951 4,756 1 in 18 86,444 4,663 1 in 19
Other Services 22,925 996 1 in 23 22,881 969 1 in 24
Public Administration 80,919 5,157 1 in 16 83,445 5,237 1 in 16
4
5
2002 Reported Injuries and Illnesses: Frequency by Industry
0 10 20 30 40 50 60 70
Natural Resources & Mining
Construction
Manufacturing
Wholesale Trade
Retail Trade
Transportation & Warehousing
Utilities
Information
Fin, Ins,Real Est, Rent & Leasing
Professional, Scientific & Tech.
Mgmt. of Companies & Entrpr
Admin. Support & Waste Mgt.
Educational Services
Health Care & Social Assistance
Arts, Entertainment & Recreation
Accommodation & Food Services
Other Services
Public Administration
"X" over a Figure indicates a Reported Injury or Illness
2002 HAWAII PROCESSED CASES AND COST
Permanent partial disability cost for 2002 totaled $65,159,217 or 24.3 percent of the total payments. This was 12.6 percent more than 2001’s total of $57,875,459. Cases also increased 10.1 percent from 3,904 to 4,297. The average permanent partial disability cost per case was $15,164 up 2.3 percent from last year’s $14,825.
Utilities had the highest average permanent partial disability cost per case at $20,665, followed by management of companies and enterprises at $17,280, and by administrative and support services and waste management at $16,694. Educational services had the lowest average permanent partial disability cost per case at $11,058. Accommodation and food services was next at $13,218, followed by professional, scientific, and technical services at $13,690, information services at $13,785, and natural resources and mining at $13,875.
Temporary total disability cost for 2002
totaled $65,056,903 or 24.3 percent of the total payments. This was 3.9 percent more than 2001’s total of $62,586,914. Cases also increased 2.3 percent from 14,910 to 15,246. The average temporary total disability cost per case was $4,267 up 1.6 percent from last year’s $4,198.
Total cost stood at $267.8 million, increasing 6.3 percent or $15.8 million over last year. Processed cases with cost decreased by 1.9 percent to 43,465 in 2002 from 44,285 in 2001.
In 2002, medical cost made up 39.5 percent of
the total Workers’ Compensation payments compared to 41 percent in 2001. Although the medical cost increased 2.5 percent to $105,926,606 in 2002, the number of cases with medical costs decreased by approximately 900 cases to 40,339. The average medical cost per case was $2,626 up 4.8 percent from last year’s figure of $2,505.
Manufacturing had the highest average medical
cost per case at $3,073 followed closely by construction at $3,033. Professional, scientific, and technical services was next at $2,948 with finance, insurance, real estate, rental and leasing right behind at $2,926 per case. Educational services had the lowest average medical cost per case at $1,952. Management of companies and enterprises was next at $2,224, followed by arts, entertainment and recreation at $2,228, and health care and social assistance at $2,264.
TOT Natu Con Man Who Reta Tran Utili Info Fin, Prof Mgm Adm Edu Hea Arts Acc Othe Pub OtheCost
2002 HAWAII TYPE OF
TEMPORARY TOTAL TEMPORARY PARTIAL PERMANENT TOTAL TOTAL COST DISABILITY DISABILITY DISABILITY
CASES COST CASES COST CASES COST AL $267,827,254 15,246 $65,056,903 1,688 $2,900,452 794 $18,395,265
ral Resources & Mining 4,927,570 271 919,315 27 44,380 27 422,553 struction 31,061,656 1,389 9,745,661 97 186,499 70 1,774,302 ufacturing 12,314,533 593 2,617,635 59 83,423 65 1,321,136 lesale Trade 8,489,023 522 1,902,675 47 60,430 6 229,539 il Trade 25,013,678 1,672 5,048,262 224 368,208 39 993,645 sportation & Warehousing 23,741,970 1,563 6,591,871 244 372,403 25 576,988
ties 2,520,058 81 470,759 6 15,860 9 219,838 rmation 4,671,856 218 1,245,351 23 34,870 23 516,941 Ins, Real Estate, Rent, & Leasing 8,081,656 390 1,512,286 48 80,266 15 574,183 , Scientific, & Technical Svcs 3,132,335 137 682,310 16 30,370 8 187,535 t of Companies & Enterprises 960,834 40 44,813 1 496 16 398,253 in Support, Waste Mgmt 16,121,354 1,100 4,211,211 103 134,143 5 78,943 cational Services 1,784,549 98 313,560 10 24,277 5 117,286 lth Care & Social Assistance 19,116,750 1,231 4,881,040 214 386,072 23 416,871 , Entertainment, & Recreation 3,968,142 295 870,633 21 17,730 3 61,514 ommodation and Food Services 28,369,559 2,326 6,663,507 239 381,501 20 369,620 r Services, except Public Admin 7,698,365 435 1,585,625 35 89,913 14 251,652
lic Administration 47,007,039 2,547 12,850,894 241 545,248 179 4,170,182 r 18,846,328 338 2,899,495 33 44,363 242 5,714,284
is rounded to the nearest whole dollar and may not add to total.
6
Construction had the highest average temporary total disability cost per case at $7,016, followed by utilities at $5,812, information services at $5,713, and public administration at $5,046. Management of companies and enterprises had the lowest average temporary total disability cost per case at $1,120. Accommodation and food services was next at $2,865, followed by arts, entertainment, and recreation at $2,951.
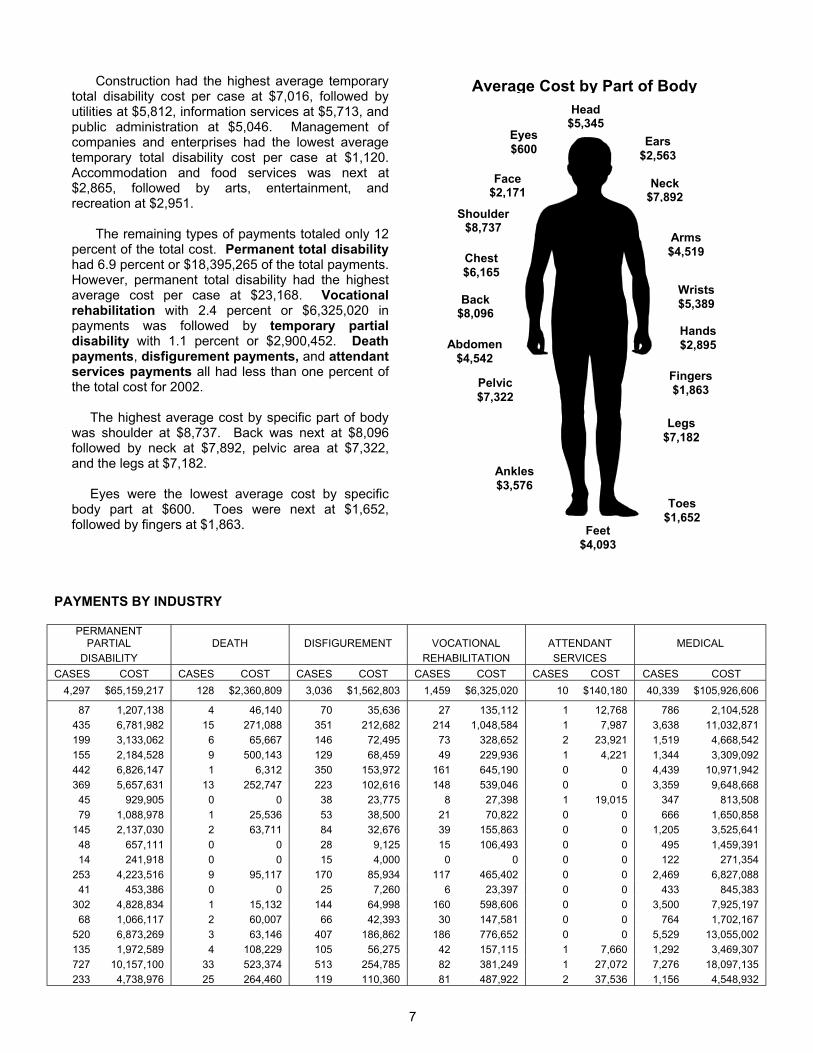
The remaining types of payments totaled only 12
percent of the total cost. Permanent total disability had 6.9 percent or $18,395,265 of the total payments. However, permanent total disability had the highest average cost per case at $23,168. Vocational rehabilitation with 2.4 percent or $6,325,020 in payments was followed by temporary partial disability with 1.1 percent or $2,900,452. Death payments, disfigurement payments, and attendant services payments all had less than one percent of the total cost for 2002. The highest average cost by specific part of body was shoulder at $8,737. Back was next at $8,096 followed by neck at $7,892, pelvic area at $7,322, and the legs at $7,182. Eyes were the lowest average cost by specific body part at $600. Toes were next at $1,652, followed by fingers at $1,863.
Ab$
PAYMENTS BY INDUSTRY
PERMANENT PARTIAL DEATH DISFIGUREMENT VOCAT
DISABILITY REHABILCASES COST CASES COST CASES COST CASES
4,297 $65,159,217 128 $2,360,809 3,036 $1,562,803 1,459
87 1,207,138 4 46,140 70 35,636 27 435 6,781,982 15 271,088 351 212,682 214 199 3,133,062 6 65,667 146 72,495 73 155 2,184,528 9 500,143 129 68,459 49 442 6,826,147 1 6,312 350 153,972 161 369 5,657,631 13 252,747 223 102,616 148
45 929,905 0 0 38 23,775 8 79 1,088,978 1 25,536 53 38,500 21
145 2,137,030 2 63,711 84 32,676 39 48 657,111 0 0 28 9,125 15 14 241,918 0 0 15 4,000 0
253 4,223,516 9 95,117 170 85,934 117 41 453,386 0 0 25 7,260 6
302 4,828,834 1 15,132 144 64,998 160 68 1,066,117 2 60,007 66 42,393 30
520 6,873,269 3 63,146 407 186,862 186 135 1,972,589 4 108,229 105 56,275 42 727 10,157,100 33 523,374 513 254,785 82 233 4,738,976 25 264,460 119 110,360 81
7
Average Cost by Part of Body
domen 4,542
Pelvic $7,322
Chest $6,165
Ankles $3,576
Eyes $600
IONAL ATTITATION SE
COST CASES$6,325,020 10
135,112 1,048,584
328,652 229,936 645,190 539,046
27,398 70,822
155,863 106,493
0 465,402
23,397 598,606 147,581 776,652 157,115 381,249 487,922
Head $5,345
Ears $2,563
Face $2,171
Arms $4,519
Wrists $5,389
Back$8,096
Feet $4,093
ENDANT RVICES COST $140,180
1 12,768 1 7,987 2 23,921 1 4,221 0 0 0 0 1 19,015 0 0 0 0 0 0 0 0 0 0 0 0 0 0 0 0 0 0 1 7,660 1 27,072 2 37,536
Neck $7,892
Shoulder $8,737
Toes $1,652
Legs $7,182
Hands $2,895
Fingers $1,863
MEDICAL CASES COST 40,339 $105,926,606
786 2,104,528 3,638 11,032,871 1,519 4,668,542 1,344 3,309,092 4,439 10,971,942 3,359 9,648,668
347 813,508 666 1,650,858
1,205 3,525,641 495 1,459,391 122 271,354
2,469 6,827,088 433 845,383
3,500 7,925,197 764 1,702,167
5,529 13,055,002 1,292 3,469,307 7,276 18,097,135 1,156 4,548,932

REPORTED CASES Part of Body Eyes
Head, Neck, Excl. Eyes
Trunk, Excl. Back
Back Fingers
Upper Extremity,
Excl. Fingers
Lower Extremity
Body System
Multiple Body Parts
Non-classi-fiable
NATURE OF INJURY/ILLNESS 29,757 1,295 1,945 2,842 4,951 3,868 4,839 5,205 1,317 3,326 169INJURIESDislocation 175 0 11 44 48 24 8 37 0 3 0Fracture 729 0 55 69 15 176 157 245 0 12 0Sprain, Strain 7,737 0 186 1,089 2,818 208 847 1,963 0 610 16Cut, Laceration 3,640 56 481 13 5 1,920 787 336 0 40 2Puncture, Excl. Bites 816 35 27 8 1 385 202 154 0 3 1Abrasions, Scratches 355 110 28 7 6 18 81 66 0 39 0Bruises, Contusions 2,067 29 214 259 85 243 347 632 0 252 6Burn (Chemical) 140 72 17 3 1 1 25 11 0 10 0Burn (Heat) 727 28 46 22 3 58 423 80 0 61 6Multiple Injuries 1,185 6 100 29 14 64 77 149 0 744 2Back Pain 1,689 0 0 0 1,689 0 0 0 0 0 0Hernia 88 0 0 88 0 0 0 0 0 0 0ILLNESSESSkin Disorders 202 0 12 7 1 14 98 6 0 61 3Viral Diseases 0 0 0 0 0 0 0 0 0 0 0Tumors, Cancer 8 0 2 4 0 0 0 0 1 1 0Symptoms 270 5 27 27 1 0 6 4 187 12 1Mental Disorders 466 0 0 0 0 0 0 0 466 0 0Circulatory System Disorder 46 0 11 24 1 0 0 0 9 0 1Hearing Loss Impairment 54 0 54 0 0 0 0 0 0 0 0Other Injuries/Illnesses 9,272 952 671 1,143 260 757 1,779 1,522 654 1,476 58NONCLASSIFIABLE 91 2 3 6 3 0 2 0 0 2 73
REPORTED CASES Accident
or Exposure
Struck By or Struck Against
Caught In, Under,
or Between
Rubbed or
AbradedFall Bodily
ReactionOver-
exertion
Contact With
Temp. Extremes
Contact With Harmful
Substances
Highway Motor
Vehicle Accidents
Other
SOURCE OF INJURY/ILLNESS 29,757 6,444 874 527 4,234 2,378 7,009 752 1,802 599 5,138Chemical, Chemical Product 722 0 0 0 0 0 0 21 691 0 10Containers 4,158 635 93 42 93 0 3,049 72 2 0 172Furniture, Fixtures 1,546 610 86 6 161 0 585 5 2 0 91Machinery 1,568 565 209 10 65 0 407 99 0 1 212Building Materials 775 380 30 14 31 0 224 4 0 0 92Vehicle, Mobile Equip. Parts 302 101 29 1 7 0 144 1 0 0 19Other Parts and Materials 854 505 31 7 18 0 169 21 2 0 101Plants, Animals, Minerals 1,549 215 16 4 42 0 113 213 658 0 288Person, Injured Worker 3,940 8 0 0 0 2,378 54 0 0 0 1,500Person, Other 1,646 85 12 1 4 0 653 0 88 0 803Floors, Walkways, Ground 3,632 50 2 4 3,518 0 5 0 0 0 53Structures, Other Surfaces 904 448 127 6 143 0 114 1 0 0 65Handtools (Nonpowered) 1,653 1,270 17 6 2 0 256 5 0 0 97Handtools (Powered) 416 207 11 6 5 0 115 10 0 0 62Other Tools, Instruments, Equipment 957 275 29 6 38 0 308 6 225 0 70
Highway Vehicle, Motorized 1,331 277 96 6 36 0 108 8 0 586 214Nonpowered Plant, Vehicles 581 192 45 0 20 0 303 0 0 0 21Other Vehicles 492 97 30 2 17 0 64 5 0 12 265Scrap, Waste, Debris 999 429 4 394 5 0 31 17 45 0 74Other Sources 1,732 95 7 12 29 0 307 264 89 0 929
2002 HAWAII WORKERS' COMPENSATION STATISTICS
PART OF BODY AFFECTED BY NATURE OF INJURY OR ILLNESS
TYPE OF ACCIDENT OR EXPOSURE BY SOURCE OF INJURY OR ILLNESS
8

STATEISLAND 29,757 100.0% 58,515 100.0% 43,465 100.0% $267,827,254 100.0% 1,277,863 100.0%Oahu 19,667 66.1 38,292 65.4 28,273 65.1 176,460,724 65.9 833,266 65.2East Hawaii 1,678 5.6 3,948 6.8 2,962 6.8 21,316,724 8.0 105,472 8.3West Hawaii 2,087 7.0 4,104 7.0 3,043 7.0 19,398,895 7.2 102,627 8.0Maui 4,268 14.3 8,271 14.1 6,164 14.2 37,315,910 13.9 164,844 12.9Molokai 145 0.5 293 0.5 229 0.5 1,185,562 0.4 6,955 0.5Lanai 131 0.4 250 0.4 207 0.5 1,004,263 0.4 4,492 0.4Kauai 1,781 6.0 3,357 5.7 2,587 6.0 11,145,177 4.2 60,207 4.7INDUSTRY 29,757 100.0% 58,515 100.0% 43,465 100.0% $267,827,254 100.0% 1,277,863 100.0%Natural Resources & Mining 525 1.8 1,064 1.8 849 2.0 4,927,570 1.8 21,725 1.7Construction 2,577 8.7 4,837 8.3 3,898 9.0 31,061,656 11.6 145,783 11.4Manufacturing 1,037 3.5 2,045 3.5 1,650 3.8 12,314,533 4.6 51,612 4.0Wholesale Trade 1,014 3.4 1,862 3.2 1,436 3.3 8,489,023 3.2 41,975 3.3Retail Trade 3,422 11.5 6,239 10.7 4,711 10.8 25,013,678 9.3 122,035 9.6Transportation & Warehousing 2,493 8.4 4,700 8.0 3,632 8.4 23,741,970 8.9 120,092 9.4Utilities 190 0.6 541 0.9 384 0.9 2,520,058 0.9 6,781 0.5Information 499 1.7 1,005 1.7 721 1.7 4,671,856 1.7 18,628 1.5Fin, Ins, Real Est, Rent, & Leasing 847 2.9 1,785 3.1 1,286 3.0 8,081,656 3.0 33,975 2.7Professional, Scientific, & Tech. 356 1.2 728 1.2 520 1.2 3,132,335 1.2 11,450 0.9Mgmt of Companies & Entrpr 101 0.3 190 0.3 139 0.3 960,834 0.4 1,212 0.1Administrative, Supoprt, & Waste 2,020 6.8 3,540 6.1 2,619 6.0 16,121,354 6.0 97,458 7.6Educational Services 346 1.2 618 1.1 449 1.0 1,784,549 0.7 6,356 0.5Health Care & Social Assistance 2,549 8.6 4,852 8.3 3,704 8.5 19,116,750 7.1 99,808 7.8Arts, Entertainment, & Recreation 593 2.0 1,072 1.8 822 1.9 3,968,142 1.5 20,478 1.6Accommodation and Food Services 4,663 15.7 7,992 13.7 5,948 13.7 28,369,559 10.6 155,747 12.2Other Svcs, except Public Adm 969 3.3 1,774 3.0 1,381 3.2 7,698,365 2.9 36,368 2.9Public Administration 5,237 17.6 11,798 20.2 7,899 18.2 47,007,039 17.6 235,269 18.4Other 319 1.1 1,873 3.2 1,417 3.3 18,846,328 7.0 51,111 4.0TYPE OF INSURANCE 29,757 100.0% 58,515 100.0% 43,465 100.0% $267,827,254 100.0% 1,277,863 100.0% Carrier 21,232 71.4 39,552 67.6 30,078 69.2 175,293,881 65.5 863,965 67.6 Self-Insured: Private & Captive 3,794 12.8 7,977 13.6 6,211 14.3 35,144,885 13.1 185,038 14.5 Self-Insured: Government 4,731 15.9 10,986 18.8 7,176 16.5 40,702,778 15.2 228,860 17.9 State of Hawaii 2,363 7.9 5,786 9.9 3,770 8.7 22,100,188 8.3 142,826 11.2 City & County of Honolulu 1,697 5.7 3,459 5.9 2,180 5.0 12,265,927 4.6 50,668 4.0 Hawaii County 255 0.9 803 1.4 534 1.2 3,318,914 1.2 20,978 1.6 Maui County 300 1.0 718 1.2 533 1.2 2,509,378 0.9 11,853 0.9 Kauai County 116 0.4 220 0.4 159 0.4 508,371 0.2 2,535 0.2 Special Compensation Fund INA -- INA -- INA -- 16,685,710 6.2 INA --OCCUPATION 29,757 100.0% 58,515 100.0% 43,465 100.0% $267,827,254 100.0% 1,277,863 100.0% Executive, Adm & Managerial 692 2.3 1,783 3.1 1,284 3.0 9,818,511 3.7 34,484 2.7 Professional Specialty 2,107 7.1 4,200 7.2 2,947 6.8 16,283,757 6.1 59,694 4.7 Technical Support 700 2.4 1,347 2.3 975 2.2 6,271,934 2.3 26,886 2.1 Sales 2,058 6.9 3,899 6.7 2,840 6.5 16,476,554 6.2 76,992 6.0 Administrative Support 2,459 8.3 5,085 8.7 3,543 8.2 18,002,452 6.7 85,179 6.7 Services 9,035 30.4 16,932 28.9 12,163 28.0 65,415,534 24.4 375,388 29.4 Agricultural, Forestry & Fishing 1,509 5.1 2,887 4.9 2,232 5.1 11,438,196 4.3 63,377 5.0 Mechanic, Repairer 1,655 5.6 3,381 5.8 2,616 6.0 17,738,989 6.6 69,624 5.5 Construction Trades 2,274 7.6 4,379 7.5 3,455 8.0 26,795,283 10.0 123,574 9.7 Precision Production 425 1.4 930 1.6 731 1.7 4,430,121 1.7 17,836 1.4 Operator, Fabricator, Inspector 651 2.2 1,226 2.1 969 2.2 5,912,845 2.2 23,418 1.8 Transportation, Material Moving 4,306 14.5 8,159 13.9 6,320 14.5 41,694,754 15.6 222,773 17.4 Handler, Helper, Laborer 1,726 5.8 3,436 5.9 2,720 6.3 17,958,498 6.7 89,238 7.0 Nonclassifiable 160 0.5 871 1.5 670 1.5 9,589,825 3.6 9,400 0.7SEX 29,757 100.0% 58,515 100.0% 43,465 100.0% $267,827,254 100.0% 1,277,863 100.0% Male 18,615 62.6 36,117 61.7 27,267 62.7 172,788,800 64.5 770,517 60.3 Female 11,142 37.4 22,397 38.3 16,198 37.3 95,038,454 35.5 507,346 39.7 Information Not Available 0 0.0 1 0.0 0 0.0 0 0.0 0 0.0
Notes: Cost and percent totals may not add due to rounding.
2002 HAWAII WORKERS' COMPENSATION STATISTICSREPORTED PROCESSED WITH COST COST DAYS LOST
9

STATEPART OF BODY 29,757 100.0% 58,515 100.0% 43,465 100.0% $267,827,254 100.0% 1,277,863 100.0% Ears 119 0.4 291 0.5 161 0.4 412,593 0.2 1,073 0.1 Face, Excl. Eyes, Ears 742 2.5 1,210 2.1 869 2.0 1,886,661 0.7 8,173 0.6 Eyes 1,295 4.4 1,876 3.2 1,397 3.2 838,443 0.3 2,232 0.2 Head, Excl. Ears, Face, Eyes 703 2.4 1,273 2.2 916 2.1 4,895,614 1.8 18,620 1.5 Neck 381 1.3 891 1.5 658 1.5 5,193,213 1.9 20,394 1.6 Trunk, Excl. Back 2,842 9.6 5,839 10.0 4,348 10.0 35,348,412 13.2 161,479 12.6 Back (Spine/Spinal Cord) 4,951 16.6 10,846 18.5 8,511 19.6 68,901,392 25.7 357,296 28.0 Arms 1,523 5.1 2,786 4.8 2,130 4.9 9,625,627 3.6 46,688 3.7 Wrists 1,215 4.1 2,577 4.4 1,879 4.3 10,125,997 3.8 58,008 4.5 Hands, Excl. Fingers 1,537 5.2 2,580 4.4 1,957 4.5 5,666,471 2.1 27,126 2.1 Fingers 3,868 13.0 6,161 10.5 4,716 10.9 8,784,276 3.3 35,247 2.8 Upper Extremities, Multiple 564 1.9 1,170 2.0 841 1.9 4,847,472 1.8 24,620 1.9 Legs 2,761 9.3 5,714 9.8 4,355 10.0 31,278,657 11.7 143,730 11.3 Ankles 1,178 4.0 1,959 3.4 1,520 3.5 5,435,671 2.0 33,032 2.6 Feet, Excl. Toes 744 2.5 1,317 2.3 984 2.3 4,027,650 1.5 24,576 1.9 Toes 299 1.0 485 0.8 363 0.8 599,569 0.2 3,883 0.3 Lower Extremities, Multiple 223 0.8 454 0.8 341 0.8 1,904,258 0.7 8,638 0.7 Body Systems 1,317 4.4 2,745 4.7 1,197 2.8 9,688,584 3.6 48,578 3.8 Multiple Body Parts 3,326 11.2 7,651 13.1 5,852 13.5 51,474,468 19.2 237,594 18.6 Nonclassifiable 169 0.6 690 1.2 470 1.1 6,892,224 2.6 16,876 1.3AVERAGE WEEKLY WAGE 29,757 100.0% 58,515 100.0% 43,465 100.0% $267,827,254 100.0% 1,277,863 100.0% $.01-$200 1,470 4.9 2,898 5.0 2,233 5.1 12,445,833 4.7 48,569 3.8 $200.01-$400 4,817 16.2 9,530 16.3 7,321 16.8 42,551,292 15.9 226,038 17.7 $400.01-$600 5,933 19.9 12,073 20.6 9,185 21.1 56,029,941 20.9 307,483 24.1 $600.01-$800 3,500 11.8 6,845 11.7 4,959 11.4 33,743,772 12.6 156,267 12.2 $800.01-$1000 1,936 6.5 3,789 6.5 2,742 6.3 20,579,613 7.7 89,187 7.0 Over $1000 1,750 5.9 3,266 5.6 2,434 5.6 15,835,820 5.9 58,812 4.6 Information Not Available 10,351 34.8 20,114 34.4 14,591 33.6 86,640,983 32.4 391,507 30.6SOURCE OF INJURY OR ILLNESS 29,757 100.0% 58,515 100.0% 43,465 100.0% $267,827,254 100.0% 1,277,863 100.0% Chemical, Chemical Product 722 2.4 1,124 1.9 718 1.7 1,297,280 0.5 3,839 0.3 Containers 4,158 14.0 8,208 14.0 6,452 14.8 39,673,350 14.8 209,047 16.4 Furniture, Fixtures 1,546 5.2 2,850 4.9 2,215 5.1 11,662,258 4.4 59,746 4.7 Machinery 1,568 5.3 2,922 5.0 2,280 5.3 12,880,257 4.8 59,296 4.6 Building Materials 775 2.6 1,498 2.6 1,219 2.8 8,696,876 3.3 38,676 3.0 Vehicle, Mobile Equipment Parts 302 1.0 588 1.0 473 1.1 2,638,409 1.0 14,550 1.1 Other Parts and Materials 854 2.9 1,512 2.6 1,181 2.7 5,028,856 1.9 23,384 1.8 Plants, Animals, Minerals 1,549 5.2 2,440 4.2 1,630 3.8 4,123,376 1.5 23,236 1.8 Person, Injured Worker 3,940 13.2 8,902 15.2 5,955 13.7 44,313,887 16.6 223,848 17.5 Person, Other than Injured Worker 1,646 5.5 3,190 5.5 2,237 5.2 13,614,754 5.1 77,340 6.1 Floors, Walkways, Ground 3,632 12.2 7,640 13.1 6,022 13.9 48,835,102 18.2 239,514 18.7 Structures, Other Surfaces 904 3.0 1,587 2.7 1,195 2.8 5,601,872 2.1 27,559 2.2 Handtools (Nonpowered) 1,653 5.6 2,783 4.8 2,139 4.9 5,498,484 2.1 23,996 1.9 Handtools (Powered) 416 1.4 733 1.3 586 1.4 2,710,119 1.0 13,031 1.0 Other Tools, Instruments, Equipment 957 3.2 1,695 2.9 1,273 2.9 5,384,222 2.0 27,011 2.1 Highway Vehicle, Motorized 1,331 4.5 3,135 5.4 2,384 5.5 20,130,629 7.5 80,356 6.3 Nonpowered Plant Vehicles 581 2.0 1,076 1.8 855 2.0 4,903,059 1.8 25,851 2.0 Other Vehicles 492 1.7 959 1.6 780 1.8 5,242,243 2.0 22,503 1.8 Scrap, Waste, Debris 999 3.4 1,478 2.5 1,102 2.5 1,360,704 0.5 5,266 0.4 Other Sources 1,732 5.8 4,195 7.2 2,769 6.4 24,231,517 9.1 79,814 6.3MARITAL STATUS 29,757 100.0% 58,515 100.0% 43,465 100.0% $267,827,254 100.0% 1,277,863 100.0% Married 14,804 49.8 30,240 51.7 22,760 52.4 151,071,397 56.4 685,257 53.6 Single 14,117 47.4 26,355 45.0 19,439 44.7 105,558,033 39.4 550,561 43.1 Information Not Available 836 2.8 1,920 3.3 1,266 2.9 11,197,824 4.2 42,045 3.3
Notes: Cost and percent totals may not add due to rounding.
2002 HAWAII WORKERS' COMPENSATION STATISTICSREPORTED PROCESSED WITH COST COST DAYS LOST
10

STATEEVENT OR EXPOSURE 29,757 100.0% 58,515 100.0% 43,465 100.0% $267,827,254 100.0% 1,277,863 100.0% Struck Against 2,028 6.8 3,296 5.6 2,522 5.8 6,646,666 2.5 30,156 2.4 Struck By 4,416 14.8 7,355 12.6 5,740 13.2 17,175,462 6.4 73,281 5.7 Caught In, Under, or Between 874 2.9 1,501 2.6 1,214 2.8 4,700,767 1.8 20,844 1.6 Rubbed or Abraded 527 1.8 845 1.4 639 1.5 782,854 0.3 3,843 0.3 Other Contact with Object, Equipment 904 3.0 1,314 2.3 1,000 2.3 1,562,675 0.6 6,135 0.5 Falls (From Elevation) 1,460 4.9 3,121 5.3 2,514 5.8 23,971,538 9.0 107,218 8.4 Falls (To Same Level) 2,580 8.7 5,317 9.1 4,136 9.5 29,694,883 11.1 155,503 12.2 Falls (Other) 194 0.7 421 0.7 334 0.8 2,492,748 0.9 10,537 0.8 Bodily Reaction 2,378 8.0 4,855 8.3 3,617 8.3 24,210,476 9.0 121,115 9.5 Overexertion 7,009 23.6 14,932 25.5 11,751 27.0 87,563,243 32.7 456,889 35.8 Repetitive Motion 1,041 3.5 2,471 4.2 1,610 3.7 10,674,352 4.0 61,643 4.8 Heart Attacks and Strokes 45 0.2 154 0.3 49 0.1 1,355,512 0.5 2,083 0.2 Contact (Electrical) 54 0.2 107 0.2 85 0.2 789,517 0.3 5,323 0.4 Contact (Temperature Extremes) 752 2.5 1,183 2.0 851 2.0 1,258,294 0.5 4,686 0.4 Exposure (Noise) 34 0.1 143 0.2 68 0.2 219,402 0.1 35 0.0 Exposure (Harmful Substance) 2,268 7.6 3,818 6.5 1,994 4.6 6,381,142 2.4 38,180 3.0 Accidents (Highway Vehicle) 599 2.0 1,635 2.8 1,211 2.8 11,757,238 4.4 45,545 3.6 Accidents (Non-Highway Vehicle) 218 0.7 479 0.8 403 0.9 3,402,702 1.3 15,999 1.3 Accidents (Other Transportation) 256 0.9 590 1.0 454 1.0 4,745,542 1.8 18,426 1.4 Explosions 27 0.1 54 0.1 40 0.1 141,975 0.1 54 0.0 Assaults, Violent Acts 1,180 4.0 2,144 3.7 1,456 3.4 7,683,163 2.9 40,266 3.2 Other Events/Exposures 254 0.9 674 1.2 462 1.1 4,401,964 1.6 13,791 1.1 Nonclassifiable 659 2.2 2,106 3.6 1,315 3.0 16,215,139 6.1 46,311 3.6NATURE OF INJURY OR ILLNESS 29,757 100.0% 58,515 100.0% 43,465 100.0% $267,827,254 100.0% 1,277,863 100.0% Dislocation 175 0.6 428 0.7 320 0.7 3,402,439 1.3 14,864 1.2 Fracture 729 2.5 1,741 3.0 1,409 3.2 14,464,951 5.4 61,607 4.8 Sprains, Strains 7,737 26.0 16,216 27.7 12,591 29.0 88,238,076 33.0 436,088 34.1 Amputation 39 0.1 106 0.2 95 0.2 1,279,624 0.5 4,265 0.3 Cut, Laceration 3,640 12.2 5,701 9.7 4,485 10.3 7,369,352 2.8 29,770 2.3 Puncture, Excl. Bites 816 2.7 1,225 2.1 908 2.1 876,633 0.3 3,244 0.3 Other Open Wounds 419 1.4 656 1.1 505 1.2 1,281,855 0.5 4,479 0.4 Abrasions, Scratches 355 1.2 599 1.0 457 1.1 1,179,837 0.4 5,511 0.4 Bruises, Contusions 2,067 7.0 3,622 6.2 2,702 6.2 10,958,362 4.1 55,112 4.3 Other Surface Wounds 771 2.6 1,098 1.9 824 1.9 949,726 0.4 3,803 0.3 Chemical Burns 140 0.5 206 0.4 156 0.4 175,264 0.1 817 0.1 Heat Burns 727 2.4 1,147 2.0 845 1.9 1,282,631 0.5 4,367 0.3 Concussion 37 0.1 103 0.2 80 0.2 683,580 0.3 3,816 0.3 Multiple Injuries 1,185 4.0 2,360 4.0 1,857 4.3 13,941,855 5.2 55,589 4.4 Electric Shock 44 0.2 77 0.1 60 0.1 510,300 0.2 3,609 0.3 Back Pain 1,689 5.7 3,544 6.1 2,762 6.4 21,269,061 7.9 126,241 9.9 Hearing Loss Impairment 54 0.2 185 0.3 90 0.2 349,138 0.1 812 0.1 Circulatory System Disorders 46 0.2 230 0.4 119 0.3 2,221,044 0.8 1,996 0.2 Hernia 88 0.3 161 0.3 110 0.3 444,500 0.2 3,567 0.3 Skin Disorders 202 0.7 343 0.6 219 0.5 452,790 0.2 2,128 0.2 Other Sys Disease, Disorder 575 1.9 1,377 2.4 856 2.0 5,483,557 2.1 31,101 2.4 Infectious and Parasitic Diseases 93 0.3 151 0.3 70 0.2 127,758 0.1 1,100 0.1 Symptoms 270 0.9 496 0.9 192 0.4 922,391 0.3 3,198 0.3 Mental Disorders 466 1.6 1,265 2.2 504 1.2 6,315,235 2.4 37,484 2.9 Exposure 307 1.0 387 0.7 84 0.2 60,604 0.0 602 0.1 Other Injuries/Illnesses 6,995 23.5 14,082 24.1 10,397 23.9 71,297,593 26.6 364,140 28.5 Nonclassifiable 91 0.3 1,009 1.7 768 1.8 12,289,097 4.6 18,553 1.5AGE 29,757 100.0% 58,515 100.0% 43,465 100.0% $267,827,254 100.0% 1,277,863 100.0% Under 18 179 0.6 273 0.5 204 0.5 337,812 0.1 1,785 0.1 18-24 3,623 12.2 5,858 10.0 4,342 10.0 11,384,086 4.3 62,885 4.9 25-34 7,057 23.7 13,148 22.5 9,775 22.5 52,076,336 19.4 255,023 20.0 35-44 8,116 27.3 16,965 29.0 12,758 29.4 88,764,518 33.1 440,340 34.5 45-54 6,942 23.3 14,413 24.6 10,544 24.3 74,015,573 27.6 335,797 26.3 55-64 3,079 10.4 6,340 10.8 4,751 10.9 33,594,865 12.5 150,210 11.8 Over 64 556 1.9 1,053 1.8 799 1.8 4,859,936 1.8 22,435 1.8 Information Not Available 205 0.7 465 0.8 292 0.7 2,794,128 1.0 9,388 0.7
Notes: Cost and percent totals may not add due to rounding.
2002 HAWAII WORKERS' COMPENSATION STATISTICSREPORTED PROCESSED WITH COST COST DAYS LOST
11
OAHUINDUSTRY 19,667 100.0% 38,292 100.0% 28,273 100.0% $176,460,724 100.0% 833,266 100.0%Natural Resources & Mining 179 0.9 362 1.0 304 1.1 2,097,320 1.2 8,932 1.1Construction 1,543 7.9 2,974 7.8 2,440 8.6 19,628,505 11.1 90,349 10.8Manufacturing 817 4.2 1,540 4.0 1,237 4.4 9,303,385 5.3 42,087 5.1Wholesale Trade 747 3.8 1,402 3.7 1,072 3.8 6,569,670 3.7 31,030 3.7Retail Trade 2,246 11.4 4,142 10.8 3,102 11.0 16,623,611 9.4 78,226 9.4Transportation & Warehousing 1,908 9.7 3,622 9.5 2,780 9.8 18,069,430 10.2 93,934 11.3Utilities 116 0.6 325 0.9 257 0.9 1,650,593 0.9 4,386 0.5Information 412 2.1 815 2.1 580 2.1 3,895,045 2.2 16,238 2.0Fin, Ins, Real Est, Rent, & Leasing 553 2.8 1,149 3.0 828 2.9 4,864,466 2.8 18,762 2.3Professional, Scientific, & Tech. 248 1.3 488 1.3 349 1.2 2,075,278 1.2 6,118 0.7Mgmt of Companies & Entrpr 66 0.3 119 0.3 76 0.3 574,818 0.3 815 0.1Administrative, Supoprt, & Waste 1,346 6.8 2,342 6.1 1,731 6.1 10,885,338 6.2 63,278 7.6Educational Services 286 1.5 522 1.4 381 1.4 1,505,268 0.9 5,399 0.7Health Care & Social Assistance 1,987 10.1 3,732 9.8 2,848 10.1 14,769,406 8.4 81,021 9.7Arts, Entertainment, & Recreation 329 1.7 592 1.6 445 1.6 2,239,434 1.3 9,930 1.2Accommodation and Food Services 2,455 12.5 4,240 11.1 3,054 10.8 14,989,117 8.5 86,875 10.4Other Svcs, except Public Adm 723 3.7 1,290 3.4 1,005 3.6 5,609,300 3.2 27,113 3.3Public Administration 3,476 17.7 7,463 19.5 4,889 17.3 29,378,191 16.7 137,377 16.5Other 230 1.2 1,173 3.1 895 3.2 11,732,549 6.7 31,396 3.8PART OF BODY 19,667 100.0% 38,292 100.0% 28,273 100.0% $176,460,724 100.0% 833,266 100.0% Ears 85 0.4 200 0.5 110 0.4 285,142 0.2 1,000 0.1 Face, Excl. Eyes, Ears 512 2.6 839 2.2 595 2.1 1,300,542 0.7 6,061 0.7 Eyes 818 4.2 1,199 3.1 902 3.2 618,074 0.4 1,387 0.2 Head, Excl. Ears, Face, Eyes 493 2.5 865 2.3 615 2.2 2,784,884 1.6 11,003 1.3 Neck 261 1.3 583 1.5 432 1.5 3,551,458 2.0 14,327 1.7 Trunk, Excl. Back 1,809 9.2 3,715 9.7 2,768 9.8 22,960,661 13.0 100,785 12.1 Back (Spine/Spinal Cord) 3,206 16.3 6,850 17.9 5,398 19.1 44,741,232 25.4 225,641 27.1 Arms 1,033 5.3 1,830 4.8 1,396 4.9 6,046,167 3.4 29,698 3.6 Wrists 818 4.2 1,742 4.6 1,254 4.4 6,776,537 3.8 36,998 4.4 Hands, Excl. Fingers 1,006 5.1 1,706 4.5 1,300 4.6 3,974,519 2.3 19,375 2.3 Fingers 2,641 13.4 4,141 10.8 3,159 11.2 6,148,003 3.5 25,775 3.1 Upper Extremities, Multiple 380 1.9 813 2.1 568 2.0 3,415,965 1.9 17,444 2.1 Legs 1,817 9.2 3,792 9.9 2,872 10.2 22,019,430 12.5 102,505 12.3 Ankles 737 3.8 1,211 3.2 937 3.3 3,409,904 1.9 20,397 2.5 Feet, Excl. Toes 496 2.5 868 2.3 635 2.3 2,572,418 1.5 14,706 1.8 Toes 203 1.0 330 0.9 242 0.9 474,039 0.3 3,098 0.4 Lower Extremities, Multiple 151 0.8 314 0.8 238 0.8 1,309,052 0.7 5,822 0.7 Body Systems 886 4.5 1,792 4.7 711 2.5 6,372,839 3.6 32,315 3.9 Multiple Body Parts 2,179 11.1 4,961 13.0 3,772 13.3 32,318,293 18.3 149,727 18.0 Nonclassifiable 136 0.7 541 1.4 369 1.3 5,381,564 3.1 15,202 1.8SOURCE OF INJURY OR ILLNESS 19,667 100.0% 38,292 100.0% 28,273 100.0% $176,460,724 100.0% 833,266 100.0% Chemical, Chemical Product 454 2.3 696 1.8 426 1.5 895,622 0.5 2,229 0.3 Containers 2,765 14.1 5,345 14.0 4,199 14.9 25,836,938 14.6 136,882 16.4 Furniture, Fixtures 1,014 5.2 1,851 4.8 1,415 5.0 7,359,268 4.2 36,166 4.3 Machinery 1,043 5.3 1,905 5.0 1,510 5.3 8,661,994 4.9 39,358 4.7 Building Materials 507 2.6 982 2.6 809 2.9 5,592,902 3.2 24,592 3.0 Vehicle, Mobile Equipment Parts 204 1.0 377 1.0 306 1.1 1,744,424 1.0 8,561 1.0 Other Parts and Materials 570 2.9 1,004 2.6 789 2.8 3,269,947 1.9 15,968 1.9 Plants, Animals, Minerals 926 4.7 1,427 3.7 893 3.2 2,175,680 1.2 12,783 1.5 Person, Injured Worker 2,568 13.1 5,856 15.3 3,893 13.8 30,238,799 17.1 148,325 17.8 Person, Other than Injured Worker 1,215 6.2 2,246 5.9 1,567 5.5 9,432,711 5.4 54,289 6.5 Floors, Walkways, Ground 2,324 11.8 4,902 12.8 3,858 13.7 31,938,365 18.1 157,404 18.9 Structures, Other Surfaces 618 3.1 1,048 2.7 786 2.8 3,509,870 2.0 16,676 2.0 Handtools (Nonpowered) 1,046 5.3 1,708 4.5 1,289 4.6 3,375,654 1.9 15,144 1.8 Handtools (Powered) 270 1.4 458 1.2 359 1.3 1,323,506 0.8 6,466 0.8 Other Tools, Instruments, Equipment 673 3.4 1,179 3.1 869 3.1 3,828,788 2.2 18,363 2.2 Highway Vehicle, Motorized 906 4.6 2,098 5.5 1,611 5.7 13,004,290 7.4 53,007 6.4 Nonpowered Plant Vehicles 395 2.0 758 2.0 601 2.1 3,680,461 2.1 18,552 2.2 Other Vehicles 356 1.8 680 1.8 545 1.9 3,548,620 2.0 13,848 1.7 Scrap, Waste, Debris 636 3.2 935 2.4 690 2.4 865,603 0.5 3,548 0.4 Other Sources 1,177 6.0 2,837 7.4 1,858 6.6 16,177,282 9.2 51,105 6.1 Notes: Cost and percent totals may not add due to rounding.
2002 HAWAII WORKERS' COMPENSATION STATISTICSREPORTED PROCESSED WITH COST COST DAYS LOST
12
OAHUOCCUPATION 19,667 100.0% 38,292 100.0% 28,273 100.0% $176,460,724 100.0% 833,266 100.0% Executive, Adm & Managerial 483 2.5 1,236 3.2 882 3.1 6,439,189 3.7 23,078 2.8 Professional Specialty 1,521 7.7 2,953 7.7 2,079 7.4 11,104,849 6.3 40,021 4.8 Technical Support 472 2.4 909 2.4 663 2.3 4,110,705 2.3 19,012 2.3 Sales 1,323 6.7 2,579 6.7 1,854 6.6 11,442,238 6.5 51,641 6.2 Administrative Support 1,664 8.5 3,492 9.1 2,428 8.6 12,577,295 7.1 56,725 6.8 Services 5,866 29.8 10,760 28.1 7,558 26.7 41,365,420 23.4 240,663 28.9 Agricultural, Forestry & Fishing 730 3.7 1,373 3.6 1,045 3.7 5,638,660 3.2 31,378 3.8 Mechanic, Repairer 1,131 5.8 2,268 5.9 1,755 6.2 12,230,157 6.9 47,854 5.7 Construction Trades 1,485 7.6 2,842 7.4 2,274 8.0 17,192,914 9.7 76,574 9.2 Precision Production 306 1.6 617 1.6 479 1.7 2,745,792 1.6 10,808 1.3 Operator, Fabricator, Inspector 454 2.3 842 2.2 668 2.4 3,853,790 2.2 16,764 2.0 Transportation, Material Moving 2,939 14.9 5,519 14.4 4,303 15.2 29,267,579 16.6 153,771 18.5 Handler, Helper, Laborer 1,189 6.1 2,319 6.1 1,829 6.5 11,940,022 6.8 59,268 7.1 Nonclassifiable 104 0.5 583 1.5 456 1.6 6,552,114 3.7 5,709 0.7NATURE OF INJURY OR ILLNESS 19,667 100.0% 38,292 100.0% 28,273 100.0% $176,460,724 100.0% 833,266 100.0% Dislocation 103 0.5 273 0.7 209 0.7 2,346,620 1.3 10,393 1.3 Fracture 471 2.4 1,131 3.0 909 3.2 8,873,106 5.0 35,640 4.3 Sprains, Strains 5,066 25.8 10,448 27.3 8,075 28.6 58,004,797 32.9 280,015 33.6 Amputation 26 0.1 65 0.2 58 0.2 794,501 0.5 3,051 0.4 Cut, Laceration 2,393 12.2 3,708 9.7 2,894 10.2 4,862,979 2.8 19,288 2.3 Puncture, Excl. Bites 548 2.8 813 2.1 609 2.2 583,349 0.3 2,334 0.3 Other Open Wounds 262 1.3 423 1.1 318 1.1 954,099 0.5 3,661 0.4 Abrasions, Scratches 229 1.2 395 1.0 296 1.1 694,120 0.4 3,149 0.4 Bruises, Contusions 1,375 7.0 2,341 6.1 1,736 6.1 6,974,607 4.0 35,869 4.3 Other Surface Wounds 494 2.5 705 1.8 529 1.9 579,962 0.3 2,655 0.3 Chemical Burns 85 0.4 126 0.3 100 0.4 125,827 0.1 256 0.0 Heat Burns 481 2.5 752 2.0 551 2.0 726,323 0.4 3,088 0.4 Concussion 27 0.1 72 0.2 56 0.2 410,868 0.2 1,900 0.2 Multiple Injuries 768 3.9 1,542 4.0 1,203 4.3 8,641,895 4.9 34,406 4.1 Electric Shock 28 0.1 49 0.1 37 0.1 339,757 0.2 2,404 0.3 Back Pain 1,090 5.5 2,250 5.9 1,755 6.2 13,622,733 7.7 79,819 9.6 Hearing Loss Impairment 42 0.2 131 0.3 60 0.2 230,127 0.1 757 0.1 Circulatory System Disorders 28 0.1 145 0.4 76 0.3 1,412,651 0.8 1,494 0.2 Hernia 51 0.3 103 0.3 74 0.3 319,150 0.2 2,715 0.3 Skin Disorders 115 0.6 196 0.5 124 0.4 312,026 0.2 1,093 0.1 Other Sys Disease, Disorder 418 2.1 971 2.5 608 2.2 3,680,848 2.1 20,268 2.4 Infectious and Parasitic Diseases 61 0.3 103 0.3 49 0.2 65,544 0.0 756 0.1 Symptoms 203 1.0 345 0.9 129 0.5 654,084 0.4 1,808 0.2 Mental Disorders 272 1.4 805 2.1 317 1.1 4,161,578 2.4 25,377 3.1 Exposure 266 1.4 321 0.8 56 0.2 18,678 0.0 27 0.0 Other Injuries/Illnesses 4,696 23.9 9,345 24.4 6,891 24.4 48,046,035 27.2 246,792 29.6 Nonclassifiable 69 0.4 734 1.9 554 2.0 9,024,462 5.1 14,251 1.7EVENT OR EXPOSURE 19,667 100.0% 38,292 100.0% 28,273 100.0% $176,460,724 100.0% 833,266 100.0% Struck Against 1,372 7.0 2,190 5.7 1,660 5.9 4,503,694 2.6 19,698 2.4 Struck By 2,943 15.0 4,824 12.6 3,730 13.2 10,622,919 6.0 45,218 5.4 Caught In, Under, or Between 575 2.9 975 2.6 798 2.8 3,345,286 1.9 15,340 1.8 Rubbed or Abraded 377 1.9 581 1.5 431 1.5 538,845 0.3 2,591 0.3 Oth Contact with Object, Eqmnt 590 3.0 866 2.3 656 2.3 1,027,467 0.6 3,753 0.5 Falls (From Elevation) 962 4.9 2,030 5.3 1,646 5.8 15,752,653 8.9 73,810 8.9 Falls (To Same Level) 1,629 8.3 3,366 8.8 2,594 9.2 19,329,744 11.0 99,908 12.0 Falls (Other) 135 0.7 299 0.8 239 0.9 1,806,734 1.0 7,454 0.9 Bodily Reaction 1,536 7.8 3,167 8.3 2,354 8.3 17,174,240 9.7 81,489 9.8 Overexertion 4,595 23.4 9,625 25.1 7,580 26.8 56,999,047 32.3 291,625 35.0 Repetitive Motion 729 3.7 1,732 4.5 1,104 3.9 7,224,285 4.1 41,914 5.0 Heart Attacks and Strokes 27 0.1 99 0.3 34 0.1 903,396 0.5 1,510 0.2 Contact (Electrical) 35 0.2 70 0.2 54 0.2 555,351 0.3 3,929 0.5 Contact (Temperature Extremes) 497 2.5 772 2.0 553 2.0 721,023 0.4 3,443 0.4 Exposure (Noise) 27 0.1 103 0.3 48 0.2 120,709 0.1 4 0.0 Exposure (Harmful Substance) 1,480 7.5 2,472 6.5 1,223 4.3 4,260,770 2.4 24,335 2.9 Accidents (Highway Vehicle) 403 2.1 1,093 2.9 824 2.9 7,297,654 4.1 28,019 3.4 Accidents (Non-Highway Vehicle) 131 0.7 269 0.7 227 0.8 2,108,013 1.2 9,625 1.2 Accidents (Other Transportation) 187 1.0 406 1.1 320 1.1 3,070,441 1.7 12,900 1.6 Explosions 19 0.1 37 0.1 27 0.1 113,938 0.1 17 0.0 Assaults, Violent Acts 805 4.1 1,457 3.8 984 3.5 5,455,213 3.1 28,382 3.4 Other Events/Exposures 162 0.8 425 1.1 289 1.0 2,764,454 1.6 9,643 1.2 Nonclassifiable 451 2.3 1,434 3.7 898 3.2 10,764,849 6.1 28,659 3.4 Notes: Cost and percent totals may not add due to rounding.
2002 HAWAII WORKERS' COMPENSATION STATISTICSREPORTED PROCESSED WITH COST COST DAYS LOST
13

MAUI COUNTYINDUSTRY 4,544 100.0% 8,814 100.0% 6,600 100.0% $39,505,734 100.0% 176,291 100.0%Natural Resources & Mining 155 3.4 300 3.4 219 3.3 1,228,366 3.1 4,438 2.5Construction 422 9.3 765 8.7 586 8.9 4,712,798 11.9 21,189 12.0Manufacturing 75 1.7 188 2.1 146 2.2 958,998 2.4 3,137 1.8Wholesale Trade 102 2.2 179 2.0 142 2.2 852,768 2.2 4,816 2.7Retail Trade 504 11.1 880 10.0 657 10.0 3,314,188 8.4 15,625 8.9Transportation & Warehousing 305 6.7 541 6.1 430 6.5 2,675,020 6.8 10,031 5.7Utilities 37 0.8 98 1.1 61 0.9 400,952 1.0 867 0.5Information 40 0.9 76 0.9 54 0.8 272,111 0.7 1,276 0.7Fin, Ins, Real Est, Rent, & Leasing 125 2.8 294 3.3 214 3.2 1,568,162 4.0 6,876 3.9Professional, Scientific, & Tech. 39 0.9 117 1.3 82 1.2 709,904 1.8 3,363 1.9Mgmt of Companies & Entrpr 16 0.4 35 0.4 30 0.5 277,072 0.7 364 0.2Administrative, Supoprt, & Waste 289 6.4 486 5.5 351 5.3 2,006,742 5.1 11,590 6.6Educational Services 18 0.4 31 0.4 24 0.4 88,488 0.2 143 0.1Health Care & Social Assistance 180 4.0 363 4.1 280 4.2 1,454,762 3.7 5,916 3.4Arts, Entertainment, & Recreation 138 3.0 242 2.8 190 2.9 1,032,324 2.6 6,199 3.5Accommodation and Food Services 1,204 26.5 1,917 21.8 1,484 22.5 6,304,439 16.0 28,438 16.1Other Svcs, except Public Adm 146 3.2 285 3.2 210 3.2 1,316,319 3.3 5,490 3.1Public Administration 706 15.5 1,683 19.1 1,190 18.0 6,345,104 16.1 35,924 20.4Other 43 1.0 334 3.8 250 3.8 3,987,217 10.1 10,609 6.0PART OF BODY 4,544 100.0% 8,814 100.0% 6,600 100.0% $39,505,734 100.0% 176,291 100.0% Ears 16 0.4 42 0.5 22 0.3 60,105 0.2 16 0.0 Face, Excl. Eyes, Ears 113 2.5 167 1.9 127 1.9 228,195 0.6 676 0.4 Eyes 200 4.4 302 3.4 218 3.3 25,212 0.1 (293) -0.2 Head, Excl. Ears, Face, Eyes 101 2.2 179 2.0 132 2.0 618,884 1.6 2,542 1.4 Neck 61 1.3 138 1.6 98 1.5 841,161 2.1 3,169 1.8 Trunk, Excl. Back 452 10.0 951 10.8 719 10.9 6,174,101 15.6 25,670 14.6 Back (Spine/Spinal Cord) 813 17.9 1,739 19.7 1,355 20.5 10,040,323 25.4 52,235 29.6 Arms 222 4.9 423 4.8 316 4.8 1,912,482 4.8 7,765 4.4 Wrists 175 3.9 346 3.9 257 3.9 1,169,547 3.0 6,903 3.9 Hands, Excl. Fingers 239 5.3 377 4.3 285 4.3 633,955 1.6 3,211 1.8 Fingers 558 12.3 890 10.1 652 9.9 802,820 2.0 3,105 1.8 Upper Extremities, Multiple 84 1.9 152 1.7 114 1.7 353,187 0.9 2,599 1.5 Legs 444 9.8 887 10.1 682 10.3 4,043,071 10.2 16,917 9.6 Ankles 206 4.5 341 3.9 258 3.9 873,673 2.2 5,493 3.1 Feet, Excl. Toes 121 2.7 213 2.4 161 2.4 650,659 1.7 3,815 2.2 Toes 55 1.2 78 0.9 61 0.9 25,143 0.1 116 0.1 Lower Extremities, Multiple 36 0.8 70 0.8 53 0.8 399,825 1.0 1,568 0.9 Body Systems 142 3.1 318 3.6 154 2.3 1,339,705 3.4 4,674 2.7 Multiple Body Parts 498 11.0 1,148 13.0 896 13.6 8,629,840 21.8 35,592 20.2 Nonclassifiable 8 0.2 53 0.6 40 0.6 683,845 1.7 518 0.3SOURCE OF INJURY OR ILLNESS 4,544 100.0% 8,814 100.0% 6,600 100.0% $39,505,734 100.0% 176,291 100.0% Chemical, Chemical Product 101 2.2 168 1.9 113 1.7 108,744 0.3 386 0.2 Containers 699 15.4 1,397 15.9 1,091 16.5 7,223,838 18.3 34,141 19.4 Furniture, Fixtures 253 5.6 470 5.3 384 5.8 1,868,406 4.7 9,440 5.4 Machinery 223 4.9 421 4.8 302 4.6 1,978,178 5.0 9,561 5.4 Building Materials 119 2.6 246 2.8 193 2.9 1,486,180 3.8 6,451 3.7 Vehicle, Mobile Equipment Parts 46 1.0 85 1.0 68 1.0 189,769 0.5 2,178 1.2 Other Parts and Materials 137 3.0 230 2.6 176 2.7 852,393 2.2 3,718 2.1 Plants, Animals, Minerals 258 5.7 405 4.6 300 4.6 724,996 1.8 3,732 2.1 Person, Injured Worker 615 13.5 1,298 14.7 889 13.5 6,443,799 16.3 27,825 15.8 Person, Other than Injured Worker 171 3.8 357 4.1 256 3.9 1,608,302 4.1 9,399 5.3 Floors, Walkways, Ground 614 13.5 1,209 13.7 953 14.4 7,178,628 18.2 32,299 18.3 Structures, Other Surfaces 130 2.9 244 2.8 181 2.7 863,578 2.2 3,517 2.0 Handtools (Nonpowered) 280 6.2 469 5.3 354 5.4 870,050 2.2 3,287 1.9 Handtools (Powered) 69 1.5 126 1.4 101 1.5 447,266 1.1 1,225 0.7 Other Tools, Instruments, Equipment 100 2.2 205 2.3 159 2.4 719,790 1.8 4,564 2.6 Highway Vehicle, Motorized 178 3.9 423 4.8 314 4.8 2,210,081 5.6 8,214 4.7 Nonpowered Plant Vehicles 85 1.9 149 1.7 117 1.8 558,281 1.4 3,144 1.8 Other Vehicles 66 1.5 132 1.5 112 1.7 800,716 2.0 4,034 2.3 Scrap, Waste, Debris 152 3.4 239 2.7 172 2.6 215,945 0.6 235 0.1 Other Sources 248 5.5 541 6.1 365 5.5 3,156,794 8.0 8,941 5.1 Notes: Cost and percent totals may not add due to rounding.
2002 HAWAII WORKERS' COMPENSATION STATISTICSREPORTED PROCESSED WITH COST COST DAYS LOST
14
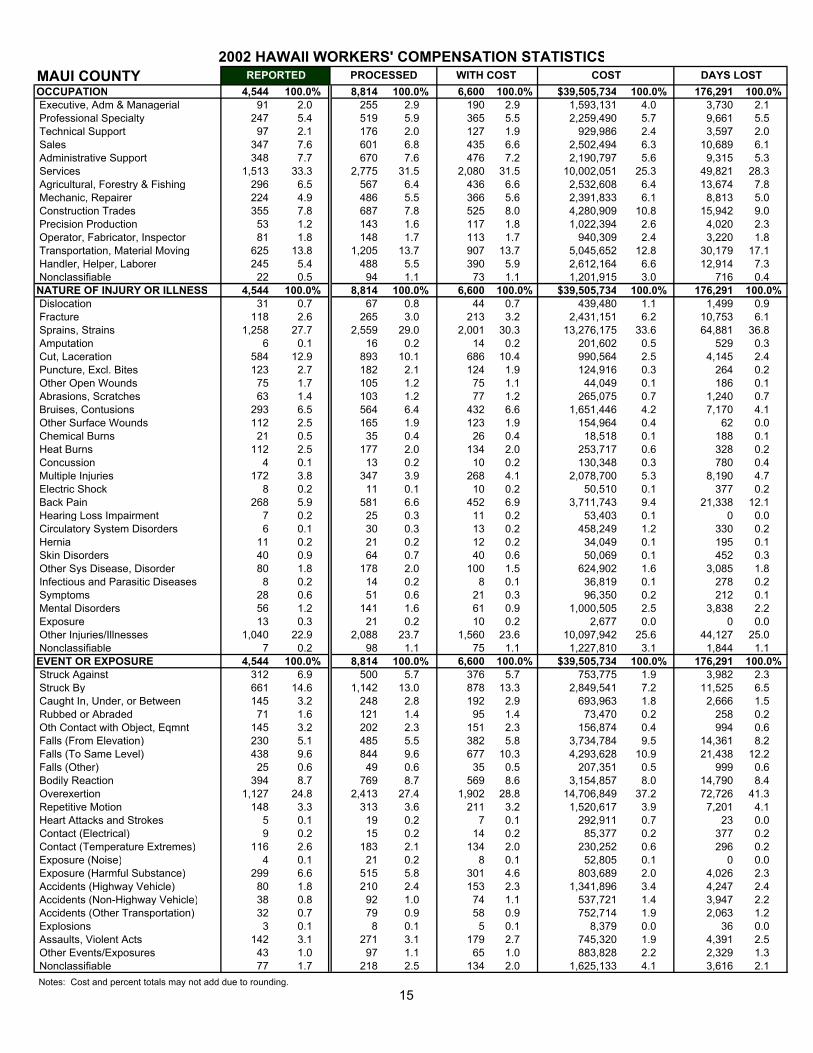
MAUI COUNTYOCCUPATION 4,544 100.0% 8,814 100.0% 6,600 100.0% $39,505,734 100.0% 176,291 100.0% Executive, Adm & Managerial 91 2.0 255 2.9 190 2.9 1,593,131 4.0 3,730 2.1 Professional Specialty 247 5.4 519 5.9 365 5.5 2,259,490 5.7 9,661 5.5 Technical Support 97 2.1 176 2.0 127 1.9 929,986 2.4 3,597 2.0 Sales 347 7.6 601 6.8 435 6.6 2,502,494 6.3 10,689 6.1 Administrative Support 348 7.7 670 7.6 476 7.2 2,190,797 5.6 9,315 5.3 Services 1,513 33.3 2,775 31.5 2,080 31.5 10,002,051 25.3 49,821 28.3 Agricultural, Forestry & Fishing 296 6.5 567 6.4 436 6.6 2,532,608 6.4 13,674 7.8 Mechanic, Repairer 224 4.9 486 5.5 366 5.6 2,391,833 6.1 8,813 5.0 Construction Trades 355 7.8 687 7.8 525 8.0 4,280,909 10.8 15,942 9.0 Precision Production 53 1.2 143 1.6 117 1.8 1,022,394 2.6 4,020 2.3 Operator, Fabricator, Inspector 81 1.8 148 1.7 113 1.7 940,309 2.4 3,220 1.8 Transportation, Material Moving 625 13.8 1,205 13.7 907 13.7 5,045,652 12.8 30,179 17.1 Handler, Helper, Laborer 245 5.4 488 5.5 390 5.9 2,612,164 6.6 12,914 7.3 Nonclassifiable 22 0.5 94 1.1 73 1.1 1,201,915 3.0 716 0.4NATURE OF INJURY OR ILLNESS 4,544 100.0% 8,814 100.0% 6,600 100.0% $39,505,734 100.0% 176,291 100.0% Dislocation 31 0.7 67 0.8 44 0.7 439,480 1.1 1,499 0.9 Fracture 118 2.6 265 3.0 213 3.2 2,431,151 6.2 10,753 6.1 Sprains, Strains 1,258 27.7 2,559 29.0 2,001 30.3 13,276,175 33.6 64,881 36.8 Amputation 6 0.1 16 0.2 14 0.2 201,602 0.5 529 0.3 Cut, Laceration 584 12.9 893 10.1 686 10.4 990,564 2.5 4,145 2.4 Puncture, Excl. Bites 123 2.7 182 2.1 124 1.9 124,916 0.3 264 0.2 Other Open Wounds 75 1.7 105 1.2 75 1.1 44,049 0.1 186 0.1 Abrasions, Scratches 63 1.4 103 1.2 77 1.2 265,075 0.7 1,240 0.7 Bruises, Contusions 293 6.5 564 6.4 432 6.6 1,651,446 4.2 7,170 4.1 Other Surface Wounds 112 2.5 165 1.9 123 1.9 154,964 0.4 62 0.0 Chemical Burns 21 0.5 35 0.4 26 0.4 18,518 0.1 188 0.1 Heat Burns 112 2.5 177 2.0 134 2.0 253,717 0.6 328 0.2 Concussion 4 0.1 13 0.2 10 0.2 130,348 0.3 780 0.4 Multiple Injuries 172 3.8 347 3.9 268 4.1 2,078,700 5.3 8,190 4.7 Electric Shock 8 0.2 11 0.1 10 0.2 50,510 0.1 377 0.2 Back Pain 268 5.9 581 6.6 452 6.9 3,711,743 9.4 21,338 12.1 Hearing Loss Impairment 7 0.2 25 0.3 11 0.2 53,403 0.1 0 0.0 Circulatory System Disorders 6 0.1 30 0.3 13 0.2 458,249 1.2 330 0.2 Hernia 11 0.2 21 0.2 12 0.2 34,049 0.1 195 0.1 Skin Disorders 40 0.9 64 0.7 40 0.6 50,069 0.1 452 0.3 Other Sys Disease, Disorder 80 1.8 178 2.0 100 1.5 624,902 1.6 3,085 1.8 Infectious and Parasitic Diseases 8 0.2 14 0.2 8 0.1 36,819 0.1 278 0.2 Symptoms 28 0.6 51 0.6 21 0.3 96,350 0.2 212 0.1 Mental Disorders 56 1.2 141 1.6 61 0.9 1,000,505 2.5 3,838 2.2 Exposure 13 0.3 21 0.2 10 0.2 2,677 0.0 0 0.0 Other Injuries/Illnesses 1,040 22.9 2,088 23.7 1,560 23.6 10,097,942 25.6 44,127 25.0 Nonclassifiable 7 0.2 98 1.1 75 1.1 1,227,810 3.1 1,844 1.1EVENT OR EXPOSURE 4,544 100.0% 8,814 100.0% 6,600 100.0% $39,505,734 100.0% 176,291 100.0% Struck Against 312 6.9 500 5.7 376 5.7 753,775 1.9 3,982 2.3 Struck By 661 14.6 1,142 13.0 878 13.3 2,849,541 7.2 11,525 6.5 Caught In, Under, or Between 145 3.2 248 2.8 192 2.9 693,963 1.8 2,666 1.5 Rubbed or Abraded 71 1.6 121 1.4 95 1.4 73,470 0.2 258 0.2 Oth Contact with Object, Eqmnt 145 3.2 202 2.3 151 2.3 156,874 0.4 994 0.6 Falls (From Elevation) 230 5.1 485 5.5 382 5.8 3,734,784 9.5 14,361 8.2 Falls (To Same Level) 438 9.6 844 9.6 677 10.3 4,293,628 10.9 21,438 12.2 Falls (Other) 25 0.6 49 0.6 35 0.5 207,351 0.5 999 0.6 Bodily Reaction 394 8.7 769 8.7 569 8.6 3,154,857 8.0 14,790 8.4 Overexertion 1,127 24.8 2,413 27.4 1,902 28.8 14,706,849 37.2 72,726 41.3 Repetitive Motion 148 3.3 313 3.6 211 3.2 1,520,617 3.9 7,201 4.1 Heart Attacks and Strokes 5 0.1 19 0.2 7 0.1 292,911 0.7 23 0.0 Contact (Electrical) 9 0.2 15 0.2 14 0.2 85,377 0.2 377 0.2 Contact (Temperature Extremes) 116 2.6 183 2.1 134 2.0 230,252 0.6 296 0.2 Exposure (Noise) 4 0.1 21 0.2 8 0.1 52,805 0.1 0 0.0 Exposure (Harmful Substance) 299 6.6 515 5.8 301 4.6 803,689 2.0 4,026 2.3 Accidents (Highway Vehicle) 80 1.8 210 2.4 153 2.3 1,341,896 3.4 4,247 2.4 Accidents (Non-Highway Vehicle) 38 0.8 92 1.0 74 1.1 537,721 1.4 3,947 2.2 Accidents (Other Transportation) 32 0.7 79 0.9 58 0.9 752,714 1.9 2,063 1.2 Explosions 3 0.1 8 0.1 5 0.1 8,379 0.0 36 0.0 Assaults, Violent Acts 142 3.1 271 3.1 179 2.7 745,320 1.9 4,391 2.5 Other Events/Exposures 43 1.0 97 1.1 65 1.0 883,828 2.2 2,329 1.3 Nonclassifiable 77 1.7 218 2.5 134 2.0 1,625,133 4.1 3,616 2.1 Notes: Cost and percent totals may not add due to rounding.
2002 HAWAII WORKERS' COMPENSATION STATISTICSREPORTED PROCESSED WITH COST COST DAYS LOST
15
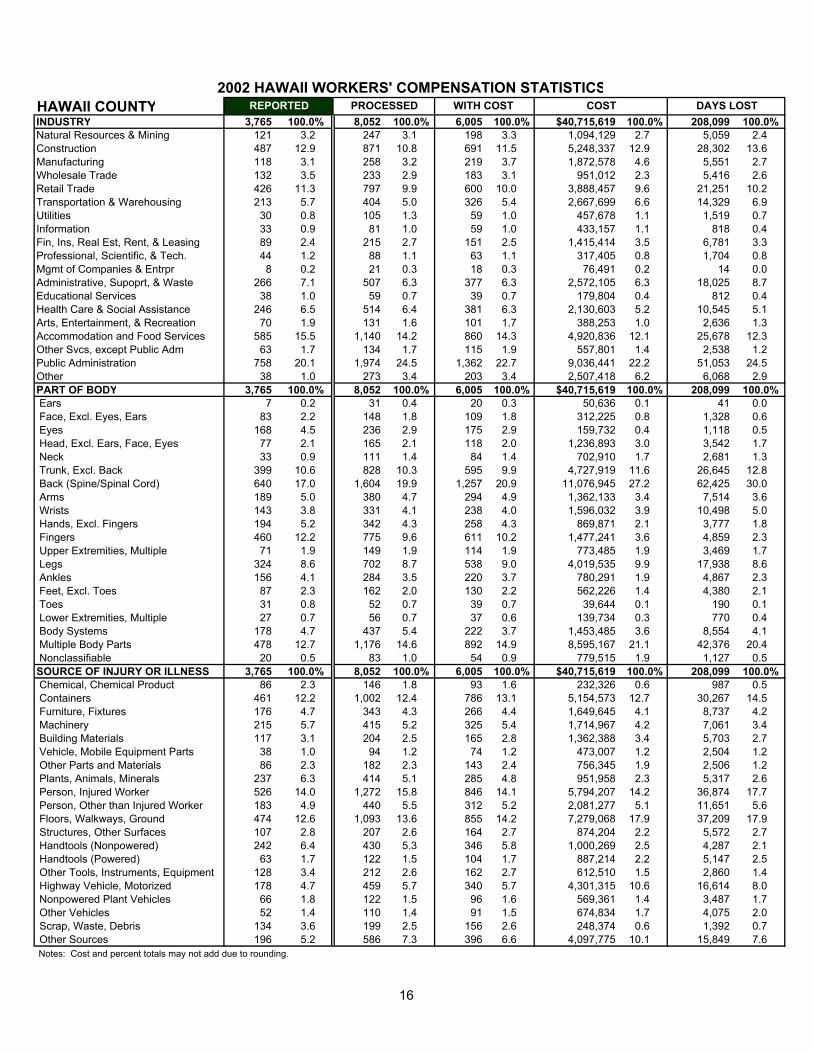
HAWAII COUNTYINDUSTRY 3,765 100.0% 8,052 100.0% 6,005 100.0% $40,715,619 100.0% 208,099 100.0%Natural Resources & Mining 121 3.2 247 3.1 198 3.3 1,094,129 2.7 5,059 2.4Construction 487 12.9 871 10.8 691 11.5 5,248,337 12.9 28,302 13.6Manufacturing 118 3.1 258 3.2 219 3.7 1,872,578 4.6 5,551 2.7Wholesale Trade 132 3.5 233 2.9 183 3.1 951,012 2.3 5,416 2.6Retail Trade 426 11.3 797 9.9 600 10.0 3,888,457 9.6 21,251 10.2Transportation & Warehousing 213 5.7 404 5.0 326 5.4 2,667,699 6.6 14,329 6.9Utilities 30 0.8 105 1.3 59 1.0 457,678 1.1 1,519 0.7Information 33 0.9 81 1.0 59 1.0 433,157 1.1 818 0.4Fin, Ins, Real Est, Rent, & Leasing 89 2.4 215 2.7 151 2.5 1,415,414 3.5 6,781 3.3Professional, Scientific, & Tech. 44 1.2 88 1.1 63 1.1 317,405 0.8 1,704 0.8Mgmt of Companies & Entrpr 8 0.2 21 0.3 18 0.3 76,491 0.2 14 0.0Administrative, Supoprt, & Waste 266 7.1 507 6.3 377 6.3 2,572,105 6.3 18,025 8.7Educational Services 38 1.0 59 0.7 39 0.7 179,804 0.4 812 0.4Health Care & Social Assistance 246 6.5 514 6.4 381 6.3 2,130,603 5.2 10,545 5.1Arts, Entertainment, & Recreation 70 1.9 131 1.6 101 1.7 388,253 1.0 2,636 1.3Accommodation and Food Services 585 15.5 1,140 14.2 860 14.3 4,920,836 12.1 25,678 12.3Other Svcs, except Public Adm 63 1.7 134 1.7 115 1.9 557,801 1.4 2,538 1.2Public Administration 758 20.1 1,974 24.5 1,362 22.7 9,036,441 22.2 51,053 24.5Other 38 1.0 273 3.4 203 3.4 2,507,418 6.2 6,068 2.9PART OF BODY 3,765 100.0% 8,052 100.0% 6,005 100.0% $40,715,619 100.0% 208,099 100.0% Ears 7 0.2 31 0.4 20 0.3 50,636 0.1 41 0.0 Face, Excl. Eyes, Ears 83 2.2 148 1.8 109 1.8 312,225 0.8 1,328 0.6 Eyes 168 4.5 236 2.9 175 2.9 159,732 0.4 1,118 0.5 Head, Excl. Ears, Face, Eyes 77 2.1 165 2.1 118 2.0 1,236,893 3.0 3,542 1.7 Neck 33 0.9 111 1.4 84 1.4 702,910 1.7 2,681 1.3 Trunk, Excl. Back 399 10.6 828 10.3 595 9.9 4,727,919 11.6 26,645 12.8 Back (Spine/Spinal Cord) 640 17.0 1,604 19.9 1,257 20.9 11,076,945 27.2 62,425 30.0 Arms 189 5.0 380 4.7 294 4.9 1,362,133 3.4 7,514 3.6 Wrists 143 3.8 331 4.1 238 4.0 1,596,032 3.9 10,498 5.0 Hands, Excl. Fingers 194 5.2 342 4.3 258 4.3 869,871 2.1 3,777 1.8 Fingers 460 12.2 775 9.6 611 10.2 1,477,241 3.6 4,859 2.3 Upper Extremities, Multiple 71 1.9 149 1.9 114 1.9 773,485 1.9 3,469 1.7 Legs 324 8.6 702 8.7 538 9.0 4,019,535 9.9 17,938 8.6 Ankles 156 4.1 284 3.5 220 3.7 780,291 1.9 4,867 2.3 Feet, Excl. Toes 87 2.3 162 2.0 130 2.2 562,226 1.4 4,380 2.1 Toes 31 0.8 52 0.7 39 0.7 39,644 0.1 190 0.1 Lower Extremities, Multiple 27 0.7 56 0.7 37 0.6 139,734 0.3 770 0.4 Body Systems 178 4.7 437 5.4 222 3.7 1,453,485 3.6 8,554 4.1 Multiple Body Parts 478 12.7 1,176 14.6 892 14.9 8,595,167 21.1 42,376 20.4 Nonclassifiable 20 0.5 83 1.0 54 0.9 779,515 1.9 1,127 0.5SOURCE OF INJURY OR ILLNESS 3,765 100.0% 8,052 100.0% 6,005 100.0% $40,715,619 100.0% 208,099 100.0% Chemical, Chemical Product 86 2.3 146 1.8 93 1.6 232,326 0.6 987 0.5 Containers 461 12.2 1,002 12.4 786 13.1 5,154,573 12.7 30,267 14.5 Furniture, Fixtures 176 4.7 343 4.3 266 4.4 1,649,645 4.1 8,737 4.2 Machinery 215 5.7 415 5.2 325 5.4 1,714,967 4.2 7,061 3.4 Building Materials 117 3.1 204 2.5 165 2.8 1,362,388 3.4 5,703 2.7 Vehicle, Mobile Equipment Parts 38 1.0 94 1.2 74 1.2 473,007 1.2 2,504 1.2 Other Parts and Materials 86 2.3 182 2.3 143 2.4 756,345 1.9 2,506 1.2 Plants, Animals, Minerals 237 6.3 414 5.1 285 4.8 951,958 2.3 5,317 2.6 Person, Injured Worker 526 14.0 1,272 15.8 846 14.1 5,794,207 14.2 36,874 17.7 Person, Other than Injured Worker 183 4.9 440 5.5 312 5.2 2,081,277 5.1 11,651 5.6 Floors, Walkways, Ground 474 12.6 1,093 13.6 855 14.2 7,279,068 17.9 37,209 17.9 Structures, Other Surfaces 107 2.8 207 2.6 164 2.7 874,204 2.2 5,572 2.7 Handtools (Nonpowered) 242 6.4 430 5.3 346 5.8 1,000,269 2.5 4,287 2.1 Handtools (Powered) 63 1.7 122 1.5 104 1.7 887,214 2.2 5,147 2.5 Other Tools, Instruments, Equipment 128 3.4 212 2.6 162 2.7 612,510 1.5 2,860 1.4 Highway Vehicle, Motorized 178 4.7 459 5.7 340 5.7 4,301,315 10.6 16,614 8.0 Nonpowered Plant Vehicles 66 1.8 122 1.5 96 1.6 569,361 1.4 3,487 1.7 Other Vehicles 52 1.4 110 1.4 91 1.5 674,834 1.7 4,075 2.0 Scrap, Waste, Debris 134 3.6 199 2.5 156 2.6 248,374 0.6 1,392 0.7 Other Sources 196 5.2 586 7.3 396 6.6 4,097,775 10.1 15,849 7.6 Notes: Cost and percent totals may not add due to rounding.
2002 HAWAII WORKERS' COMPENSATION STATISTICSREPORTED PROCESSED WITH COST COST DAYS LOST
16
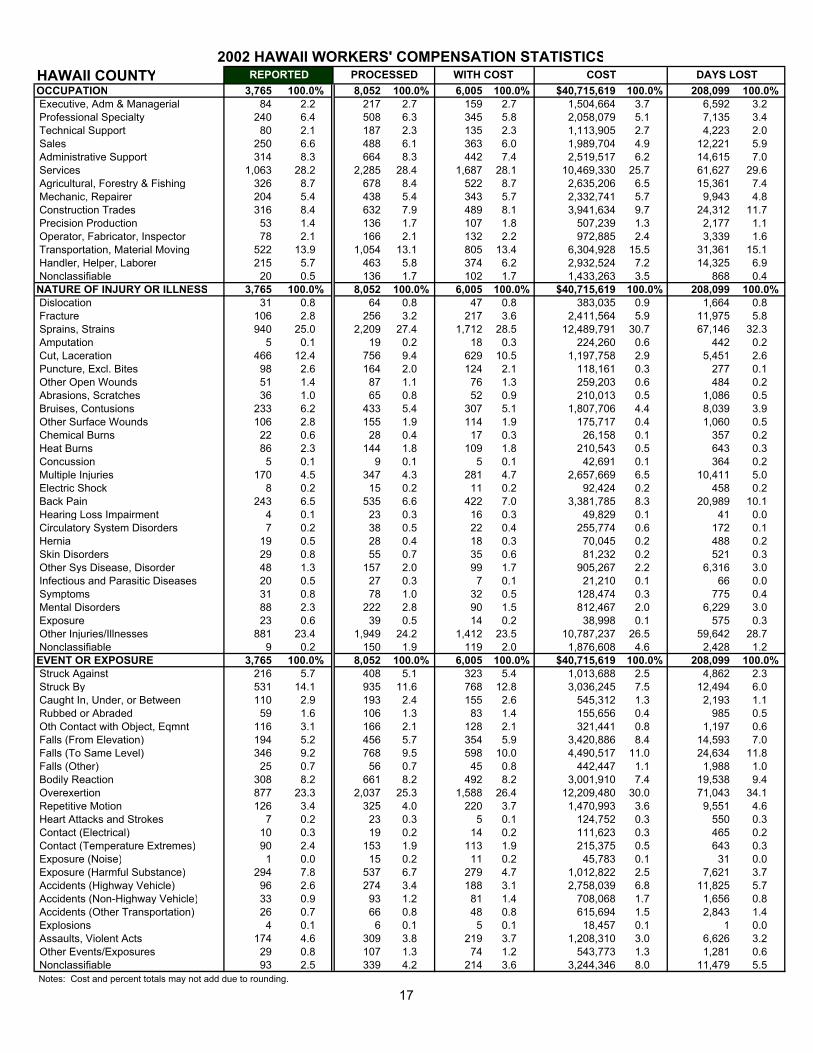
HAWAII COUNTYOCCUPATION 3,765 100.0% 8,052 100.0% 6,005 100.0% $40,715,619 100.0% 208,099 100.0% Executive, Adm & Managerial 84 2.2 217 2.7 159 2.7 1,504,664 3.7 6,592 3.2 Professional Specialty 240 6.4 508 6.3 345 5.8 2,058,079 5.1 7,135 3.4 Technical Support 80 2.1 187 2.3 135 2.3 1,113,905 2.7 4,223 2.0 Sales 250 6.6 488 6.1 363 6.0 1,989,704 4.9 12,221 5.9 Administrative Support 314 8.3 664 8.3 442 7.4 2,519,517 6.2 14,615 7.0 Services 1,063 28.2 2,285 28.4 1,687 28.1 10,469,330 25.7 61,627 29.6 Agricultural, Forestry & Fishing 326 8.7 678 8.4 522 8.7 2,635,206 6.5 15,361 7.4 Mechanic, Repairer 204 5.4 438 5.4 343 5.7 2,332,741 5.7 9,943 4.8 Construction Trades 316 8.4 632 7.9 489 8.1 3,941,634 9.7 24,312 11.7 Precision Production 53 1.4 136 1.7 107 1.8 507,239 1.3 2,177 1.1 Operator, Fabricator, Inspector 78 2.1 166 2.1 132 2.2 972,885 2.4 3,339 1.6 Transportation, Material Moving 522 13.9 1,054 13.1 805 13.4 6,304,928 15.5 31,361 15.1 Handler, Helper, Laborer 215 5.7 463 5.8 374 6.2 2,932,524 7.2 14,325 6.9 Nonclassifiable 20 0.5 136 1.7 102 1.7 1,433,263 3.5 868 0.4NATURE OF INJURY OR ILLNESS 3,765 100.0% 8,052 100.0% 6,005 100.0% $40,715,619 100.0% 208,099 100.0% Dislocation 31 0.8 64 0.8 47 0.8 383,035 0.9 1,664 0.8 Fracture 106 2.8 256 3.2 217 3.6 2,411,564 5.9 11,975 5.8 Sprains, Strains 940 25.0 2,209 27.4 1,712 28.5 12,489,791 30.7 67,146 32.3 Amputation 5 0.1 19 0.2 18 0.3 224,260 0.6 442 0.2 Cut, Laceration 466 12.4 756 9.4 629 10.5 1,197,758 2.9 5,451 2.6 Puncture, Excl. Bites 98 2.6 164 2.0 124 2.1 118,161 0.3 277 0.1 Other Open Wounds 51 1.4 87 1.1 76 1.3 259,203 0.6 484 0.2 Abrasions, Scratches 36 1.0 65 0.8 52 0.9 210,013 0.5 1,086 0.5 Bruises, Contusions 233 6.2 433 5.4 307 5.1 1,807,706 4.4 8,039 3.9 Other Surface Wounds 106 2.8 155 1.9 114 1.9 175,717 0.4 1,060 0.5 Chemical Burns 22 0.6 28 0.4 17 0.3 26,158 0.1 357 0.2 Heat Burns 86 2.3 144 1.8 109 1.8 210,543 0.5 643 0.3 Concussion 5 0.1 9 0.1 5 0.1 42,691 0.1 364 0.2 Multiple Injuries 170 4.5 347 4.3 281 4.7 2,657,669 6.5 10,411 5.0 Electric Shock 8 0.2 15 0.2 11 0.2 92,424 0.2 458 0.2 Back Pain 243 6.5 535 6.6 422 7.0 3,381,785 8.3 20,989 10.1 Hearing Loss Impairment 4 0.1 23 0.3 16 0.3 49,829 0.1 41 0.0 Circulatory System Disorders 7 0.2 38 0.5 22 0.4 255,774 0.6 172 0.1 Hernia 19 0.5 28 0.4 18 0.3 70,045 0.2 488 0.2 Skin Disorders 29 0.8 55 0.7 35 0.6 81,232 0.2 521 0.3 Other Sys Disease, Disorder 48 1.3 157 2.0 99 1.7 905,267 2.2 6,316 3.0 Infectious and Parasitic Diseases 20 0.5 27 0.3 7 0.1 21,210 0.1 66 0.0 Symptoms 31 0.8 78 1.0 32 0.5 128,474 0.3 775 0.4 Mental Disorders 88 2.3 222 2.8 90 1.5 812,467 2.0 6,229 3.0 Exposure 23 0.6 39 0.5 14 0.2 38,998 0.1 575 0.3 Other Injuries/Illnesses 881 23.4 1,949 24.2 1,412 23.5 10,787,237 26.5 59,642 28.7 Nonclassifiable 9 0.2 150 1.9 119 2.0 1,876,608 4.6 2,428 1.2EVENT OR EXPOSURE 3,765 100.0% 8,052 100.0% 6,005 100.0% $40,715,619 100.0% 208,099 100.0% Struck Against 216 5.7 408 5.1 323 5.4 1,013,688 2.5 4,862 2.3 Struck By 531 14.1 935 11.6 768 12.8 3,036,245 7.5 12,494 6.0 Caught In, Under, or Between 110 2.9 193 2.4 155 2.6 545,312 1.3 2,193 1.1 Rubbed or Abraded 59 1.6 106 1.3 83 1.4 155,656 0.4 985 0.5 Oth Contact with Object, Eqmnt 116 3.1 166 2.1 128 2.1 321,441 0.8 1,197 0.6 Falls (From Elevation) 194 5.2 456 5.7 354 5.9 3,420,886 8.4 14,593 7.0 Falls (To Same Level) 346 9.2 768 9.5 598 10.0 4,490,517 11.0 24,634 11.8 Falls (Other) 25 0.7 56 0.7 45 0.8 442,447 1.1 1,988 1.0 Bodily Reaction 308 8.2 661 8.2 492 8.2 3,001,910 7.4 19,538 9.4 Overexertion 877 23.3 2,037 25.3 1,588 26.4 12,209,480 30.0 71,043 34.1 Repetitive Motion 126 3.4 325 4.0 220 3.7 1,470,993 3.6 9,551 4.6 Heart Attacks and Strokes 7 0.2 23 0.3 5 0.1 124,752 0.3 550 0.3 Contact (Electrical) 10 0.3 19 0.2 14 0.2 111,623 0.3 465 0.2 Contact (Temperature Extremes) 90 2.4 153 1.9 113 1.9 215,375 0.5 643 0.3 Exposure (Noise) 1 0.0 15 0.2 11 0.2 45,783 0.1 31 0.0 Exposure (Harmful Substance) 294 7.8 537 6.7 279 4.7 1,012,822 2.5 7,621 3.7 Accidents (Highway Vehicle) 96 2.6 274 3.4 188 3.1 2,758,039 6.8 11,825 5.7 Accidents (Non-Highway Vehicle) 33 0.9 93 1.2 81 1.4 708,068 1.7 1,656 0.8 Accidents (Other Transportation) 26 0.7 66 0.8 48 0.8 615,694 1.5 2,843 1.4 Explosions 4 0.1 6 0.1 5 0.1 18,457 0.1 1 0.0 Assaults, Violent Acts 174 4.6 309 3.8 219 3.7 1,208,310 3.0 6,626 3.2 Other Events/Exposures 29 0.8 107 1.3 74 1.2 543,773 1.3 1,281 0.6 Nonclassifiable 93 2.5 339 4.2 214 3.6 3,244,346 8.0 11,479 5.5 Notes: Cost and percent totals may not add due to rounding.
2002 HAWAII WORKERS' COMPENSATION STATISTICSDAYS LOSTREPORTED PROCESSED WITH COST COST
17

KAUAI COUNTYINDUSTRY 1,781 100.0% 3,357 100.0% 2,587 100.0% $11,145,177 100.0% 60,207 100.0%Natural Resources & Mining 70 3.9 155 4.6 128 5.0 507,755 4.6 3,296 5.5Construction 125 7.0 227 6.8 181 7.0 1,472,015 13.2 5,943 9.9Manufacturing 27 1.5 59 1.8 48 1.9 179,572 1.6 837 1.4Wholesale Trade 33 1.9 48 1.4 39 1.5 115,573 1.0 713 1.2Retail Trade 246 13.8 420 12.5 352 13.6 1,187,423 10.7 6,933 11.5Transportation & Warehousing 67 3.8 133 4.0 96 3.7 329,820 3.0 1,798 3.0Utilities 7 0.4 13 0.4 7 0.3 10,834 0.1 9 0.0Information 14 0.8 33 1.0 28 1.1 71,542 0.6 296 0.5Fin, Ins, Real Est, Rent, & Leasing 80 4.5 127 3.8 93 3.6 233,614 2.1 1,556 2.6Professional, Scientific, & Tech. 25 1.4 35 1.0 26 1.0 29,748 0.3 265 0.4Mgmt of Companies & Entrpr 11 0.6 15 0.5 15 0.6 32,454 0.3 19 0.0Administrative, Supoprt, & Waste 119 6.7 205 6.1 160 6.2 657,169 5.9 4,565 7.6Educational Services 4 0.2 6 0.2 5 0.2 10,990 0.1 2 0.0Health Care & Social Assistance 136 7.6 243 7.2 195 7.5 761,979 6.8 2,326 3.9Arts, Entertainment, & Recreation 56 3.1 107 3.2 86 3.3 308,132 2.8 1,713 2.9Accommodation and Food Services 419 23.5 695 20.7 550 21.3 2,155,167 19.3 14,756 24.5Other Svcs, except Public Adm 37 2.1 65 1.9 51 2.0 214,945 1.9 1,227 2.0Public Administration 297 16.7 678 20.2 458 17.7 2,247,303 20.2 10,915 18.1Other 8 0.5 93 2.8 69 2.7 619,144 5.6 3,038 5.1PART OF BODY 1,781 100.0% 3,357 100.0% 2,587 100.0% $11,145,177 100.0% 60,207 100.0% Ears 11 0.6 18 0.5 9 0.4 16,710 0.2 16 0.0 Face, Excl. Eyes, Ears 34 1.9 56 1.7 38 1.5 45,699 0.4 108 0.2 Eyes 109 6.1 139 4.1 102 3.9 35,424 0.3 20 0.0 Head, Excl. Ears, Face, Eyes 32 1.8 64 1.9 51 2.0 254,953 2.3 1,533 2.6 Neck 26 1.5 59 1.8 44 1.7 97,685 0.9 217 0.4 Trunk, Excl. Back 182 10.2 345 10.3 266 10.3 1,485,730 13.3 8,379 13.9 Back (Spine/Spinal Cord) 292 16.4 653 19.5 501 19.4 3,042,892 27.3 16,995 28.2 Arms 79 4.4 153 4.6 124 4.8 304,845 2.7 1,711 2.8 Wrists 79 4.4 158 4.7 130 5.0 583,880 5.2 3,609 6.0 Hands, Excl. Fingers 98 5.5 155 4.6 114 4.4 188,126 1.7 763 1.3 Fingers 209 11.7 355 10.6 294 11.4 356,213 3.2 1,508 2.5 Upper Extremities, Multiple 29 1.6 56 1.7 45 1.7 304,835 2.7 1,108 1.8 Legs 176 9.9 333 9.9 263 10.2 1,196,621 10.7 6,370 10.6 Ankles 79 4.4 123 3.7 105 4.1 371,804 3.3 2,275 3.8 Feet, Excl. Toes 40 2.3 74 2.2 58 2.2 242,348 2.2 1,675 2.8 Toes 10 0.6 25 0.7 21 0.8 60,742 0.6 479 0.8 Lower Extremities, Multiple 9 0.5 14 0.4 13 0.5 55,648 0.5 478 0.8 Body Systems 111 6.2 198 5.9 110 4.3 522,554 4.7 3,035 5.0 Multiple Body Parts 171 9.6 366 10.9 292 11.3 1,931,167 17.3 9,899 16.4 Nonclassifiable 5 0.3 13 0.4 7 0.3 47,300 0.4 29 0.1SOURCE OF INJURY OR ILLNESS 1,781 100.0% 3,357 100.0% 2,587 100.0% $11,145,177 100.0% 60,207 100.0% Chemical, Chemical Product 81 4.6 114 3.4 86 3.3 60,587 0.5 237 0.4 Containers 233 13.1 464 13.8 376 14.5 1,458,000 13.1 7,757 12.9 Furniture, Fixtures 103 5.8 186 5.5 150 5.8 784,938 7.0 5,403 9.0 Machinery 87 4.9 181 5.4 143 5.5 525,118 4.7 3,316 5.5 Building Materials 32 1.8 66 2.0 52 2.0 255,406 2.3 1,930 3.2 Vehicle, Mobile Equipment Parts 14 0.8 32 1.0 25 1.0 231,210 2.1 1,307 2.2 Other Parts and Materials 61 3.4 96 2.9 73 2.8 150,171 1.4 1,192 2.0 Plants, Animals, Minerals 128 7.2 194 5.8 152 5.9 270,741 2.4 1,404 2.3 Person, Injured Worker 231 13.0 476 14.2 327 12.6 1,837,082 16.5 10,824 18.0 Person, Other than Injured Worker 77 4.3 147 4.4 102 3.9 492,464 4.4 2,001 3.3 Floors, Walkways, Ground 220 12.4 436 13.0 356 13.8 2,439,041 21.9 12,602 20.9 Structures, Other Surfaces 49 2.8 88 2.6 64 2.5 354,219 3.2 1,794 3.0 Handtools (Nonpowered) 85 4.8 176 5.2 150 5.8 252,510 2.3 1,278 2.1 Handtools (Powered) 14 0.8 27 0.8 22 0.9 52,133 0.5 193 0.3 Other Tools, Instruments, Equipment 56 3.1 99 3.0 83 3.2 223,133 2.0 1,224 2.0 Highway Vehicle, Motorized 69 3.9 155 4.6 119 4.6 614,945 5.5 2,521 4.2 Nonpowered Plant Vehicles 35 2.0 47 1.4 41 1.6 94,955 0.9 668 1.1 Other Vehicles 18 1.0 37 1.1 32 1.2 218,073 2.0 546 0.9 Scrap, Waste, Debris 77 4.3 105 3.1 84 3.3 30,782 0.3 91 0.2 Other Sources 111 6.2 231 6.9 150 5.8 799,666 7.2 3,919 6.5 Notes: Cost and percent totals may not add due to rounding.
2002 HAWAII WORKERS' COMPENSATION STATISTICSREPORTED PROCESSED WITH COST COST DAYS LOST
18
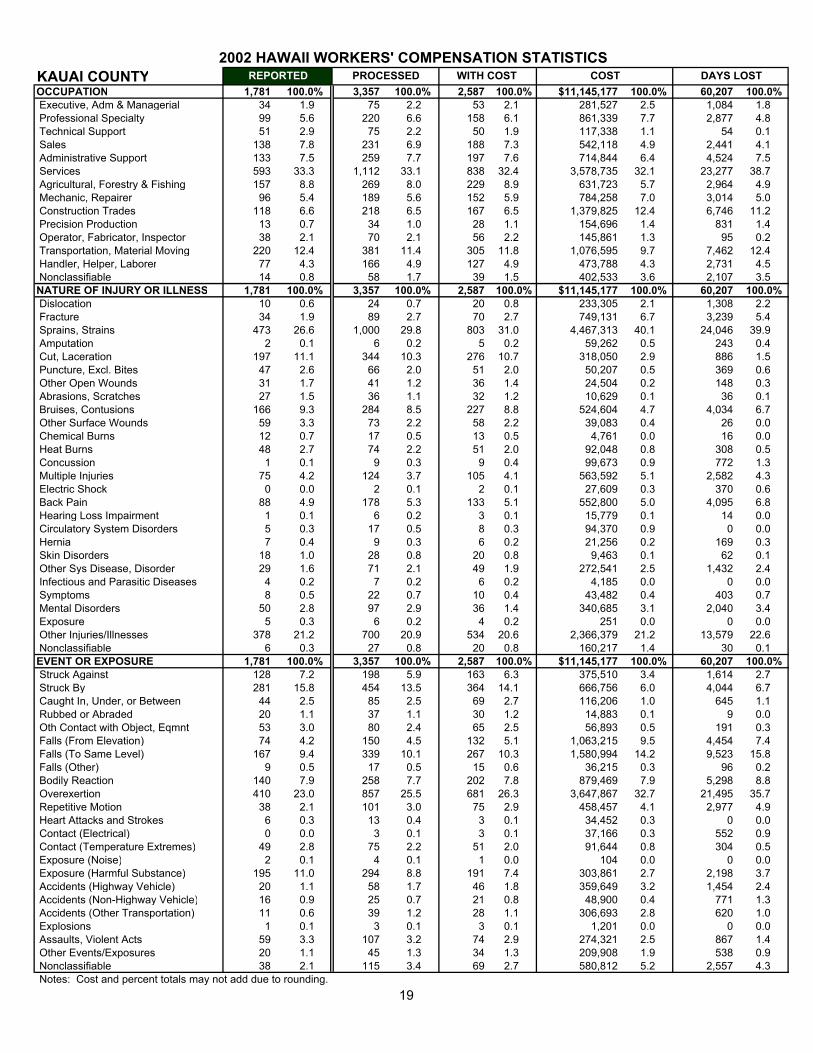
KAUAI COUNTYOCCUPATION 1,781 100.0% 3,357 100.0% 2,587 100.0% $11,145,177 100.0% 60,207 100.0% Executive, Adm & Managerial 34 1.9 75 2.2 53 2.1 281,527 2.5 1,084 1.8 Professional Specialty 99 5.6 220 6.6 158 6.1 861,339 7.7 2,877 4.8 Technical Support 51 2.9 75 2.2 50 1.9 117,338 1.1 54 0.1 Sales 138 7.8 231 6.9 188 7.3 542,118 4.9 2,441 4.1 Administrative Support 133 7.5 259 7.7 197 7.6 714,844 6.4 4,524 7.5 Services 593 33.3 1,112 33.1 838 32.4 3,578,735 32.1 23,277 38.7 Agricultural, Forestry & Fishing 157 8.8 269 8.0 229 8.9 631,723 5.7 2,964 4.9 Mechanic, Repairer 96 5.4 189 5.6 152 5.9 784,258 7.0 3,014 5.0 Construction Trades 118 6.6 218 6.5 167 6.5 1,379,825 12.4 6,746 11.2 Precision Production 13 0.7 34 1.0 28 1.1 154,696 1.4 831 1.4 Operator, Fabricator, Inspector 38 2.1 70 2.1 56 2.2 145,861 1.3 95 0.2 Transportation, Material Moving 220 12.4 381 11.4 305 11.8 1,076,595 9.7 7,462 12.4 Handler, Helper, Laborer 77 4.3 166 4.9 127 4.9 473,788 4.3 2,731 4.5 Nonclassifiable 14 0.8 58 1.7 39 1.5 402,533 3.6 2,107 3.5NATURE OF INJURY OR ILLNESS 1,781 100.0% 3,357 100.0% 2,587 100.0% $11,145,177 100.0% 60,207 100.0% Dislocation 10 0.6 24 0.7 20 0.8 233,305 2.1 1,308 2.2 Fracture 34 1.9 89 2.7 70 2.7 749,131 6.7 3,239 5.4 Sprains, Strains 473 26.6 1,000 29.8 803 31.0 4,467,313 40.1 24,046 39.9 Amputation 2 0.1 6 0.2 5 0.2 59,262 0.5 243 0.4 Cut, Laceration 197 11.1 344 10.3 276 10.7 318,050 2.9 886 1.5 Puncture, Excl. Bites 47 2.6 66 2.0 51 2.0 50,207 0.5 369 0.6 Other Open Wounds 31 1.7 41 1.2 36 1.4 24,504 0.2 148 0.3 Abrasions, Scratches 27 1.5 36 1.1 32 1.2 10,629 0.1 36 0.1 Bruises, Contusions 166 9.3 284 8.5 227 8.8 524,604 4.7 4,034 6.7 Other Surface Wounds 59 3.3 73 2.2 58 2.2 39,083 0.4 26 0.0 Chemical Burns 12 0.7 17 0.5 13 0.5 4,761 0.0 16 0.0 Heat Burns 48 2.7 74 2.2 51 2.0 92,048 0.8 308 0.5 Concussion 1 0.1 9 0.3 9 0.4 99,673 0.9 772 1.3 Multiple Injuries 75 4.2 124 3.7 105 4.1 563,592 5.1 2,582 4.3 Electric Shock 0 0.0 2 0.1 2 0.1 27,609 0.3 370 0.6 Back Pain 88 4.9 178 5.3 133 5.1 552,800 5.0 4,095 6.8 Hearing Loss Impairment 1 0.1 6 0.2 3 0.1 15,779 0.1 14 0.0 Circulatory System Disorders 5 0.3 17 0.5 8 0.3 94,370 0.9 0 0.0 Hernia 7 0.4 9 0.3 6 0.2 21,256 0.2 169 0.3 Skin Disorders 18 1.0 28 0.8 20 0.8 9,463 0.1 62 0.1 Other Sys Disease, Disorder 29 1.6 71 2.1 49 1.9 272,541 2.5 1,432 2.4 Infectious and Parasitic Diseases 4 0.2 7 0.2 6 0.2 4,185 0.0 0 0.0 Symptoms 8 0.5 22 0.7 10 0.4 43,482 0.4 403 0.7 Mental Disorders 50 2.8 97 2.9 36 1.4 340,685 3.1 2,040 3.4 Exposure 5 0.3 6 0.2 4 0.2 251 0.0 0 0.0 Other Injuries/Illnesses 378 21.2 700 20.9 534 20.6 2,366,379 21.2 13,579 22.6 Nonclassifiable 6 0.3 27 0.8 20 0.8 160,217 1.4 30 0.1EVENT OR EXPOSURE 1,781 100.0% 3,357 100.0% 2,587 100.0% $11,145,177 100.0% 60,207 100.0% Struck Against 128 7.2 198 5.9 163 6.3 375,510 3.4 1,614 2.7 Struck By 281 15.8 454 13.5 364 14.1 666,756 6.0 4,044 6.7 Caught In, Under, or Between 44 2.5 85 2.5 69 2.7 116,206 1.0 645 1.1 Rubbed or Abraded 20 1.1 37 1.1 30 1.2 14,883 0.1 9 0.0 Oth Contact with Object, Eqmnt 53 3.0 80 2.4 65 2.5 56,893 0.5 191 0.3 Falls (From Elevation) 74 4.2 150 4.5 132 5.1 1,063,215 9.5 4,454 7.4 Falls (To Same Level) 167 9.4 339 10.1 267 10.3 1,580,994 14.2 9,523 15.8 Falls (Other) 9 0.5 17 0.5 15 0.6 36,215 0.3 96 0.2 Bodily Reaction 140 7.9 258 7.7 202 7.8 879,469 7.9 5,298 8.8 Overexertion 410 23.0 857 25.5 681 26.3 3,647,867 32.7 21,495 35.7 Repetitive Motion 38 2.1 101 3.0 75 2.9 458,457 4.1 2,977 4.9 Heart Attacks and Strokes 6 0.3 13 0.4 3 0.1 34,452 0.3 0 0.0 Contact (Electrical) 0 0.0 3 0.1 3 0.1 37,166 0.3 552 0.9 Contact (Temperature Extremes) 49 2.8 75 2.2 51 2.0 91,644 0.8 304 0.5 Exposure (Noise) 2 0.1 4 0.1 1 0.0 104 0.0 0 0.0 Exposure (Harmful Substance) 195 11.0 294 8.8 191 7.4 303,861 2.7 2,198 3.7 Accidents (Highway Vehicle) 20 1.1 58 1.7 46 1.8 359,649 3.2 1,454 2.4 Accidents (Non-Highway Vehicle) 16 0.9 25 0.7 21 0.8 48,900 0.4 771 1.3 Accidents (Other Transportation) 11 0.6 39 1.2 28 1.1 306,693 2.8 620 1.0 Explosions 1 0.1 3 0.1 3 0.1 1,201 0.0 0 0.0 Assaults, Violent Acts 59 3.3 107 3.2 74 2.9 274,321 2.5 867 1.4 Other Events/Exposures 20 1.1 45 1.3 34 1.3 209,908 1.9 538 0.9 Nonclassifiable 38 2.1 115 3.4 69 2.7 580,812 5.2 2,557 4.3 Notes: Cost and percent totals may not add due to rounding.
WITH COST COST DAYS LOST2002 HAWAII WORKERS' COMPENSATION STATISTICS
REPORTED PROCESSED
19

% of HAWAII MAUI STATE TOTAL OAHU COUNTY COUNTY KAUAI
TOTAL 31 100.0% 18 5 4 4SEX Male 25 80.6 15 4 4 2 Female 6 19.4 3 1 0 2MARITAL STATUS Married 19 61.3 10 2 4 3 Single 11 35.5 7 3 0 1 INA 1 3.2 1 0 0 0AGE Under 18 0 0.0 0 0 0 0 18-24 1 3.2 1 0 0 0 25-34 1 3.2 0 0 1 0 35-44 4 12.9 2 1 1 0 45-54 11 35.5 6 2 1 2 55-64 10 32.3 7 1 0 2 Over 64 4 12.9 2 1 1 0INDUSTRIAL CLASSIFICATION Agriculture, Forestry 1 3.2 0 1 0 0 Construction 4 12.9 2 0 2 0 Wholesale Trade 1 3.2 1 0 0 0 Retail Trade 3 9.7 1 0 0 2 Transportation & Warehousing 6 19.4 5 1 0 0 Utilities 1 3.2 0 0 0 1 Administrative Support & Waste Management 5 16.1 3 2 0 0 Educational Services 1 3.2 1 0 0 0 Health Care & Social Assistance 1 3.2 1 0 0 0 Arts, Entertainment & Recreation 2 6.5 0 1 1 0 Accommodation & Food Service 3 9.7 2 0 1 0 Public Administration 3 9.7 2 0 0 1OCCUPATION Executive, Administrative & Managerial 1 3.2 1 0 0 0 Professional Specialty 1 3.2 0 1 0 0 Technical Support 1 3.2 1 0 0 0 Sales 3 9.7 1 0 0 2 Administrative Support 2 6.5 1 1 0 0 Protective Services 3 9.7 1 1 1 0 Other Services 4 12.9 3 1 0 0 Other Agriculture & Related 2 6.5 0 0 1 1 Mechanic, Repairer 1 3.2 0 0 0 1 Construction Trades 2 6.5 0 0 2 0 Machine Operator 2 6.5 2 0 0 0 Transportation, Material Moving 6 19.4 5 1 0 0 Handler, Helper, Laborer 2 6.5 2 0 0 0 INA 1 3.2 1 0 0 0CAUSE Heart Attack/Stroke 20 64.5 12 3 2 3 Transportation Accidents 7 22.6 4 2 1 0 Assaults, Violent Acts 2 6.5 1 0 1 0 Struck By 2 6.5 1 0 0 1Note: Percentages may not add due to rounding.
2002 HAWAII REPORTED FATALITIES
20

21
2002 HEARINGS AND DECISIONS ISSUED
East West State Oahu Hawaii Hawaii Maui Kauai HEARINGS 2806 1447 388 248 481 242DECISIONS ISSUED 9889 6150 966 683 1463 627 Act 59 Settlement 988 606 93 76 180 33 Attorney Fees 1878 1280 164 85 302 47 Denial 298 176 44 37 29 12 Disfigurement 1294 725 100 113 149 207 Fatality 18 9 3 2 4 0 Medical 718 315 89 98 138 78 Permanent Partial 2787 1895 245 163 366 118 Permanent Total 30 20 4 0 4 2 Temporary Partial 12 7 0 2 2 1 Temporary Total 469 260 67 26 51 65 Benefit Adjustments 29 22 5 1 1 0 Other 1368 835 152 80 237 64
WORKERS’ COMPENSATION MAXIMUM WEEKLY WAGE BASE AND MAXIMUM WEEKLY BENEFIT AMOUNT HISTORY
Year
Maximum Weekly
Wage Base
Maximum Weekly Benefit
Amount
Year
Maximum Weekly
Wage Base
Maximum Weekly Benefit
Amount 1975 $232.50 $155.00 1989 $537.00 $358.00 1976 $250.50 $167.00 1990 $574.47 $383.00 1977 $268.50 $179.00 1991 $617.97 $412.00 1978 $283.50 $189.00 1992 $655.47 $437.00 1979 $300.00 $200.00 1993 $689.97 $460.00 1980 $322.50 $215.00 1994 $721.46 $481.00 1981 $352.50 $235.00 1995 $736.46 $491.00 1982 $378.00 $252.00 1996 $743.96 $496.00 1983 $399.00 $266.00 1997 $751.46 $501.00 1984 $421.50 $281.00 1998 $761.96 $508.00 1985 $436.50 $291.00 1999 $778.46 $519.00 1986 $448.50 $299.00 2000 $793.46 $529.00 1987 $477.00 $318.00 2001 $820.46 $547.00 1988 $501.00 $334.00 2002 $845.96 $564.00
22
DIGEST OF THE WORKERS' COMPENSATION LAW
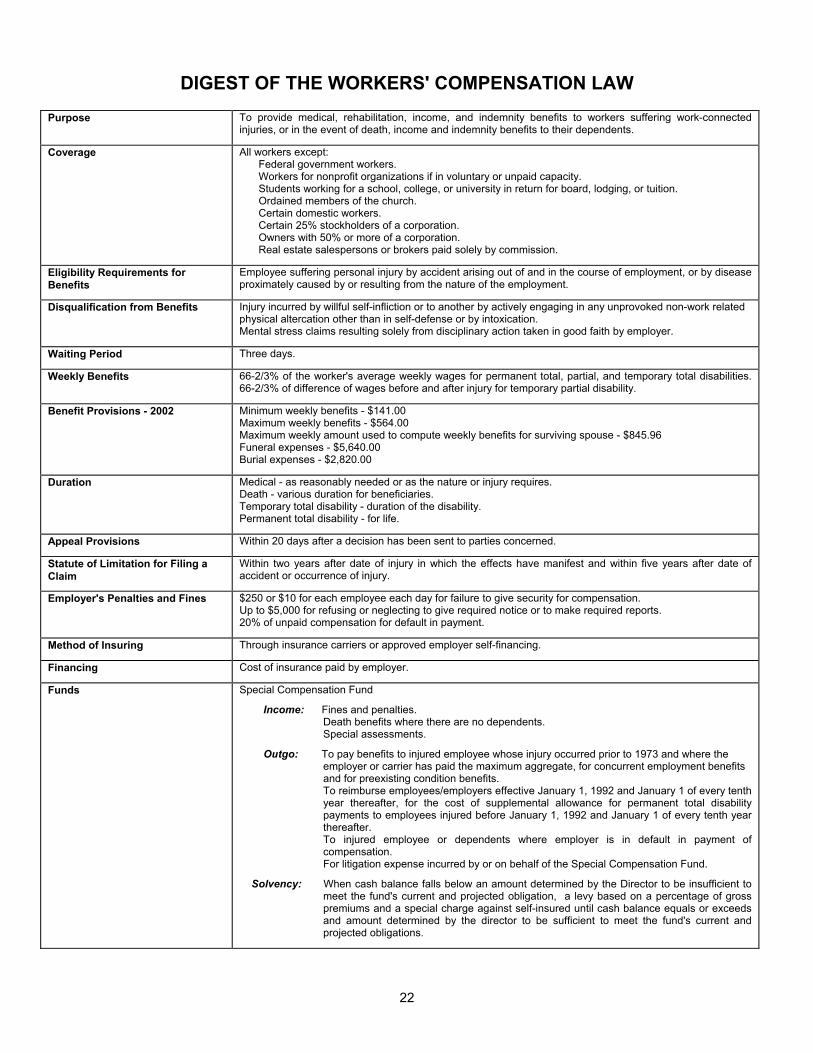
Purpose To provide medical, rehabilitation, income, and indemnity benefits to workers suffering work-connected injuries, or in the event of death, income and indemnity benefits to their dependents.
Coverage All workers except: Federal government workers. Workers for nonprofit organizations if in voluntary or unpaid capacity. Students working for a school, college, or university in return for board, lodging, or tuition. Ordained members of the church. Certain domestic workers. Certain 25% stockholders of a corporation. Owners with 50% or more of a corporation. Real estate salespersons or brokers paid solely by commission.
Eligibility Requirements for Benefits
Employee suffering personal injury by accident arising out of and in the course of employment, or by disease proximately caused by or resulting from the nature of the employment.
Disqualification from Benefits Injury incurred by willful self-infliction or to another by actively engaging in any unprovoked non-work related physical altercation other than in self-defense or by intoxication. Mental stress claims resulting solely from disciplinary action taken in good faith by employer.
Waiting Period Three days.
Weekly Benefits 66-2/3% of the worker's average weekly wages for permanent total, partial, and temporary total disabilities. 66-2/3% of difference of wages before and after injury for temporary partial disability.
Benefit Provisions - 2002 Minimum weekly benefits - $141.00 Maximum weekly benefits - $564.00 Maximum weekly amount used to compute weekly benefits for surviving spouse - $845.96 Funeral expenses - $5,640.00 Burial expenses - $2,820.00
Duration Medical - as reasonably needed or as the nature or injury requires. Death - various duration for beneficiaries. Temporary total disability - duration of the disability. Permanent total disability - for life.
Appeal Provisions Within 20 days after a decision has been sent to parties concerned.
Statute of Limitation for Filing a Claim
Within two years after date of injury in which the effects have manifest and within five years after date of accident or occurrence of injury.
Employer's Penalties and Fines $250 or $10 for each employee each day for failure to give security for compensation. Up to $5,000 for refusing or neglecting to give required notice or to make required reports. 20% of unpaid compensation for default in payment.
Method of Insuring Through insurance carriers or approved employer self-financing.
Financing Cost of insurance paid by employer.
Funds Special Compensation Fund
Income: Fines and penalties. Death benefits where there are no dependents. Special assessments.
Outgo: To pay benefits to injured employee whose injury occurred prior to 1973 and where the employer or carrier has paid the maximum aggregate, for concurrent employment benefits and for preexisting condition benefits. To reimburse employees/employers effective January 1, 1992 and January 1 of every tenth year thereafter, for the cost of supplemental allowance for permanent total disability payments to employees injured before January 1, 1992 and January 1 of every tenth year thereafter. To injured employee or dependents where employer is in default in payment of compensation. For litigation expense incurred by or on behalf of the Special Compensation Fund.
Solvency: When cash balance falls below an amount determined by the Director to be insufficient to meet the fund's current and projected obligation, a levy based on a percentage of gross premiums and a special charge against self-insured until cash balance equals or exceeds and amount determined by the director to be sufficient to meet the fund's current and projected obligations.

DEFINITIONS
Attendant Services Cost of services of an attendant for a totally disabled employee.
Average Cost Per Case Total compensation costs divided by the number of processed cases with cost.
Compensation Orders Decisions made on controverted cases, on awarding of permanent partial disability and disfigurement, and on reopening cases.
Costs All payments accorded to a claimant to include disability, death, disfigurement, vocational rehabilitation, attendant services, and medical payments.
Days Lost Number of compensated days in which injured workers were not able to work because of temporary total disability. This excludes the three-day waiting period.
Disfigurement Scar, deformity, discoloration, or other disfiguring consequences resulting from the injury or caused by medical, surgical, and hospital treatment of the employee. This is separate from permanent partial disability.
Employment That portion of the work force covered by Workers' Compensation law. Annual average taken from the "Employment and Payrolls in Hawaii" report excluding federal government employees.
Event or Exposure Identifies the circumstance, which directly resulted in the injury or illness.
Industry Identifies employers by the major type of activity in which they are engaged.
Medical Physicians and hospital costs and costs for services and supplies.
Nature of Injury or Illness Identifies the injury or illness in terms of its principal physical characteristic.
Occupation Identifies the nature of work of the employee.
Part of Body Identifies the part of the worker's body directly affected by the injury or illness.
Permanent Partial Disability Injury or illness which results in the complete loss or loss of any member or part of the body or any permanent impairment of functions of the body or part thereof, regardless of any pre-existing disability.
Permanent Total Disability Any injury or illness other than death, which permanently and totally incapacitates an employee from following any gainful occupation.
Processed Cases Cases, which have been subject to screening procedures, the injury or illness medically evaluated, and all medical costs and workers’ compensation payments totaled. Includes injuries and illnesses, which occurred in the report year or prior years.
Reported Injuries and Illnesses (Reported Cases)
All injuries and illnesses reported to the Disability Compensation Division. These reported injuries or illnesses may not have occurred during the report year.
Reported Fatalities Any death resulting from an on-the-job injury or illness reported to the Disability Compensation Division.
Source of Injury or Illness Identifies the object, substance, exposure, or bodily motion, which directly produced or inflicted the injury or illness.
Temporary Partial Disability A work injury or illness which causes partial rather than total disability for temporary periods. The injured worker is paid a weekly benefit amount of 66-2/3 percent of the difference between his average weekly wages before the injury and his weekly earnings thereafter for the duration of the disability.
Temporary Total Disability A common type of disability where the work injury or illness causes total disability for temporary periods. The employer or insurance carrier, for the duration of the disability, but not including the first three days, pays the injured worker a weekly benefit amount of 66-2/3 percent of his average weekly wages, but not more than the maximum weekly benefit amount nor less than the minimum weekly benefit amount, if his average weekly wages are less than the minimum weekly benefit amount, at a rate of 100 percent of his average weekly wages.
Vocational Rehabilitation Cost of physical and vocational rehabilitation services.
23
TECHNICAL NOTES The Workers’ Compensation Data Book is based on the annual accumulation of data in the State of Hawaii, Disability Compensation database. 1. The following coding systems and locally revised versions were used to categorize data:
a) Industrial attachment is determined by the principal activity of the employer as defined in the North American Industry Classification System 2002 (NAICS). The new NAICS industry groupings better reflect the workings of the U.S. economy, particularly in the services sector. NAICS, developed using a production oriented conceptual framework, groups establishments into industries based on the activity in which they are primarily engaged. It is not an update of the Standard Industrial Classification (SIC) system. NAICS focuses on how products and services are created. More information on NAICS is available at the U.S. Census Bureau website at http://www.census.gov/epcd/www/naics.html.
b) Codes and definitions used to categorize Nature of Injury or Illness, Part of Body Affected, Source of Injury or Illness, and Event or Exposure were modeled after the 1992 Bureau of Labor Statistics (BLS) Occupational Injury and Illness Classification Structures (OIICS). Starting with 1996 data, BLS OIICS data codes were locally modified to 2 digits instead of 4 digits, making the data less detailed.
c) Occupational groups are based on the 1990 Alphabetical Index of Industries and Occupations, developed and published by the Bureau of the Census, Washington, D.C., U.S. Government Printing Office. Starting with 1996 data, the occupation classifications were locally modified, making the data less detailed.
2. From 1999, the employment data source used in the Worker’s Compensation Data Book has been
changed. Instead of the Labor Force Data Book employment we are using the Employment and Payrolls in Hawaii statistics. Employment data from the later publication may be more in line with workers covered under the Workers’ Compensation program. Caution should be taken when reviewing the employment and frequency data for trend analysis prior to 1999.
3. From 2000, the table Hearings and Decisions Issued (previously called Compensation Orders Issued
and Number of Hearings) has changed to include Act 59 settlements and attorney fees. The combined category Permanent Partial & Disfigurement no longer exists. Figures are reported under the category with the highest severity. For example: a case with disability payments and disfigurement award would be counted in the disability category and not in disfigurement.
24