worker health chartbook, 2000 - centers for … injury department of health and human services...
TRANSCRIPT

Nonfatal Injury
DEPARTMENT OF HEALTH AND HUMAN SERVICESCenters for Disease Control and PreventionNational Institute for Occupational Safety and Health
Worker Health Chartbook, 2000


Worker Health Chartbook, 2000Nonfatal Injury
Department of Health and Human ServicesCenters for Disease Control and PreventionNational Institute for Occupational Safety and Health

DISCLAIMER
○ ○ ○ ○ ○ ○ ○ ○ ○ ○ ○ ○ ○ ○ ○ ○ ○ ○ ○ ○ ○ ○ ○ ○ ○ ○ ○ ○ ○ ○ ○ ○ ○ ○ ○ ○ ○ ○ ○ ○ ○ ○ ○ ○ ○ ○ii
DISCLAIMER
Mention of any company or product does not constitute endorsementby NIOSH. Some data have been changed since the September 2000chartbook publication, including outdated Internet links.
This document is in the public domainand may be freely copied or reprinted.
DHHS (NIOSH) Publication Number 2002-119
April 2002

FOREWORD
○ ○ ○ ○ ○ ○ ○ ○ ○ ○ ○ ○ ○ ○ ○ ○ ○ ○ ○ ○ ○ ○ ○ ○ ○ ○ ○ ○ ○ ○ ○ ○ ○ ○ ○ ○ ○ ○ ○ ○ ○ ○ ○ ○ ○ ○ iii
FOREWORD
The content of this booklet is taken from the Worker Health Chartbook, 2000(DHHS NIOSH Publication No. 2000-127), a comprehensive guide tosurveillance data for work-related fatal and nonfatal injury and illness. The
publication of the chartbook is an important step toward identifying and fillingsignificant gaps in workplace injury and illness information. Several Federal agenciesworked with NIOSH to compile data for the chartbook, using a variety of systemsthat track the nature, prevalence, and incidence of workplace injuries and diseases.These data help us identify new and emerging problems, analyze trends over time,target and evaluate the effectiveness of intervention efforts, and anticipate futureneeds and concerns. This booklet highlights nonfatal injury. It is intended for anyoneinterested in this topic, including occupational safety and health practitioners, policymakers, health care providers, educators, researchers, workers, and employers. Thetracking of injury and illness is a cornerstone of prevention. We hope this bookletcontributes to that effort.
Kathleen M. Rest, Ph.D., M.P.A.Acting DirectorNational Institute for OccupationalSafety and Health

ORDERING INFORMATION
○ ○ ○ ○ ○ ○ ○ ○ ○ ○ ○ ○ ○ ○ ○ ○ ○ ○ ○ ○ ○ ○ ○ ○ ○ ○ ○ ○ ○ ○ ○ ○ ○ ○ ○ ○ ○ ○ ○ ○ ○ ○ ○ ○ ○ ○iv
ORDERING INFORMATION
To receive copies of chartbook chapters, the entiredocument, or more information about occupationalsafety and health topics, contact the National Institutefor Occupational Safety and Health (NIOSH) at
NIOSH—Publications Dissemination4676 Columbia ParkwayCincinnati, OH 45226-1998
Telephone: 1-800-35-NIOSH (1-800-356-4674)Fax: 513-533-8573E-mail: [email protected]
or visit the NIOSH Web site at
www.cdc.gov/niosh
(2000-127) Focus on Mining (2002-121)
Nonfatal Illness (2002-120)
Fatal Illness (2002-118)
Fatal Injury (2002-117)
EXECUTIVE SUMMARY
○ ○ ○ ○ ○ ○ ○ ○ ○ ○ ○ ○ ○ ○ ○ ○ ○ ○ ○ ○ ○ ○ ○ ○ ○ ○ ○ ○ ○ ○ ○ ○ ○ ○ ○ ○ ○ ○ ○ ○ ○ ○ ○ ○ ○ ○ v
EXECUTIVE SUMMARY
During 1976–1997, the total number of nonfatal occupational injuries hasfluctuated between 4.7 and 6.4 million per year, as recorded by the Bureau ofLabor Statistics (BLS) in the Survey of Occupational Injuries and Illnesses
(SOII). However, the incidence rates for total nonfatal injuries in private industrydeclined from highs of 9.2 cases per 100 full-time workers in 1978–1979 to a low of6.6 cases per 100 full-time workers in 1997. The greatest change occurred amongcases without lost workdays, which decreased from 5.5 to 3.5 cases per 100 full-timeworkers. For 1988–1997, the rate of cases with days away from work declined 40%,but there was a 120% increase in the rate of cases with restricted work activity only.
Approximately 5.7 million injuries were reported in SOII in 1997. Those injuriesrepresent 93% of the 6.1 million injuries and illnesses documented by employer recordsin the private sector. Agriculture, construction, manufacturing, and transportationreported rates above the average of 6.6 per 100 full-time workers for all industries.Sprains, strains, and tears accounted for a disproportionately large share of cases withdays away from work (nearly 800,000 cases in 1997). Nearly half of those casesinvolved the back. Overexertion accounted for more than 60% of back injuries.
According to the National Electronic Injury Surveillance System (NEISS), occupa-tional injuries treated in hospital emergency departments numbered 3.6 million in1998. Rates for those injuries were highest among men and workers under age 25.Lacerations, punctures, sprains and strains, contusions, abrasions, and hematomasaccounted for 70% of all injuries treated in emergency departments.


CONTENTS
○ ○ ○ ○ ○ ○ ○ ○ ○ ○ ○ ○ ○ ○ ○ ○ ○ ○ ○ ○ ○ ○ ○ ○ ○ ○ ○ ○ ○ ○ ○ ○ ○ ○ ○ ○ ○ ○ ○ ○ ○ ○ ○ ○ ○ ○ vii
CONTENTS
FOREWORD ...................................................................................... iii
EXECUTIVE SUMMARY ...................................................................... v
ABBREVIATIONS ............................................................................. viii
ACKNOWLEDGMENTS ...................................................................... ix
NONFATAL INJURY.............................................................................1
Nonfatal Occupational Injuries by Industry and Cases with Lost Workdays .... 5Characteristics of Injury Cases with Days away from Work ............................. 9
Sprain, Strain, and Tear Cases with Days away from Work, 1997 .............. 10Back, Spine, or Spinal Cord Cases with Days away from Work, 1997 ....... 12Bruise and Contusion Cases with Days away from Work, 1997 ................ 14Cut and Laceration Cases with Days away from Work, 1997 .................... 16Fracture Cases with Days away from Work, 1997...................................... 18Heat Burn and Scald Cases with Days away from Work, 1997 .................. 20Amputation Cases with Days away from Work, 1997 ............................... 22
REFERENCES .................................................................................... 24

ABBREVIATIONS
○ ○ ○ ○ ○ ○ ○ ○ ○ ○ ○ ○ ○ ○ ○ ○ ○ ○ ○ ○ ○ ○ ○ ○ ○ ○ ○ ○ ○ ○ ○ ○ ○ ○ ○ ○ ○ ○ ○ ○ ○ ○ ○ ○ ○ ○viii
ABBREVIATIONS
BLS...................Bureau of Labor Statistics
CI ..................... confidence interval
DHHS ..............U.S. Department of Health and Human Services
NEISS...............National Electronic Injury Surveillance System
NHAMCS ........National Hospital Ambulatory Medical Care Survey
NIOSH ............National Institute for Occupational Safety and Health
SOII ................. Survey of Occupational Injuries and Illnesses
ACKNOWLEDGMENTS
○ ○ ○ ○ ○ ○ ○ ○ ○ ○ ○ ○ ○ ○ ○ ○ ○ ○ ○ ○ ○ ○ ○ ○ ○ ○ ○ ○ ○ ○ ○ ○ ○ ○ ○ ○ ○ ○ ○ ○ ○ ○ ○ ○ ○ ○ ix
ACKNOWLEDGMENTS
This document was prepared by the staff of the National Institute for Occupa-tional Safety and Health (NIOSH). All contributors are affiliated with NIOSHunless otherwise indicated. We extend special thanks to our technical reviewers
for their constructive comments and suggestions.
EditorsRoger R. Rosa, Ph.D.Michael J. Hodgson, M.D.R. Alan Lunsford, Ph.D.E. Lynn Jenkins, M.A.Kathleen Rest, Ph.D.
Document DesignDavid Peabody, Synectics for Management Decisions, Inc.Suzanne Meadows Hogan, M.A.Chris Cromwell, Synectics for Management Decisions, Inc.Toni Garrison, Synectics for Management Decisions, Inc.
ContributorsToni Alterman, Ph.D.Ricki Althouse, M.S.Ki Moon Bang, Ph.D.Margot Barnett, M.S., Strategic Options ConsultingJerome M. Blondell, Ph.D., M.P.H., U.S. Environmental Protection AgencyWinifred L. Boal, Ph.D.Richard Braddee, M.S.Carol Burnett, M.S.Geoffery Calvert, M.D., M.P.H.Scott Campbell, National Center for Infectious DiseasesDenise M. Cardo, M.D., National Center for Infectious DiseasesRobert Castellan, M.D., M.P.H.Virgil CasiniJanice Devine, M.S., Bureau of Labor StatisticsAnn N. Do, M.D., National Center for HIV, STD, and TB PreventionBarbara Fotta, M.S.Jennifer Flattery, M.P.H., California Department of Health Services

ACKNOWLEDGMENTS
○ ○ ○ ○ ○ ○ ○ ○ ○ ○ ○ ○ ○ ○ ○ ○ ○ ○ ○ ○ ○ ○ ○ ○ ○ ○ ○ ○ ○ ○ ○ ○ ○ ○ ○ ○ ○ ○ ○ ○ ○ ○ ○ ○ ○ ○x
Janie L. Gittleman, Ph.D., M.R.P.Robert Harrison, M.D., M.P.H., California Department of Health ServicesDan Hecker, M.S., Bureau of Labor StatisticsSteven Hipple, M.S., Bureau of Labor StatisticsJanice Huy, M.S.Larry Jackson, Ph.D.Angela Booth Jones, M.S.Larry Layne, M.A.Suzanne MarshElizabeth Marshall, M.S., M.P.H., New York State Department of HealthLinda McCaig, M.P.H., National Center for Health StatisticsLouise N. Mehler, M.D., California Environmental Protection AgencyTeri PalermoAdelisa L. Panlilio, M.D., M.P.H., National Center for Infectious DiseasesAudrey PodlesnyMary Jo Reilly, M.S., Michigan Department of Public Health, Michigan State UniversityRobert Roscoe, M.S.Kenneth Sacks, Ph.D., M.B.A.Lee Sanderson, Ph.D.John Sestito, J.D.Jackilen Shannon, Ph.D., Texas Department of HealthRosemary Sokas, M.D., M.O.H.Lisa ThomasCatherine Thomsen, M.P.H., Oregon Health DivisionJames Walker, Ph.D.John M. Wood, M.S.William Weber, M.S., Bureau of Labor StatisticsIan T. Williams, Ph.D., M.S., National Center for Infectious Diseases
Technical ReviewersHeinz Ahlers, J.D.Letitia Davis, Sc.D., Massachusetts Department of HealthRick Ehrenberg, M.D., M.P.H.William Eschenbacher, M.D.Larry Grayson, Ph.D.William Halperin, M.D., M.P.H.Joseph Hurrell, Ph.D.Jeff Kohler, Ph.D.Gail McConnell, V.M.D.

ACKNOWLEDGMENTS
○ ○ ○ ○ ○ ○ ○ ○ ○ ○ ○ ○ ○ ○ ○ ○ ○ ○ ○ ○ ○ ○ ○ ○ ○ ○ ○ ○ ○ ○ ○ ○ ○ ○ ○ ○ ○ ○ ○ ○ ○ ○ ○ ○ ○ ○ xi
Kenneth Rosenman, M.D., Michigan State UniversityMitchell Singal, M.D., M.P.H.Nancy Stout, Ed.D.Gregory Wagner, M.D.Carol Wilkinson, M.D., IBM Corporation
Editorial and Production SupportVanessa BecksShirley CarrSusan FeldmannLawrence FosterAnne C. HamiltonMarie Haring-Sweeney, Ph.D.Susan KaelinBarbara LandrethCharlene MaloneyLucy SchoolfieldMichelle ThompsonKristina WasmundJane Weber, M.Ed.Wendy Wippel, M.S.


NONFATAL INJURY
○ ○ ○ ○ ○ ○ ○ ○ ○ ○ ○ ○ ○ ○ ○ ○ ○ ○ ○ ○ ○ ○ ○ ○ ○ ○ ○ ○ ○ ○ ○ ○ ○ ○ ○ ○ ○ ○ ○ ○ ○ ○ ○ ○ ○ ○ 1
NONFATAL INJURY
Three surveillance systems provide information about the characteristics ofnonfatal occupational injuries: the Survey of Occupational Injuries and Illnesses(SOII), the National Electronic Injury Surveillance System (NEISS), and the
National Hospital Ambulatory Medical Care Survey (NHAMCS). SOII is based onemployer-generated workplace incident logs, and NEISS and NHAMCS are based onvisits to emergency departments in hospitals. NEISS and NHAMCS both collect dataon occupational injuries, but they use different methods.
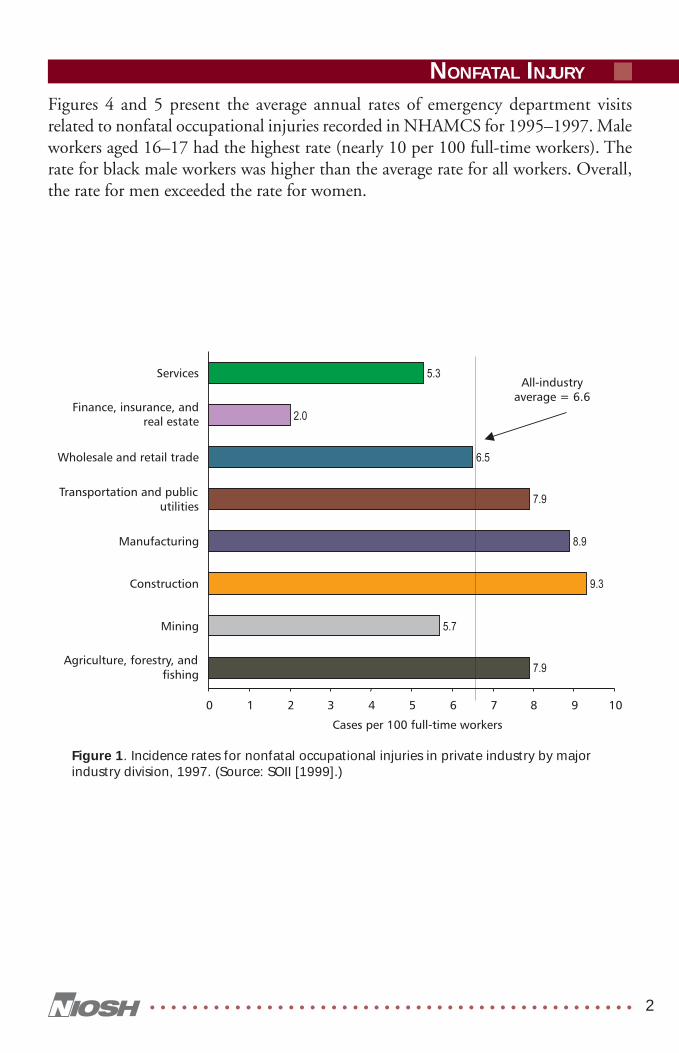
Nonfatal occupational injuries constitute more than 90% of the events recorded bySOII. In 1997, more than 5.7 million nonfatal occupational injuries were estimatedto have occurred in the United States, resulting in a rate of 6.6 cases per 100 full-time,private-sector workers. Among industry divisions, incidence rates for the totalnumber of nonfatal injuries ranged from a low of 2.0 cases per 100 full-time workersin finance, insurance, and real estate to a high of 9.3 cases per 100 full-time workers inconstruction (Figure 1). Rates for four of the eight industry divisions are above theaverage for all industries.
Injuries treated in emergency departments* are usually more urgent or severe thanthose treated in physicians’ offices or walk-in clinics. NEISS estimates that approxi-mately 3.6 million nonfatal occupational injuries were treated in U.S. hospitalemergency departments in 1998. The average rate for all nonfatal occupational inju-ries treated in emergency departments that year was 2.8 per 100 full-time workers.The rate for men (3.4 per 100 full-time workers) was nearly twice the rate for women(2 per 100 full-time workers) (Figure 2). Rates were higher in younger workers (aged16 to 19), with steady declines in both male and female workers aged 20 and older(Figure 2). Hands and fingers were the most commonly injured parts of the body,accounting for 30% of the total (Figure 3). Lacerations and punctures (26%), sprainsand strains (25%), and contusions, abrasions, and hematomas (19%) were the mostfrequent types of injuries recorded in NEISS in 1998.
*The term emergency departments is used in this chapter to refer to hospital emergency rooms(NEISS data) as well as to hospital outpatient departments and hospital emergencydepartments (NHAMCS data).
NONFATAL INJURY
○ ○ ○ ○ ○ ○ ○ ○ ○ ○ ○ ○ ○ ○ ○ ○ ○ ○ ○ ○ ○ ○ ○ ○ ○ ○ ○ ○ ○ ○ ○ ○ ○ ○ ○ ○ ○ ○ ○ ○ ○ ○ ○ ○ ○ ○ 2
Figures 4 and 5 present the average annual rates of emergency department visitsrelated to nonfatal occupational injuries recorded in NHAMCS for 1995–1997. Maleworkers aged 16–17 had the highest rate (nearly 10 per 100 full-time workers). Therate for black male workers was higher than the average rate for all workers. Overall,the rate for men exceeded the rate for women.
Figure 1. Incidence rates for nonfatal occupational injuries in private industry by majorindustry division, 1997. (Source: SOII [1999].)

NONFATAL INJURY
○ ○ ○ ○ ○ ○ ○ ○ ○ ○ ○ ○ ○ ○ ○ ○ ○ ○ ○ ○ ○ ○ ○ ○ ○ ○ ○ ○ ○ ○ ○ ○ ○ ○ ○ ○ ○ ○ ○ ○ ○ ○ ○ ○ ○ ○ 3
Figure 2. Rate of nonfatal occupational injuries treated in emergency departments, byage and sex, 1998. (Source: NEISS [1999].)
Figure 3. Number of nonfatal occupational injuries treated in emergency departments,by anatomic site and type of injury, 1998. (Source: NEISS [1999].)

NONFATAL INJURY
○ ○ ○ ○ ○ ○ ○ ○ ○ ○ ○ ○ ○ ○ ○ ○ ○ ○ ○ ○ ○ ○ ○ ○ ○ ○ ○ ○ ○ ○ ○ ○ ○ ○ ○ ○ ○ ○ ○ ○ ○ ○ ○ ○ ○ ○ 4
Figure 4. Annual rates (and 95% CIs) of emergency department visits related to nonfataloccupational injuries in male and female workers aged 16 and older, by age group—averaged for 1995–1997. (The rate for female workers aged 16–17 does not meet thestandards of reliability or precision.) (Source: NHAMCS [1999].)
Figure 5. Annual rates (and 95% CIs) of emergency department visits related to nonfataloccupational injuries in black and white male and female workers aged 16 and older—averaged for 1995–1997. (Source: NHAMCS [1999].)

NONFATAL INJURY
○ ○ ○ ○ ○ ○ ○ ○ ○ ○ ○ ○ ○ ○ ○ ○ ○ ○ ○ ○ ○ ○ ○ ○ ○ ○ ○ ○ ○ ○ ○ ○ ○ ○ ○ ○ ○ ○ ○ ○ ○ ○ ○ ○ ○ ○ 5
Nonfatal Occupational Injuries by Industryand Cases with Lost Workdays
The total number of nonfatal occupational injuries recorded by the Bureau of LaborStatistics (BLS) in SOII has fluctuated between 4.7 and 6.4 million per year over thelast two decades. Many of these cases involved lost workdays.† The number of caseswith days away from work fluctuated during that period; however, there was a 10-foldincrease in cases with restricted work activity only (Figure 6). By 1997, 53% of casesinvolved no time away from work, 31% required at least 1 day away from work, and16% involved restricted work activity only.
The incidence rate for total nonfatal occupational injuries over the past two decadesranged from a high of 9.2 cases per 100 full-time workers in 1978–1979 to a low of6.6 cases per 100 full-time workers in 1997 (Figure 7). The incidence rate for caseswith days away from work declined steadily from 1988 to 1997, and the incidencerate rose 120% for cases involving restricted work activity only.
Incidence rates for lost-workday cases of nonfatal occupational injury are shown for1992–1997 by industry division in Figure 8. For all private industry during thisperiod, the incidence rate declined 14% to 3.1 cases per 100 full-time workers.Finance, insurance, and real estate had the largest relative decline (27%), andconstruction had the largest absolute decline (1.3 cases per 100 full-time workers).Transportation and public utilities showed the least decline, both relatively (4%) andabsolutely (0.2 cases per 100 full-time workers). Injury cases with and without lostworkdays in 1997 (including days away from work and days of restricted activity only)are shown by industry division in Figure 9. The number of injuries ranged from a lowof 46,000 in mining to a high of 1.7 million in manufacturing. The percentage ofinjury cases involving lost workdays ranged from a low of 38% in finance, insurance,and real estate to a high of 73% in mining.
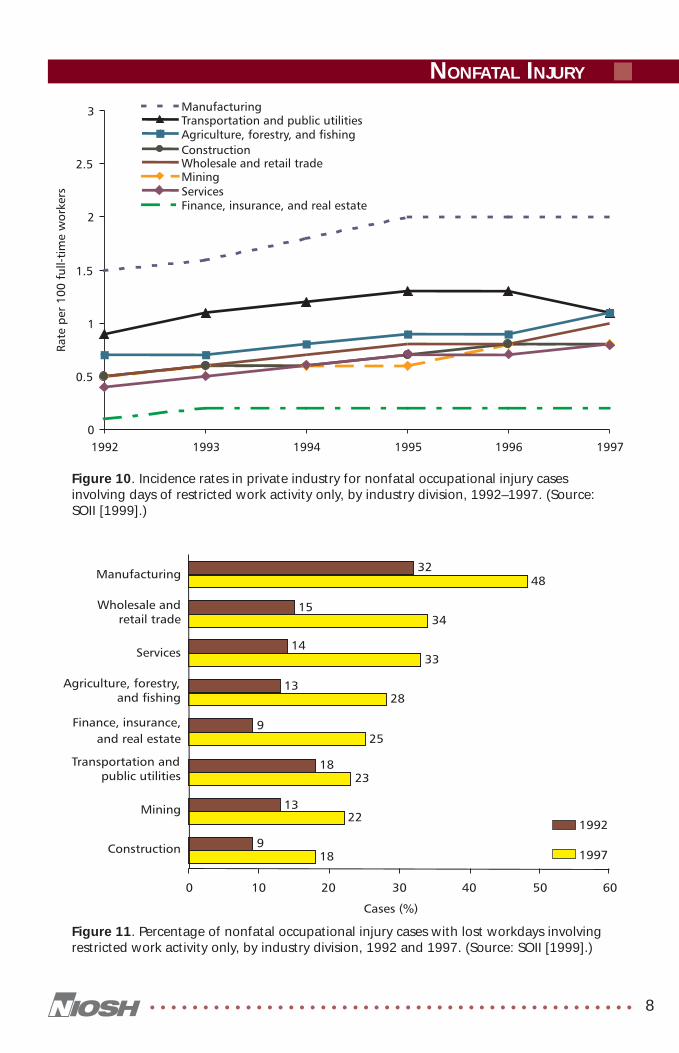
The increasing incidence rate for cases involving restricted work activity only (Figure 7)is presented by industry division in Figure 10 for 1992–1997. The percentage of caseswith restricted work activity only is shown for each industry division in Figure 11for 1992 and 1997. In both years, manufacturing had the largest percentage of lost-workday cases with restricted activity only (32% and 48%, respectively).
†Lost-workday cases include cases with days away from work and cases with restricted workactivity only (i.e., cases in which workers report to their jobs for limited duty).

NONFATAL INJURY
○ ○ ○ ○ ○ ○ ○ ○ ○ ○ ○ ○ ○ ○ ○ ○ ○ ○ ○ ○ ○ ○ ○ ○ ○ ○ ○ ○ ○ ○ ○ ○ ○ ○ ○ ○ ○ ○ ○ ○ ○ ○ ○ ○ ○ ○ 6
Figure 7. Incidence rate of nonfatal occupational injury cases in private industry by typeof case, 1976–1997. (Source: SOII [1999].)
Figure 6. Number of nonfatal occupational injury cases in private industry by type ofcase, 1976–1997. (Source: SOII [1999].)

NONFATAL INJURY
○ ○ ○ ○ ○ ○ ○ ○ ○ ○ ○ ○ ○ ○ ○ ○ ○ ○ ○ ○ ○ ○ ○ ○ ○ ○ ○ ○ ○ ○ ○ ○ ○ ○ ○ ○ ○ ○ ○ ○ ○ ○ ○ ○ ○ ○ 7
Figure 9. Number of nonfatal occupational injury cases in private industry without andwith lost workdays by industry division, 1997. Percentage of cases with lost workdaysalso is shown. (Source: SOII [1999].)
Figure 8. Incidence rates for lost-workday cases of nonfatal occupational injury in privateindustry by industry division, 1992–1997. (Source: SOII [1999].)
NONFATAL INJURY
○ ○ ○ ○ ○ ○ ○ ○ ○ ○ ○ ○ ○ ○ ○ ○ ○ ○ ○ ○ ○ ○ ○ ○ ○ ○ ○ ○ ○ ○ ○ ○ ○ ○ ○ ○ ○ ○ ○ ○ ○ ○ ○ ○ ○ ○ 8
Figure 11. Percentage of nonfatal occupational injury cases with lost workdays involvingrestricted work activity only, by industry division, 1992 and 1997. (Source: SOII [1999].)
Figure 10. Incidence rates in private industry for nonfatal occupational injury casesinvolving days of restricted work activity only, by industry division, 1992–1997. (Source:SOII [1999].)

NONFATAL INJURY
○ ○ ○ ○ ○ ○ ○ ○ ○ ○ ○ ○ ○ ○ ○ ○ ○ ○ ○ ○ ○ ○ ○ ○ ○ ○ ○ ○ ○ ○ ○ ○ ○ ○ ○ ○ ○ ○ ○ ○ ○ ○ ○ ○ ○ ○ 9
Characteristics of Injury Caseswith Days away from Work
The total number of nonfatal occupational injury cases involving days away fromwork for 1992–1997 is shown in Figure 12 for seven injury categories. Sprains, strains,and tears accounted for the largest number of events, with approximately 799,000cases in 1997. Nearly half those cases (about 385,000) involved the back, accountingfor more than 80% of all traumatic injuries and disorders to the back. Other catego-ries accounting for many days away from work included bruises and contusions (withnearly 166,000 cases in 1997), cuts and lacerations (with approximately 134,000 cases),and fractures (with approximately 119,000 cases). Presented separately for each of theseven injury categories are charts showing the distributions of cases by (1) majorindustries, (2) occupational groups, and (3) the sources of the disorder, events orexposures leading to the disorder, or the body parts affected.
Figure 12. Number of nonfatal occupational injury cases with days away from work inprivate industry by type of injury, 1992–1997. (Source: SOII [1999].)

NONFATAL INJURY
○ ○ ○ ○ ○ ○ ○ ○ ○ ○ ○ ○ ○ ○ ○ ○ ○ ○ ○ ○ ○ ○ ○ ○ ○ ○ ○ ○ ○ ○ ○ ○ ○ ○ ○ ○ ○ ○ ○ ○ ○ ○ ○ ○ ○ ○ 10
Sprain, Strain, and Tear Cases with Days away from Work, 1997
Nearly half of the approximately 799,000 cases of sprains, strains, and tears involvingdays away from work in 1997 occurred in services (27%) and manufacturing (21%)(Figure 13). Most of these injuries were experienced by operators, fabricators, andlaborers (42%) and service personnel (19%) (Figure 14). Overexertion was the mostcommon event leading to a sprain, strain, or tear (Figure 15). Men accounted fornearly two-thirds of the sprain, strain, and tear cases. Half of the cases required 6 ormore days away from work.
Figure 13. Number and distribution of sprain, strain, and tear cases with days away fromwork in private industry by industry division, 1997. (Source: SOII [1999].)

NONFATAL INJURY
○ ○ ○ ○ ○ ○ ○ ○ ○ ○ ○ ○ ○ ○ ○ ○ ○ ○ ○ ○ ○ ○ ○ ○ ○ ○ ○ ○ ○ ○ ○ ○ ○ ○ ○ ○ ○ ○ ○ ○ ○ ○ ○ ○ ○ ○ 11
Figure 14. Number and distribution of sprain, strain, and tear cases with days away fromwork in private industry by occupational group, 1997. (Source: SOII [1999].)
Figure 15. Number and distribution of sprain, strain, and tear cases with days away fromwork in private industry by event or exposure, 1997. (Source: SOII [1999].)
NONFATAL INJURY
○ ○ ○ ○ ○ ○ ○ ○ ○ ○ ○ ○ ○ ○ ○ ○ ○ ○ ○ ○ ○ ○ ○ ○ ○ ○ ○ ○ ○ ○ ○ ○ ○ ○ ○ ○ ○ ○ ○ ○ ○ ○ ○ ○ ○ ○ 12
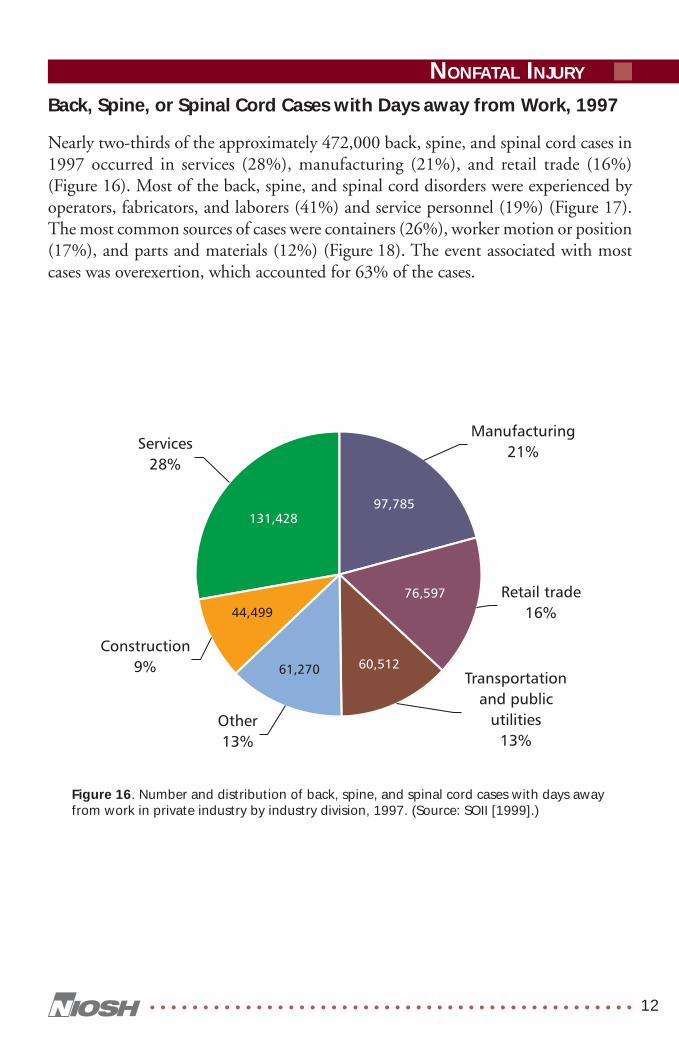
Back, Spine, or Spinal Cord Cases with Days away from Work, 1997
Nearly two-thirds of the approximately 472,000 back, spine, and spinal cord cases in1997 occurred in services (28%), manufacturing (21%), and retail trade (16%)(Figure 16). Most of the back, spine, and spinal cord disorders were experienced byoperators, fabricators, and laborers (41%) and service personnel (19%) (Figure 17).The most common sources of cases were containers (26%), worker motion or position(17%), and parts and materials (12%) (Figure 18). The event associated with mostcases was overexertion, which accounted for 63% of the cases.
Figure 16. Number and distribution of back, spine, and spinal cord cases with days awayfrom work in private industry by industry division, 1997. (Source: SOII [1999].)

NONFATAL INJURY
○ ○ ○ ○ ○ ○ ○ ○ ○ ○ ○ ○ ○ ○ ○ ○ ○ ○ ○ ○ ○ ○ ○ ○ ○ ○ ○ ○ ○ ○ ○ ○ ○ ○ ○ ○ ○ ○ ○ ○ ○ ○ ○ ○ ○ ○ 13
Figure 18. Number and distribution of back, spine, and spinal cord cases with days awayfrom work in private industry by source of disorder, 1997. (Source: SOII [1999].)
Figure 17. Number and distribution of back, spine, and spinal cord cases with days awayfrom work in private industry by occupational group, 1997. (Source: SOII [1999].)
NONFATAL INJURY
○ ○ ○ ○ ○ ○ ○ ○ ○ ○ ○ ○ ○ ○ ○ ○ ○ ○ ○ ○ ○ ○ ○ ○ ○ ○ ○ ○ ○ ○ ○ ○ ○ ○ ○ ○ ○ ○ ○ ○ ○ ○ ○ ○ ○ ○ 14
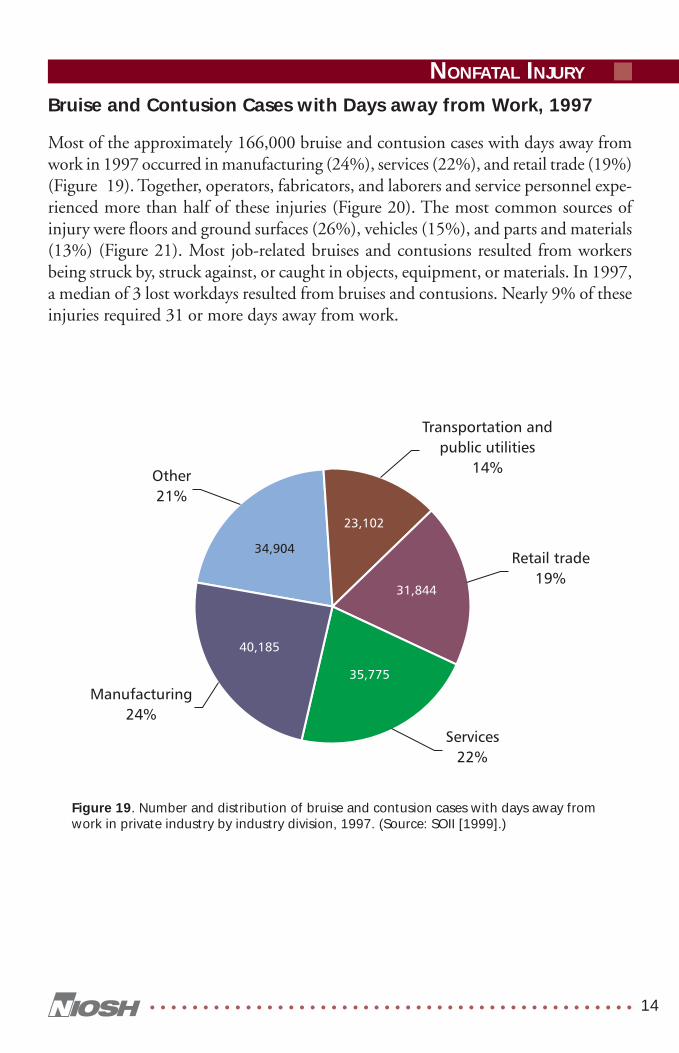
Bruise and Contusion Cases with Days away from Work, 1997
Most of the approximately 166,000 bruise and contusion cases with days away fromwork in 1997 occurred in manufacturing (24%), services (22%), and retail trade (19%)(Figure 19). Together, operators, fabricators, and laborers and service personnel expe-rienced more than half of these injuries (Figure 20). The most common sources ofinjury were floors and ground surfaces (26%), vehicles (15%), and parts and materials(13%) (Figure 21). Most job-related bruises and contusions resulted from workersbeing struck by, struck against, or caught in objects, equipment, or materials. In 1997,a median of 3 lost workdays resulted from bruises and contusions. Nearly 9% of theseinjuries required 31 or more days away from work.
Figure 19. Number and distribution of bruise and contusion cases with days away fromwork in private industry by industry division, 1997. (Source: SOII [1999].)

NONFATAL INJURY
○ ○ ○ ○ ○ ○ ○ ○ ○ ○ ○ ○ ○ ○ ○ ○ ○ ○ ○ ○ ○ ○ ○ ○ ○ ○ ○ ○ ○ ○ ○ ○ ○ ○ ○ ○ ○ ○ ○ ○ ○ ○ ○ ○ ○ ○ 15
Figure 20. Number and distribution of bruise and contusion cases with days away fromwork in private industry by occupational group, 1997. (Source: SOII [1999].)
Figure 21. Number and distribution of bruise and contusion cases with days away fromwork in private industry by source of disorder, 1997. (Source: SOII [1999].)

NONFATAL INJURY
○ ○ ○ ○ ○ ○ ○ ○ ○ ○ ○ ○ ○ ○ ○ ○ ○ ○ ○ ○ ○ ○ ○ ○ ○ ○ ○ ○ ○ ○ ○ ○ ○ ○ ○ ○ ○ ○ ○ ○ ○ ○ ○ ○ ○ ○ 16
Cut and Laceration Cases with Days away from Work, 1997
More than half of the approximately 134,000 cut and laceration cases with days awayfrom work in 1997 were in manufacturing (28%) or retail trade (26%) (Figure 22).Operators, fabricators, and laborers experienced 42% of cuts and lacerations, andprecision production, craft, and repair personnel experienced 24% (Figure 23). Themost common sources of injury were floors and ground surfaces (25%), machinery(21%), and parts and materials (20%) (Figure 24). Finger cuts and lacerationsaccounted for half of all cuts and lacerations involving days away from work. Amedian of 3 days away from work resulted from cuts and lacerations.
Figure 22. Number and distribution of cut and laceration cases with days away fromwork in private industry by industry division, 1997. (Source: SOII [1999].)

NONFATAL INJURY
○ ○ ○ ○ ○ ○ ○ ○ ○ ○ ○ ○ ○ ○ ○ ○ ○ ○ ○ ○ ○ ○ ○ ○ ○ ○ ○ ○ ○ ○ ○ ○ ○ ○ ○ ○ ○ ○ ○ ○ ○ ○ ○ ○ ○ ○ 17
Figure 23. Number and distribution of cut and laceration cases with days away fromwork in private industry by occupational group, 1997. (Source: SOII [1999].)
Figure 24. Number and distribution of cut and laceration cases with days away fromwork in private industry by source of disorder, 1997. (Source: SOII [1999].)

NONFATAL INJURY
○ ○ ○ ○ ○ ○ ○ ○ ○ ○ ○ ○ ○ ○ ○ ○ ○ ○ ○ ○ ○ ○ ○ ○ ○ ○ ○ ○ ○ ○ ○ ○ ○ ○ ○ ○ ○ ○ ○ ○ ○ ○ ○ ○ ○ ○ 18
Fracture Cases with Days away from Work, 1997
Most of the approximately 119,000 fracture cases with days away from work in 1997occurred in manufacturing (25%), services (18%), and construction (16%) (Figure 25).Most of these injuries were experienced by operators, fabricators, and laborers (43%)and precision production, craft, and repair personnel (23%) (Figure 26). The mostcommon sources of injury were floor and ground surfaces (43%) and parts and mate-rials (14%) (Figure 27). Half of the occupational fractures in 1997 required 21 ormore days away from work for recuperation. The categories struck by object and falls onthe same level each accounted for more than 30,000 fractures.
Figure 25. Number and distribution of fracture cases with days away from work inprivate industry by industry division, 1997. (Source: SOII [1999].)

NONFATAL INJURY
○ ○ ○ ○ ○ ○ ○ ○ ○ ○ ○ ○ ○ ○ ○ ○ ○ ○ ○ ○ ○ ○ ○ ○ ○ ○ ○ ○ ○ ○ ○ ○ ○ ○ ○ ○ ○ ○ ○ ○ ○ ○ ○ ○ ○ ○ 19
Figure 26. Number and distribution of fracture cases with days away from work inprivate industry by occupational group, 1997. (Source: SOII [1999].)
Figure 27. Number and distribution of fracture cases with days away from work inprivate industry by source of disorder, 1997. (Source: SOII [1999].)

NONFATAL INJURY
○ ○ ○ ○ ○ ○ ○ ○ ○ ○ ○ ○ ○ ○ ○ ○ ○ ○ ○ ○ ○ ○ ○ ○ ○ ○ ○ ○ ○ ○ ○ ○ ○ ○ ○ ○ ○ ○ ○ ○ ○ ○ ○ ○ ○ ○ 20
Figure 28. Number and distribution of heat burn and scald cases with days away fromwork in private industry by industry division, 1997. (Source: SOII [1999].)
Heat Burn and Scald Cases with Days away from Work, 1997
More than half of the approximately 30,000 heat burn and scald cases with days awayfrom work in 1997 occurred in retail trade (39%) and manufacturing (26%)(Figure 28). Most of these injuries were experienced by service personnel (44%) andoperators, fabricators, and laborers (30%) (Figure 29). Twenty-four percent of heatburn and scald cases affected the hand (except fingers), 14% affected multiple bodyparts, and 12% affected the foot or toe (Figure 30). A median number of 4 days awayfrom work resulted from heat burns and scalds.

NONFATAL INJURY
○ ○ ○ ○ ○ ○ ○ ○ ○ ○ ○ ○ ○ ○ ○ ○ ○ ○ ○ ○ ○ ○ ○ ○ ○ ○ ○ ○ ○ ○ ○ ○ ○ ○ ○ ○ ○ ○ ○ ○ ○ ○ ○ ○ ○ ○ 21
Figure 29. Number and distribution of heat burn and scald cases with days away fromwork in private industry by occupational group, 1997. (Source: SOII [1999].)
Figure 30. Number and distribution of heat burn and scald cases with days away fromwork in private industry by part of body affected, 1997. (Source: SOII [1999].)

NONFATAL INJURY
○ ○ ○ ○ ○ ○ ○ ○ ○ ○ ○ ○ ○ ○ ○ ○ ○ ○ ○ ○ ○ ○ ○ ○ ○ ○ ○ ○ ○ ○ ○ ○ ○ ○ ○ ○ ○ ○ ○ ○ ○ ○ ○ ○ ○ ○ 22
Figure 31. Number and distribution of amputation cases with days away from work inprivate industry by industry division, 1997. (Source: SOII [1999].)
Amputation Cases with Days away from Work, 1997
More than half of the approximately 10,850 amputation cases with days away fromwork in 1997 occurred in manufacturing (51%) (Figure 31). Operators, fabricators,and laborers experienced 60% of amputations (Figure 32). Machinery was the majorsource of amputation injury (57%) (Figure 33). Men accounted for 87% of occupa-tional amputations. Nearly 10,200 amputations (93.8%) were to fingers. A mediannumber of 18 days away from work resulted from amputations.

NONFATAL INJURY
○ ○ ○ ○ ○ ○ ○ ○ ○ ○ ○ ○ ○ ○ ○ ○ ○ ○ ○ ○ ○ ○ ○ ○ ○ ○ ○ ○ ○ ○ ○ ○ ○ ○ ○ ○ ○ ○ ○ ○ ○ ○ ○ ○ ○ ○ 23
Figure 32. Number and distribution of amputation cases with days away from work inprivate industry by occupational group, 1997. (Source: SOII [1999].)
Figure 33. Number and distribution of amputation cases with days away from work inprivate industry by source of disorder, 1997. (Source: SOII [1999].)

REFERENCES
○ ○ ○ ○ ○ ○ ○ ○ ○ ○ ○ ○ ○ ○ ○ ○ ○ ○ ○ ○ ○ ○ ○ ○ ○ ○ ○ ○ ○ ○ ○ ○ ○ ○ ○ ○ ○ ○ ○ ○ ○ ○ ○ ○ ○ ○ 24
REFERENCES
NEISS [1999]. National Electronic Injury Surveillance System. (Data collected by theConsumer Product Safety Commission; work-related case records maintained by theNational Institute for Occupational Safety and Health.) Washington, DC: ConsumerProduct Safety Commission, Division of Hazard and Injury Data Systems; andMorgantown, WV: U.S. Department of Health and Human Services, Public HealthService, Centers for Disease Control and Prevention, National Institute for Occupa-tional Safety and Health. Database.
NHAMCS [1999]. National hospital ambulatory medical care survey, 1995–1997.Hyattsville, MD: U.S. Department of Health and Human Services, Public HealthService, Centers for Disease Control and Prevention, National Center for HealthStatistics. Database. [www.cdc.gov/nchs/products/elec_prods/subject/nhamcs.htm].
SOII [1999]. Survey of occupational injuries and illnesses. Washington, DC: U.S.Department of Labor, Bureau of Labor Statistics. Database. [www.bls.gov/iif/].


Delivering on the Nation’s Promise:Safety and health at work for all people
through research and prevention.
To receive NIOSH documents or more information aboutoccupational safety and health topics, contact NIOSH at
1-800-35-NIOSH (1-800-356-4674)Fax: 513-533-8573
E-mail: [email protected]
Or visit the NIOSH Web Site at www.cdc.gov/niosh
DHHS (NIOSH) Publication No. 2002-119