word storms: multiples of word clouds for visual comparison of
TRANSCRIPT
Word Storms: Multiples of Word Clouds forVisual Comparison of Documents
Quim CastellàSchool of Informatics
University of [email protected]
Charles SuttonSchool of Informatics
University of [email protected]
ABSTRACTWord clouds are popular for visualizing documents, but arenot as useful for comparing documents, because identicalwords are not presented consistently across different clouds.We introduce the concept of word storms, a visualizationtool for analyzing corpora of documents. A word storm is agroup of word clouds, in which each cloud represents a singledocument, juxtaposed to allow the viewer to compare andcontrast the documents. We present a novel algorithm thatcreates a coordinated word storm, in which words that ap-pear in multiple documents are placed in the same location,using the same color and orientation, across clouds. Thisensures that similar documents are represented by similar-looking word clouds, making them easier to compare andcontrast visually. We evaluate the algorithm using an au-tomatic evaluation based on document classification, and auser study. The results confirm that a coordinated wordstorm allows for better visual comparison of documents.
Categories and Subject DescriptorsH.5 [Information Search and Retrieval]: InformationInterfaces and Presentation
1. INTRODUCTIONBecause of the vast number of text documents on the Web,
there is a demand for ways to allow people to scan largenumbers of documents quickly. A natural approach is vi-sualization, under the hope that visually scanning a picturemay be easier for people than reading text. One of the mostpopular visualization methods for text documents are wordclouds. A word cloud is a graphical presentation of a doc-ument, usually generated by plotting the document’s mostcommon words in two dimensional space, with the word’sfrequency indicated by its font size. Word clouds can beeasy for naive users to interpret and can be aestheticallysurprising and pleasing. One of the most popular cloud gen-erators, Wordle, has generated over 1.4 million clouds thathave been publicly posted [8].
Copyright is held by the International World Wide Web Conference Com-mittee (IW3C2). IW3C2 reserves the right to provide a hyperlink to theauthor’s site if the Material is used in electronic media.WWW’14, April 7–11, 2014, Seoul, Korea.ACM 978-1-4503-2744-2/14/04.http://dx.doi.org/10.1145/2566486.2567977.
Despite their popularity for visualizing single documents,word clouds are not as useful for navigating groups of docu-ments, such as blogs or Web sites. The key problem is thatword clouds are difficult to compare visually. For example,say that we want to compare two documents, so we build aword cloud separately for each document. Even if the twodocuments are topically similar, the resulting clouds can bevery different visually, because the shared words betweenthe documents are usually scrambled, appearing in differentlocations in each of the two clouds. The effect, as we confirmin a small user study (Section 5.3), is that it is difficult tosee by eye which words are shared between the documents.
In this paper, we introduce the concept of word storms toafford visual comparison of groups of documents. Just as astorm is a group of clouds, a word storm is a group of wordclouds. Each cloud in the storm represents a subset of thecorpus. For example, a storm might contain one cloud perdocument, one cloud to represent all the documents writtenin each year, or one cloud to represent each track of an aca-demic conference. Effective storms make it easy to compareand contrast documents visually. We propose several princi-ples behind effective storms, the most important of which isthat similar documents should be represented by visually sim-ilar clouds. To achieve this, algorithms for generating stormsshould coordinate the layout of their constituent clouds.
We present a novel algorithm for generating coordinatedword storms that follow this principle. The goal is to gener-ate a set of visually appealing clouds, under the constraintthat if the same word appears in more than one cloud inthe storm, it appears in a similar location. Interestingly,this also allows a user to see when a word is not in a cloud:simply find the desired word in one cloud and check the cor-responding locations in all the other clouds. At a technicallevel, our algorithm combines the greedy randomized layoutstrategy of Wordle, which generates aesthetically pleasinglayouts, with an optimization-based approach to maintaincoordination between the clouds. The objective function inthe optimization measures the amount of coordination in thestorm, inspired by multidimensional scaling.
We evaluate this algorithm on several text corpora, includ-ing academic papers and research grant proposals. First,we present a novel automatic evaluation method for wordstorms based on how well the clouds, represented as vectorsof pixels, serve as features for document classification. Theautomatic evaluation allows us to rapidly compare differentlayout algorithms, and may be of independent interest as aframework for comparing visualizations. Second, we presenta user study in which users are asked to examine and com-

pare the clouds in a storm. Both experiments demonstratethat a coordinated word storm is dramatically better thanindependent word clouds at allowing users to visually com-pare and contrast documents.
2. DESIGN PRINCIPLESA word storm is a group of word clouds constructed to
visualize a corpus of documents. In the simplest type ofstorm, each cloud represents a single document by creatinga summary of its content; hence, by looking at the cloudsa user can form a quick impression of the corpus’s contentand analyse the relations among the different documents.Our work builds on word clouds because they are popular,
easy for users to understand, and are often visually appeal-ing. By building a storm based on word clouds, we createan accessible tool that can be readily understood withoutrequiring a background in statistics or text processing. Theaim of a word storm is to extend the capabilities of a wordcloud: instead of visualizing just one document, it is used tovisualize an entire corpus.There are two design motivations behind the concept of
word storms. The first is to visualize high-dimensional datain a high-dimensional space. Many classical visualizationtechniques are based on dimensionality reduction, i.e., map-ping high-dimensional data into a low dimensional space.Word storms take an alternative strategy, of mapping highdimensional data into a different high dimensional space,but one which is tailored for human visual processing. Thesecond design motivation is the principle of small multiples[16, 17], in which similar visualizations are presented to-gether in a table so that the eye is drawn to the similaritiesand differences between them. A word storm is a small mul-tiple of word clouds. This motivation strongly influences thedesign of effective clouds, as described in Section 2.3.
2.1 Types of StormsDifferent types of storms can be constructed for different
data analysis tasks. In general, the individual clouds in astorm can represent a group of documents rather than asingle document. For example, a cloud could represent allthe documents written in a particular month, or that appearon a particular section of a web site. It would be typical to dothis by simply merging all of the documents in each group,and then generating the storm with one cloud per mergeddocument. This makes the storm a flexible tool that can beused for different types of analysis, and it is possible to createdifferent storms from the same corpus and obtain differentinsights. Here are some example scenarios:1. Comparing Individual Documents. If the goal is
to compare and contrast individual documents in a corpus,then we can build a storm in which each word cloud repre-sents a single document.2. Temporal Evolution of Documents. If we have a
set of documents that have been written over a long period,such as news articles, blog posts, or scientific documents,we may want to understand trends in the corpus over time.This can be achieved using a word storm in which each cloudrepresents a time period, e.g., one week or one month. Bylooking at the clouds sequentially, the user can see the ap-pearance and disappearance of words and how their impor-tance changes over time.3. Hierarchies of Documents. If the corpus is ar-
ranged in a hierarchy of categories, we can create a set of
storms, one for each category, each of which contains onecloud for each subcategory. For instance, this structure canbe useful in a corpus of scientific papers. At the top level,we would first have a storm that contains one cloud for eachscientific field (e.g., chemistry, physics, engineering), thenfor each field, we also have a separate storm that includesone cloud for each subfield (such as organic chemistry, inor-ganic chemistry) and so on until arriving at the articles. Anexample is shown in Figures 2 and 3. For large documentcollections, it is infeasible for a user to visually scan a largenumber of clouds. In this setting, a hierarchical approachseems particularly appropriate.
Hereafter we use the term “document” to refer to the textrepresented by a single cloud, with the understanding thatthe “document” may have been created by concatenating aset of smaller documents.
2.2 Levels of Analysis of StormsA word storm allows the user to analyse the corpus at a
variety of different levels:1. Overall Impression of Corpus. By scanning the
largest terms across all the clouds, the user can form a quickimpression of the topics in the corpus.
2. Comparison of Documents. The user can visuallycompare clouds in the storm in order to compare and con-trast documents. For example, the user can look for wordsthat are much more common in one document than in an-other. Also the user can compare whether two clouds havesimilar shapes, to gauge the overall similarity of the corre-sponding documents.
3. Analysis of Single Documents. Finally, the cloudsin the storm have meaning in themselves. Just as with asingle word cloud, the user can analyze an individual cloudto get an impression of a single document.
2.3 Principles of Effective Word StormsBecause they support additional types of analysis, princi-
ples for effective word storms are different than those for in-dividual clouds. This section describes some desirable prop-erties of effective word storms.
First of all, each cloud should be a good representationof its document. That is, each cloud ought to emphasizethe most important words so that the information that ittransmits is faithful to its content. Each cloud in a stormshould be an effective visualization in its own right.
Furthermore, the clouds should integrate harmoniouslyinto a complete storm. In particular, clouds should be de-signed so that they are effective as small multiples [16, 17],that is, they should be easy to compare and contrast. Thishas several implications. First, clouds should be similar sothat they look like multiples of the same thing, making thestorm a cohesive unit. Because the same structure is main-tained across the different clouds, they are easier to compare,so that the viewer’s attention is focused on the differencesamong them. A related implication is that the clouds oughtto be small enough that viewers can analyze multiple cloudsat the same time without undue effort.
The way the clouds are arranged and organised on thecanvas can also play an important role, because clouds canbe more easily compared to their neighbors than to moredistant clouds. This suggests the principle that clouds ina storm should be arranged to facilitate the most importantcomparisons. In the current paper, we simply arrange the
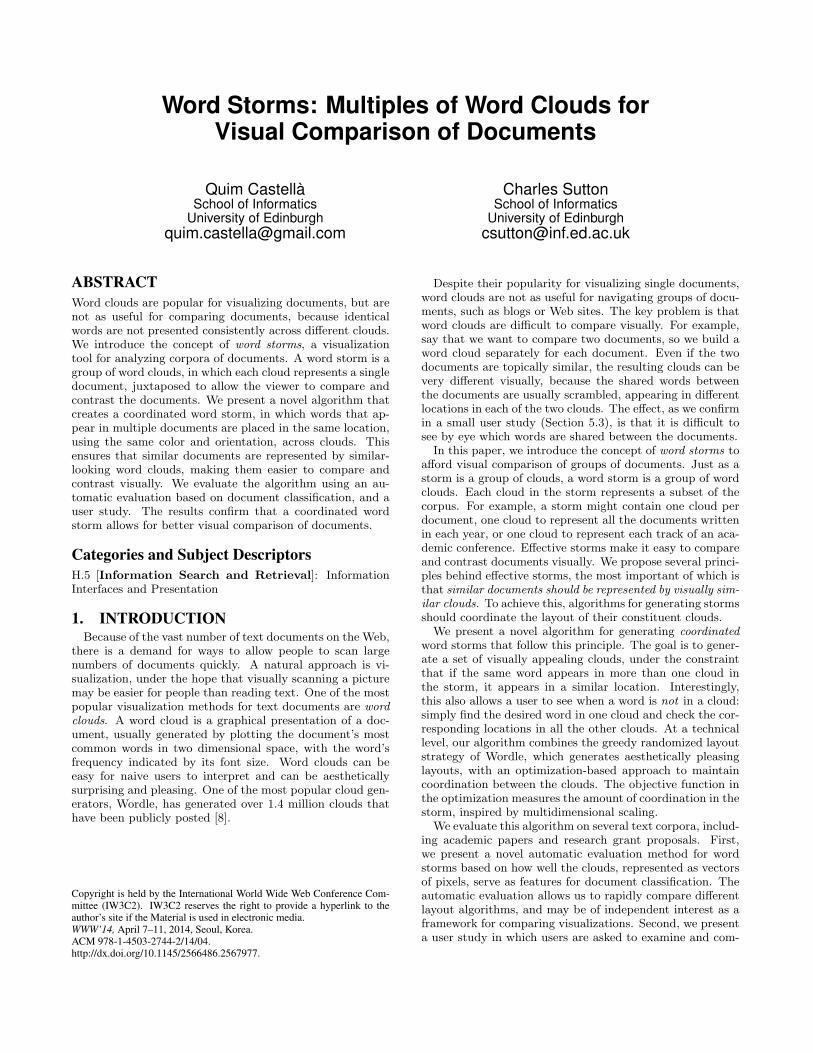
(a) (b) (c) (d)
(e) (f) (g) (h)
Figure 1: Visualization of eight papers from the ICML 2012 conference in a coordinated word storm. These papersappeared in a track about optimization algorithms. A larger version of this storm, which included all accepted ICMLpapers, was deployed on the official conference Web site during the meeting.
clouds in a grid, but future work could consider methods oforganizing the clouds on the canvas.A final, and perhaps the most important, principle is the
coordination of similarity principle. In an effective storm,visual comparisons between clouds should reflect the un-derlying relationships between documents, so that similardocuments should have similar clouds, and dissimilar doc-uments should have visually distinct clouds. This principlehas particularly strong implications. For instance, wordsshould appear in a similar font and similar colors when theyappear in multiple clouds. More ambitiously, words shouldalso have approximately the same position when they appearin multiple clouds. The coordination of similarity principlecan significantly enhance the usefulness of the storm. Forexample, to compare the most common words in two doc-uments, one can visually check if a word in one cloud alsoappears in another cloud. Displaying shared words in thesame color and position across clouds makes this task mucheasier, especially when checking for words that appear inone cloud but not in another. This principle furthermoretends to encourage the overall shape of the clouds of similardocuments to appear visually similar, allowing the viewer toassess document similarity by quickly scanning the clouds.These principles present new algorithmic challenges. Ex-
isting algorithms for single clouds do not consider relation-ships between multiple clouds in a storm. In the next sec-tions we propose new algorithms for building effective storms.
3. CREATING A SINGLE CLOUDIn this section, we describe the layout algorithm for single
clouds. The method is based on that of Wordle [8], becauseit tends to produce aesthetically pleasing clouds. Formally,we define a word cloud as a set of words W = {w1, . . . , wM},where each word w ∈W is assigned a position pw = (xw, yw)and visual attributes that include its font size sw, color cwand orientation ow (horizontal or vertical).To select the words in a cloud, we need a measure of the
importance of a word to the document, which we call itsweight. Typically term frequency (tf ) is used for this, but
alternatives could include idf with respect to a documentcollection, or mutual information with respect to documentmetadata. We select the words in the cloud by choosing thetop M words from the document by weight after removingstop words. The font size is set proportionally to the term’sweight, and the color and orientation are selected randomly.Choosing the word positions is more complex, because wordsmust not overlap on the canvas. We use the layout algorithmfrom Wordle [8], which we will call the spiral algorithm.
The spiral algorithm (Algorithm 1) is greedy and incre-mental; it sets the location of each word in order of size. Atthe beginning of the i-th step, the algorithm has generateda partial word cloud containing the i − 1 words of largestweight. To add a word w to the cloud, the algorithm placesit at an initial desired position pw (e.g., chosen randomly).If at that position, w does not intersect any previous wordsand is entirely within the frame, we go on to the next word.Otherwise, w is moved outwards along a spiral path until itreaches a valid position, that is, a position inside the framewith no overlaps. This is repeated for all words in the cloud.
As the algorithm assumes that the size of the frame isgiven, we estimate the necessary width and the height to fitM words. Similarly, if the initial desired positions are notgiven, we sample them from a Gaussian distribution withmean at the frame’s center. This distribution is truncatedso that the desired position is always sampled within theframe. Notice in line 4 of the algorithm that a maximumnumber of iterations is used to prevent words from loopingforever, which can happen if the word cannot be fit into theframe. If the maximum number of iterations is reached forany word, we assume that the current frame is too small andrestart the algorithm with a larger frame.
It is better to check if two words intersect at the glyphlevel, rather than using a bounding box around the word, toensure a compact result. However, checking the intersectionof two glyphs can be expensive, so instead we use a tree ofrectangular bounding boxes that closely follows the shapeof the glyph, as in [8]. We use the implementation from theopen source library WordCram (http://wordcram.org).

(a) Chemistry (b) Engineering (c) Information Communicationand Technology
(d) Physical Sciences (e) Complexity (f) Mathematical Sciences
Figure 2: A word storm describing the grants funded by six EPSRC Scientific Programs. Each cloud represents theset of all grant abstracts in the respective program.
(a) (b) (c)
(d) (e) (f)
Figure 3: A word storm containing six randomly sampled grants from the Complexity Programme (Cloud (e) in Figure2). The word “complex”, which only appeared in one cloud in Figure 2, appears in all clouds in this figure. This wordconveys little information here, in contrast to the previous figure, so in this figure the word is more transparent.

Algorithm 1 Spiral Algorithm
Require: Words W , optionally positions p = {pw}w∈W
Ensure: Final positions p = {pw}w∈W
1: for all words w ∈ {w1, . . . , wM} do2: if initial position pw unsupplied, sample from Gaussian3: count ← 04: while pw not valid ∧ count < Max Iteration do5: Move pw one step along a spiral path6: count ← count + 17: end while8: if pw not valid then9: Restart with a larger frame10: end if11: end for
4. CREATING A STORMIn this section, we present novel algorithms to build a
storm. The simplest method would of course be to simplyrun the single-cloud algorithm of Section 3 independently foreach document, but the resulting storms would typically vi-olate the principle of coordination of similarity (Section 2.3)because words will tend to have different colors, orientations,and layouts even when they are shared between documents.Instead, our algorithms will coordinate the layout of differ-ent clouds, so that when words appear in more than onecloud, they have the same color, orientation, and position.In this way, if the viewer finds a word in one of the clouds,it is easy to check if it appears in any other clouds.We represent each document as a vector ui, where uiw is
the count of word w in document i. A word cloud vi is atuple vi = (Wi, {piw}, {ciw}, {siw}), where Wi is the set ofwords that are to be displayed in cloud i, and for any wordw ∈ Wi, we define piw = (xiw, yiw) as the position of w inthe cloud vi, ciw the color, and siw the font size. We writepi = {piw |w ∈Wi} for the set of all word locations in vi.Our algorithms will focus on coordinating word locations
and attributes of words that are shared in multiple clouds ina storm. However, it is also possible to select the words thatare displayed in each cloud in a coordinated way that con-siders the entire corpus. For example, instead of selectingwords by their frequency in the current document, we coulduse global measures, such as tf ∗ idf , that could emphasizethe differences among clouds and would deal naturally withstop words. In preliminary experiments, however, we sub-jectively preferred storms produced using tf alone.
4.1 Coordinated Attribute SelectionA simple way to improve the coordination of a storm is to
ensure that words that appear in more than one cloud aredisplayed with the same color and orientation across clouds.We can go a bit farther than this, however, by encoding in-formation in the words’ color and orientation. In our case,we decided to use color as an additional way of encoding therelevance of a term in the document. Rather than encodingthis information in the hue, which would require a model ofcolor saliency, instead we control the color transparency. Wechoose the alpha channel of the color to correspond to theinverse document frequency idf of the word in the corpus.In this way, words that appear in a small number of doc-uments will have opaque colors, while words that occur inmany documents will be more transparent. In this way the
Algorithm 2 Iterative Layout Algorithm
Require: Storm vi = (Wi, {ciw}, {siw}) without positionsEnsure: Word storm {v1, . . . , vN} with positions1: for i ∈ {1, . . . , N} do2: pi ← SpiralAlgorithm(Wi)3: end for4: while Not Converged ∧ count < Max Iteration do5: for i ∈ {1, . . . , N} do6: p′iw ← 1
|Vw|∑
vj∈Vwpjw, ∀w ∈Wi
7: pi ← SpiralAlgorithm(Wi, p′i)
8: end for9: count = count + 110: end while
color choice emphasizes differences among the documents,by making more informative words more noticeable.
4.2 Coordinated Layout: Iterative AlgorithmCoordinating the positions of shared words is much more
difficult than coordinating the visual attributes. In this sec-tion we present the first of three algorithms for coordinat-ing word positions. In the same manner that we have setthe color and the orientation, we want to set the positionpwi = pwj ∀vi, vj ∈ Vw, where Vw is the set of clouds thatcontain word w. The task is more challenging because itadds an additional constraint to the layout algorithm. In-stead of only avoiding overlaps, now we have the constraintof placing the words in the same position across the clouds.In order to do so, we present a layout algorithm that itera-tively generates valid word clouds changing the location ofthe shared words to make them converge to the same po-sition in all clouds. We will refer to this procedure as theiterative layout algorithm, which is shown in Algorithm 2.
In particular, the iterative layout algorithm works by re-peatedly calling the spiral algorithm (Section 3) with dif-ferent desired locations for the shared words. At the firstiteration, the desired locations are set randomly. Subse-quently, the new desired locations are chosen by averag-ing the previous final locations of the word in the differ-ent clouds. That is, the new desired location for word w isp′w = |Vw|−1 ∑
vj∈Vwpwj . Thus, the new desired location
for word w is the same for all clouds vj ∈ Vw. Changing thelocations of shared words might introduce new overlaps, sowe run the spiral algorithm again to remove any overlaps.
Ideally this process would be iterated until the word loca-tions converge, that is, when the spiral algorithm does notmodify the given positions. At that point all shared wordswill be in precisely identical positions across the clouds.However, this process does not always converge, so in prac-tice, we stop after a fixed number of iterations.
In practice we find a serious problem with the iterativealgorithm. It tends to move words far away from the center,because this makes it easier to place shared words in thesame position across clouds. This results in sparse layoutswith excessive white space that are visually unappealing.
4.3 Coordinated Layout: Gradient ApproachIn this section, we present a new method to build a storm
by solving an optimization problem. This will provide uswith additional flexibility to incorporate aesthetic constraintsinto storm construction, because we can incorporate them

as additional terms in the objective function. This will allowus to avoid the unsightly sparse layouts which are sometimesproduced by the iterative algorithm.We call the objective function the Discrepancy Between
Similarities (DBS). The DBS is a function of the set ofclouds v1:N = {v1, . . . , vN} and the set of documents u1:N ={u1, . . . , uN}, and measures how well the storm fits the doc-ument corpus. It is:
fu1:N (v1:N ) =∑
1≤i<j≤N
(du(ui, uj)−dv(vi, vj))2+
∑1≤i≤N
c(ui, vi),
where du is a distance metric between documents and dv ametric between clouds. The DBS is to be minimized as afunction of {vi}. The first summand, which we call stress,formalizes the idea that similar documents should have sim-ilar clouds and different documents, different clouds. Thesecond summand uses a function that we call the correspon-dence function c(·, ·), which should be chosen to ensure thateach cloud vi is a good representation of its document ui.The stress term of the objective function is inspired by
multidimensional scaling (MDS), a classical method for di-mensionality reduction [2]. Our use of the stress functionis slightly unusual, because instead of projecting the doc-uments onto a low-dimensional space, such as R2, we aremapping documents to the space of word clouds. The spaceof word clouds is itself high-dimensional, and indeed, mighthave greater dimension than the original space. Addition-ally, the space of word clouds is not Euclidean because ofthe non-overlapping constraints.For the metric du among documents, we use Euclidean
distance. The dissimilarity function dv between clouds is
dv(vi, vj) =∑w∈W
(siw−sjw)2+κ∑
w∈Wi∩Wj
(xiw−xjw)2+(yiw−yjw)2,
where κ ≥ 0 determines the weight given to differences infont size versus differences in location. Note that the firstsummand considers all words in either cloud, and the secondonly the words that appear in both clouds. (If a word doesnot appear in a cloud, we treat its size as zero.) The intuitionis that clouds are similar if their words have similar sizes andlocations. In contrast to the previous layout algorithm, byoptimizing this function also determines the words’ sizes.The difference between the objective functions for MDS
and DBS is that the DBS adds the correspondence functionc(ui, vi). In MDS, the position of a single data point inthe target space is not interpretable on its own, whereasin our case each word cloud must accurately represent itsdocument. Ensuring this is the role of the correspondencefunction. In this work we use c(ui, vi) =
∑w∈Wi
(uiw−siw)2,where uiw is the tf of word w.We also need to ensure that words do not overlap, and
to favor compact configurations. We introduce these con-straints as two penalty terms. When two words overlap, weadd a penalty proportional to the square of the the mini-mum distance required to separate them; call this distanceOi;w,w′ . We favor compactness by adding a penalty propor-tional to the the squared distance from each word towardsthe center of the image, which by convention is the origin.Incorporating these two penalties, the final objective func-
tion is g(v1:N ) = fu1:N (v1:N ) + r(v1:N ), where r is
r(v1:N ) = λN∑i=1
∑w,w′∈Wi
O2i;w,w′ + µ
N∑i=1
∑w∈Wi
||piw||2,
where λ and µ are parameters that determine the strengthof the overlap and compactness penalties, respectively.
We optimize this by solving a sequence of optimizationproblems for increasing values λ0 < λ1 < λ2 < . . . of theoverlap penalty. We increase λ exponentially until no wordsoverlap in the final solution. Each subproblem is minimizedusing gradient descent starting from the previous solution.
4.4 Coordinated Layout: Combined AlgorithmThe iterative and gradient algorithms are complementary.
The iterative algorithm is fast, but it does not enforce thatclouds stay compact. The gradient method can create com-pact clouds, but requires many iterations to converge, andthe layout strongly depends on the initialization. There-fore we combine the two methods, using the final result ofthe iterative algorithm as the starting point for the gradi-ent method. From this initialization, the gradient methodconverges much faster, because it starts off without over-lapping words. The gradient method tends to improve theinitial layout significantly, because it pulls words closer tothe center, creating a more compact layout. Also, the gra-dient method tends to pull together the locations of sharedwords for which the iterative method was not able to con-verge to a single position. The above steps are run only forwords that appear in multiple clouds. We lay out the re-maining words that are unique to single clouds at the endusing the spiral algorithm. This leads to improvements inthe running time, since we deal with fewer words during thefirst phase, and it results in more compact clouds, becausethe unique words, being less constrained, can fit into oddpatches of whitespace. By default, all clouds in this paperare created using this combined algorithm.
5. EVALUATIONThe evaluation is divided in three parts: a qualitative
analysis, an automatic analysis, and a user study. We usetwo different data sets. First, we use the scientific paperspresented in the ICML 2012 conference, where we deployeda storm on the main conference Web site to compare thepresented papers and help people decide among sessions1.
Second, we use a data set provided by the Research Per-spectives project2 [10], which aims to offer a visualization ofthe research portfolios of funding agencies. The data con-tains 2358 abstracts of funded research grants from the UK’sEngineering and Physical Sciences Research Council (EP-SRC). Each grant belongs to exactly one of the followingprogrammes: Information and Communications Technology(626 grants), Physical Sciences (533), Mathematical Sciences(331), Engineering (317), User-Led Research (291) and Ma-terials, Mechanical and Medical Engineering (264).
5.1 Qualitative AnalysisThis section discusses coordinated word storms in quali-
tative fashion, describing the additional information abouta corpus that they make apparent.
First, we consider a storm that displays six research pro-grammes from EPSRC programmes, five of which are differ-ent subprogrammes of material sciences and the sixth oneis the mathematical sciences programme. For this data setwe present both a set of independent clouds (Figure 4) and
1http://icml.cc/2012/whatson/2Also see http://www.researchperspectives.org

(a) Electronic Materials (b) Metals and Alloys (c) Photonic Materials
(d) Structural Ceramics and Inor-ganics
(e) Structural Polymers andComposites
(f) Mathematical Sciences
Figure 4: Independent Clouds representing six EPSRC Scientific Programmes. These programmes are also representedas a coordinated storm in Figure 5.
(a) Electronic Materials (b) Metals and Alloys (c) Photonic Materials
(d) Structural Ceramics and Inor-ganics
(e) Structural Polymers andComposites
(f) Mathematical Sciences
Figure 5: Coordinated storm representing six EPSRC Scientific Programmes. These programmes are also representedas independent clouds in Figure 4. Compared to that figure, here it is much easier to see the differences between clouds.

Time (s) Compactness (%) Accuracy (%)Lower Bound - - 26.5 ± 3.9
Independent Clouds 143.3 35.12 23.4 ± 3.8
Coordinated Storm (Iterative) 250.9 20.39 54.7 ± 4.5
Coordinated Storm (Combined) 2658.5 33.71 54.2 ± 4.5
Upper Bound - - 67.9 ± 4.2
Table 1: Automatic evaluation of word storm algorithms. The small numbers indicate 95% confidence intervals.
a storm generated by the combined algorithm (Figure 5).From either set of clouds, we can get a superficial idea ofthe corpus. We can see the most important words suchas “materials”, which appears in the first five clouds, andsome other words like “alloys”, “polymer” and “mathemati-cal”. However, it is hard to get more information than thisfrom the independent clouds.On the other hand, by looking at the coordinated storm
we can obtain more information. First, it is instantly clearthat the first five documents are similar and that the sixthone is different from the others. This is because the stormreveals the shared structure in the documents, formed byshared words such as “materials”, “properties” and “applica-tions”. Second, we can easily tell the presence or absenceof words across clouds because of the consistent attributesand locations. For example, we can quickly see that “prop-erties” does not appear in the sixth cloud or that “coatings”only occurs in two of the six. Finally, the transparency ofthe words allows us to spot the informative terms quickly,such as “electron” (a), “metal” (b), “light” (c), “crack” (d),“composite” (e) and “problems” (f). All of these terms areinformative of the document content but are difficult to spotin the independent clouds of Figure 4. Overall, the coordi-nated storm seems to afford deeper analysis than the inde-pendently generated clouds.Similarly, from the ICML 2012 data set, Figure 1 shows
a storm containing all the papers from a single conferencesession. It is immediately apparent from the clouds that thesession discusses optimization algorithms. It is also clearthat the papers (c) and (d) are very related since they sharea lot of words such as “sgd”, “stochastic” and“convex”whichresults in two similar layouts. The fact that shared wordstake similar positions can force unique words into similarpositions as well, which can make it easy to find terms thatdifferentiate the clouds. For example, we can see how“herd-ing” (f), “coordinated” (g) and “similarity” (h) are in thesame location or “semidefinite” (a), “quasi-newton” (b) and“nonsmooth” (d) are in the same location.
Finally, Figures 2 and 3 show an example of a hierar-chical set of storms generated from the EPSRC grant ab-stracts. Figure 2 presents a storm created by grouping allabstracts by their top level scientific program. There wecan see two pairs of similar programmes: Chemistry andPhysical Sciences; and Engineering and Information Com-munication and Technology. In Figure 3, we show a secondstorm composed of six individual grants from the Complex-ity programme (Cloud (e) in Figure 2). It is interesting tosee how big words in the top level such as “complex”, “sys-tems”, “network”and“models”appear with different weightsin the grant level. In particular, the term “complex”, thatit is rare when looking at the top level, appears everywhereinside the complexity programme. Because of our use of
transparency, this term is therefore prominent in the toplevel storm but less noticeable in the lower level storm.
5.2 Automatic EvaluationWe propose a novel automatic method to evaluate word
storm algorithms. The objective is to assess how well therelations among documents are represented in the clouds.The motivation is similar in spirit to the celebrated BLEUmeasure in machine translation [12]: Automatic evaluation,rather than a user study, allows rapid and inexpensive com-parison of algorithms. Our automatic evaluation requires acorpus of labelled documents, e.g., with a class label thatindicates their topic. The main idea is: If the visualizationis faithful to the documents, then it should be possible toclassify the documents using the pixels in the visualizationrather than the words in the documents. So we use classifi-cation accuracy as a proxy measure for visualization fidelity.
In the context of word storms, the automatic evaluationconsists of: (a) generating a storm from a labelled corpuswith one cloud per document, (b) training a document clas-sifier using the pixels of the clouds as attributes and (c)testing the classifier on a held out set to obtain the classi-fication accuracy. More faithful visualizations are expectedto have better classification accuracy.
We use the Research Perspectives EPSRC data set withthe research programme as the class label. Thus, we have asingle-label classification problem with 6 classes. The datawas randomly split into a training and test set using an80/20 split. We use the word storm algorithms to createone cloud per abstract, so there are 2358 clouds in total.We compare three layout algorithms: (a) creating the cloudsindependently using the spiral algorithm, which is our base-line; (b) the iterative algorithm with 5 iterations and (c)the combined algorithm, using 5 iterations of the iterativealgorithm to initialize the gradient method.
We represent each cloud by a vector of the RGB values ofits pixels. We perform feature selection, discarding featureswith zero information gain. We classify the clouds by usingsupport vector machines with normalized quadratic kerneland an all-pairs method. As a lower bound, classifying all in-stances as the most common class (ICT) yields an accuracyof 26.5%. To obtain an upper bound, we classify the doc-uments directly using bag-of-words features from the text,which should perform better than transforming the text intoa visualization. Using a support vector machine with nor-malized quadratic kernel and an all-pairs method, this yieldsan accuracy of 67.9%.
Apart from the classification accuracy, we also report therunning time of the layout algorithm (in seconds),3 and thecompactness of the word clouds. We use this measure be-
3All experiments were run on a 3.1 GHz Intel Core i5 serverwith 8GB of RAM.

cause informally we noticed that more compact clouds tendto be more visually appealing. We compute the compact-ness by taking the minimum bounding box of the cloud andcalculating the percentage of non-background pixels.The results are shown in Table 1. Creating the clouds
independently is faster than any coordinated algorithm andalso produces very compact clouds. However, for classifica-tion, this method is no better than random. The algorithmsto create coordinated clouds, the iterative and the combinedalgorithm, each achieve a 54% classification accuracy, whichis significantly higher than the lower bound. This confirmsthe intuition that by coordinating the clouds, the relationsamong documents are better represented. We also reportthe 95% confidence intervals for the accuracy, which indi-cate that the difference in accuracy between either of thecoordinated storm methods and the independent word cloudmethod is statistically significant. The difference in accuracybetween the two coordinated methods is not significant.It is worth noting that this is a difficult classification prob-
lem even given the textual features. We speculate that thismay be due to the degree of textual overlap between theabstracts in the different research programmes. It is lesssurprising that the accuracy of the classifier using indepen-dent clouds is low, because for these clouds, the color valuesof individual pixels have no semantics individually.The differences between the coordinated methods can be
seen in the running time and in the compactness. Althoughthe iterative algorithm achieves much better classificationaccuracy than the baseline, it produces much less compactclouds. The combined algorithm, on the other hand, matchesboth the compactness of independently built clouds (33.71%combined and 35.12% independent) and the classification ac-curacy of the iterative algorithm. The combined algorithm issignificantly more expensive in computation time, althoughthis is still only 1.1s for each cloud in the storm. There-fore, although the combined algorithm requires more time,it seems the best option, because the resulting storm offersgood classification accuracy without losing compactness.A potential pitfall with automatic evaluations is that algo-
rithms can game the system, producing visualizations thatscore better but look worse. It is arguable that this may havehappened in machine translation, in which BLEU has beenoptimized by the research community for many years. Weattempt to avoid this by choosing an measure for the auto-matic evaluation (classification accuracy) that is not directlyoptimized by the algorithms. But the concern of “researchcommunity overfitting” could become more serious if auto-mated evaluation of visualization is widely adopted.
5.3 User StudyIn order to confirm our results using the automatic evalu-
ation, we conducted a pilot user study comparing the stan-dard independent word clouds with coordinated storms cre-ated by the combined algorithm. The study consisted of 5multiple choice questions. In each of them, the users werepresented with six clouds and were asked to perform a sim-ple task. The tasks were of two kinds: checking the presenceof words and comparing documents. The clouds for eachquestion were generated either as independent clouds or acoordinated storm. In every question, the user received oneof the two versions randomly.4 Although users were told in
4The random process ensured that we would have the samenumber of answers for each method.
the beginning that word clouds had been built using differentmethods, the number of different methods was not revealed,the characteristics of the methods were not explained andthey did not know which method was used for each ques-tion. Moreover, in order to reduce the effect of possible biasfactors, the tasks were presented in a random order and the6 clouds in each question were also sorted randomly. Thestudy was taken by 20 people, so each question was answered10 times using the independent clouds and 10 times using acoordinated storm.
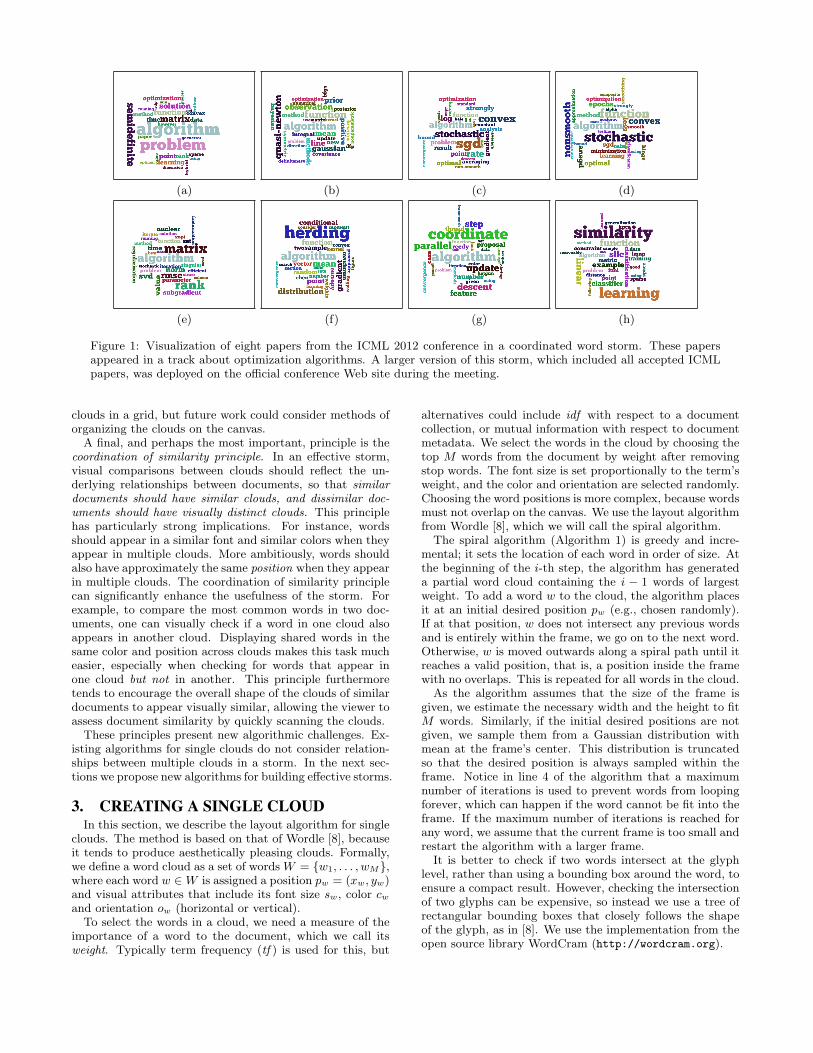
Table 2 presents the results of the study. The first threequestions asked the users to select the clouds that containedor lacked certain words. We manually chose words that wereprominent in both sets of clouds. We report the mean preci-sion and recall across users, as well as the time required forusers to answer. The results show that although the preci-sion and recall are high in both cases and the differences aresmall, the coordinated storm always has a higher score thanthe independent clouds. Although this result is not statis-tically significant, it is still remarkable because we did notexplain the concept of coordinated word storm to the users,so they would not have known to look for the same words inthe same locations. This might be because the structuredlayout helped the users to find words, even though the usersdid not know how the storms were laid out.
The last two questions asked the users to compare the doc-uments and to select “the cloud that is most different fromall the others” and “the most similar pair of clouds”. As co-ordinated word storms are designed to highlight similaritiesand differences between documents, these are the questionsin which we expect to see the greatest difference betweenmethods. For question 4, the clouds had a cosine similar-ity5 lower than 0.3 with all the others, while all others pairshad a similarity higher than 0.5. In the last question, themost similar pair of clouds had a cosine similarity of 0.71,while the score of the second most similar was 0.48. Asthese questions have exactly one correct answer, we reportthe accuracy, instead of the precision and recall.
The results for the last two questions show that the coordi-nated storm is much more effective than independent cloudsin allowing users to compare and contrast documents. Of theusers presented with the coordinated storms, 90% answeredquestion 4 correctly and 70% answered question 5 correctly,whereas only 30% and 10% of users, respectively, answeredcorrectly when shown the independent version. This dif-ference is highly significant (t-test; p < 0.005). This con-firms that coordinated storms allow the users to contrastthe clouds and understand their relations, while indepen-dent clouds are misleading in these tasks.
Although the sample size is small, results favour the co-ordinated storm. In particular, when the users are askedto compare clouds, the differences in user accuracy are ex-tremely large. Regarding the answering time, the differencesbetween the two conditions are not significant.
6. RELATED WORKWord clouds were inspired by tag clouds, which were intro-
duced to summarize and browse a user-specified folksonomy.
5The documents were taken using the bag of words represen-tation with frequencies. The cosine similarity was computedtwice: considering all words in the document and only con-sidering the top 25 words included in the cloud.
Question Independent clouds Coordinated Storm
1 Select clouds with the word “technology”Precision (%) 90 100Recall (%) 65 85Time (s) 51 ± 23 36 ± 10
2 Select clouds without the word “energy”Precision (%) 90 93Recall (%) 85 95Time (s) 56 ± 18 40 ± 14
3Select clouds with the words“models”, “network” and “system”
Precision (%) 75 90Recall (%) 90 100Time (s) 87 ± 35 124 ± 46
4 Select the single most unusual cloudAccuracy (%) 30 90 *Time (s) 36 ± 12 23 ± 10
5 Select the most similar pair of cloudsAccuracy (%) 10 70 *Time (s) 54 ± 23 75 ± 19
Table 2: Results of the user study. Users are more effective at comparing documents when shown coordinated storms.The“time” rows report the mean and standard deviation across users. Stars indicate statistical significance (p < 0.005).
Originally, the tags were organized in horizontal lines andsorted by alphabetical order, a layout that is still used inmany websites such as Flickr and Delicious. Word clouds,such as those generated by Wordle [8, 19], extend this ideato document visualization. However, the topic of visualizingcorpora using word clouds has received much less attention.Researchers have proposed creating the clouds using differ-ent importance measures, such as tf∗idf [9] or by the relativefrequency when only the relations of a single document haveto be analysed [14, 4]. Nevertheless, it can still be difficultto compare the resulting clouds and find shared words.Collins et al. [5] presented Parallel Tag Clouds, a method
that aims to make comparisons easier by representing thedocuments as lists. Although alphabetical lists are informa-tive and easy to understand, our work aims to retain theaesthetic appeal of word clouds while improving their infor-mativeness. The closest work to ours is Cui et al. [6], whichwas later improved by Wu et al. [20]. This work proposesusing a sequence of word clouds along with a trend chartto show the evolution of a corpus over time. They presenta new layout algorithm with the goal of keeping semanti-cally similar words close to each other in each cloud. Thisis a different goal from ours: Preserving semantic relationsbetween words within a cloud is different than coordinatingsimilarities across clouds, and does not necessarily result insimilar documents being represented by similar clouds.Our approach, in common with Wordle and many other
text visualization methods, does not attempt to resolve casesof synonymy and polysemy. One can imagine potential ex-tensions to our method to handle this, e.g., by incorporat-ing word sense disambiguation [11] to visually distinguishdifferent word senses, or by incorporating topic modellingmethods [1] to visually conflate words that are semanticallysimilar. These extensions are left to future work.An alternative general approach to visualization of docu-
ment collections is to employ dimensionality reduction meth-ods, for which there is an extensive literature [7, 1, 13, 15,18]. These methods can be used to assign each document toa single point in a low-dimensional latent space that can beexplored visually. Indeed, topic models have previously beenapplied to the grant proposals data set [10]. Word cloudsand their ilk take an alternative approach. Instead of map-ping documents into a low-dimensional space, documents are
mapped into a high dimensional space, but one that is wellsuited to the human visual system. One advantage of thisis that the high dimensional representation, e.g., the wordcloud, can convey some information about the document onits own. Another advantage is aesthetic. Word clouds areextremely popular among users — to give a crude indica-tion, the query “word cloud” currently returns 357 millionhits on Google, whereas “latent Dirichlet allocation” returns157 thousand. This indicates the potential value of workthat aims to increase the statistical informativeness of pop-ular visualization methods that have clear aesthetic appeal.
7. CONCLUSIONSWe have introduced the concept of word storms, which
is a group of word clouds designed for the visualization ofa corpus of documents. We presented a series of princi-ples for effective storms, arguing that the clouds in a stormshould be built in a coordinated fashion, so that similar doc-uments have similar clouds. We presented a novel algorithmthat builds coordinated word storms, placing shared wordsin a similar location across clouds. Using both an auto-matic evaluation and a user study, we showed that coordi-nated storms were markedly superior to independent wordclouds for comparing and contrasting documents. Futurework could explore ways of organizing hierarchical stormsfor large collections for which it is impossible to view all ofthe clouds at once, and informative ways of arranging theclouds within a storm. Source code implementing the algo-rithms in this paper is available [3].
8. ACKNOWLEDGMENTSWe thank Mike Chantler and Fraser Halley for kindly pro-
viding access to the research grant data. This work was sup-ported by the Engineering and Physical Sciences ResearchCouncil [grant number EP/J00104X/1].
References[1] D. Blei. Probabilistic topic models. Communications
of the ACM, 55(4):77–84, 2012.
[2] I. Borg and P. Groenen. Modern MultidimensionalScaling: Theory and Applications. Springer, 2005.

[3] Q. Castella and C. Sutton. Word storms. URLhttp://groups.inf.ed.ac.uk/cup/wordstorm/
wordstorm.html.
[4] J. Clark. Clustered word clouds - Neoformix, April2008. URL http://www.neoformix.com/.
[5] C. Collins, F. B. Viegas, and M. Wattenberg. Paralleltag clouds to explore and analyze faceted textcorpora. pages 91–98, Oct. 2009.
[6] W. Cui, Y. Wu, S. Liu, F. Wei, M. Zhou, and H. Qu.Context-preserving, dynamic word cloud visualization.IEEE Computer Graphics and Applications, 30:42–53,2010.
[7] S. C. Deerwester, S. T. Dumais, T. K. Landauer,G. W. Furnas, and R. A. Harshman. Indexing bylatent semantic analysis. Journal of the AmericanSociety for Information Science (JASIS), 41(6):391–407, 1990.
[8] J. Feinberg. Wordle. In J. Steele and N. Iliinsky,editors, Beautiful Visualization Looking at Datathrough the Eyes of Experts, chapter 3. O’ReillyMedia, 2010.
[9] Y. Hassan-Montero and V. Herrero-Solana. Improvingtag-clouds as visual information retrieval interfaces. InInScit2006: International Conference onMultidisciplinary Information Sciences andTechnologies, 2006.
[10] O. Khalifa, D. Corne, M. Chantler, and F. Halley.Multi-objective topic modelling. In F. F. Purshouseand S. Greco, editors, Evolutionary Multi-CriterionOptimization (EMO), 2013.
[11] R. Mihalcea. Word sense disambiguation. InEncyclopedia of Machine Learning. Springer, 2007.
[12] K. Papineni, S. Roukos, T. Ward, and W.-J. Zhu.BLEU: a method for automatic evaluation of machinetranslation. In Annual Meeting of the Association forComputational Linguistics, pages 311–318, 2002.
[13] S. T. Roweis and L. K. Saul. Nonlinear dimensionalityreduction by locally linear embedding. Science, 290:2323–2326, 2000.
[14] J. Steele and N. Iliinsky. Beautiful Visualization:Looking at Data through the Eyes of Experts. O’Reilly& Associates Inc, 2010. ISBN 1449379869.
[15] J. B. Tenenbaum, V. De Silva, and J. C. Langford. Aglobal geometric framework for nonlineardimensionality reduction. Science, 290(5500):2319–2323, 2000.
[16] E. R. Tufte. Visual Explanations: Images andQuantities, Evidence and Narrative. Graphics PressLLC, 1997.
[17] E. R. Tufte. The Visual Display of QuantitativeInformation. Graphics Press LLC, 2nd edition, 2001.
[18] L. Van der Maaten and G. Hinton. Visualizing datausing t-SNE. Journal of Machine Learning Research, 9(2579-2605):85, 2008.
[19] F. B. Viegas, M. Wattenberg, and J. Feinberg.Participatory visualization with Wordle. IEEETransactions on Visualization and ComputerGraphics, 15(6):1137–1144, Nov. 2009.
[20] Y. Wu, T. Provan, F. Wei, S. Liu, and K.-L. Ma.Semantic-preserving word clouds by seam carving.Comput. Graph. Forum, 30(3):741–750, 2011.