woongjin energy · •first adoption 100% diamond – wire wafer ... expected to have 20% m/s of...
TRANSCRIPT

1
Confidential. Not to be copied, reproduced or redistributed.
16th Aug, 2011
Woongjin EnergyGlobal NO.1 in the field of Single Crystalline Solar silicon in 2011
IR Conference 2011
Investor Relations

2
Confidential. Not to be copied, reproduced or redistributed.
This material contains the company’s current expectations regarding futurebusiness and financial performances, and forward-looking statements concerning the company’s management strategy, R&D activity, capex, and business plans.
Forward-looking statements are subject to risks and uncertainties that couldcause actual results and outcomes to differ materially from expectations. Thecompany does not guarantee the accuracy or completeness of any statementsthat do not relate strictly to historical or current facts.
Forward Looking Statement

3
Confidential. Not to be copied, reproduced or redistributed.
3
Confidential. Not to be copied, reproduced or redistributed.
I. Company Overview
II. Investment Highlights of Woongjin Energy
1. Secure and stable supply
2. Vertically Integrated Solar Value Chain
3. Diversification of the client base
4. Capacity Expansion
5. Cost Reduction & Competitive Leadership
6. Building eco-friendly system
III. Financial Review
IV. Appendices
Table of Contents

4
Confidential. Not to be copied, reproduced or redistributed.
I. Company Overview
Creating bright future
with solar energy

5
Confidential. Not to be copied, reproduced or redistributed.
General Status
Ownership Structure
Foundation November, 2006
Chairman & CEO Ph.D Oh, Myung & Ph. D Yoo, Hak-do
Location 1316 GwanPyung-Dong YuSeong-Gu, Daejeon
Business Ingot & wafer for Solar
Employees 524 people(as of Jun 30th, 2011)
Affiliates Woongjin Holdings and 30 subsidiaries
Website www.WoongjinEnergy.com
Company Overview
Stock Information
39.4%
31.3%
3.5%2.4%
18.5%4.9%
Woongjin Holdings and affiliate person
SunPower Corp.
Domestic Institutions
Foreign investors
Individual investors
ESOA(Public offering)
* As of Dec. 31th, 2010
Total issued shares 62,093,120
Paid-in capital KRW 31 Billion
Listing date June 30, 2010
Market cap.
(as of Aug 1th, 2011)KRW 872.4 Billion
- 52wk High: 23,350 KRW- 52wk Low: 12,250 KRW- As of Aug. 9th, 2011: 10,200 KRW
• Pursue a high quality & productivity in PV industry and make an effort quality improvement to be a Global No.1 company

6
Confidential. Not to be copied, reproduced or redistributed.
Company Overview
• Make a bright future by developing and supplying renewable energy
Company History

7
Confidential. Not to be copied, reproduced or redistributed.
Main products
PolySilicon Ingot Wafer
• Raw materials
for growing Ingot
• Material for Solar cell and
semiconductor
• Put Silicon in a grower
melting with high temp
growing Ingot from seed.
• Sawing mono ingot into
170~200㎛ slices for Solar cell
• Cell effciency 24.2%(World best)
• First adoption 100% diamond –
wire wafer process
• Specialized in high quality monocrystalline ingot and wafer production
• Global No.1 in the field of single Crystalline Solar silicon in 2011
On completion of building 2 in 2011, expected to have 20% M/S of single crystal ingot/wafer market

8
Confidential. Not to be copied, reproduced or redistributed.
I. Company Overview
Creating bright future
with solar energy
II. Investment Highlights1. Secure and stable supply
2. Vertically Integrated Solar Value Chain
3. Diversification of the client base
4. Capacity Expansion(Economics of Scale)
5. Cost Reduction & Competitive Leadership
6. Building eco-friendly system

9
Confidential. Not to be copied, reproduced or redistributed.
1. Secure and stable supply
Stableproductsupply
590 650 650 650 650
5
355
1000
1355 1400
2010 2011(E) 2012(E) 2013(E) 2014(E)
Fabs 1&2 fab 3
SunPower Capacity Expansion(E)
2,0502,005
1,650
1,005
(Unit: MW)
• Woongjin Group and SunPower(US) signed a joint venture to create a
viable solar energy company for a stable ingot supply to SunPower
• Trustworthy partnership in terms of quality, supply and price
• Win-Win partnership and vertical integration, with long-term
contract(Until 2016)
Joint Venture & Captive Market
595
• Close and trustworthy partnership with SunPower
[[Source: SunPower Jun 7th,2011]
Fab 3Fab 1&2

10
Confidential. Not to be copied, reproduced or redistributed.
• Long term supply contract with SunPower Receive polySilicon from 2007 to 2016
• Raw materials supplied by Woongjin Polysilicon(PolySilicon will supply over 1,500 ton to WJE)
• We can obtain polysilicon with stable and reasonable prices through long term supply contract
2. Vertically Integrated Solar Value Chain
SolarCell / Panel
PolySilicon
Ingot / WaferInstallation
<Power Generation>
WJ Polysilicon WJ Energy SunPower / AUO SP SunPower
5,000 MT/yr.1GW (Ingot)
500MW (Wafer)> 1GW/yr.(E) >4GW/yr.(E)
17,000MT/yr.by 2013
2GW (Ingot)1.5GW (Wafer)
by 2013
> 2GW/yr.
by 2014(E) >6GW/yr.(E)
Hemlock,Wacker,OCI,GCL,REC, Tokuyama
LDK,GCL,Renesola, Solargiga,Yingli,REC,
MEMC,Trina
Suntech,JA Solar,Q-Cell,
Motech,Yingli,Jinko,Sharp
Canadian Solar,LDK
Company
Capacity(2011)
Expansion
Competitors
< < <
[Source: WJE Company]

11
Confidential. Not to be copied, reproduced or redistributed.
3. Diversification of the client base
OVERSEA
DOMESTIC
• Sales Contract (Jan. 2011 ~ Dec. 2011 )
• USD 36Mil.(on discussion extending contract)
• Sales Contract (Oct. 2010~ Dec. 2011 )
• USD 26Mil.
• Sales Contract(Aug. 2010 ~ Dec. 2011 )
• USD 108Mil.(on discussion extending contract)
• Sales Contract(Sep. 2010 ~ Dec. 2011)
• USD 19Mil.
• Qual sample tested.
• On Discussion long term contract
95%
5%
85%
15%
Current
SunPower
Others
Diversified client base
• Reduce dependence on SunPower over the long-term through the diversification of the client base
Company “L”Company “S”
As of Dec. 2009
As of Dec. 2010
60%
40%
As of Dec. 2011(E)
Establish
#2 Plant
• Expand production line for Mono N-type wafer
• Discuss continuous for supply 2011
Company “B”Company “C”
Company “I”
• Sales Contract(Oct. 2010 ~ Dec. 2013 )
• USD 44Mil.
Taiwan
Germany
Austria • Sales Contract(Mar. 2011 ~ Dec. 2015)
• USD 115Mil.

12
Confidential. Not to be copied, reproduced or redistributed.
4. Capacity Expansion(Economics of Scale)
Capacity Expansion(E)
(bn. KRW) Amount
2010(A) 141
2011(E) 156
2012(E) 175
2013(E) 180
(Unit: MW)
• Since 2010, Increased Capex amount for new business and capacity expansion.
• Global Leader in Solar Business by 2013
350 350 350 350
150
650 650 650
500
1000
2010A 2011(E) 2012(E) 2013(E)
Fab1 Fab2 Fab3
Capital Expenditure Estimate
21.3
244
432.5
514.4
2011(E) 2012(E) 2013(E) 2014(E)
Fab 3 Investment(Accumulated Capex)
• Objective: Potential Customers Serious CustomersMarket Leadership & Economy of scale through Capa expansion
• Scale: Capex : 514.4 billion KRW Capacity : 1 GW cf. Fab. 1&2 (1GW) + Feb.3(1GW) =Total : (2GW)Equipment : Grower : 384 EA / Wire – Saw : 72 EA
•Sales Portion
Fab 3 Investment Summary
(Unit: bn. KRW)
Debt financing269.3bn(KRW)
*CB,BW Issue( partially )
260.0bn(KRW)
* Could be change without notice
100
40 60
6040
Fab1 Fab2 FAB3
Non-SunPower
SunPower

13
Confidential. Not to be copied, reproduced or redistributed.
5. Cost Reduction & Competitive Leadership
1st Charge(118kg) 2nd Charge(50kg)1st Ingot 2nd Ingot
GrowingProcess
GrowingProcess
• Less Quarts
• Less Electricity
• Less usage
• Increasing of productivity
• Decreasing of Unit Cost(USD 3Mil./yr.)
Ingot(Multi-Pulling)
• Woongjin Energy has high margin structure based on cost leadership
• Improving profitability as strengthening of competitive leadership such as Ingot, Wafer
< Increasing productivity 1.8X for 1 QZ crucible>
Wafer(Dimand Wiresaw)
SiC Slurry on Bare Wire
Coolant on Diamond Wire
Develop non-slurry wire-saw process
Increase productivity and secure cost competitiveness
• Increase productivity(capa 1.6X/unit)
• Lower Manufacturing cost
• Save Capex for Slurry recycle system(2 bil. KRW)
• Save Capex for wire saw(72ea → 36ea)
• Easy Coolant Recycle(Eco-friendly process)
14
Confidential. Not to be copied, reproduced or redistributed.
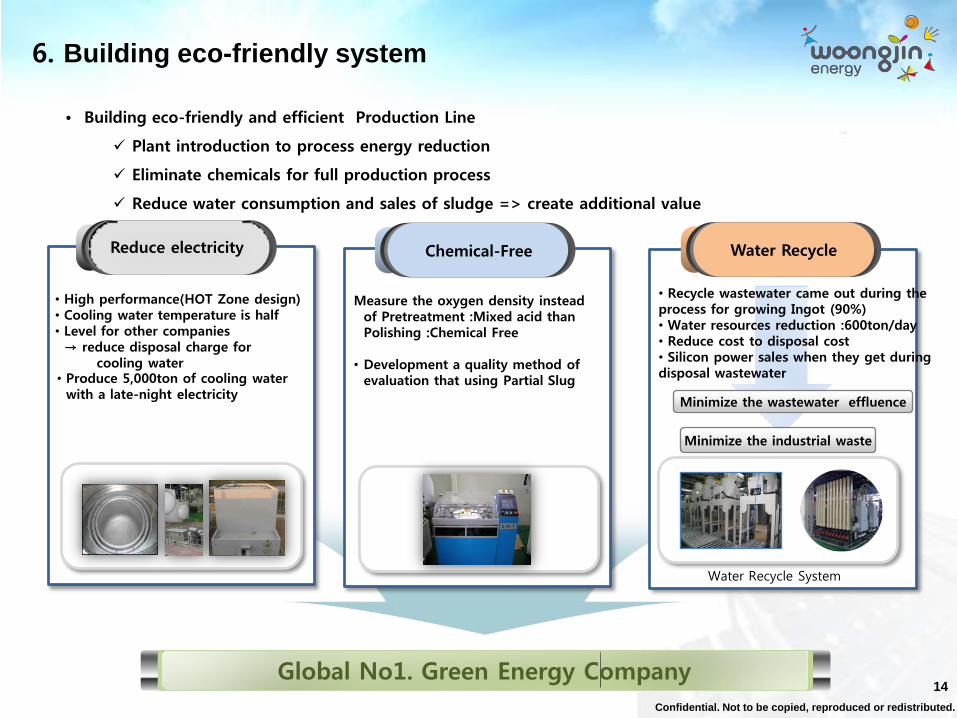
6. Building eco-friendly system
• Building eco-friendly and efficient Production Line
Plant introduction to process energy reduction
Eliminate chemicals for full production process
Reduce water consumption and sales of sludge => create additional value
222
Chemical-Free Water Recycle
• High performance(HOT Zone design)• Cooling water temperature is half • Level for other companies→ reduce disposal charge for
cooling water
Water Recycle System
Reduce electricity
• Produce 5,000ton of cooling water with a late-night electricity
• Recycle wastewater came out during the process for growing Ingot (90%)• Water resources reduction :600ton/day• Reduce cost to disposal cost• Silicon power sales when they get during disposal wastewater
Minimize the wastewater effluence
Minimize the industrial waste
Global No1. Green Energy Company
Measure the oxygen density instead of Pretreatment :Mixed acid than Polishing :Chemical Free
• Development a quality method of evaluation that using Partial Slug

15
Confidential. Not to be copied, reproduced or redistributed.
III. Financial Review

16
Confidential. Not to be copied, reproduced or redistributed.
1. WJ Energy Condensed Income Statement
Revenue Breakdown
2Q 11 2Q 10 (+/-) 1H 11 1H 10 (+/-)
Revenue 80.7 33.1 143.8% 157.2 64.7 143.0%
Ingot 52.1 28.8 80.9% 89.5 56.4 58.7%
Wafer 26.8 2.1 1176.2% 64.0 6.5 884.6%
Other 1.8 2.2 -18.2% 3.7 1.8 105.6%
Gross Profit 13.2 16.6 -20.5% 26.6 32.6 -18.4%
Ingot 15.3 16.1 -5.0% 27.6 32.1 -14.0%
Wafer -3 0.2 -1600.0% -3.1 0 -
Other 0.9 0.3 200.0% 2.1 0.5 320.0%
EBITDA 16.9 18.2 -7.1% 34.3 35.8 -4.2%
Operating Profit 9.9 14.8 -33.1% 21.1 29.1 -27.5%
Non-Operating Income 1.2 0.8 50.0% 3.8 0.8 375.0%
Non-Operating Expenses 1.4 1.4 0.0% 34.4 2.6 1223.1%
Interest Expenses 1.4 1.4 0.0% 2.4 2.5 -4.0%
EBiT 9.7 14.2 -31.7% 21.6 27.4 -21.2%
Net Profit 9.6 10.9 -11.9% 18.9 20.9 -9.6%
Condensed Income Statement
37.4
52.1
28.8
37.2
26.8
2.1
1.91.8
2.2
1Q 11 2Q 11 2Q 10
Ingot Wafer Orher
14.6% 12.3%
44.7%
• 2Q FY11 Sales : Decline German MKT Reduce PV support policy
• Despite of declined MKT, sales increased through capa expansion and wafer sales(YoY 143.8%)
• Operating profit : Polysilicon price up(1Q) / ASP down(1H)
• Net income totaled 9.6 billion won, improved by 3.2% QoQ and declined by -11.9% YoY.
17
Confidential. Not to be copied, reproduced or redistributed.
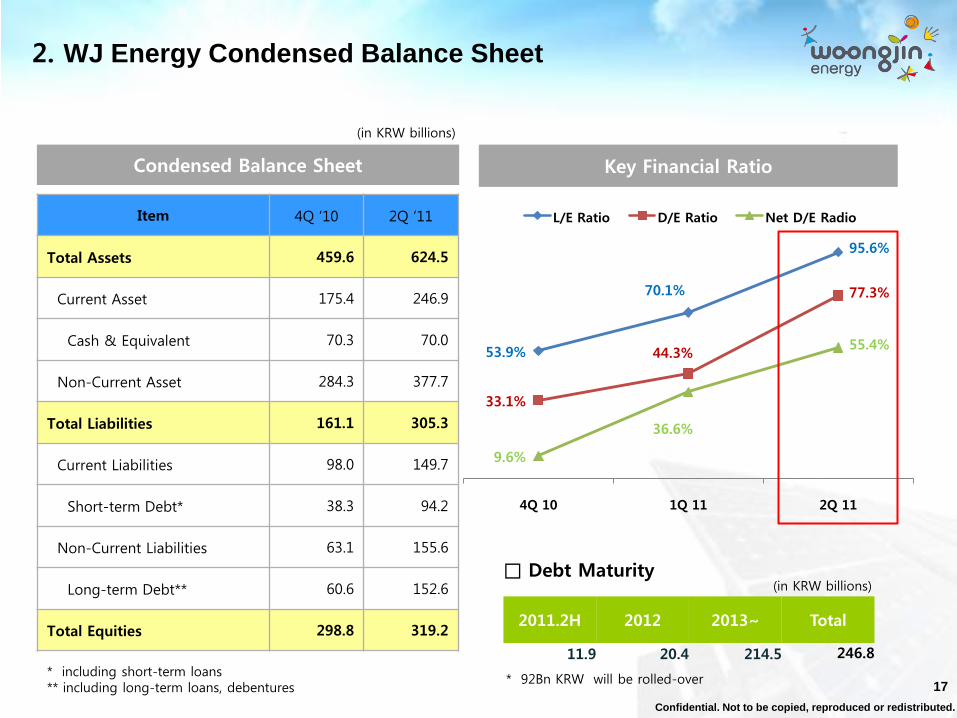
2. WJ Energy Condensed Balance Sheet
Item 4Q ‘10 2Q ‘11
Total Assets 459.6 624.5
Current Asset 175.4 246.9
Cash & Equivalent 70.3 70.0
Non-Current Asset 284.3 377.7
Total Liabilities 161.1 305.3
Current Liabilities 98.0 149.7
Short-term Debt* 38.3 94.2
Non-Current Liabilities 63.1 155.6
Long-term Debt** 60.6 152.6
Total Equities 298.8 319.2
Condensed Balance Sheet
(in KRW billions)
* including short-term loans ** including long-term loans, debentures
Key Financial Ratio
2011.2H 2012 2013~ Total
11.9 20.4 214.5 246.8
□ Debt Maturity(in KRW billions)
53.9%
70.1%
95.6%
33.1%
44.3%
77.3%
9.6%
36.6%
55.4%
4Q 10 1Q 11 2Q 11
L/E Ratio D/E Ratio Net D/E Radio
* 92Bn KRW will be rolled-over

18
Confidential. Not to be copied, reproduced or redistributed.
3. Performance & Forecast
Sales performance
(Unit : billion KRW)
2.8
67.7
118.9
160.3
441.4
FY 07 FY 08 FY 09 FY 10 FY 11(E)
Income performance
OP margin
NP marginOperating profit
Net profit
(Unit: billion KRW, %)
-88.2%
55.2%47.5%
36.9%
15.4%
-67.4%
49.9%34.5%
26.0%11.1%
-2.5
37.4
56.5 57.4
68.0
-1.9
33.841.0 44.3
49.2
FY 07 FY 08 FY 09 FY 10 FY 11(E)
• Sales increased rapidly with high profitability after the establishment
After establishment, Sales has greatly increased with a stable customer “SunPower”
Accomplished high productivity and competitive cost structure
• Aggressive expansion(Fab3) FY2015 1trillion sales(Global Top Tier)
CAGR : 254.3%

19
Confidential. Not to be copied, reproduced or redistributed.
Appendices

20
Confidential. Not to be copied, reproduced or redistributed.
Woongjin Food
Educationpublishing
Woongjin Mirae Mngt Academy
environmentmaterial
ConstructionsLeisure
Photovoltaic
Other
Listed
Woongjin Thinkbig
Woongjin CowayWoongjin Chemical
Kukdong Construction
Woongjin Ceramic
Woongjin Passone
Bookxen
Service/finance
Woongjin Poly Silicon
“Love and Love more”
• Established its first company Woongjin Think Big, an education & publishing company in 1980
• Based on the corporate philosophy of “Tto-tto Saran(Love and Love more)”
• Woongjin Group benefits from the synergies generated by 30 affiliates spread across a wide spectrum of industries
Appendix I : Overview of Woongjin Group

21
Confidential. Not to be copied, reproduced or redistributed.
Investment Asset Value Asset Portfolio
1,348.9
1,913.7
2,246.3 2,127.3
'08년말 '09년말 '10년말 '11년 1Q
(Unit: bil. KRW)
• Increase PV Biz(asset) value through continuous investment on WJ Energy & WJ Polysilicon
• Focus on PV Biz for new growth momentum
Appendix II : Focusing on PV Biz
* applying average stock price to listed subsidiaries and book value to unlisted subsidiaries
FY08A FY09A FY10A FY11 1Q
8.9% 9.5% 8.1% 6.8%
48.1% 48.9%39.3% 38.9%
9.5% 8.7%25.0% 25.3%
31.3% 31.3%26.7% 28.2%
2.1% 1.6% 0.9% 0.8%
FYO8A FY09A FY10A FY11 1Q
WJ Thinkbig WJ Coway WJE/WJP Kukdong Others

22
Confidential. Not to be copied, reproduced or redistributed.
'10년 '12년(E) '13년(E)
Capacity Expansion(E)
5,000
7,000
17,000
Period Total
Hyundai Heavy Indu. 5yr. $500mn
BYD (China) 3yr. $200mn
WoongjinEnergy 5yr. $300mn
Risun Solar (China) 5yr. $200mn
Exceeded 21%Q1 Target
(Unit : MT)
P1.5: +2,000
P2: +10,000
20%
32%
64%
77%
95%
1월 2월 3월 4월 5월(E)
(Unit : MT)
Operating Ratio
Sales Contract
Production Target & Shipment
Appendix III : Fast ramp-up of WJ Polysilicon
FY10A FY11(E) FY13(E)
Jan. Feb. Mar. Apr. May.
3,500
Q1 '11 Q4 '11
Production Target Shipment
• Producing over 9N grade polysilicon at 5,00MT/y capa, full ramp-up from 2Q 2011

23
Confidential. Not to be copied, reproduced or redistributed.
Listed Company
Non-Listed Company
WJ Coway
WJ Chemical
28.4%
45.2%
WJ Thinkbig
WJ Passone
32.4%
61.8%
66.5%
OPMS
WJ Foods
47.8%
WJ Energy
WJ Polysilicon
38.2%
50.8%
Kukdong E&C
94.7%
Rexfield C.C.
WJ Playdoci
43.2%
80.3%
Woongjin Holdings
Booxen
51.0%
Environment / MaterialEducation / Publishing OthersSolar Construction / Leisure
(As of March 31, 2011)
Holding
Co.IT / MRO
Appendix IV : WJ Group governance structure

24
Confidential. Not to be copied, reproduced or redistributed.
Fab 1 & 2 Fab 3(E)
Appendix IV : Facility Status
Location1316 KwanPyung-Dong,
Yuseong-Gu. Daejeon
AreaBuilding area : 13,992m2,
Total area : 36,527m2
ConstructionFab 1 : Mar. 2007
Fab 2 : Nov. 2009
Completion September 2010(Fab 1 & 2)
InvestmentFab 1 : 150 Bil. KRWFab 2 : 270 Bil. KRW
Production
capacity
Fab 1 2,000MT/yr.Fab 2 4,000MT/yr.
Location64-1 Tamnip-Dong,
Yuseong-Gu. Daejeon
AreaBuilding area : 19,507m2,
Total area : 33,059.m2
Construction October 2011
Completion December 2013
Investment 514.4 Bil. KRW
Production
capacity6,000MT/yr.
25
Confidential. Not to be copied, reproduced or redistributed.
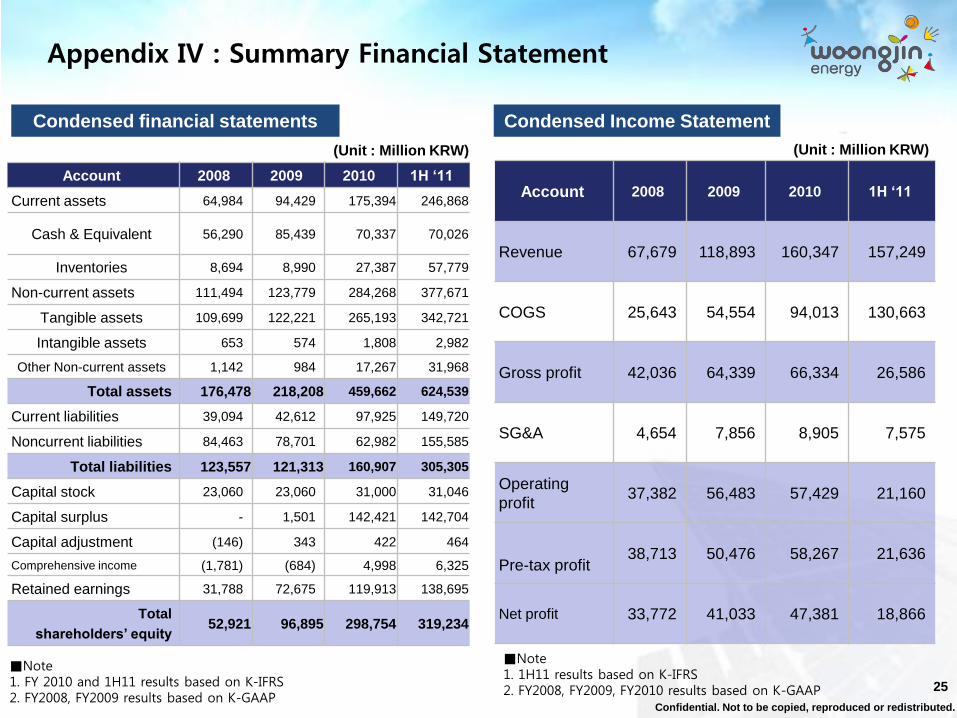
Appendix IV : Summary Financial Statement
Condensed financial statements
(Unit : Million KRW)
Condensed Income Statement
Account 2008 2009 2010 1H „11
Current assets 64,984 94,429 175,394 246,868
Cash & Equivalent 56,290 85,439 70,337 70,026
Inventories 8,694 8,990 27,387 57,779
Non-current assets 111,494 123,779 284,268 377,671
Tangible assets 109,699 122,221 265,193 342,721
Intangible assets 653 574 1,808 2,982
Other Non-current assets 1,142 984 17,267 31,968
Total assets 176,478 218,208 459,662 624,539
Current liabilities 39,094 42,612 97,925 149,720
Noncurrent liabilities 84,463 78,701 62,982 155,585
Total liabilities 123,557 121,313 160,907 305,305
Capital stock 23,060 23,060 31,000 31,046
Capital surplus - 1,501 142,421 142,704
Capital adjustment (146) 343 422 464
Comprehensive income (1,781) (684) 4,998 6,325
Retained earnings 31,788 72,675 119,913 138,695
Total
shareholders‟ equity52,921 96,895 298,754 319,234
Account 2008 2009 2010 1H „11
Revenue 67,679 118,893 160,347 157,249
COGS 25,643 54,554 94,013 130,663
Gross profit 42,036 64,339 66,334 26,586
SG&A 4,654 7,856 8,905 7,575
Operating
profit37,382 56,483 57,429 21,160
Pre-tax profit38,713 50,476 58,267 21,636
Net profit 33,772 41,033 47,381 18,866
(Unit : Million KRW)
■Note1. FY 2010 and 1H11 results based on K-IFRS2. FY2008, FY2009 results based on K-GAAP
■Note1. 1H11 results based on K-IFRS2. FY2008, FY2009, FY2010 results based on K-GAAP
26
Confidential. Not to be copied, reproduced or redistributed.
26
Confidential. Not to be copied, reproduced or redistributed.
Thank You