women - milmi.org
TRANSCRIPT
1
WOMENIN THE MICHIGAN WORKFORCE
STATE OF MICHIGANDepartment of Technology, Management & Budget
Bureau of Labor Market Information and Strategic Initiatives
2
IT’S BIGGER THAN DATA.The Bureau of Labor Market Information and Strategic Initiatives is your one-stop shop for information and analysis on Michigan’s population, labor market, and more.
• Our Federal-State Programs division runs the state’s cooperative agreements with the U.S. Bureau of Labor Statistics and the U.S. Census Bureau, making us the official source for this information.
• Our Research and Analytics division conducts workforce research and program evaluation, giving you the insight you need to make smarter decisions.
EVAN LINSKEYEconomic Analyst [email protected]
TRISHA SCHLEGELEconomic Analyst [email protected]
NICK GANDHIEconomic [email protected]
MARK REFFITTEconomic Specialist [email protected]
SCOTT [email protected]
TABLE OF CONTENTS
3 Executive Summary
5 Introduction
6 Labor Force and Unemployment
10 Earnings
12 Patterns of Work
14 Employment by Industry
16 Employment by Occupation
18 Poverty
20 Education
23 Additional Areas for Consideration
27 Conclusion
WOMENIN THE MICHIGAN WORKFORCE
ACKNOWLEDGMENTS
We would like to thank Director Stephanie Beckhorn and our partners in the Department of Labor and Economic Opportunity, Employment & Training for their support in the development of this report. We would also like to thank LMISI staff that contributed to this report including Ruth Archer, Hailey Barrus, Eric Guthrie, Alan Leach, and Bruce Weaver.
3
Executive Summary
Both men and women experienced sharp drops in employment in April 2020 due to the pandemic. Men saw a 23.3 percent reduction in employment, while the drop for women registered 26.3 percent. However, the initial massive employment loss for women continued for a longer period and has failed to recover, while male employment has nearly bounced back to pre-pandemic levels.
Between February and December 2020, roughly 136,000 women left the labor force, registering a 5.8 percent decline. Comparatively, the male labor force has recovered from its early pandemic loss, and was up nearly 18,000 during the same period (0.7 percent).
Michigan women who worked full-time, year-round in 2019 counted median earnings of $41,475 compared to $53,150 for men. Meaning, women working full-time make about 78 cents on the dollar compared to men. Nationally, women made $43,215 while men made $52,989, representing an earnings gap of 82 cents per every dollar men earn, on average.
Earnings not only varied by gender, but also by race or ethnicity. When comparing full-time, year-round workers, for every dollar white, non-Hispanic men made, white, non-Hispanic women made 76 cents, Black/African American women earned 65 cents and Hispanic/Latina women made even less at 57 cents.
Only 57 percent of women work full-time, year-round compared to 71 percent of men. This adds up to about 460,000 less women than men working full-time, which is even more stark given the fact there are about 15,000 more women ages 16 to 64 than men in the state.
In the fourth quarter of 2020, 5.8 percent of womenin Michigan had multiple jobs, while this number was considerably lower for Michigan men (4.0 percent). This was higher than the 5.2 percent of women with multiple jobs at the national level.
Women tend to be concentrated in industry sectors with average wages below the all-industry average. About two out of every three Michigan women holding a payroll job were employed in an industry sector with below average wages in 2019. Additionally, 99 percent of detailed industry groups in Michigan had an average pay disparity favoring men in 2019.
Overall, women are more likely to experience poverty than men; in 2019, an estimated 14.0 percent of all women were below the poverty level compared to 11.9 percent of men. Roughly 699,000 women were below the poverty level statewide compared to 570,000 men.
Over 470,000 Michigan households are families led by women with no spouse present. This represents almost 12 percent of Michigan households and is more than double the number of male-led family households with no spouse present (201,200 or 5 percent).
The state is home to 139,000 women over 85. This nearly doubles the 74,000 men over that age. As individuals live longer, they either need to save more money for retirement or find jobs with retirement benefits. This can be especially difficult for women as they earn less than their male counterparts and are more likely to work part-time, lacking benefits.
4
5
The COVID-19 pandemic has brought increased attention to the role of women in the workforce in the past year. While the Michigan economy overall experienced historic contraction in 2020, the impact on women has been especially felt, exacerbating many of the long-standing workforce inequalities that have persisted for decades across the state and nation. This report examines key information on the role of women in the workforce, addressing both recent challenges they have faced considering the effects of the pandemic and the longer-term gender disparities in the Michigan economy and labor market.
While women have generally experienced an upward trend in labor force participation over the past several decades, there is evidence that their labor force levels in the past year have suffered disproportionately to men across both the U.S. and Michigan. The opening section of this report explores this topic and unemployment. Although jobless rate trends during the pandemic period were similar for each gender, the recent loss of women in the state’s workforce continued throughout the year even as men experienced a recovery through the later months of 2020. Parental roles appear to have some part in this, as national data presented in this section suggest that women with children especially struggled to rejoin the labor force during this period.
Another major inequality faced by women in the labor market is the pay gap, highlighted in the earnings
section of this report. While at least some of the earnings difference between men and women is explained by the higher share of women working part-time jobs, there is more to the story. The analysis that follows found that Michigan women who worked full-time, year-round only earned 78 cents on the dollar compared to men, and the disparity only grows when looking at women of color.
The industry and occupational employment sections that follow provide a look at the types of industries where women are employed in Michigan, the types of jobs they hold, and how average wages in those sectors compare to men and the overall average. A key takeaway from this analysis is that the gender pay gap persists when comparing wages across industry sectors and occupations as well.
Rounding out the report, other factors affecting women disproportionately in the workforce such as households, poverty, patterns of work, education, and health insurance coverage are explored. Though this report sheds light on a number of important challenges faced by women in the Michigan workforce, the situation continues to evolve as the pandemic continues to impact the state and national economies. Data scheduled for release in the coming months and years are expected to offer further insight into many of the topics covered here that were affected by the COVID-19 pandemic, and help decision makers better understand the long-term implications.
Women in the Michigan Workforce
6
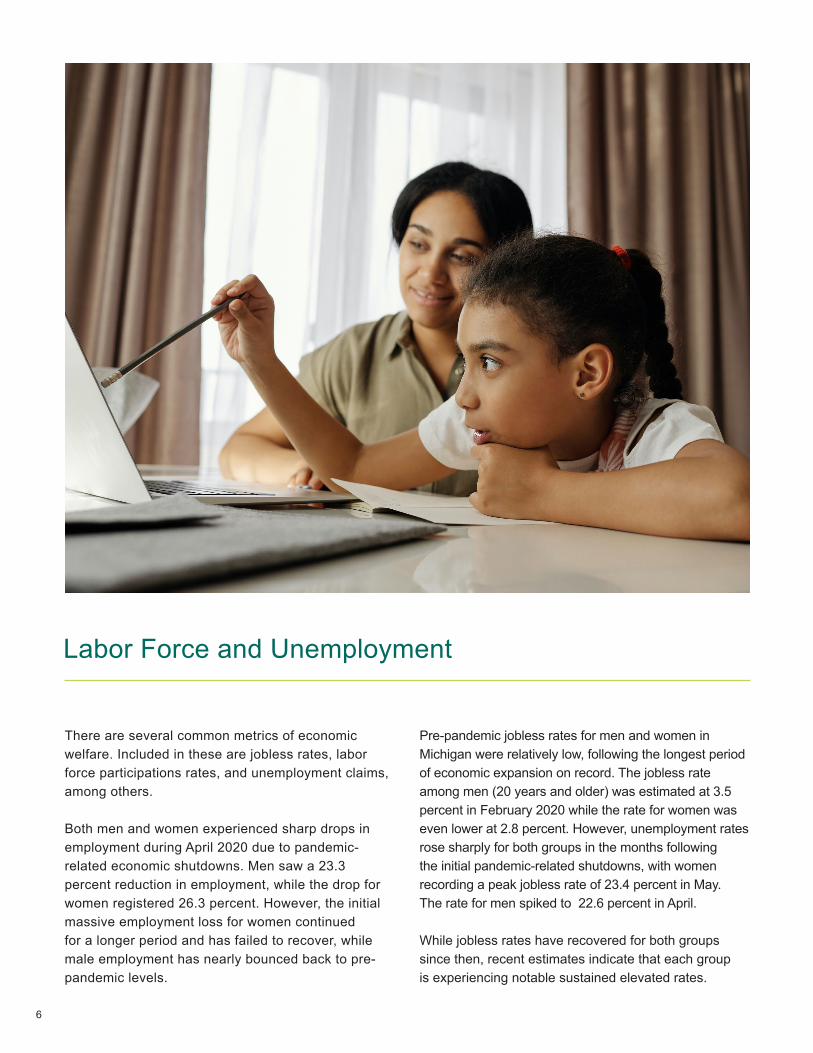
There are several common metrics of economic welfare. Included in these are jobless rates, labor force participations rates, and unemployment claims, among others.
Both men and women experienced sharp drops in employment during April 2020 due to pandemic-related economic shutdowns. Men saw a 23.3 percent reduction in employment, while the drop for women registered 26.3 percent. However, the initial massive employment loss for women continued for a longer period and has failed to recover, while male employment has nearly bounced back to pre-pandemic levels.
Labor Force and Unemployment
Pre-pandemic jobless rates for men and women in Michigan were relatively low, following the longest period of economic expansion on record. The jobless rate among men (20 years and older) was estimated at 3.5 percent in February 2020 while the rate for women was even lower at 2.8 percent. However, unemployment rates rose sharply for both groups in the months following the initial pandemic-related shutdowns, with women recording a peak jobless rate of 23.4 percent in May. The rate for men spiked to 22.6 percent in April.
While jobless rates have recovered for both groups since then, recent estimates indicate that each group is experiencing notable sustained elevated rates.
7
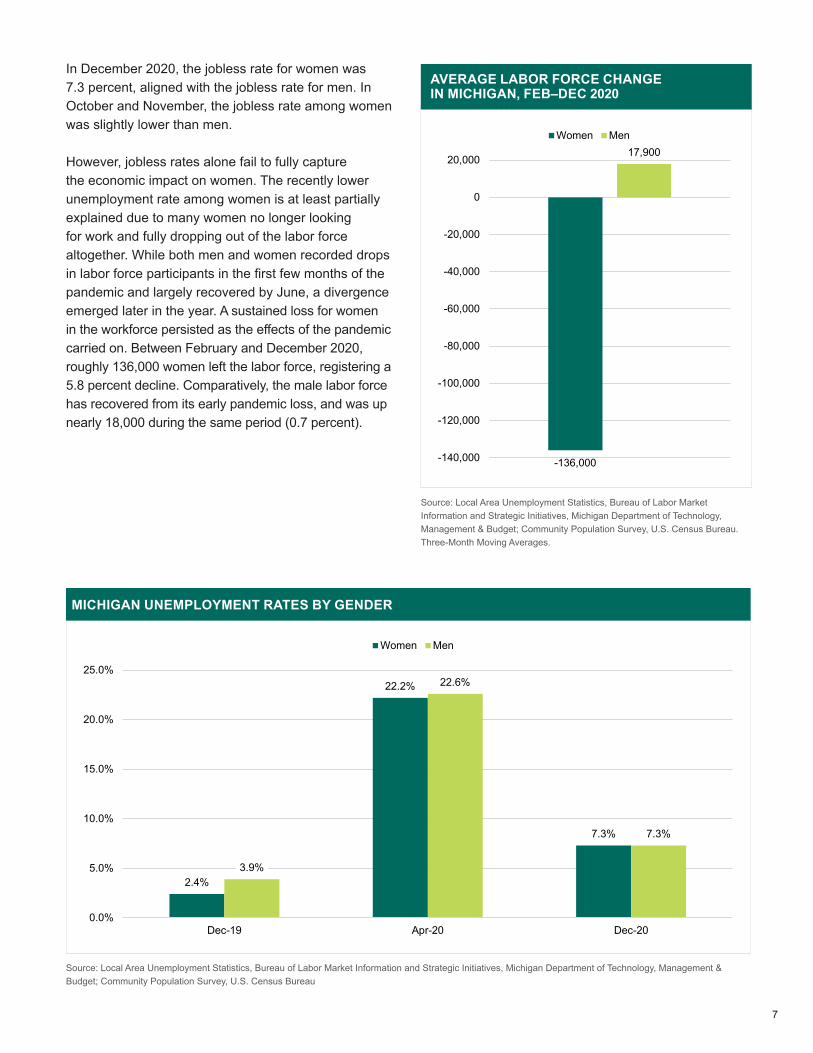
AVERAGE LABOR FORCE CHANGE IN MICHIGAN, FEB–DEC 2020
Source: Local Area Unemployment Statistics, Bureau of Labor Market Information and Strategic Initiatives, Michigan Department of Technology, Management & Budget; Community Population Survey, U.S. Census Bureau. Three-Month Moving Averages.
MICHIGAN UNEMPLOYMENT RATES BY GENDER
Source: Local Area Unemployment Statistics, Bureau of Labor Market Information and Strategic Initiatives, Michigan Department of Technology, Management & Budget; Community Population Survey, U.S. Census Bureau
In December 2020, the jobless rate for women was 7.3 percent, aligned with the jobless rate for men. In October and November, the jobless rate among women was slightly lower than men.
However, jobless rates alone fail to fully capture the economic impact on women. The recently lower unemployment rate among women is at least partially explained due to many women no longer looking for work and fully dropping out of the labor force altogether. While both men and women recorded drops in labor force participants in the first few months of the pandemic and largely recovered by June, a divergence emerged later in the year. A sustained loss for women in the workforce persisted as the effects of the pandemic carried on. Between February and December 2020, roughly 136,000 women left the labor force, registering a 5.8 percent decline. Comparatively, the male labor force has recovered from its early pandemic loss, and was up nearly 18,000 during the same period (0.7 percent).
2.4%
22.2%
7.3%
3.9%
22.6%
7.3%
0.0%
5.0%
10.0%
15.0%
20.0%
25.0%
Dec-19 Apr-20 Dec-20
Women Men
-136,000
17,900
-140,000
-120,000
-100,000
-80,000
-60,000
-40,000
-20,000
0
20,000
Women Men
8
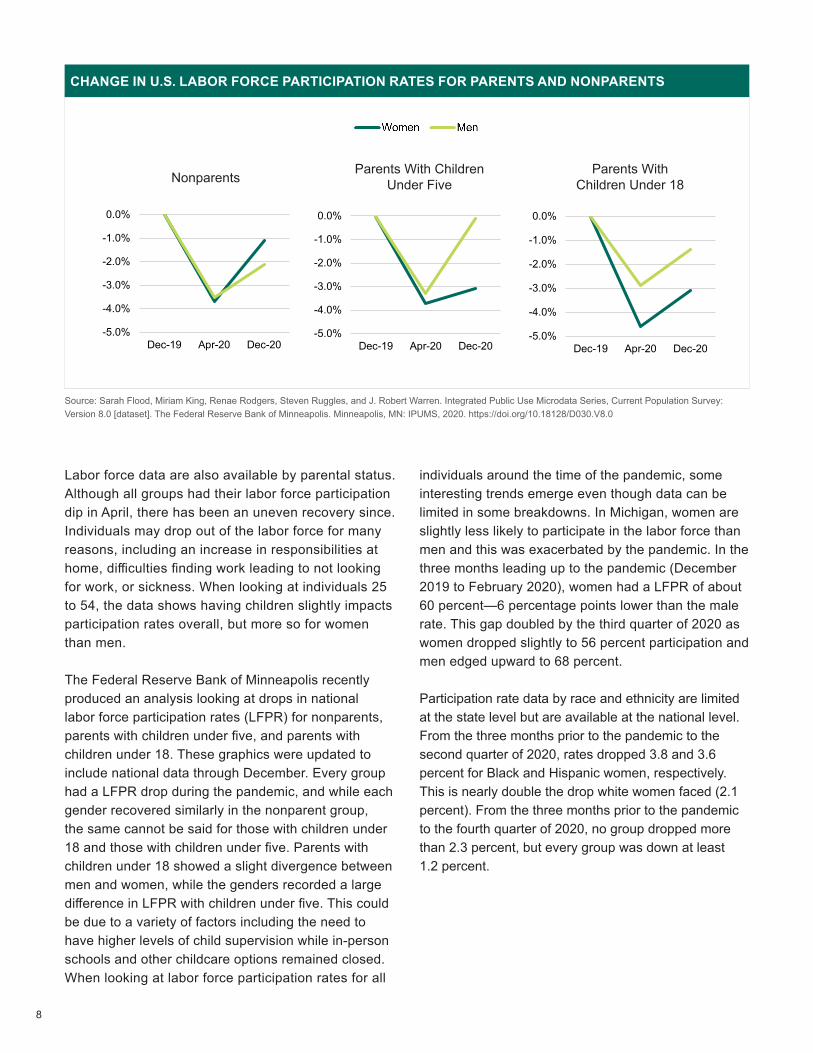
CHANGE IN U.S. LABOR FORCE PARTICIPATION RATES FOR PARENTS AND NONPARENTS
Nonparents Parents With Children Under Five
Labor force data are also available by parental status. Although all groups had their labor force participation dip in April, there has been an uneven recovery since. Individuals may drop out of the labor force for many reasons, including an increase in responsibilities at home, difficulties finding work leading to not looking for work, or sickness. When looking at individuals 25 to 54, the data shows having children slightly impacts participation rates overall, but more so for women than men.
The Federal Reserve Bank of Minneapolis recently produced an analysis looking at drops in national labor force participation rates (LFPR) for nonparents, parents with children under five, and parents with children under 18. These graphics were updated to include national data through December. Every group had a LFPR drop during the pandemic, and while each gender recovered similarly in the nonparent group, the same cannot be said for those with children under 18 and those with children under five. Parents with children under 18 showed a slight divergence between men and women, while the genders recorded a large difference in LFPR with children under five. This could be due to a variety of factors including the need to have higher levels of child supervision while in-person schools and other childcare options remained closed.When looking at labor force participation rates for all
individuals around the time of the pandemic, some interesting trends emerge even though data can be limited in some breakdowns. In Michigan, women are slightly less likely to participate in the labor force than men and this was exacerbated by the pandemic. In the three months leading up to the pandemic (December 2019 to February 2020), women had a LFPR of about 60 percent—6 percentage points lower than the male rate. This gap doubled by the third quarter of 2020 as women dropped slightly to 56 percent participation and men edged upward to 68 percent.
Participation rate data by race and ethnicity are limited at the state level but are available at the national level. From the three months prior to the pandemic to the second quarter of 2020, rates dropped 3.8 and 3.6 percent for Black and Hispanic women, respectively. This is nearly double the drop white women faced (2.1 percent). From the three months prior to the pandemic to the fourth quarter of 2020, no group dropped more than 2.3 percent, but every group was down at least 1.2 percent.
Source: Sarah Flood, Miriam King, Renae Rodgers, Steven Ruggles, and J. Robert Warren. Integrated Public Use Microdata Series, Current Population Survey: Version 8.0 [dataset]. The Federal Reserve Bank of Minneapolis. Minneapolis, MN: IPUMS, 2020. https://doi.org/10.18128/D030.V8.0
Parents With Children Under 18
-5.0%
-4.0%
-3.0%
-2.0%
-1.0%
0.0%
Dec-19 Apr-20 Dec-20-5.0%
-4.0%
-3.0%
-2.0%
-1.0%
0.0%
Dec-19 Apr-20 Dec-20-5.0%
-4.0%
-3.0%
-2.0%
-1.0%
0.0%
Dec-19 Apr-20 Dec-20
9
CHANGE IN U.S. LABOR FORCE PARTICIPATION RATES FOR PARENTS AND NONPARENTS
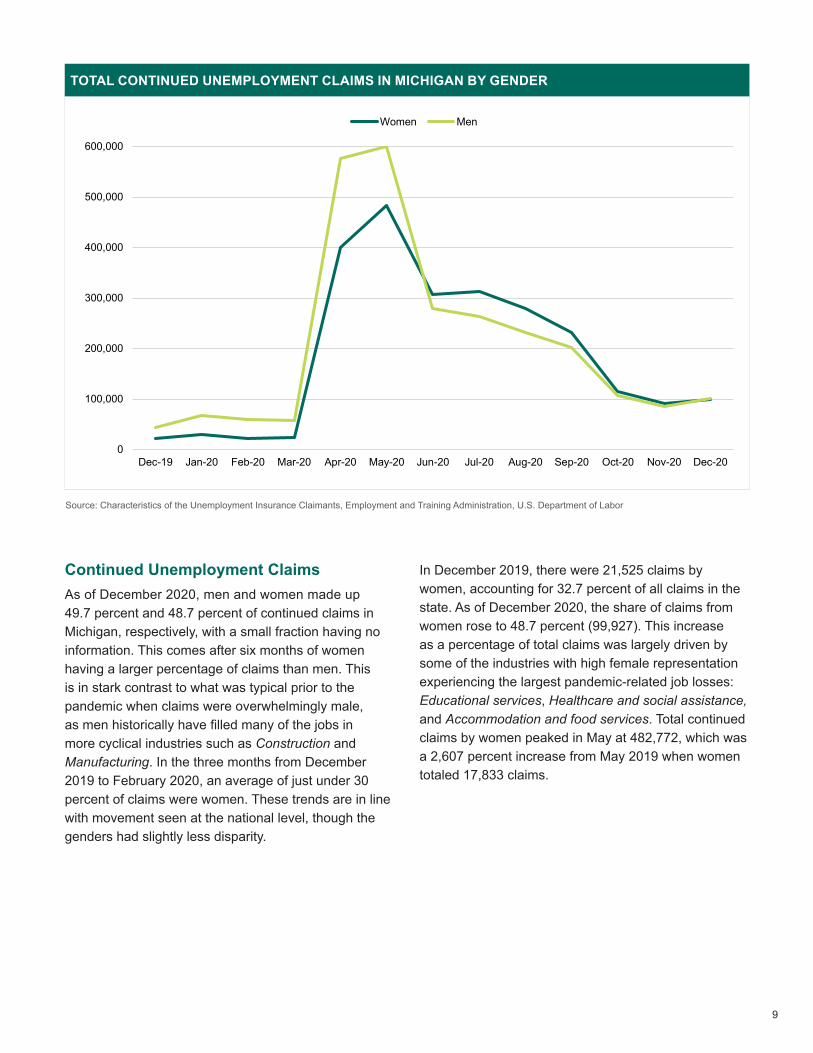
Continued Unemployment Claims As of December 2020, men and women made up 49.7 percent and 48.7 percent of continued claims in Michigan, respectively, with a small fraction having no information. This comes after six months of women having a larger percentage of claims than men. This is in stark contrast to what was typical prior to the pandemic when claims were overwhelmingly male, as men historically have filled many of the jobs in more cyclical industries such as Construction and Manufacturing. In the three months from December 2019 to February 2020, an average of just under 30 percent of claims were women. These trends are in line with movement seen at the national level, though the genders had slightly less disparity.
In December 2019, there were 21,525 claims by women, accounting for 32.7 percent of all claims in the state. As of December 2020, the share of claims from women rose to 48.7 percent (99,927). This increase as a percentage of total claims was largely driven by some of the industries with high female representation experiencing the largest pandemic-related job losses: Educational services, Healthcare and social assistance, and Accommodation and food services. Total continued claims by women peaked in May at 482,772, which was a 2,607 percent increase from May 2019 when women totaled 17,833 claims.
TOTAL CONTINUED UNEMPLOYMENT CLAIMS IN MICHIGAN BY GENDER
Source: Characteristics of the Unemployment Insurance Claimants, Employment and Training Administration, U.S. Department of Labor
0
100,000
200,000
300,000
400,000
500,000
600,000
Dec-19 Jan-20 Feb-20 Mar-20 Apr-20 May-20 Jun-20 Jul-20 Aug-20 Sep-20 Oct-20 Nov-20 Dec-20
Women Men
10
Earnings
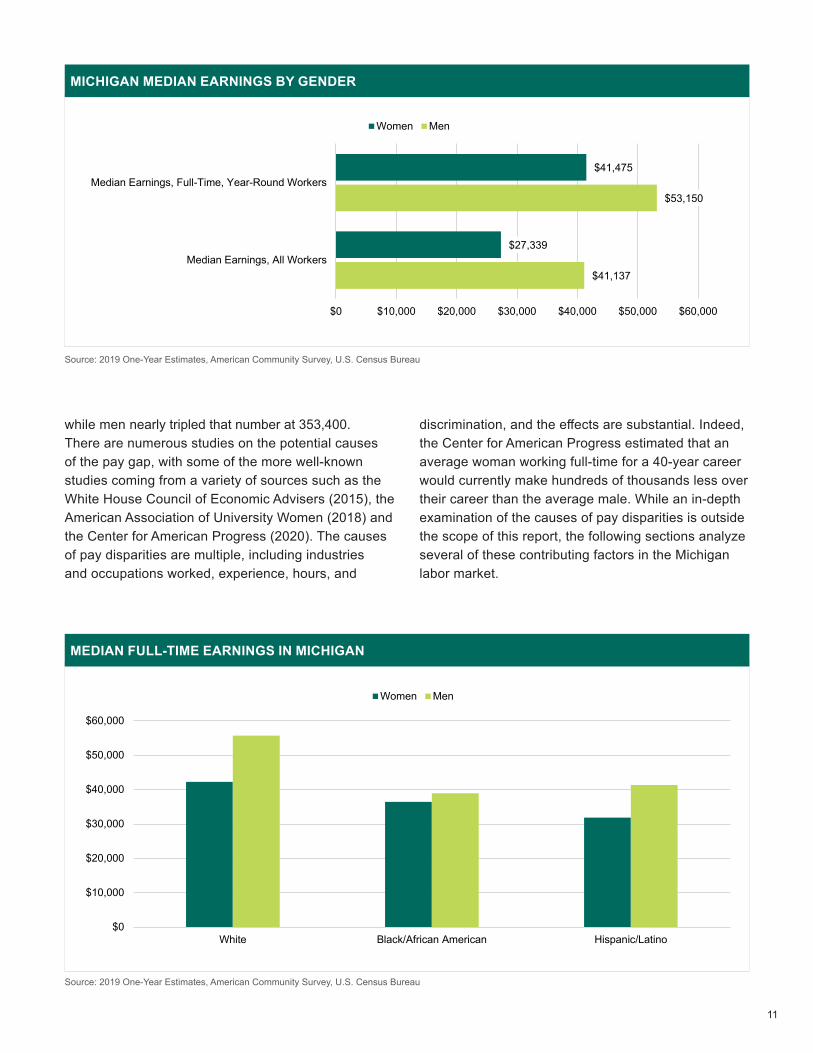
Earnings are one of the most straight forward ways to measure disparities among groups in an economy. Michigan women who worked full-time, year-round in 2019 counted median earnings of $41,475 compared to $53,150 for men. Meaning, women working full-time make about 78 cents on the dollar compared to men. This equates to a 22 percent disparity, which is slightly larger than the national median wage gap between these two groups. Nationally, women made $43,215 while men made $52,989, representing an earnings gap of 82 cents per every dollar men earn, on average.
The gender pay gap widens when including part-time workers, since women are more likely to work part-time than men. Including part-time workers, the median annual earnings for women in Michigan were estimated at $27,339 in 2019. This was almost 34 percent lower than men in the state ($41,137) and roughly 12 percent below women nationwide ($30,944). Nationally, the earnings gap between men and women was less pronounced, but still a notable difference with women earning 27 percent less than men ($30,944 compared to $42,101). Michigan male earners were also closer to the national average for their gender, registering only a 2 percent disparity.
Earnings not only varied by gender, but also by race and ethnicity. While white non-Hispanic men in Michigan working full-time made $56,321 and white non-Hispanic women made $42,691 (76 cents per dollar), Black/African American women working full-time made an average of $36,430. This is 65 cents for every dollar a white non-Hispanic man made and slightly lower than Black/African American men who made $38,955. Hispanic/Latina women working full-time made even less, $31,858 or 57 cents compared to the median white non-Hispanic man and notably less than Hispanic/Latino men who made a median $41,323.
While the wage gap between men and women in Michigan was apparent across all educational categories, it was most pronounced for those with a bachelor’s degree but less than a graduate or professional degree. Women in this group had median earnings of $43,105, which was 63 cents of what men in the same educational group earned ($68,559). This is an even larger gap than the national rate, where women made 69 cents per each dollar made by men. Women accounted for one in four people earning more than $100,000 in the state in 2019. An estimated 119,700 Michigan women earned $100,000 or more,
11
while men nearly tripled that number at 353,400. There are numerous studies on the potential causes of the pay gap, with some of the more well-known studies coming from a variety of sources such as the White House Council of Economic Advisers (2015), the American Association of University Women (2018) and the Center for American Progress (2020). The causes of pay disparities are multiple, including industries and occupations worked, experience, hours, and
discrimination, and the effects are substantial. Indeed, the Center for American Progress estimated that an average woman working full-time for a 40-year career would currently make hundreds of thousands less over their career than the average male. While an in-depth examination of the causes of pay disparities is outside the scope of this report, the following sections analyze several of these contributing factors in the Michigan labor market.
MICHIGAN MEDIAN EARNINGS BY GENDER
Source: 2019 One-Year Estimates, American Community Survey, U.S. Census Bureau
MEDIAN FULL-TIME EARNINGS IN MICHIGAN
Source: 2019 One-Year Estimates, American Community Survey, U.S. Census Bureau
$0
$10,000
$20,000
$30,000
$40,000
$50,000
$60,000
White Black/African American Hispanic/Latino
Women Men
$41,137
$53,150
$27,339
$41,475
$0 $10,000 $20,000 $30,000 $40,000 $50,000 $60,000
Median Earnings, All Workers
Median Earnings, Full-Time, Year-Round Workers
Women Men
12
Patterns of Work
Economic gender disparities continue into patterns of work. These patterns include rates of working full-time or part-time as well as holding multiple jobs.
The percentage of workers 16 to 64 who worked full-time year-round also shows a wide disparity at 57 percent of women and only 71 percent of men. This adds up to about 460,000 less women working full-time than men, which is even more apparent given that there are about 15,000 more women ages 16 to 64 than men in the state. The data does not fully address why these differences exist, but topics addressed later may offer insight into possible explanations.
Breaking this out further, only half of Michigan women usually worked more than 35 hours a week in 2019. This is sharply lower than the roughly 67 percent of men who worked full-time. In contrast, just under 20 percent of women worked between 15 and 34 hours compared to only 11 percent of men. Meanwhile, 5 percent of women worked one to 14 hours a week, compared to about 3 percent of men. The largest disparity is in the highest number of hours worked, with a mean usual hours worked of 41.0 for men and 35.3 for women. The remaining individuals usually did not work.
Figures vary when looking at part-time rates by educational attainment for individuals over 25 in Michigan. About 21 percent of women with a bachelor’s degree or above worked part-time, considerably lower than the rate of women without a bachelor’s degree (29 percent part-time). Even with this eight-point difference between educational categories, women still far outpaced their male counterparts in both groups. Roughly 12 percent of men without a bachelor’s degree worked part-time while under 10 percent of men with a bachelor’s degree worked part-time. This latter figure is over 11 percentage points lower than it is for women and represents roughly 86,000 more women with a bachelor’s degree working part-time than men in the state.
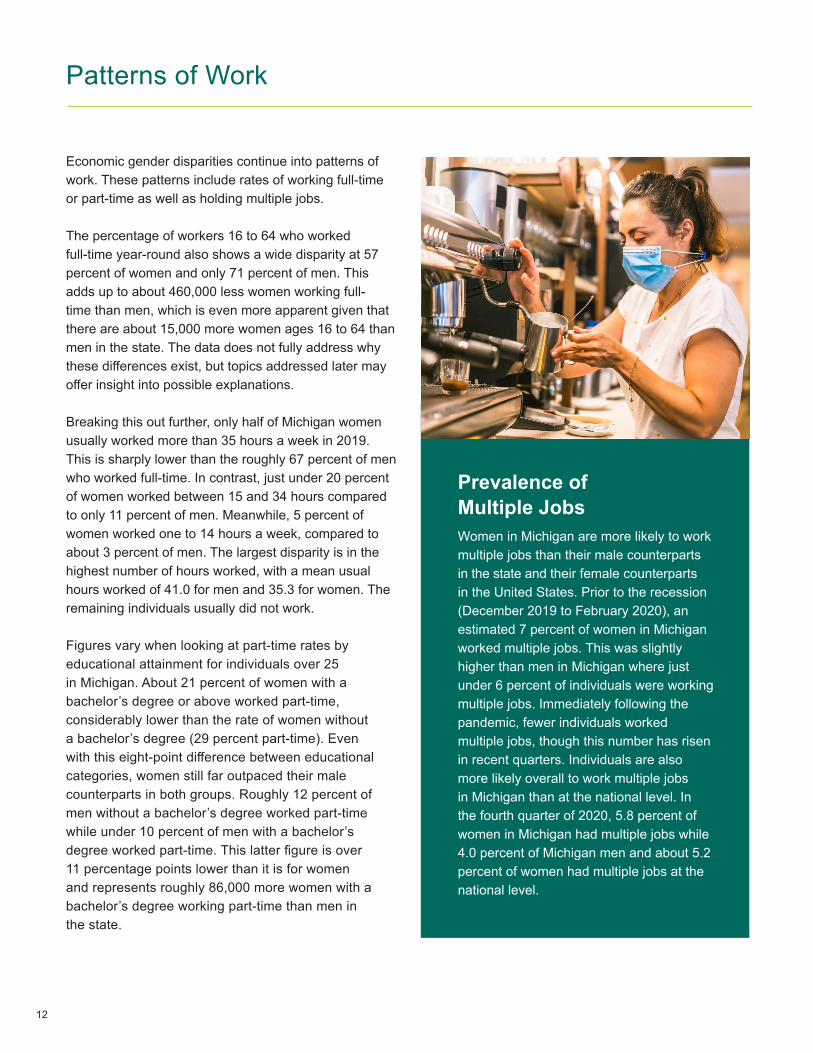
Prevalence of Multiple JobsWomen in Michigan are more likely to work multiple jobs than their male counterparts in the state and their female counterparts in the United States. Prior to the recession (December 2019 to February 2020), an estimated 7 percent of women in Michigan worked multiple jobs. This was slightly higher than men in Michigan where just under 6 percent of individuals were working multiple jobs. Immediately following the pandemic, fewer individuals worked multiple jobs, though this number has risen in recent quarters. Individuals are also more likely overall to work multiple jobs in Michigan than at the national level. In the fourth quarter of 2020, 5.8 percent of women in Michigan had multiple jobs while 4.0 percent of Michigan men and about 5.2 percent of women had multiple jobs at the national level.
13
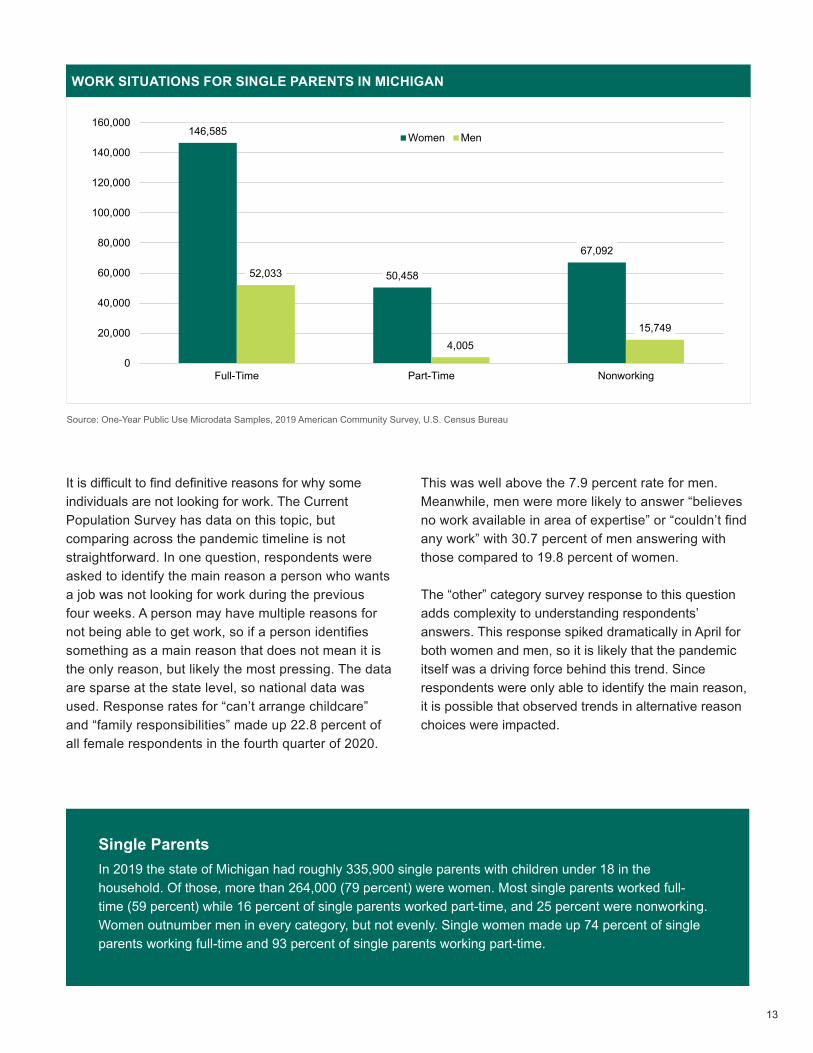
It is difficult to find definitive reasons for why some individuals are not looking for work. The Current Population Survey has data on this topic, but comparing across the pandemic timeline is not straightforward. In one question, respondents were asked to identify the main reason a person who wants a job was not looking for work during the previous four weeks. A person may have multiple reasons for not being able to get work, so if a person identifies something as a main reason that does not mean it is the only reason, but likely the most pressing. The data are sparse at the state level, so national data was used. Response rates for “can’t arrange childcare” and “family responsibilities” made up 22.8 percent of all female respondents in the fourth quarter of 2020.
This was well above the 7.9 percent rate for men. Meanwhile, men were more likely to answer “believes no work available in area of expertise” or “couldn’t find any work” with 30.7 percent of men answering with those compared to 19.8 percent of women.
The “other” category survey response to this question adds complexity to understanding respondents’ answers. This response spiked dramatically in April for both women and men, so it is likely that the pandemic itself was a driving force behind this trend. Since respondents were only able to identify the main reason, it is possible that observed trends in alternative reason choices were impacted.
WORK SITUATIONS FOR SINGLE PARENTS IN MICHIGAN
Source: One-Year Public Use Microdata Samples, 2019 American Community Survey, U.S. Census Bureau
Single ParentsIn 2019 the state of Michigan had roughly 335,900 single parents with children under 18 in the household. Of those, more than 264,000 (79 percent) were women. Most single parents worked full-time (59 percent) while 16 percent of single parents worked part-time, and 25 percent were nonworking. Women outnumber men in every category, but not evenly. Single women made up 74 percent of single parents working full-time and 93 percent of single parents working part-time.
146,585
50,458
67,092
52,033
4,00515,749
0
20,000
40,000
60,000
80,000
100,000
120,000
140,000
160,000
Full-Time Part-Time Nonworking
Women Men
14
Frequent questions regarding women in the workforce ask what types of industries they work in and if they tend to work in lower-paying jobs. The following industry employment and wage data analysis attempts to address this topic.
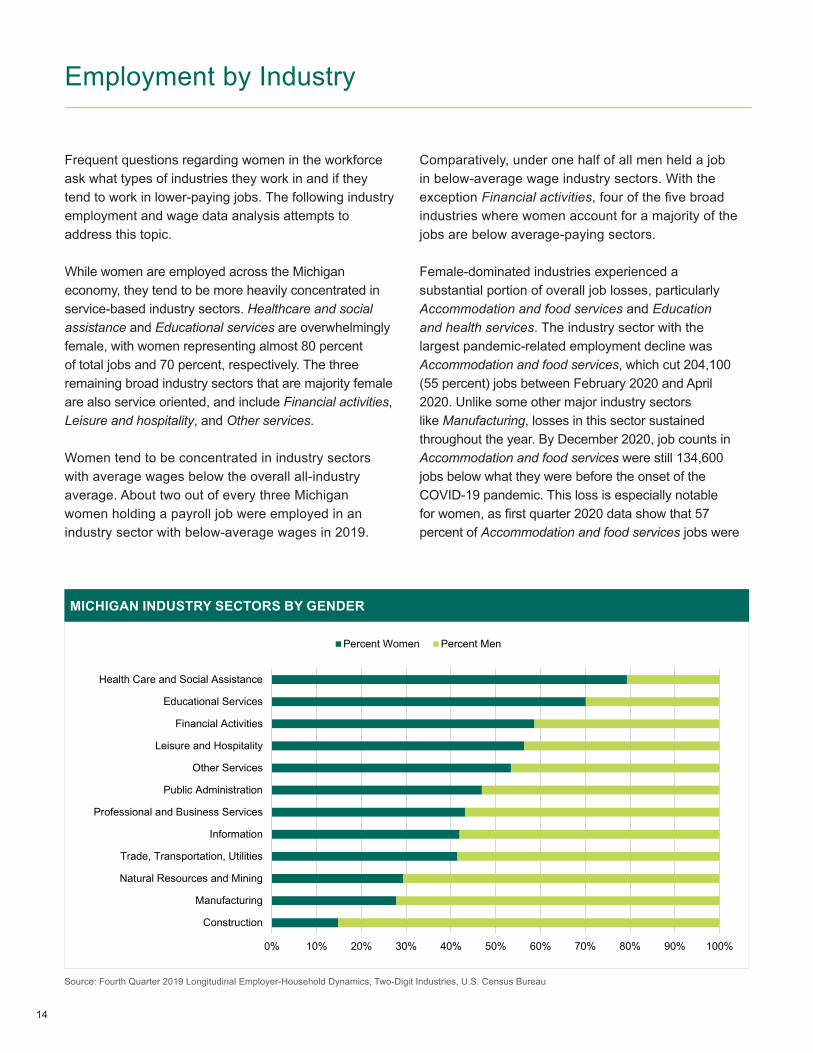
While women are employed across the Michigan economy, they tend to be more heavily concentrated in service-based industry sectors. Healthcare and social assistance and Educational services are overwhelmingly female, with women representing almost 80 percent of total jobs and 70 percent, respectively. The three remaining broad industry sectors that are majority female are also service oriented, and include Financial activities, Leisure and hospitality, and Other services.
Women tend to be concentrated in industry sectors with average wages below the overall all-industry average. About two out of every three Michigan women holding a payroll job were employed in an industry sector with below-average wages in 2019.
Comparatively, under one half of all men held a job in below-average wage industry sectors. With the exception Financial activities, four of the five broad industries where women account for a majority of the jobs are below average-paying sectors.
Female-dominated industries experienced a substantial portion of overall job losses, particularly Accommodation and food services and Education and health services. The industry sector with the largest pandemic-related employment decline was Accommodation and food services, which cut 204,100 (55 percent) jobs between February 2020 and April 2020. Unlike some other major industry sectors like Manufacturing, losses in this sector sustained throughout the year. By December 2020, job counts in Accommodation and food services were still 134,600 jobs below what they were before the onset of the COVID-19 pandemic. This loss is especially notable for women, as first quarter 2020 data show that 57 percent of Accommodation and food services jobs were
Employment by Industry
MICHIGAN INDUSTRY SECTORS BY GENDER
0% 10% 20% 30% 40% 50% 60% 70% 80% 90% 100%
Construction
Manufacturing
Natural Resources and Mining
Trade, Transportation, Utilities
Information
Professional and Business Services
Public Administration
Other Services
Leisure and Hospitality
Financial Activities
Educational Services
Health Care and Social Assistance
Percent Women Percent Men
Source: Fourth Quarter 2019 Longitudinal Employer-Household Dynamics, Two-Digit Industries, U.S. Census Bureau
15
held by them. Only Arts, entertainment, and recreation (just under 51 percent female) lost a larger percentage of employment between February and December (-51 percent). The industry, however, is much smaller, employing 44,500 last February compared to 368,400 jobs in Accommodation and food services.
Education and health services was also significantly impacted by employment loss during the pandemic. The sector cut 109,400 (16 percent) jobs from February to April 2020. And by December, the industry was still down 49,600 jobs from the February total. Notably, Health care and social assistance and Educational services are 80 percent and 70 percent female, respectively.
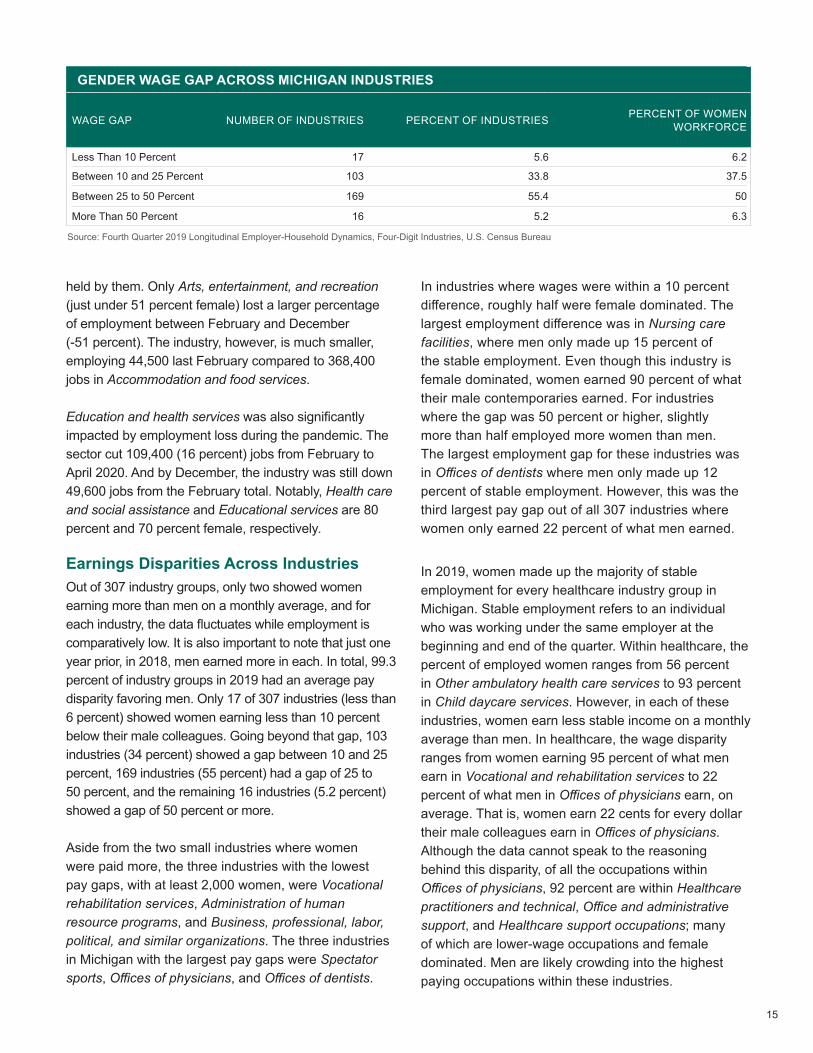
Earnings Disparities Across IndustriesOut of 307 industry groups, only two showed women earning more than men on a monthly average, and for each industry, the data fluctuates while employment is comparatively low. It is also important to note that just one year prior, in 2018, men earned more in each. In total, 99.3 percent of industry groups in 2019 had an average pay disparity favoring men. Only 17 of 307 industries (less than 6 percent) showed women earning less than 10 percent below their male colleagues. Going beyond that gap, 103 industries (34 percent) showed a gap between 10 and 25 percent, 169 industries (55 percent) had a gap of 25 to 50 percent, and the remaining 16 industries (5.2 percent) showed a gap of 50 percent or more.
Aside from the two small industries where women were paid more, the three industries with the lowest pay gaps, with at least 2,000 women, were Vocational rehabilitation services, Administration of human resource programs, and Business, professional, labor, political, and similar organizations. The three industries in Michigan with the largest pay gaps were Spectator sports, Offices of physicians, and Offices of dentists.
In industries where wages were within a 10 percent difference, roughly half were female dominated. The largest employment difference was in Nursing care facilities, where men only made up 15 percent of the stable employment. Even though this industry is female dominated, women earned 90 percent of what their male contemporaries earned. For industries where the gap was 50 percent or higher, slightly more than half employed more women than men. The largest employment gap for these industries was in Offices of dentists where men only made up 12 percent of stable employment. However, this was the third largest pay gap out of all 307 industries where women only earned 22 percent of what men earned.
In 2019, women made up the majority of stable employment for every healthcare industry group in Michigan. Stable employment refers to an individual who was working under the same employer at the beginning and end of the quarter. Within healthcare, the percent of employed women ranges from 56 percent in Other ambulatory health care services to 93 percent in Child daycare services. However, in each of these industries, women earn less stable income on a monthly average than men. In healthcare, the wage disparity ranges from women earning 95 percent of what men earn in Vocational and rehabilitation services to 22 percent of what men in Offices of physicians earn, on average. That is, women earn 22 cents for every dollar their male colleagues earn in Offices of physicians. Although the data cannot speak to the reasoning behind this disparity, of all the occupations within Offices of physicians, 92 percent are within Healthcare practitioners and technical, Office and administrative support, and Healthcare support occupations; many of which are lower-wage occupations and female dominated. Men are likely crowding into the highest paying occupations within these industries.
GENDER WAGE GAP ACROSS MICHIGAN INDUSTRIES
WAGE GAP NUMBER OF INDUSTRIES PERCENT OF INDUSTRIES PERCENT OF WOMEN WORKFORCE
Less Than 10 Percent 17 5.6 6.2
Between 10 and 25 Percent 103 33.8 37.5
Between 25 to 50 Percent 169 55.4 50
More Than 50 Percent 16 5.2 6.3
Source: Fourth Quarter 2019 Longitudinal Employer-Household Dynamics, Four-Digit Industries, U.S. Census Bureau
16
Employment by Occupation
As well as industries, there are occupational disparities within what jobs each gender takes up.
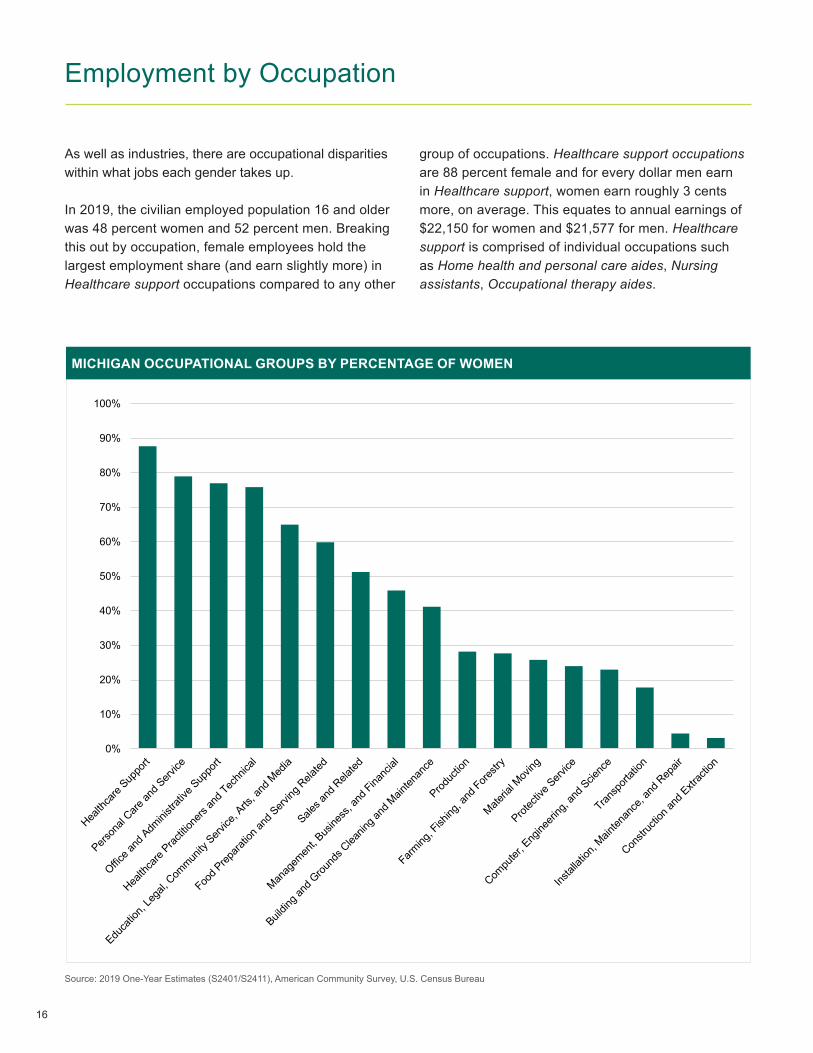
In 2019, the civilian employed population 16 and older was 48 percent women and 52 percent men. Breaking this out by occupation, female employees hold the largest employment share (and earn slightly more) in Healthcare support occupations compared to any other
group of occupations. Healthcare support occupations are 88 percent female and for every dollar men earn in Healthcare support, women earn roughly 3 cents more, on average. This equates to annual earnings of $22,150 for women and $21,577 for men. Healthcare support is comprised of individual occupations such as Home health and personal care aides, Nursing assistants, Occupational therapy aides.
MICHIGAN OCCUPATIONAL GROUPS BY PERCENTAGE OF WOMEN
Source: 2019 One-Year Estimates (S2401/S2411), American Community Survey, U.S. Census Bureau
0%
10%
20%
30%
40%
50%
60%
70%
80%
90%
100%
17
Disparity From Prior RecessionsBetween the fourth quarter of 2007 and the first quarter of 2009, 78 percent of jobs losses were experienced by men. The unemployment rate for men went from 4.9 to 8.9 percent while it rose from 4.7 to 7.2 percent for women nationwide. Men were thought to bear the worst of that crisis due to their overwhelming representation in Manufacturing and Construction sectors while women are more represented in what had been considered recession-proof industries, such as Healthcare and Education. As stated by the St. Louis Federal Reserve in an October 2009 publication, “Despite the sudden interest in the phenomenon, the relative effects of the recession on men and women are not the least bit unusual.”
The report also states that during the recessions of the late 20th century, male employment fell by an average of 3.1 percent while it rose 0.3 percent for female employment, aligning with women rapidly moving into the workforce during the mid to late 1900s. The recession in the early 2000s is the most recent comparison where men again made up about 78 percent of the job losses, much like the Great Recession.
This is all to say the current “She-cession” is without comparison. Never in the modern economy have women-dominated industries (and women in general) been impacted so dramatically compared to their male counterparts. The possible reasons for this are multiple and further analysis will be required as new data become available. The recovery from this economic downturn may require extremely novel solutions due to the uniqueness of the problem compared to prior recessions.
One occupational group that is nearly equal in terms of employment is Sales and related. This occupational group is about 51 percent female and 48 percent male and represents occupations such as First-line supervisors of retail salespersons, Insurance sales agents, Retail salespersons, among others. Despite nearly equal employment distribution, women only earn approximately 51 cents per every dollar their male counterparts earn. This pay disparity reflects an annual median salary of $20,936 for women and $40,939 for men.
The largest imbalance in employment between men and women is shown in Construction and extraction occupations which is comprised of 97 percent men and 3 percent women. This occupation group contains Carpenters, Electricians, First-Line supervisors of construction trades and extraction workers, among others. Women earn roughly 64 cents per every dollar a man earns in these occupations, on average, equaling an average of $26,270 annually compared to $40,868 for men.
18
Both poverty and educational attainment are measures linked to economic prosperity. The two metrics are tightly related, as economic welfare rises, on average, as individuals complete more education and training.
In 2019, 1,269,100 Michigan residents (13 percent of total population) were estimated to fall below the poverty level. Overall, women are more likely to experience poverty than men; an estimated 14.0 percent of all women were below the poverty level compared to 11.9 percent of men. Roughly 699,000 women were below the poverty level statewide compared to 570,000 men.
Poverty rates increase even more when looking at non-white individuals. About 23.6 percent of women of color experience poverty in Michigan, which is nearly 10 points higher than all women and also outpaces men of color at 21.8 percent. Women of color in Michigan also experience poverty at a rate higher than
their national counterparts who are at a rate of 18.8 percent. In total, there are about 261,000 women of color in poverty in Michigan.
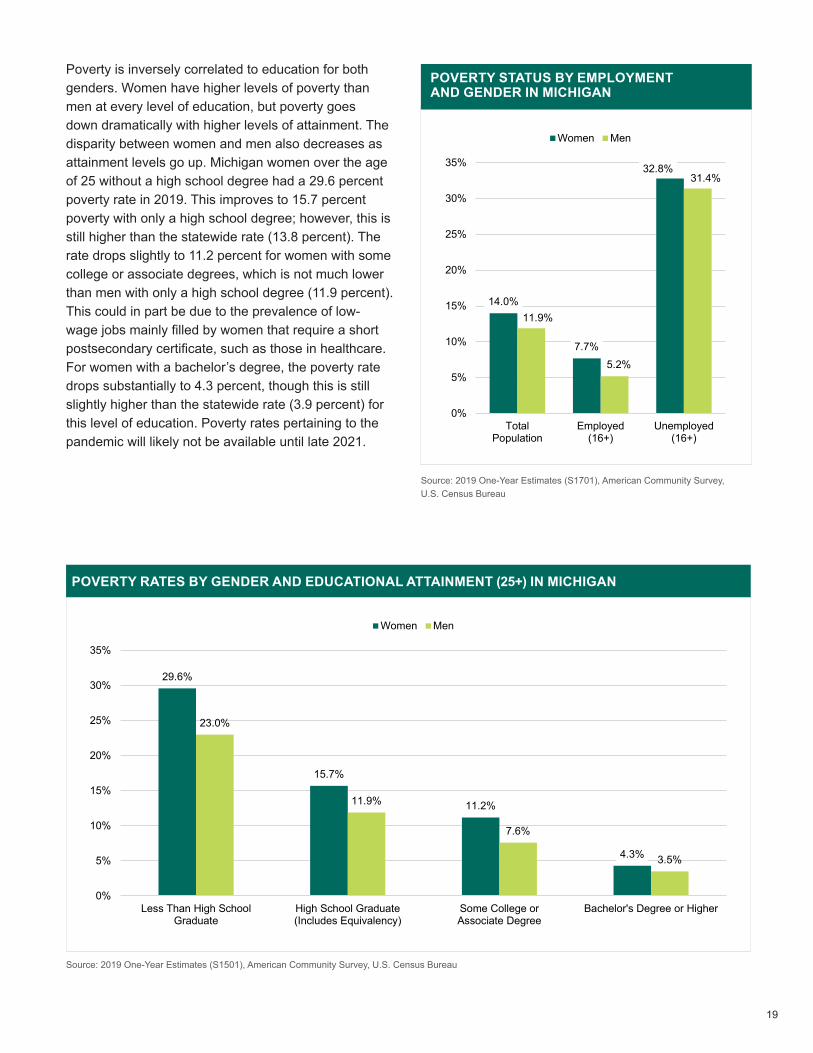
In 2019, there were 4,965,700 Michigan residents in the civilian labor force, and 382,100 (7.7 percent) of this population fell below the poverty level. Of Michigan’s 4,719,000 employed individuals, 303,200 (6.4 percent) of those were below the poverty level. About 7.7 percent of employed women were below the poverty line in 2019, while only 5.2 percent of employed men fell into this category. Not surprisingly, poverty was much more prevalent in the unemployed component of the labor force, as 32.0 percent (or 79,000 individuals) of this group was below the poverty level. Of those unemployed, 32.8 percent of women were below the poverty line while 31.4 percent of unemployed men fell into this classification.
Poverty
19
Poverty is inversely correlated to education for both genders. Women have higher levels of poverty than men at every level of education, but poverty goes down dramatically with higher levels of attainment. The disparity between women and men also decreases as attainment levels go up. Michigan women over the age of 25 without a high school degree had a 29.6 percent poverty rate in 2019. This improves to 15.7 percent poverty with only a high school degree; however, this is still higher than the statewide rate (13.8 percent). The rate drops slightly to 11.2 percent for women with some college or associate degrees, which is not much lower than men with only a high school degree (11.9 percent). This could in part be due to the prevalence of low-wage jobs mainly filled by women that require a short postsecondary certificate, such as those in healthcare. For women with a bachelor’s degree, the poverty rate drops substantially to 4.3 percent, though this is still slightly higher than the statewide rate (3.9 percent) for this level of education. Poverty rates pertaining to the pandemic will likely not be available until late 2021.
POVERTY RATES BY GENDER AND EDUCATIONAL ATTAINMENT (25+) IN MICHIGAN
Source: 2019 One-Year Estimates (S1501), American Community Survey, U.S. Census Bureau
POVERTY STATUS BY EMPLOYMENT AND GENDER IN MICHIGAN
Source: 2019 One-Year Estimates (S1701), American Community Survey, U.S. Census Bureau
14.0%
7.7%
32.8%
11.9%
5.2%
31.4%
0%
5%
10%
15%
20%
25%
30%
35%
TotalPopulation
Employed(16+)
Unemployed(16+)
Women Men
29.6%
15.7%
11.2%
4.3%
23.0%
11.9%
7.6%
3.5%
0%
5%
10%
15%
20%
25%
30%
35%
Less Than High SchoolGraduate
High School Graduate(Includes Equivalency)
Some College orAssociate Degree
Bachelor's Degree or Higher
Women Men
20
Education plays a major role in shaping the economic prosperity of Michigan women, as increased attainment leads to higher wages and lower levels of poverty. However, education alone is not enough to address many of the disparities faced by women. Women, on average, have higher levels of attainment than men. But as discussed above, pay gaps persist at every level of attainment and are actually largest for those with a bachelor’s degree. Moreover, these disparities go beyond pay and extend to student debt.
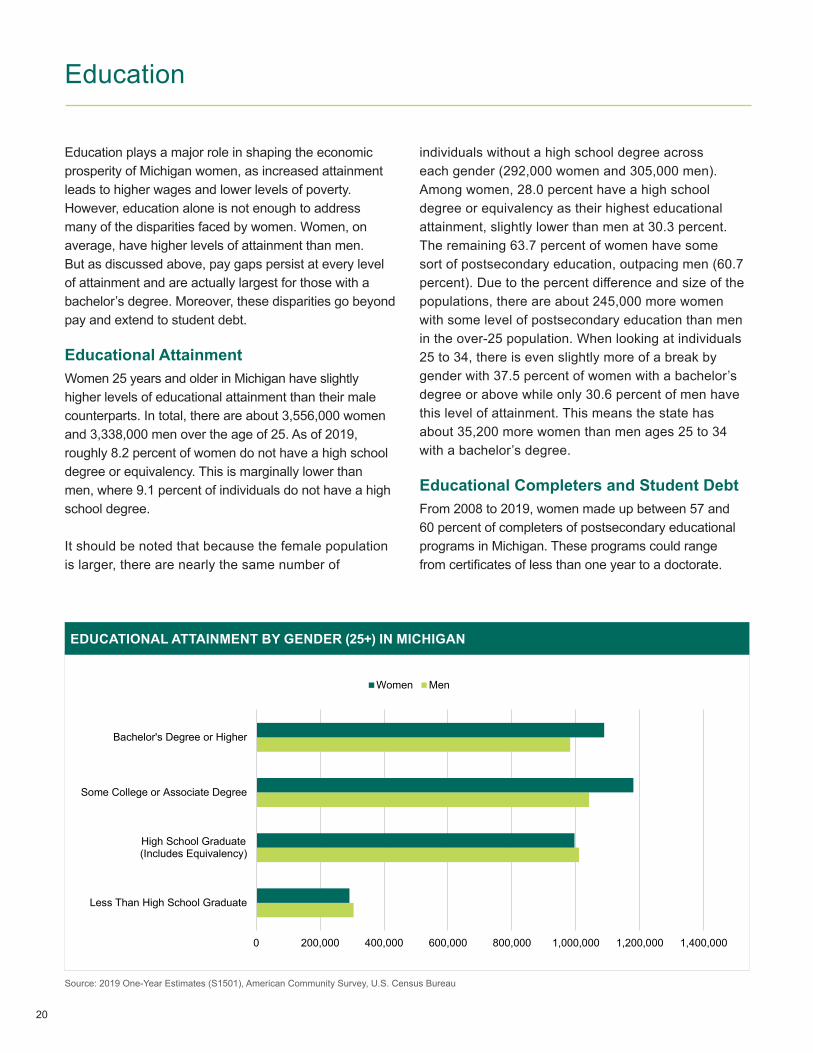
Educational AttainmentWomen 25 years and older in Michigan have slightly higher levels of educational attainment than their male counterparts. In total, there are about 3,556,000 women and 3,338,000 men over the age of 25. As of 2019, roughly 8.2 percent of women do not have a high school degree or equivalency. This is marginally lower than men, where 9.1 percent of individuals do not have a high school degree.
It should be noted that because the female population is larger, there are nearly the same number of
individuals without a high school degree across each gender (292,000 women and 305,000 men). Among women, 28.0 percent have a high school degree or equivalency as their highest educational attainment, slightly lower than men at 30.3 percent. The remaining 63.7 percent of women have some sort of postsecondary education, outpacing men (60.7 percent). Due to the percent difference and size of the populations, there are about 245,000 more women with some level of postsecondary education than men in the over-25 population. When looking at individuals 25 to 34, there is even slightly more of a break by gender with 37.5 percent of women with a bachelor’s degree or above while only 30.6 percent of men have this level of attainment. This means the state has about 35,200 more women than men ages 25 to 34 with a bachelor’s degree.
Educational Completers and Student DebtFrom 2008 to 2019, women made up between 57 and 60 percent of completers of postsecondary educational programs in Michigan. These programs could range from certificates of less than one year to a doctorate.
EDUCATIONAL ATTAINMENT BY GENDER (25+) IN MICHIGAN
Source: 2019 One-Year Estimates (S1501), American Community Survey, U.S. Census Bureau
Education
0 200,000 400,000 600,000 800,000 1,000,000 1,200,000 1,400,000
Less Than High School Graduate
High School Graduate(Includes Equivalency)
Some College or Associate Degree
Bachelor's Degree or Higher
Women Men
21
Education can be a great way to level the playing field, but it typically requires a substantial investment of time and money. Many students must take on student loans, which may pay off in the long run, but can make finances even tighter in the short run. Unfortunately, with the pay gap, women may require this higher level of education to reach a livable wage that men may be able to achieve without the investment, on average.
Roughly 152,000 educational credentials were earned by women in 2019. This was 57 percent of all completers. Women of color made up about 18 percent of those earning a credential. When looking at the percent of non-white women in the state with an associate degree or higher, they only make up 9 percent of all of these individuals. Although in 2019, non-white women accounted for about 17 percent of individuals earning an associate degree or higher.
According to a national report from educationdata.org on the gender breakdown of student loan debt, women hold 58.0 percent of all student loan debt and, on average, take longer to pay off their loans despite making higher payments. Female borrowers have an average debt that is 9.6 percent higher than their male peers one year after graduation. Black/African American women hold an average of $37,600 in debt. This compares to white women who hold $31,300 while Hispanic and Asian women hold $27,000 and $25,300 on average, respectively. Twelve years after first repayment, Black women owe an average of 13.0 percent more than they owed at the start of their repayment. White women recorded a reduction of 28.0 percent while white men pay down their debts by 44.0 percent.

22
23
Other Areas for Consideration
HOUSEHOLD CHARACTERISTICS IN MICHIGAN
Source: 2019 One-Year Estimates (S1101), American Community Survey, U.S. Census Bureau
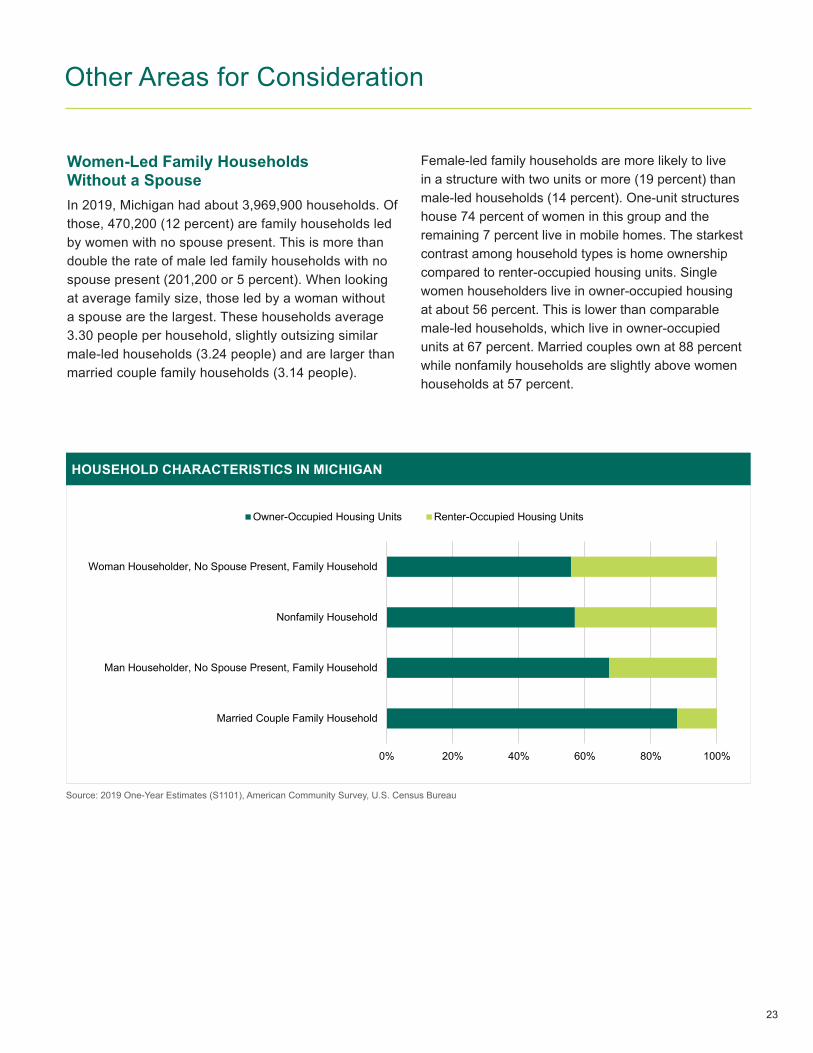
Women-Led Family Households Without a Spouse In 2019, Michigan had about 3,969,900 households. Of those, 470,200 (12 percent) are family households led by women with no spouse present. This is more than double the rate of male led family households with no spouse present (201,200 or 5 percent). When looking at average family size, those led by a woman without a spouse are the largest. These households average 3.30 people per household, slightly outsizing similar male-led households (3.24 people) and are larger than married couple family households (3.14 people).
Female-led family households are more likely to live in a structure with two units or more (19 percent) than male-led households (14 percent). One-unit structures house 74 percent of women in this group and the remaining 7 percent live in mobile homes. The starkest contrast among household types is home ownership compared to renter-occupied housing units. Single women householders live in owner-occupied housing at about 56 percent. This is lower than comparable male-led households, which live in owner-occupied units at 67 percent. Married couples own at 88 percent while nonfamily households are slightly above women households at 57 percent.
0% 20% 40% 60% 80% 100%
Married Couple Family Household
Man Householder, No Spouse Present, Family Household
Nonfamily Household
Woman Householder, No Spouse Present, Family Household
Owner-Occupied Housing Units Renter-Occupied Housing Units
24
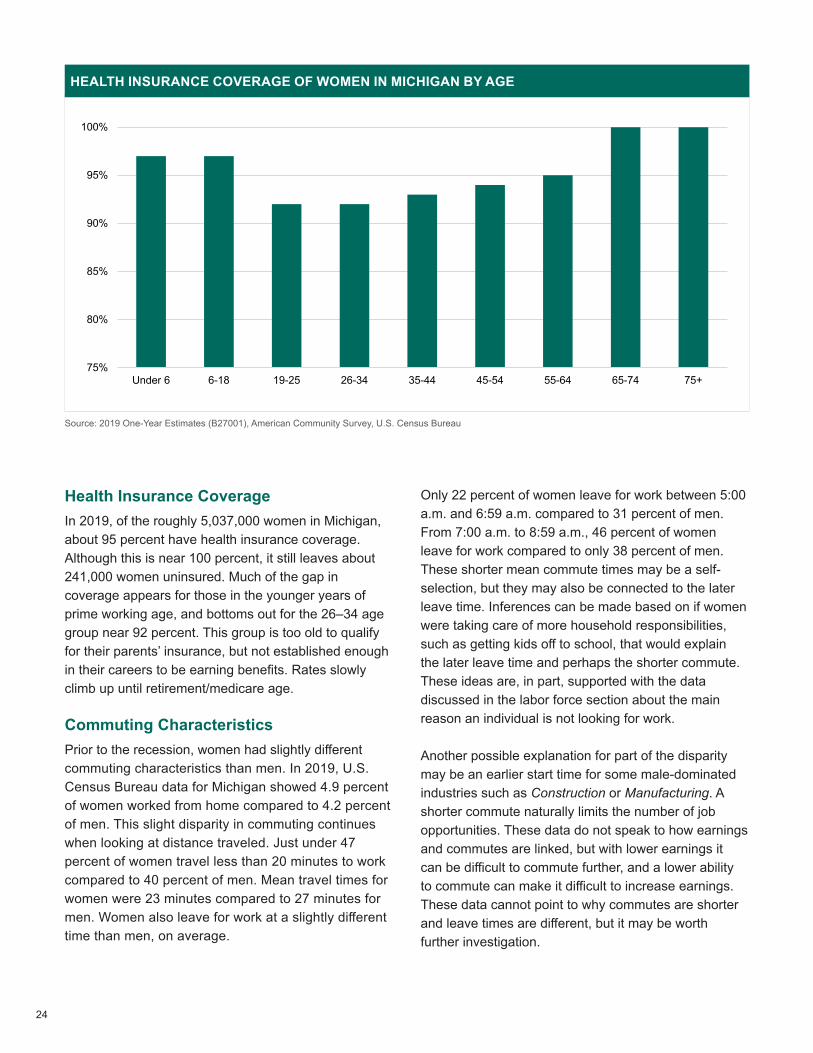
Health Insurance CoverageIn 2019, of the roughly 5,037,000 women in Michigan, about 95 percent have health insurance coverage. Although this is near 100 percent, it still leaves about 241,000 women uninsured. Much of the gap in coverage appears for those in the younger years of prime working age, and bottoms out for the 26–34 age group near 92 percent. This group is too old to qualify for their parents’ insurance, but not established enough in their careers to be earning benefits. Rates slowly climb up until retirement/medicare age. Commuting Characteristics Prior to the recession, women had slightly different commuting characteristics than men. In 2019, U.S. Census Bureau data for Michigan showed 4.9 percent of women worked from home compared to 4.2 percent of men. This slight disparity in commuting continues when looking at distance traveled. Just under 47 percent of women travel less than 20 minutes to work compared to 40 percent of men. Mean travel times for women were 23 minutes compared to 27 minutes for men. Women also leave for work at a slightly different time than men, on average.
Only 22 percent of women leave for work between 5:00 a.m. and 6:59 a.m. compared to 31 percent of men. From 7:00 a.m. to 8:59 a.m., 46 percent of women leave for work compared to only 38 percent of men. These shorter mean commute times may be a self-selection, but they may also be connected to the later leave time. Inferences can be made based on if women were taking care of more household responsibilities, such as getting kids off to school, that would explain the later leave time and perhaps the shorter commute. These ideas are, in part, supported with the data discussed in the labor force section about the main reason an individual is not looking for work.
Another possible explanation for part of the disparity may be an earlier start time for some male-dominated industries such as Construction or Manufacturing. A shorter commute naturally limits the number of job opportunities. These data do not speak to how earnings and commutes are linked, but with lower earnings it can be difficult to commute further, and a lower ability to commute can make it difficult to increase earnings. These data cannot point to why commutes are shorter and leave times are different, but it may be worth further investigation.
HEALTH INSURANCE COVERAGE OF WOMEN IN MICHIGAN BY AGE
Source: 2019 One-Year Estimates (B27001), American Community Survey, U.S. Census Bureau
75%
80%
85%
90%
95%
100%
Under 6 6-18 19-25 26-34 35-44 45-54 55-64 65-74 75+

25
Retirement Issues and Life Expectancy In Michigan, the median age in 2019 was 39.8 years old. Women live slightly longer with a median age of 41.2 compared to men with a median age of 38.4 years. In total, the state has roughly 974,000 women over the age of 65. This accounts for 19 percent of all women in the state. Michigan is also home to 139,000 women over the age of 85. This nearly doubles the 74,000 men over the age of 85.
As individuals live longer, they either need to save more money for retirement or find jobs with retirement benefits. This can be especially difficult for women as they earn less than their male counterparts and are more likely to work part-time, creating a lack of similar benefits. Due to less working years or less benefits at work, women may not have as much set aside in benefits such as Social Security or 401(k)s.
MICHIGAN POPULATION BY AGE AND GENDER
Source: 2019 One-Year Estimates (S0101), American Community Survey, U.S. Census Bureau
0
200,000
400,000
600,000
800,000
1,000,000
1,200,000
1,400,000
1,600,000
1,800,000
Under 24 25-44 45-64 65-84 85+
Women Men

26
27
Women in the Michigan workforce do not have equal economic outcomes as men when viewed through many variables. Further, the inequality becomes more prevalent when considering factors like race and ethnicity. While some of the challenges and disparities faced by women are attributable to factors such as a relatively higher likelihood to work part-time or in lower-paying industries and occupations, some workforce related discrepancies are even more nuanced or remain unexplained.
Regardless of the reasons, it is evident that women have not experienced equal outcomes as their male counterparts, and that such inequality is historically persistent in the U.S. and Michigan economies. The COVID-19 pandemic has only brought more attention to these issues as some disparities have worsened.
Conclusion
Due to the relative recency and speed of this pandemic, putting data to this issue is challenging. In late 2021 and early 2022, more data will become available at statewide and regional levels that will help shed further insight into challenges brought on by the pandemic.
Issues facing women in the workforce are multifaceted, interrelated, and pervasive. Policies aimed at overcoming these issues will have to be equally as universal. Due to the uniqueness of this economic downturn as well as the long-standing disparities, improving economic equality will require unique and large-scale ideas to ensure Michigan has the strongest and most equitable economy possible.
STATE OF MICHIGAN
Department of Technology, Management & Budget
Bureau of Labor Market Information and Strategic Initiatives
Detroit Office Cadillac Place3032 West Grand BoulevardSuite 9-150Detroit, Michigan 48202(313) 456-3100
Lansing Office George W. Romney Building, Floor 5 111 S. Capitol Ave. Lansing, Michigan 48933(517) 335-2472
In accordance with Michigan Law and the Americans with Disabilities Act requirements, an alternate format of this printed material may be obtained by contacting: Scott Powell, Director, Department of Technology, Management & Budget, Bureau of Labor Market Information and Strategic Initiatives, George W. Romney Building, Floor 5, 111 S. Capitol Ave., Lansing, Michigan 48933, (517) 241-5649 or [email protected].