women in managerial and leadership positions in the g20
TRANSCRIPT

Women in managerial and
leadership positions in the G20
Data availability and preliminary findings
Stock-taking report prepared for the EMPOWER alliance under the 2020 Saudi Arabian Presidency of the G20
International Labour Office
October 2020
Contents
Executive summary .............................................................................................. i
Introduction ..................................................................................................... - 1 -
Data situation among G20 member States ............................................... - 2 -
Definition of key labour market indicators ................................................... - 2 -
Sources of information .................................................................................... - 3 -
SDG indicator 5.5.2: “Proportion of women in managerial positions” ....... - 4 -
Current state of play ........................................................................................ - 4 -
Key findings from the data ......................................................................... - 7 -
Overall progress towards greater representation of women in leadership and managerial positions ................................................................................ - 7 -
Variation between economic sectors ............................................................. - 9 -
Differences between private and public sector employment ................... - 10 -
Conclusion ...................................................................................................... - 12 -
Further resources .......................................................................................... - 14 -
i
Executive summary
This report takes stock of the existing data and the data required to track progress towards achieving gender parity in managerial and leadership positions and presents some preliminary findings.
The report highlights significant data gaps as well as the need for a better harmonisation of data amongst G20 countries. Both issues need to be addressed in order to better track progress and enable evidence-based decision making. The report further shows that only limited progress has been made in terms of women’s full and effective participation and equal opportunities for leadership positions in the world of work over the past 10 years. None of the countries with available data reaches the target of 50 per cent of women in senior and middle management positions (indicator 5.5.2 of the Sustainable Development Goals (SDG)). The share of women in managerial positions is particularly low in occupations that are traditionally dominated by men. Overall, the public sector seems to provide more management opportunities for women than the private sector.
The COVID-19 crisis risks eroding some of the gains in gender equality that have been achieved in G20 labour markets over recent years. This is not inevitable if decisive action is taken. The private sector has a large range of opportunities to foster gender parity in managerial positions and hence drive progress towards in that regard. An inclusive business culture starts with a gender-balanced workforce and includes a critical mass of women in management, senior leadership and on boards of directors (i.e. of at least 30 per cent). In addition, gender-inclusive policies and practices are needed to ensure equal opportunities for both women and men, and to address any kind of discrimination or bias, including regarding pay levels and employment conditions. Targeted policies regarding flexible working hours and paternity leave can further lead to greater inclusivity and work-life balance for both men and women.
- 1 -
Introduction
Launched at the G20 Leaders’ Summit in Japan in 2019, the Private Sector Alliance for the Empowerment and Progression of Women’s Economic Representation (EMPOWER) supports the advancement of women’s economic empowerment and representation in senior levels of the business world through evidence-based analysis, practical lessons learned, best practices and recommendations on measures to be taken by the private and public sector to incentivize employers and investors to further advance women’s economic empowerment. Ensuring tangible and long-term gender equality is integral to all dimensions of sustainable development and central to the 2030 Agenda. Only women’s full participation in all spheres will enable countries to achieve their developmental objectives.
This report, prepared under the Saudi Arabian Presidency of the G20, takes stock of the existing data and the progress made towards gender parity in managerial and leadership positions over the last decade and highlights key data gaps that render effective monitoring difficult. In the first part, the report provides definitions of key labour market indicators, highlights sources of information and introduces the key indicator used for this report: “Proportion of women in managerial positions” (SDG indicator 5.5.2). The second part of the report presents key findings related to this indicator, focussing on sectoral variations as well as on differences between the public and private sector. The report is meant to inform the discussions and does not necessarily reflect the views of G20 members or of private sector participants.

- 2 -
Data situation among G20 member States
Definition of key labour market indicators
Before further analysis, it is important to highlight the definitions of indicators that will be used for subsequent analyses.
Employment
According to the definition approved by the 19th International Conference of Labour Statisticians (ICLS) in 2013, “[p]ersons in employment are defined as all those of working age who, during a short reference period, were engaged in any activity to produce goods or provide services for pay or profit”1. This definition highlights the fact that these activities are done with the intention of a financial gain (pay or profit) and therefore differs from the other forms of work (also define by the 19th ICLS) where there is no research of gain or profit.
International Standard Classification of Occupations (ISCO)
Similar to the definition of employment, the International Standard Classification of Occupations (ISCO) was adopted by the 17th ICLS in 2008.2 It replaces the previous Classification adopted in 1988. ISCO is defined into four different levels of occupations, from the major groups (10 categories) to the unit groups (436 categories). For the purpose of the analysis here, we will use only the first two levels (major and sub-major groups). Managers and leaders are considered as the highest category in ISCO-08 (category 1).
1http://www.ilo.ch/wcmsp5/groups/public/---dgreports/---stat/documents/normativeinstrument/wcms_230304.pdf 2 https://www.ilo.org/public/english/bureau/stat/isco/isco08/

- 3 -
Senior and middle management positions
Among the category of managers, if we move from the major groups to the sub-major groups, we will find four categories:
11 - Chief Executives, Senior Officials and Legislators
12 - Administrative and Commercial Managers
13 - Production and Specialized Services Managers
14 - Hospitality, Retail and Other Services Managers
The first sub-major group (11) is considered as senior management positions. Groups 12 and 13 are considered as middle management while the last group is considered as junior management positions. In order to limit the analysis to the “highest” positions only, the category 14 is often excluded and only senior and middle management positions are kept.
Sources of information
The sources of information for labour statistics are usually divided into three main types: labour force surveys (or household surveys with a labour module), establishment surveys, and administrative records. They are complementary: a single source cannot measure all the indicators that are usually used in labour statistics. Data on job vacancies are usually collected from establishment surveys while occupational injuries are ideally collected from administrative records. Most of the key labour market indicators are collected from Labour Force Surveys (LFS). This is why it is important for a country to ensure to have a regular and nationally representative LFS implemented, usually by the National Statistical Office. To inform the indicator “proportion of women in managerial positions”, data collected through the LFS is the key source of information.
- 4 -
SDG indicator 5.5.2: “Proportion of women in managerial
positions”
To monitor progress made in increasing the share of women in managerial and leadership positions, we propose to use the indicator “female share of employment in managerial positions”, which is one of the indicators of SDG Goal 5: “achieve gender equality and empower all women and girls”. Indicator 5.5.2 conveys the number of women employed in management as a percentage of total employment in management. Employment in management is defined based on ISCO.
Two different measures are available: one referring to total management (category 1 of ISCO-08), and another one referring to senior and middle management only, thus excluding junior management (category 1 minus category 14 in ISCO-08). The joint calculation of these two measures provides information on whether women are more represented in junior management than in senior and middle management, thus pointing to a potential ceiling for women to access higher-level management positions. In these cases, calculating only the share of women in (total) management would be misleading, in that it would suggest that women hold positions with more decision-making power and responsibilities than they actually do.3
Current state of play
Not all G20 member States are making their full and disaggregated data available or are applying different methodologies to their data collection. The ILO would therefore welcome access to the microdata in these countries in order to ensure data gaps can be filled, thereby enabling evidence-based decision making.
3 See: https://unstats.un.org/sdgs/metadata/files/Metadata-05-05-02.pdf
- 5 -
Results for G20 members with available data
The collection and dissemination of data on employment by occupation (ISCO) at the second digit level (in order to differentiate the sub-major groups) is required to be able to inform the indicator “female share of employment in managerial positions”. These data need to be available by sex to be able to calculate the share of women among the total number of persons in senior and middle management.
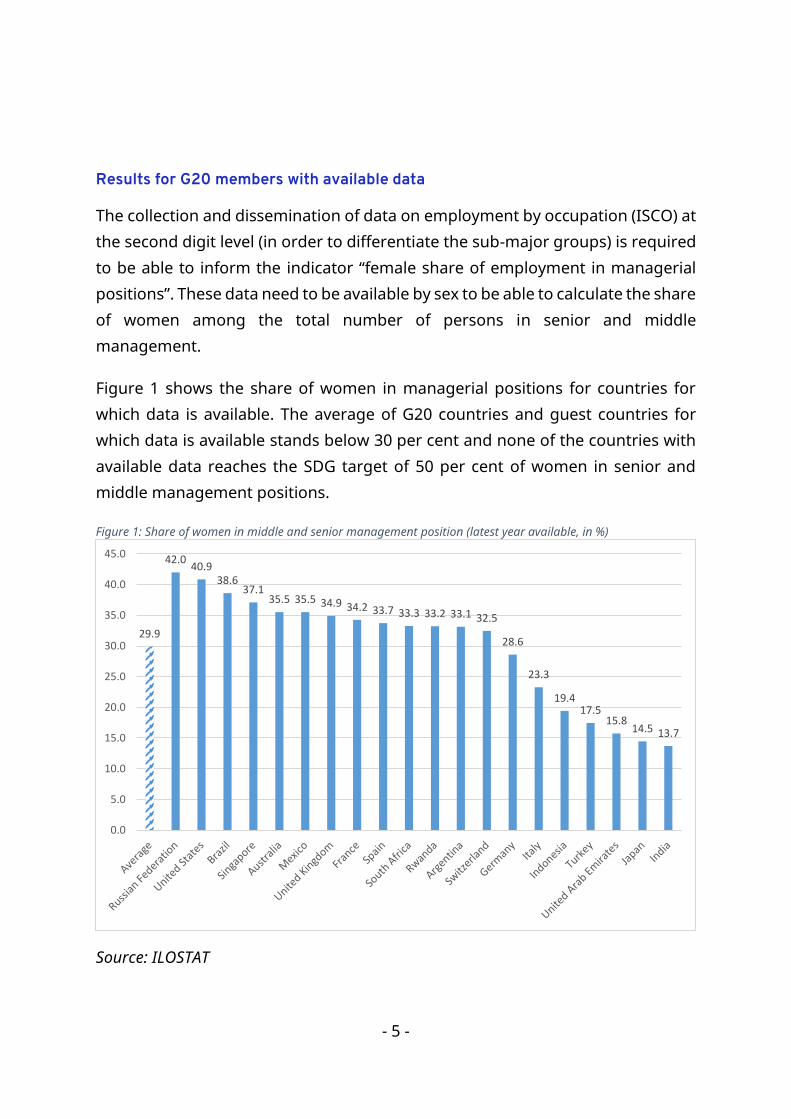
Figure 1 shows the share of women in managerial positions for countries for which data is available. The average of G20 countries and guest countries for which data is available stands below 30 per cent and none of the countries with available data reaches the SDG target of 50 per cent of women in senior and middle management positions.
Figure 1: Share of women in middle and senior management position (latest year available, in %)
Source: ILOSTAT
29.9
42.040.9
38.637.1
35.5 35.5 34.9 34.2 33.7 33.3 33.2 33.1 32.5
28.6
23.3
19.417.5
15.814.5 13.7
0.0
5.0
10.0
15.0
20.0
25.0
30.0
35.0
40.0
45.0

- 6 -
Member States where source of data is missing
If data are not available in figure 1 for a given country, it can be due to various reasons. Countries may, for instance, not conduct a labour force survey (or a household survey with a labour module) on a regular basis. This is, however, not the case for any G20 country.
It should be noted that overall, out of 187 ILO member States, only 100 conduct labour force surveys (LFS) on a regular basis. For of the remaining ILO member States, the LFS is either not conducted at all or conducted only once every 5 to 10 years. In most cases, this is due to financial constraints as conducting a labour force survey can be quite expensive.
Member States where data are collected but are not disseminated
For some G20 members, data are being collected through a LFS, but are not fully available publicly. This is either because the microdata are not publicly available or only available within their countries according to their laws, or because the information has not been transmitted to the ILO through the annual questionnaire sent to all ILO member States.
Among G20 countries, LFS anonymized microdata have not been shared for Australia, China, Singapore and Saudi Arabia. The ILO would welcome any access to the LFS microdata in these countries in order to ensure data gaps can be filled, thereby enabling evidence-based decision making.
Member States where internationally comparable classification is missing
The last category of countries where information is missing in figure 1 is a group where microdata is available but the indicators that are needed for figure 1 are missing. For instance, the Republic of Korea reports occupations mapped with ISCO at one-digit level only (major groups), thus making the identification of senior and middle-level management impossible as it requires mapping at the two-digit level. In the case of Canada, the classification used in the microdata is
- 7 -
not ISCO but the North American Industry Classification System (NAICS). The mapping of NAICS with ISCO at the sub-major groups is not available and therefore information cannot be retrieved for international comparisons.
How to fill data gaps?
For the countries where internationally comparable classification is missing (ISCO at two-digit level unavailable), adding the ISCO at 2nd digit level to the microdata would suffice to inform SDG indicator 5.5.2. Indeed, the other data, such as employment by sex, is already available in the microdata that ILO receives.
For the countries where the data are collected but are not disseminated, one option is for the NSOs in these countries to do the cross-tabulations themselves and publish the tables in their LFS reports. Another option is to share the microdata with the ILO or to fill the annual ILO questionnaire.4
Key findings from the data
The following section assesses progress made towards advancing women’s representation in leadership positions in G20 members. The assessment provides a general overview and focusses on sectoral variations as well as on differences between the public and private sector.
Overall progress towards greater representation of women in
leadership and managerial positions
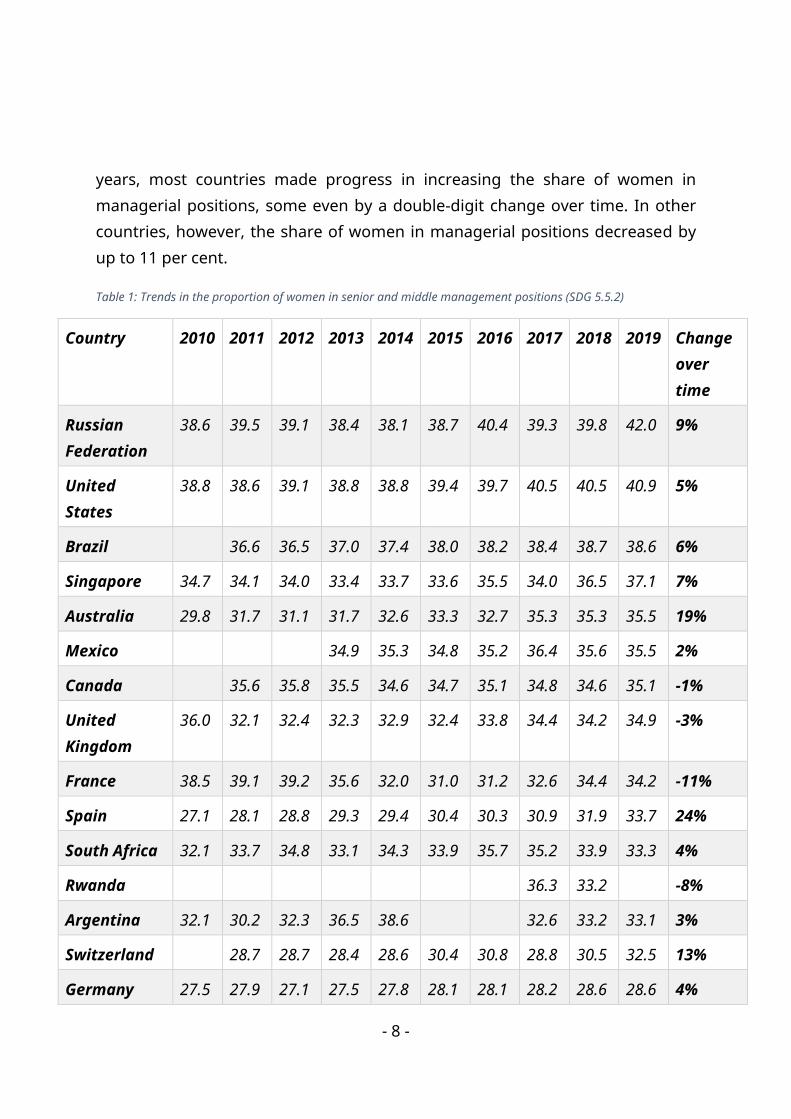
Most G20 countries made progress towards greater representation of women in managerial positions. As reported in table 1, the (unweighted) average share of women in managerial positions has been fluctuating around 30 per cent since 2010 and reached its highest value of 32.4 per cent in 2019. Over the past 10
4 In some G20 countries, such as Australia and Singapore, specific tables have been prepared by the National Statistical Office for this report as anonymized LFS Microdata cannot yet be shared with the ILO.
- 8 -
years, most countries made progress in increasing the share of women in managerial positions, some even by a double-digit change over time. In other countries, however, the share of women in managerial positions decreased by up to 11 per cent.
Table 1: Trends in the proportion of women in senior and middle management positions (SDG 5.5.2)
Country 2010 2011 2012 2013 2014 2015 2016 2017 2018 2019 Change over time
Russian Federation
38.6 39.5 39.1 38.4 38.1 38.7 40.4 39.3 39.8 42.0 9%
United States
38.8 38.6 39.1 38.8 38.8 39.4 39.7 40.5 40.5 40.9 5%
Brazil
36.6 36.5 37.0 37.4 38.0 38.2 38.4 38.7 38.6 6%
Singapore 34.7 34.1 34.0 33.4 33.7 33.6 35.5 34.0 36.5 37.1 7%
Australia 29.8 31.7 31.1 31.7 32.6 33.3 32.7 35.3 35.3 35.5 19%
Mexico
34.9 35.3 34.8 35.2 36.4 35.6 35.5 2%
Canada
35.6 35.8 35.5 34.6 34.7 35.1 34.8 34.6 35.1 -1%
United Kingdom
36.0 32.1 32.4 32.3 32.9 32.4 33.8 34.4 34.2 34.9 -3%
France 38.5 39.1 39.2 35.6 32.0 31.0 31.2 32.6 34.4 34.2 -11%
Spain 27.1 28.1 28.8 29.3 29.4 30.4 30.3 30.9 31.9 33.7 24%
South Africa 32.1 33.7 34.8 33.1 34.3 33.9 35.7 35.2 33.9 33.3 4%
Rwanda
36.3 33.2
-8%
Argentina 32.1 30.2 32.3 36.5 38.6
32.6 33.2 33.1 3%
Switzerland
28.7 28.7 28.4 28.6 30.4 30.8 28.8 30.5 32.5 13%
Germany 27.5 27.9 27.1 27.5 27.8 28.1 28.1 28.2 28.6 28.6 4%
- 9 -
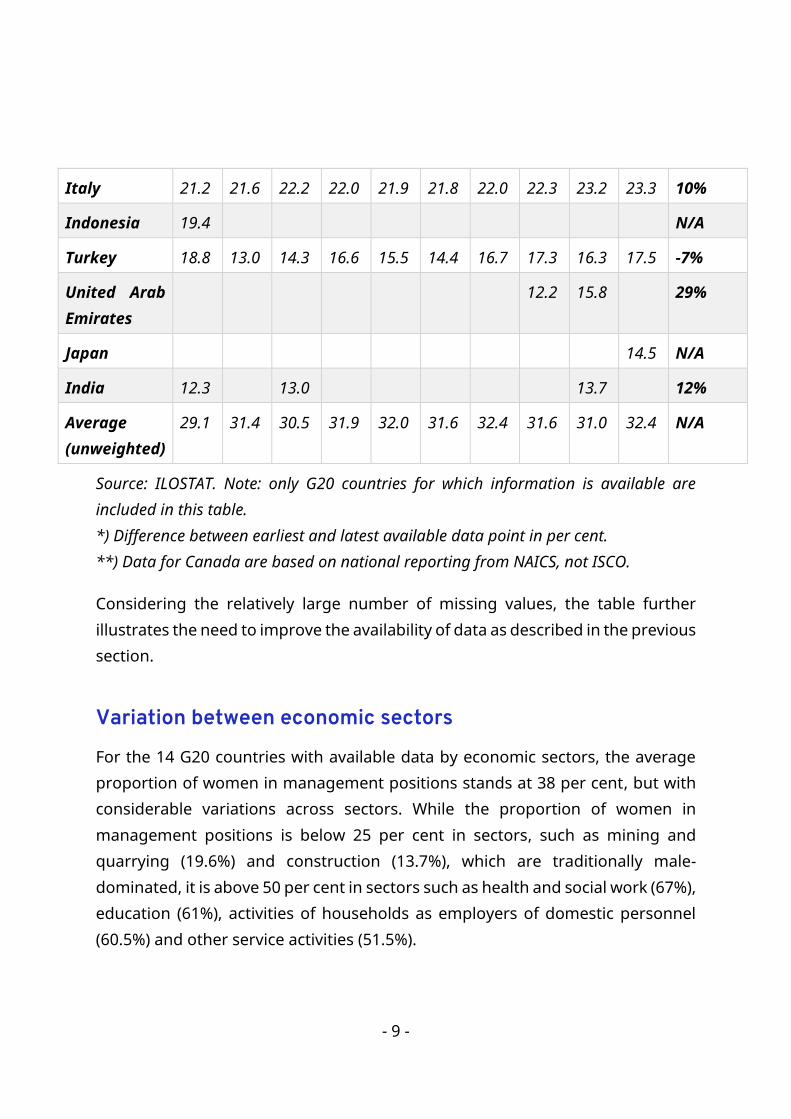
Italy 21.2 21.6 22.2 22.0 21.9 21.8 22.0 22.3 23.2 23.3 10%
Indonesia 19.4
N/A
Turkey 18.8 13.0 14.3 16.6 15.5 14.4 16.7 17.3 16.3 17.5 -7%
United Arab Emirates
12.2 15.8
29%
Japan
14.5 N/A
India 12.3
13.0
13.7
12%
Average (unweighted)
29.1 31.4 30.5 31.9 32.0 31.6 32.4 31.6 31.0 32.4 N/A
Source: ILOSTAT. Note: only G20 countries for which information is available are included in this table. *) Difference between earliest and latest available data point in per cent. **) Data for Canada are based on national reporting from NAICS, not ISCO.
Considering the relatively large number of missing values, the table further illustrates the need to improve the availability of data as described in the previous section.
Variation between economic sectors
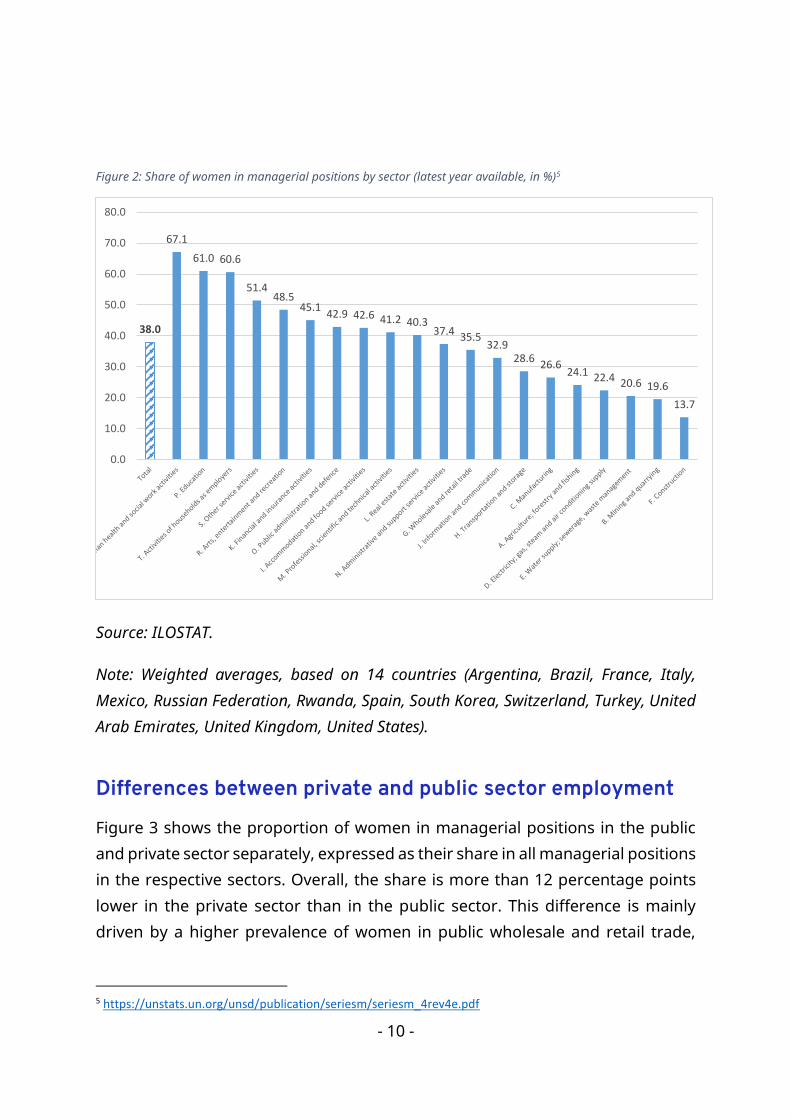
For the 14 G20 countries with available data by economic sectors, the average proportion of women in management positions stands at 38 per cent, but with considerable variations across sectors. While the proportion of women in management positions is below 25 per cent in sectors, such as mining and quarrying (19.6%) and construction (13.7%), which are traditionally male-dominated, it is above 50 per cent in sectors such as health and social work (67%), education (61%), activities of households as employers of domestic personnel (60.5%) and other service activities (51.5%).
- 10 -
Figure 2: Share of women in managerial positions by sector (latest year available, in %)5
Source: ILOSTAT.
Note: Weighted averages, based on 14 countries (Argentina, Brazil, France, Italy, Mexico, Russian Federation, Rwanda, Spain, South Korea, Switzerland, Turkey, United Arab Emirates, United Kingdom, United States).
Differences between private and public sector employment
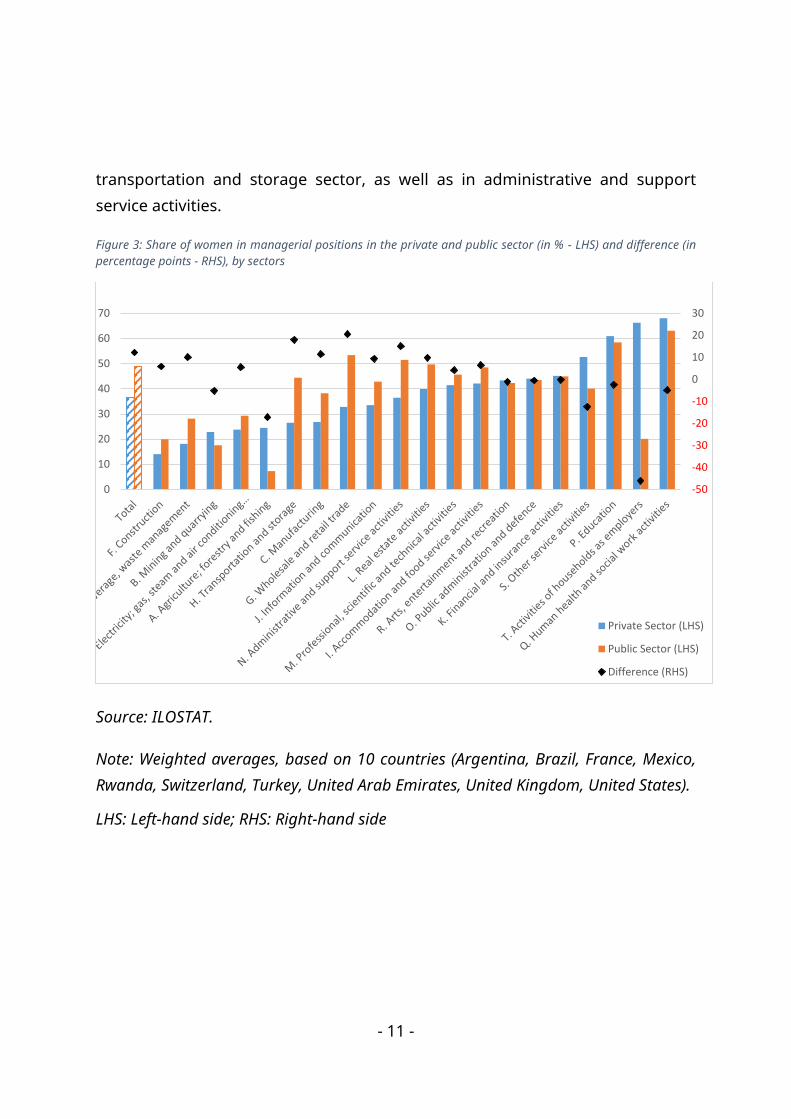
Figure 3 shows the proportion of women in managerial positions in the public and private sector separately, expressed as their share in all managerial positions in the respective sectors. Overall, the share is more than 12 percentage points lower in the private sector than in the public sector. This difference is mainly driven by a higher prevalence of women in public wholesale and retail trade,
5 https://unstats.un.org/unsd/publication/seriesm/seriesm_4rev4e.pdf
38.0
67.1
61.0 60.6
51.448.5
45.142.9 42.6 41.2 40.3
37.435.5
32.928.6
26.624.1 22.4 20.6 19.6
13.7
0.0
10.0
20.0
30.0
40.0
50.0
60.0
70.0
80.0
- 11 -
transportation and storage sector, as well as in administrative and support service activities.
Figure 3: Share of women in managerial positions in the private and public sector (in % - LHS) and difference (in percentage points - RHS), by sectors
Source: ILOSTAT.
Note: Weighted averages, based on 10 countries (Argentina, Brazil, France, Mexico, Rwanda, Switzerland, Turkey, United Arab Emirates, United Kingdom, United States).
LHS: Left-hand side; RHS: Right-hand side
-50
-40
-30
-20
-10
0
10
20
30
0
10
20
30
40
50
60
70
Private Sector (LHS)
Public Sector (LHS)
Difference (RHS)
- 12 -
Conclusion
This stock-taking report described data requirements to monitor progress towards gender parity in managerial positions and presented some preliminary findings based on the limited data available. The report highlighted significant data gaps as well as the need for a better harmonisation of data amongst G20 countries. Both issues need to be addressed in order to better monitor progress and enable evidence-based decision making.
The report further showed that only limited progress has been made in terms of women’s full and effective participation and equal opportunities for leadership positions in the world of work over the past 10 years. As revealed by the data on the proportion of women in managerial positions (SDG indicator 5.5.2), most G20 countries made progress while gender parity slipped further away in others. The share of women in managerial positions is particularly low in energy, construction, mining and quarrying - sectors that are traditionally dominated by men. More can be done to increase the share of women in managerial positions in these sectors, and those traditionally dominated by men more broadly. Out of all service sectors, the share of women in managerial positions in information and telecommunications is the lowest, although it is a key sector for the future of work and the digital economy in particular. Overall, the public sector seems to provide more management opportunities for women than the private sector. Yet, the path to reach a ratio of 50 per cent (which would mean an equal distribution between men and women of the management positions) remains long in both public and private sector. Based on the trends reported in table 1, it could take G20 countries about 50 years to achieve parity at the top – unless decisive action is taken.
All G20 countries are being strongly affected by the COVID-19 pandemic, which has had a particular effect on women.6 Women are more engaged in frontline
6 See ILO & OECD. 2020. Women at Work in G20 countries: Progress and policy action.
- 13 -
occupations in the health-care sector then men and account for the majority of health-sector workers in nearly all G20 economies. Moreover, 41 per cent of employed women can be found in sectors rated as being at high risk of severe COVID-19 impact in terms of job losses and a decline in working hours, compared to 35 per cent of total male employment.7 This suggests that women have suffered disproportionately from job loss and reduced hours. Thus, the COVID-19 crisis risks eroding some of the gains towards gender equality that have been achieved in G20 labour markets over recent years.
This is not inevitable if decisive action is taken. The private sector has a large range of opportunities to foster gender parity in managerial positions. An inclusive business culture starts with a gender-balanced workforce and includes a critical mass of women in management, senior leadership and on boards of directors (i.e. of at least 30 per cent).8 In addition, gender-inclusive policies and practices are needed to ensure equal opportunities for both women and men, and to address any kind of discrimination or bias, including regarding pay levels and employment conditions. Targeted policies emphasising flexible working hours and an equal sharing of parental leave can further lead to greater inclusivity and work-life balance for both women and men.
7 ILO. 2020. The COVID-19 response: Getting gender equality right for a better future for women at work. 8 See: ILO. 2019. Women in business and management: the business case for change.
- 14 -
Further resources
ILO & OECD. 2020. Women at Work in G20 countries: Progress and policy action.
ILO. 2020. COVID-19 crisis and the informal economy. Immediate responses and policy challenges.
ILO. 2020. The COVID-19 response: Getting gender equality right for a better future for women at work.
ILO. 2019. Women in business and management: the business case for change.
ILO. 2019. The business case for change. Country snapshots.
ILO. 2018. Care work and care jobs for the future of decent work.
ILO. 2016. Women in business and management: gaining momentum in the Middle East and North Africa: regional report. [Arabic version available here].
ILO. 2015. Women in business and management: gaining momentum.
UN. 2020. The Impact of COVID-19 on Women.
https://ilostat.ilo.org/
https://unstats.un.org/sdgs/metadata/files/Metadata-05-05-02.pdf