women and men in oecd countries - organisation for economic co
TRANSCRIPT

ORGANISATION FOR ECONOMIC CO-OPERATION AND DEVELOPMENT
www.oecd.org
Women and Men in OECD Countries Women and Men in OECD Countries Women and Men in OECD Countries Women and Men in OECD Countries Women and Men in OECD Countries Women and Men in OECD Countries Women and Men in OECD Countries Women and Men in OECD Countries Women and Men in OECD Countries Women and Men in OECD Countries Women and Men in OECD Countries Women and Men in OECD Countries Women and Men in OECD Countries Women and Men in OECD Countries Women and Men in OECD Countries Women and Men in OECD Countries Women and Men in OECD Countries Women and Men in OECD Countries Women and Men in OECD Countries Women and Men in OECD Countries Women and Men in OECD Countries Women and Men in OECD Countries Women and Men in OECD Countries Women and Men in OECD Countries Women and Men in OECD Countries Women and Men in OECD Countries Women and Men in OECD Countries Women and Men in OECD Countries Women and Men in OECD Countries Women and Men in OECD Countries Women and Men in OECD Countries Women and Men in OECD Countries Women and Men in OECD Countries Women and Men in OECD Countries Women and Men in OECD Countries Women and Men in OECD Countries Women and Men in OECD Countries Women and Men in OECD Countries Women and Men in OECD Countries Women and Men in OECD Countries Women and Men in OECD Countries Women and Men in OECD Countries Women and Men in OECD Countries Women and Men in OECD Countries Women and Men in OECD Countries Women and Men in OECD Countries Women and Men in OECD Countries Women and Men in OECD Countries Women and Men in OECD Countries Women and Men in OECD Countries Women and Men in OECD Countries Women and Men in OECD Countries Women and Men in OECD Countries Women and Men in OECD Countries Women
and Men in OECD Countries Women and Men in OECD Countries Women and Men in OECD Countries Women and Men in OECD Countries Women and Men in OECD Countries Women and Men in OECD Countries Women and Men in
Women and Men in OECD Countries Women and Men in OECD Countries Women and Men in OECD Countries Women and Men in OECD Countries Women and Men in OECD Countries Women and Men in OECD Countries Women and Men in OECD Countries Women and Men in OECD Countries Women and Men in OECD Countries Women and Men in OECD Countries Women and Men in OECD Countries Women and Men in OECD Countries Women and Men in OECD Countries Women and Men in OECD Countries Women and Men in OECD Countries Women and Men in OECD Countries Women and Men in OECD Countries Women and Men in OECD Countries Women and Men in OECD Countries Women and Men in OECD Countries Women and Men in OECD Countries Women and Men in OECD Countries Women and Men in OECD Countries Women and Men in OECD Countries Women and Men in OECD Countries Women and Men in OECD Countries Women and Men in OECD Countries Women and Men in OECD Countries Women and Men in OECD Countries Women and Men in OECD Countries Women and Men in OECD Countries Women and Men in OECD Countries Women and Men in OECD Countries Women and Men in OECD Countries Women and Men in OECD Countries Women and Men in OECD Countries Women and Men in OECD Countries Women and Men in OECD Countries Women and Men in OECD Countries Women and Men in OECD Countries Women and Men in OECD Countries Women and Men in OECD Countries Women and Men in OECD Countries Women and Men in OECD Countries Women and Men in OECD Countries Women and Men in OECD Countries Women and Men in OECD Countries Women and Men in OECD Countries Women and Men in OECD Countries Women and Men in OECD Countries Women and Men in OECD Countries Women and Men in OECD Countries Women and Men in OECD Countries Women and Men in OECD Countries Women and Men in OECD Countries Women and Men in OECD Countries Women and Men in OECD Countries Women and Men in OECD Countries Women and Men in OECD Countries Women and Men in OECD
Women and Men in OECD Countries Women and Men in OECD Countries Women and Men in OECD Countries Women and Men in OECD Countries Women and Men in OECD Countries Women and Men in OECD Countries Women and Men in OECD Countries Women and Men in OECD Countries Women and Men in OECD Countries Women and Men in OECD Countries Women and Men in OECD Countries Women and Men in OECD Countries Women and Men in OECD Countries Women and Men in OECD Countries Women and Men in OECD Countries Women and Men in OECD Countries Women and Men in OECD Countries Women and Men in OECD Countries Women and Men in OECD Countries Women and Men in OECD Countries Women and Men in OECD Countries Women and Men in OECD Countries Women and Men in OECD Countries Women and Men in OECD Countries Women and Men in OECD Countries Women and Men
Women and Men in OECD Countries Women and Men in OECD Countries Women and Men in OECD
and Men in OECD Countries Women and Men in OECD Countries Women and Men in OECD Countries Women and Men in OECD Countries Women and Men in OECD Countries Women and Men in OECD Countries Women and Men in OECD Countries Women and Men in OECD Countries Women and Men in
Women and Men in OECD Countries Women and Men in OECD Countries Women and Men in OECD Countries Women and Men in OECD Countries Women and Men in OECD Countries Women and Men in OECD Countries Women and Men in OECD Countries Women and Men in OECD Countries Women and Men in OECD Countries Women and Men in OECD Countries Women and Men in OECD Countries Women and Men in OECD Countries Women and Men in OECD Countries Women and Men in OECD Countries Women and Men in OECD Countries Women and Men in OECD Countries Women and Men in OECD Countries Women
and Men in OECD Countries Women and Men in OECD Countries Women and Men in OECD Countries
Women and Men in OECD Countries Women and Men in OECD Countries Women and Men in OECD
OECD Countries Women and Men in OECD Countries Women and Men in OECD Countries Women and Men in OECD Countries Women and Men in OECD Countries Women and Men in OECD Countries Women and Men in OECD Countries Women and Men in OECD Countries Women and Men in OECD Countries Women and Men in OECD Countries Women and Men in OECD Countries Women and Men in OECD Countries Women and Men in OECD Countries Women and Men in OECD Countries Women and Men in OECD Countries Women and Men in OECD Countries Women and Men in OECD Countries Women and Men in OECD Countries Women and Men in OECD Countries Women and Men in OECD Countries Women and Men in OECD Countries Women and Men in OECD Countries Women and Men in OECD Countries Women and Men in OECD Countries Women and Men in OECD Countries Women and Men in OECD Countries Women and Men in OECD Countries Women and Men in OECD Countries Women and Men in OECD Countries Women and Men in OECD Countries Women and Men in OECD Countries Women and Men in OECD Countries Women
and Men in OECD Countries Women and Men in OECD Countries Women and Men in OECD Countries Women and Men in OECD Countries Women and Men
OECD Countries Women and Men in OECD Countries Women and Men in OECD Countries Women and Men in OECD Countries Women and Men in OECD Countries Women and Men in OECD Countries Women and Men in OECD Countries Women and Men in OECD Countries Women and Men in OECD Countries Women and Men in OECD Countries Women and Men in OECD Countries Women and Men in OECD Countries Women and Men in OECD Countries Women and Men in OECD Countries Women and Men in OECD Countries Women and Men in OECD Countries Women and Men in OECD Countries Women and Men in OECD Countries Women and Men in OECD Countries Women and Men in OECD Countries Women and Men in OECD Countries Women and Men in OECD Countries Women and Men in OECD Countries Women and Men in OECD Countries Women and Men in OECD Countries Women and Men in OECD Countries Women and Men in OECD Countries Women and Men in OECD Countries Women and Men in OECD Countries Women
WOMEN AND MEN IN OECD COUNTRIES
Countries Women and Men in OECD Countries Women and Men in OECD Countries Women and Men in OECD Countries Women and Men in OECD Countries Women and Men in OECD Countries Women and Men in OECD Countries Women and Men in OECD Countries Women and Men in OECD Countries Women and Men in OECD Countries Women and Men in OECD Countries Women and Men in OECD Countries Women and Men in OECD Countries Women and Men in OECD Countries Women and Men in OECD Countries Women and Men in OECD Countries Women and Men in OECD Countries Women and Men in OECD Countries Women and Men in OECD Countries Women and Men in OECD Countries Women and Men in OECD Countries Women and Men in OECD Countries Women and Men in OECD Countries Women and Men in OECD Countries Women and Men in OECD Countries Women and Men in OECD Countries Women and Men in OECD Countries Women and Men in OECD Countries Women and Men in OECD Countries Women and Men in OECD Countries Women and Men in OECD Countries Women and Men in OECD Countries Women and Men in OECD Countries Women and Men in OECD Countries Women and Men in OECD Countries Women and Men in OECD Countries Women and Men in OECD Countries Women and Men in
Men in OECD Countries Women and Men in OECD Countries Women and Men in OECD Countries Women and Men in OECD Countries Women and Men in OECD Countries Women and Men in OECD Countries Women and Men in OECD Countries Women and Men in OECD Countries Women and Men in OECD Countries Women and Men in OECD Countries Women and Men in OECD Countries Women and Men in OECD Countries Women and Men in OECD Countries Women and Men in OECD Countries Women and Men
OECD Countries Women and Men in OECD Countries Women and Men in OECD Countries Women and Men in OECD Countries Women and Men in OECD Countries Women and Men in OECD Countries Women and
Men in OECD Countries Women and Men in OECD Countries Women and Men in OECD Countries Women and Men in OECD Countries Women and Men in OECD Countries Women and Men in OECD Countries
Countries Women and Men in OECD Countries Women and Men in OECD Countries Women and Men in
in OECD Countries Women and Men in OECD Countries Women and Men in OECD Countries Women and Men in OECD Countries Women and Men in OECD Countries Women and Men in OECD Countries Women and Men in OECD Countries Women and Men in OECD Countries Women and Men in OECD Countries Women and Men in OECD Countries Women and Men in OECD Countries Women and Men in OECD Countries Women and Men in OECD Countries Women and Men in OECD Countries Women and Men in OECD Countries Women and Men in OECD Countries Women and Men in OECD Countries Women and Men in OECD Countries Women and Men in OECD Countries Women and Men in OECD Countries Women and Men in OECD Countries Women and Men in OECD Countries Women and Men in OECD Countries Women and Men in OECD Countries Women and Men in OECD Countries Women and Men in OECD Countries Women and Men in OECD Countries Women and Men in OECD Countries Women and Men in OECD Countries Women
and Men in OECD Countries Women and Men in OECD Countries Women and Men in OECD Countries Women and Men in OECD Countries Women and Men
in OECD Countries Women and Men in OECD Countries Women and Men in OECD Countries Women and Men in OECD Countries Women and Men in OECD Countries Women and Men in OECD Countries Women and Men in OECD Countries Women and Men in OECD Countries Women and Men in OECD Countries Women and Men in OECD Countries Women and Men in OECD Countries Women and Men in OECD
in OECD Countries Women and Men in OECD Countries Women and Men in OECD Countries Women and Men in OECD Countries Women and Men in OECD Countries Women and Men in OECD Countries Women and Men in OECD Countries Women and Men in OECD Countries Women and Men in OECD Countries Women and Men in OECD Countries Women and Men in OECD Countries Women and Men in OECD Countries Women and Men in OECD Countries Women and Men in OECD Countries Women and Men in OECD Countries Women and Men in OECD Countries Women and Men in OECD Countries Women and Men in OECD Countries Women and Men in OECD Countries Women and Men in OECD Countries Women and

WOMEN AND MEN IN OECD COUNTRIES

2
Table of contents
Preface: From indicators to action ........................................ 3
Better policies for men and women ..................................... 4
OECD work on gender equality in developing countries ................................................................. 6
1. Population
Men and women in the populations of OECD countries ............................................................................. 7
Total fertility rates ............................................................................ 8
Immigration ........................................................................................... 9
2. Education
Students with disabilities, learning difficulties and disadvantages ............................ 10
Student performance ...................................................................... 11
Tertiary education ............................................................................ 12
University graduates by field of study ................................ 13
3. Labour market
Inactive youths .................................................................................... 14
Gender wage gaps .............................................................................. 15
Employment ........................................................................................... 16
Unemployment .................................................................................... 17
Self employment ................................................................................ 18
Working hours ..................................................................................... 19
Occupations of men and women ............................................ 20
Immigrants and employment .................................................. 21
4. Political and economic power
Women in parliament .................................................................... 22
Managerial and professional posts ....................................... 23
5. Social issues
Life satisfaction ................................................................................... 24
Social isolation .................................................................................... 25
Prison population .............................................................................. 26
6. Health
Life expectancy at birth ................................................................ 27
Causes of death ................................................................................... 28
Tobacco consumption .................................................................... 29
Overweight and obese .................................................................... 30
Acknowledgements:
This brochure has been prepared by Derek Blades, with Mark Pearson, Head of the OECD Social Policy Division as editor. Contributors from across the Organisation deserve the real credit for the existence of this brochure, however, for all the work they have undertaken in developing gender statistics over the years. The enthusiasm of the OECD Gender group was essential in getting the project completed. Particular thanks are due to Pauline Fron, Lynda Hawe and Valentina Kostyleva.

3
PrefaceFrom indicators to action: OECD provides the analysis
The OECD exists to promote policies designed “to achieve the highest sustainable economic growth and employment and a rising standard of living”. We are proud of the role we play in helping countries learn from one another in achieving these goals, and in identifying “best practice” in a very broad range of policies, from education and pensions to macroeconomic policy and trade.
To identify best practice, the OECD develops indicators which illustrate some vital differences in experience, across countries, over time and across different groups. Such indicators are not plucked from thin air. Rather, they are the product of many years of painstaking work in identifying the issue, getting agreement across countries, collecting and standardising data. For many years now, we have been trying to improve analysis by collecting statistics separately for women and men. Outcomes for women and men are very different across many different areas of life, and policies have to reflect this. Best practice across countries in many areas of policy cannot be “gender-blind”.
The “Quality Framework and Guidelines for OECD Statistics” indicates that, whenever appropriate, the OECD should collect data disaggregated by sex. The indicators in this brochure are a tiny sample of the data which are now collected by the OECD. They illustrate some important differences between women and men. Sometimes outcomes are better for women than for men – they perform better at school, they are less likely to go to prison, to smoke, are less likely to be “socially isolated”, and they live longer. In other areas, men have a better time of it – they earn more and are more likely to get into positions of power in both political and economic life.
In addition to these indicators of outcomes, we need to analyse policy. There is not space to showcase all of our gender-related work in this brochure, but we are making a lot of headway in many different areas of gender analysis, not just in the areas that you would expect – pensions, family policies and education, for example – but also in trade, entrepreneurship and development aid. If governments want “more growth, employment and a better standard of living”, then they are going to need more of this sort of gender-sensitive analysis, and more indicators of how men and women are doing. The OECD is committed to sustain this effort providing solid statistical evidence and analysis.
Dick Hecklinger OECD Deputy-Secretary General

4
Better policies for men and women
younger age groups, most new claims for disability benefits are by women rather than by men – see new reviews on Sickness, Disability and Work. Some people argue that this is because of an increase in stress. This in turn is said to be due to the rise in female employment which, when combined with continuing care responsibilities, means many women now find themselves doing two jobs.
One of the ways in which countries have coped with the increase in demand for carers has been through immigration. Caring is the main area of employment for female migrants (see reviews of the Social Integration of Migrants). The fact that women provide more than half of all new immigration into OECD countries (see the International Migration Outlook) has too often been ignored by policymakers.
The OECD has long pioneered analysis of women’s entrepreneurship, through elimination of barriers to enterprise creation and growth. The Istanbul Declaration by OECD Ministers has recognised the importance of women’s entrepreneurship, and recommendations have been developed to foster women’s entrepreneurship. Local Reviews on Women’s Entrepreneurship have been undertaken in order to explore the role of women’s entrepreneurship in local development.
Gender issues have also been prominent in some unexpected areas. For example, the OECD Guidelines for Multinational Enterprises have been used to promote gender equality in the operations of multinationals in non-OECD countries. Gender and Trade argues that women sometimes face particular barriers in taking advantage of trade liberalisation. Information on Equal Opportunity Policies is collected as part of OECD’s work on
Indicators are only the first step in developing better policies for women and men: the next stage is to understand why these differences occur, and then what we can do about them. The following describes a few of the most important recent and ongoing projects aimed at improving gender policy in OECD countries. Information on OECD work on gender issues in developing countries follows.
Gender differences are striking in school performance, as the OECD PISA study (Programme for International Student Assessment) of attainments at age 15 shows. National experiences are being reviewed in an Equity in Education project, which looks at why different groups – including the different sexes – end up with different outcomes. While female participation in tertiary education has grown rapidly in comparison to males, the choice of subjects remains very different. This contributes in part to the result that women end up in low-wage sectors of the economy, as documented in country reviews on The Transition from School to Work.
Work on the reconciliation of work and family life (Babies and Bosses) and studies in the OECD Employment Outlook and the OECD Economic Outlook show that taxation, provision of childcare and parental leave, and the availability of part-time work can all have a big impact on the working patterns of parents, particularly mothers. Family-friendly policies can also affect Fertility Rates, which have collapsed in many OECD countries.
Children are not the only family members that need care: older relatives may need help too. This is another task which predominantly falls on women. OECD work is looking at Disability Trends among older people and at different models for delivering Long-Term Care Services either at home or in institutions. For

5
Public Governance. New work is beginning which will look at how specified target groups, including women, could be more involved in Policymaking. OECD work suggests that having a gender dimension in Environmental Policy might be justified – women and men behave differently the way they use transport, recycle or purchase organic food.
A guidance document for regulators and industry on how best to assess whether Hazardous Chemicals can harm a woman’s ability to become pregnant and have healthy babies is under discussion. The OECD has developed a new hazard category within the Globally Harmonised System for Classification of Chemicals covering risks during pregnancy and breastfeeding.
The OECD Health Care Quality Indicators project has collected data on breast and cervical cancer screening and survival rates, with further work underway on colorectal cancer rates, and heart attack and stroke mortality rates.
Some aspects of the pension system favour women over men – lower retirement ages (though these are often being phased out – see Living Longer, Working Longer) and longer life expectancy combined with gender-neutral actuarial tables in calculating pension payouts, for example (see Pensions at a Glance). On the other hand, women have lower pensions than men and are more likely to be in poverty in old age than men. This reflects reduced earning (and therefore pension contributions) through their lifetime, partly because of child-rearing. Furthermore, work on Financial Education suggests that women have less understanding and confidence in making financial decisions, have less to save, and invest more conservatively than do men.
Further information is available on those projects in italics above. Simply go to the Gender Topic on the OECD website (www.oecd.org/gender) and click on whichever link interests you. Alternatively, contact [email protected] for further information.

6
OECD work on gender equality in developing countries
Did you know?On average, women in developing countries get married 6½ years earlier than in OECD countries. There are still 800 million people in the world lacking basic literacy skills. Women account for two-thirds of the total.Young women in sub-Sahara Africa aged 15-24 are between two and six times as likely to be HIV-positive than men of a similar age.About one-half of aid to basic education and basic health targeted gender-specific concerns.
Progress towards gender equality and women’s empowerment is vital for improving economic, social and political conditions in developing countries. The OECD helps show how governments can take gender equality into account in development policies and practices. OECD countries are encouraged to give aid in a way that supports gender equity.
The Gender, Institutions and Development database
In large parts of the developing world, traditions and socio-cultural norms still trap countries in poverty as they bar women from economic activities: more discrimination – less economic growth – more poverty.
To help governments choose effective policies, the OECD has created the Gender, Institutions and Development Database (GID). It includes comparative data for 161 countries on the socio-economic status of women. Its innovation is the inclusion of institutional variables that range from intra-household behaviour to social norms. Information on cultural and traditional practices is coded to measure the level of discrimination, making the GID a unique tool for a wide range of analytical queries and allowing a case-by-case adaptation to specific research or policy questions.
By identifying cultural and traditional practices that discriminate against women, from forced marriages and female genital mutilation to restrictions on inheritance and ownership rights, the GID helps design effective policies. More funding will be effective only if the underlying causes of discrimination are addressed. The Gender, Institutions and Development database can be accessed free of charge at www.oecd.org/dev/institutions/GIDdatabase.
Gender equality and aid
The Network on Gender Equality (GENDERNET) (www.oecd.org/dac/gender) is a forum where gender experts from development co-operation agencies meet to stimulate fresh thinking and new approaches to investing in gender equality and women’s empowerment.
The OECD asks countries to provide information on aid in support of gender equality. In the OECD’s Creditor Reporting System database (www.oecd.org/dac/stats/crs/gender), donor countries are asked to indicate for each individual aid activity whether or not it targets gender equality as one of its policy objectives. A study conducted in 2005 showed that two-thirds of aid in support of gender equality was in the social sectors, especially basic education and basic health. About one-half of aid to basic education and basic health targeted gender-specific concerns, while little was reported as targeting gender equality in the sectors of transport, communications and energy infrastructure.

1W O M E N A N D M E N I N O E C D C O U N T R I E S Population
7
Men and women in the populations of OECD countries
Did you know?Up to their early teens, boys slightly outnumber girls in all the OECD countries. In the 25-54 age group – “prime working life” – the numbers of men and women are about equal in all countries. But in the older age groups women often outnumber men by more than two to one.
In 2005 women slightly outnumbered men in all OECD countries except Iceland, where the numbers were equal, and Korea and Turkey where there were slightly more men than women. In the OECD area as a whole there are 104 women for every 100 men.
OECD populations in 2005 and ratios of women to men
Population (‘000)
W/M ratio
Population (‘000)
W/M ratio
Population (‘000)
W/M ratio
Iceland 295 1.00 Sweden 9 041 1.02 Spain 43 064 1.04
Luxembourg 465 1.03 Hungary 10 098 1.05 Korea 47 817 0.99
New Zealand 4 028 1.03 Czech Rep. 10 220 1.10 Italy 58 093 1.06
Ireland 4 148 1.01 Belgium 10 419 1.04 United Kingdom 59 668 1.05
Norway 4 620 1.01 Portugal 10 495 1.07 France 60 496 1.05
Finland 5 249 1.04 Greece 11 120 1.02 Turkey 73 193 0.98
Slovak Rep. 5 401 1.02 Netherlands 16 299 1.01 Germany 82 689 1.05
Denmark 5 431 1.06 Australia 20 155 1.03 Mexico 107 029 1.05
Switzerland 7 252 1.06 Canada 32 268 1.02 Japan 128 085 1.05
Austria 8 189 1.05 Poland 38 530 1.06 United States 298 213 1.03
In all OECD countries a few more boys are born than girls, so that boys predominate in the 0-14 age group. However, men smoke and drink alcohol more than women, have higher suicide rates, and indeed have higher mortality rates from many other causes. As a result, women are much more numerous than men in the 80+ age group.
High male death rates in the Second World War explain the women/men ratios in excess of 2.0 in the chart below. The male death toll was particularly high in Germany, Finland, Japan and the countries of central Europe.
Ratios of women to men at different ages2005
0
0.5
1.0
1.5
2.0
2.5
3.0
Turke
y
Mexico
Greece
Icelan
d
Australi
a
Sweden
New Zea
land
Canad
a
United
States
Norway
Switzerl
andSpa
in
United
Kingdo
mIre
land
Portug
alIta
ly
OECD aver
age
Franc
e
Denmark
Belgium
Slovak
Rep
ublic
Austri
aJa
panKor
ea
Netherl
ands
Czech
Rep
ublic
Luxe
mbour
g
Poland
Hunga
ry
Finlan
d
German
y
0 to 14 25 to 54 80 and over
Source: United Nations population projections, 2004 revisions.
Further reading:OECD (2006), Labour Force Statistics – 2006 Edition, OECD, Paris.

1W O M E N A N D M E N I N O E C D C O U N T R I E S Population
8
1W O M E N A N D M E N I N O E C D C O U N T R I E S Population
Total fertility rates
In all OECD countries, fertility rates have declined for young women and increased at older ages, because women (and men) are postponing the age at which they start their families.
Many reasons have been given for the dramatic change in fertility rates. The most convincing is that young women, now better educated than those of earlier generations, wish to have a career as well as a family. The countries with the lowest fertility rates tend to be those with the highest female employment rates.
Total fertility rates: number of children expected to be born to women aged 15 to 49
2004 or latest year available
Did you know?The total fertility rate is the number of children that are expected to be born to women of child-bearing age. A rate of about 2.1 will produce a stable population. Less than this, the population will decline unless the shortfall is made up by immigration.Only two OECD countries have fertility rates above this level: Mexico and Turkey. The average fertility rate in OECD countries is now just 1.6.
0
0.5
1.0
1.5
2.0
2.5
3.0
Korea
Czech
Rep
ublic
Poland
Slovak
Rep
ublic
Hunga
ry
GreeceJa
panSpa
inIta
ly
German
y
Portug
al
Switzerl
and
Austria
Canad
a
OECD aver
age
Belgium
Luxe
mbour
g
Netherl
ands
Sweden
United
Kingdo
m
Austra
lia
Denmark
Finlan
d
Norway
Franc
e
Irelan
d
New Zea
land
Icelan
d
United
States
Mexico
Turke
y
The chart below shows the long-term decline in total fertility rates. The countries which had the highest fertility rates in 1970 have, unsurprisingly, recorded the largest subsequent declines. Finland, Denmark and Sweden are among those countries which recorded the smallest declines: these are countries which have traditionally had family-friendly employment policies including generous maternity/paternity leave and widely available child-care facilities. Even here, their current rates are below the replacement threshold.
Decline in total fertility rates since 1970Absolute difference between 1970 and 2004 fertility rates
00.51.01.52.02.53.03.54.04.55.0
Finlan
d
Canad
a
Sweden
Denmark
Luxe
mbourg
United
States
France
Belgium
United
Kingdo
m
German
y
Norway
Switzerl
and
Czech
Rep
ublic
Hunga
ry
Icelan
dJa
pan
Netherl
ands
Austri
a
Poland
OECD aver
ageIta
ly
Australi
a
Greece
Slovak
Rep
ublic
New Zea
land
Portug
alSpa
inKor
ea
Irelan
d
Turke
y
Mexico
Source: Council of Europe (2006), Recent Demographic Developments in Europe, 2004; Eurostat and national statistical offices.
Further reading:OECD (2005), Society at a Glance: OECD Social Indicators, OECD, Paris. OECD (2002-2004), Babies and Bosses – Reconciling Work and Family Life, series, OECD, Paris.

1W O M E N A N D M E N I N O E C D C O U N T R I E S Population
9
Immigration
Did you know?There are more female immigrants than male in 20 of the 23 countries for which data are available – the three exceptions being the United States, Norway and Australia where the numbers are about equal. In other countries women, on average, emigrate about as often as men in these countries.
Immigrants are usually defined as those born in a different country from where they are now living – they are “foreign-born” as opposed to “native-born”.
In the past, in most OECD countries, the majority of immigrants came from other OECD countries, especially from OECD Europe. This is no longer the case. Asia is now the main source continent of immigrants.
Ratios of male to female immigrants2004 or nearest year available, percentages
The chart below shows the gender breakdown of immigrants living in European OECD countries and in the United States according to their countries of birth, where the countries considered are limited to those with at least 100 000 immigrants. Percentages of women immigrants are especially high in Europe for immigrants from the Philippines, the Russian Federation and Poland, whereas in the United States, women are more numerous among immigrants from Japan, Thailand and the Dominican Republic.
Note that this chart shows only countries of birth from which substantially more women than men emigrate. More men than women emigrate from some of the other sources of migration such as Central America, Ecuador and India in the case of the United States, and Tunisia, Pakistan, Albania and Morocco in the case of Europe.
Gender breakdown of immigrants in OECD Europe and the United States by country of birth
Selected countries of birth: 2004 or latest year available, percentages
0102030405060708090
100
United
States
Norway
Australi
a
Luxe
mbourg
Netherl
ands
Irelan
d
German
y
Franc
eSpain
Sweden
New Zea
land
Belgium
Switzerl
and
Canad
a
OECD aver
age
United
Kingdo
m
Denmark
Austria
Finlan
d
Portugal
Czech
repu
blic
Italy
Hunga
ry
Poland
Male immigrants Female immigrants
Source: OECD (2006), International Migration Outlook, OECD, Paris.
Further reading:OECD (2006), International Migration Outlook – 2006 Edition, OECD, Paris.
0102030405060708090
100
Poland
Colombia
Korea
Philipp
ines
Jamaic
a
German
y
Trinid
ad &
Tobag
o
Domini
can R
epub
lic
Thailan
dJa
pan
German
y
Irelan
d
France
Spain
Finlan
d
Ukraine
Brazil
Poland
Russia
n Fed
eratio
n
Philipp
ines
Men Women
United States OECD Europe
10
2W O M E N A N D M E N I N O E C D C O U N T R I E S Education2W O M E N A N D M E N I N O E C D C O U N T R I E S Education
Students with disabilities, learning difficulties and disadvantages
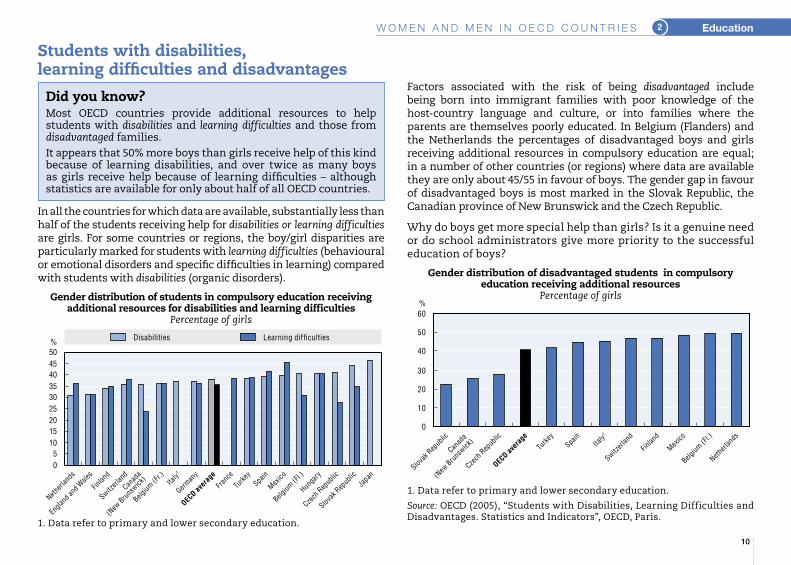
Did you know?Most OECD countries provide additional resources to help students with disabilities and learning difficulties and those from disadvantaged families.It appears that 50% more boys than girls receive help of this kind because of learning disabilities, and over twice as many boys as girls receive help because of learning difficulties – although statistics are available for only about half of all OECD countries.
In all the countries for which data are available, substantially less than half of the students receiving help for disabilities or learning difficulties are girls. For some countries or regions, the boy/girl disparities are particularly marked for students with learning difficulties (behavioural or emotional disorders and specific difficulties in learning) compared with students with disabilities (organic disorders).
Gender distribution of students in compulsory education receiving additional resources for disabilities and learning difficulties
Percentage of girls
05
101520253035404550%
Netherl
ands
Engla
nd and
Wale
s
Finlan
d
Switzerl
and
Canad
a
(New
Bruns
wick)
Belgium
(Fr.)
Italy1
German
y
OECD aver
age
France
Turke
ySpain
Mexico
Belgium
(Fl.)
Hunga
ry
Czech
Rep
ublic
Slovak
Rep
ublic
Japan
Disabilities Learning difficulties
1. Data refer to primary and lower secondary education.
1. Data refer to primary and lower secondary education.
Source: OECD (2005), “Students with Disabilities, Learning Difficulties and Disadvantages. Statistics and Indicators”, OECD, Paris.
0
10
20
30
40
50
60%
Slovak
Rep
ublic
Canad
a
(New
Bruns
wick)
Czech
Rep
ublic
OECD aver
age
Turke
ySpa
inIta
ly1
Switzerl
and
Finlan
d
Mexico
Belgium
(Fl.)
Netherl
ands
Factors associated with the risk of being disadvantaged include being born into immigrant families with poor knowledge of the host-country language and culture, or into families where the parents are themselves poorly educated. In Belgium (Flanders) and the Netherlands the percentages of disadvantaged boys and girls receiving additional resources in compulsory education are equal; in a number of other countries (or regions) where data are available they are only about 45/55 in favour of boys. The gender gap in favour of disadvantaged boys is most marked in the Slovak Republic, the Canadian province of New Brunswick and the Czech Republic.
Why do boys get more special help than girls? Is it a genuine need or do school administrators give more priority to the successful education of boys?
Gender distribution of disadvantaged students in compulsory education receiving additional resources
Percentage of girls

2W O M E N A N D M E N I N O E C D C O U N T R I E S Education
11
Student performance
Did you know?OECD’s Programme for International Student Assessment (PISA) assesses student knowledge and skills in mathematics, reading, and science at age 15.In general, girls outperform boys in reading by a wide margin while boys outperform girls, by lesser margins, in mathematics and, even less in science.
The chart below shows the gender gaps for scores in mathematics, with in dark colour the significant differences between boys and girls.
Gender differences (boys-girls) in student performance in mathematics in PISA 2003
Gender differences (boys-girls) in student performance in reading in PISA 2003
-20-15-10-505
1015202530
Score point difference
Korea
Greece
Slovak
Rep
ublic
Italy
Luxe
mbourg
Switzerl
and
Denmark
Turke
y
Czech
Rep
ublic
Irelan
d
New Zea
land
Portug
al
Canad
a
Mexico
German
ySpa
in
France
Japan
Hungary
Austria
Belgium
Finlan
d
Sweden
United
States
Norway
Poland
Australi
a
Netherl
ands
Icelan
d
OECD average
Source: OECD (2004), Learning for Tomorrow’s World – First results from PISA 2003, Table 2.5c, OECD, Paris.
In mathematics the boys score higher than the girls in the majority of the countries except in Australia, Austria, Belgium, Japan, the Netherlands, Norway and Poland where the advantage for boys is not significant, and in Iceland where the girls outperform the boys.
Source: OECD (2004), Learning for Tomorrow’s World - First results from PISA 2003, Table 6.3, OECD, Paris.
In the reading assessment, however, the girls come out well ahead of the boys in all countries and the gender gaps were exceptionally large in Iceland, Norway, Austria and Finland as shown in the chart above.
Science shows the smallest average gender differences among all contents assessed. Statistically significant differences in favour of men are found in Canada, Denmark, Greece, Korea, Luxembourg, Mexico, New Zealand, Poland, Portugal, the Slovak Republic and Switzerland. On the other hand, women in Finland and Iceland outperform men.
Further reading: OECD (2004), Learning for Tomorrow’s World: First Results from PISA 2003, OECD, Paris.
-70
-60
-50
-40
-30
-20
-10
0
Icelan
d
Norway
Austria
Finlan
d
German
y
Poland Ita
ly
Australi
aSpa
in
Franc
e
Greece
Belgium
Sweden
Portug
al
Switzerl
and
Turke
y
Luxe
mbourg
Slovak
Rep
ublic
United
States
Canad
a
Czech
Rep
ublic
Hungary
Irelan
d
New Zea
land
Denmark
Japan
Mexico
Korea
Netherl
ands
OECD average
Score point difference

12
2W O M E N A N D M E N I N O E C D C O U N T R I E S Education2W O M E N A N D M E N I N O E C D C O U N T R I E S Education
Tertiary education
Did you know?On average 33% of women aged 25 to 34 have tertiary education compared with 28% for men of the same age in OECD countries.Even in the poorest parts of the world more than 60% of young girls usually attend primary school. In sub-Sahara Africa and in the Indian Sub-Continent only 3-4% of young women receive tertiary education.
Although tertiary education delays the start of paid employment, it substantially increases lifetime earnings and is a good investment both for the individual and for society.
In the OECD area, tertiary attainment rates for the population of working age range from below 12% in Turkey, the Czech Republic, Italy and the Slovak Republic to over 35% in Canada, the United States, Sweden and Japan. Female attainment rates exceed those for men in just over half of the countries with significantly higher rates in Canada, Finland, Sweden and New Zealand. By contrast, the number of men having attained a tertiary level of education is still substantially higher in Korea and Switzerland.
Percentage of men and women aged 25-64 with tertiary education2004 or latest year available
The next chart shows that in general young people of both sexes are more likely than their parents to acquire tertiary education. The only exceptions are Austria, Germany, Hungary and the United States, where tertiary attainment rates for young men are below those for older men. The most striking feature however is the large difference between the age groups for women. The increase in the number of women attaining a tertiary level of education has been particularly marked in Japan, Korea and Spain where cultural attitudes about the role of women in society have probably undergone more profound changes than in other OECD countries.
Differences in tertiary attainment by people aged 25-34 and 55-64
Percentage of young people with tertiary education minus percentage of older people with tertiary education, 2004
0
10
20
30
40
50
60
Turke
y
Czech
Rep
ublic
Italy
Slovak
Rep
ublic
Mexico
Portug
al
Austria
Poland
Hunga
ry
Switzerl
and
Greece
Luxe
mbourg
German
y
United
Kingdo
mKor
ea
OECD aver
age
France
Spain
Netherl
ands
New Zea
land
Irelan
d
Icelan
d
Belgium
Australi
a
Norway
Denmark
Japan
Sweden
Finlan
d
United
States
Canad
a
Men Women
-20
-10
0
10
20
30
40
50
Men Women
Czech R
epub
lic
Turke
y
Slovak
Repub
lic
German
y
New Zea
land
United
States
Hunga
ryIta
ly
Switzerl
and
Austria
United
Kingdo
m
Mexico
Denmark
Poland
Portug
al
Netherl
ands
Sweden
Australi
a
OECD aver
age
Greece
Luxe
mbour
g
Finlan
d
Icelan
d
Canad
a
Norway
Belgium
France
Irelan
dSpain
Japan
Korea
Source: OECD Education database and Gender, Institutions and Development (GID) database.
Further reading: OECD (2006), Education at a Glance: OECD Indicators, OECD, Paris.

2W O M E N A N D M E N I N O E C D C O U N T R I E S Education
13
University graduates by field of study
There are large gender differences in the subjects that young men and women study at university. Female preference for health and welfare subjects is most marked in Nordic countries – Finland, Iceland, Norway, Sweden and Denmark. In these countries less than 20% of graduates in these subjects are men. In Japan, Belgium and Switzerland, on the other hand, more than 40% of graduates in the “caring sciences” are men.
Percentage of university graduates in health and welfare subjects 2004 or latest year available
Did you know?For all OECD countries taken together, health and welfare subjects are the most popular for women with humanities, arts and education a close second. For male graduates, subjects related to engineering, manufacturing and construction come first – just ahead of mathematics and computer science.About an equal number of men and women opt for life sciences, physical sciences and agriculture and for social sciences, business studies and law.
The gender gap is equally marked in subjects related to engineering, manufacturing and construction. Less than 20% of graduates in these topics are women in Japan, Switzerland, the Netherlands and Austria. The largest shares of women graduates in these subjects are in Greece and Portugal.
Such differences in subjects studied at university both reflect and influence different career choices, contributing to occupational segregation in the labour market.
Percentage of university graduates in engineering, manufacturing and construction subjects
2004 or latest year available
0102030405060708090
100
Women Men
Japan
Belgium
Switzerl
and
Mexico
Turke
y
AustriaKor
ea
Franc
e
German
y
Greece
Italy
Czech
Rep
ublic
OECD aver
age
Poland
United
Kingdo
m
United
States
Slovak
Rep
ublic
Netherl
ands
Australi
aSpain
Canad
a
Hunga
ry
Portugal
New Zea
land
Irelan
d
Denmark
Sweden
Norway
Icelan
d
Finlan
d
Source: OECD Education database and OECD (2006), Education at a Glance: OECD Indicators, OECD, Paris.
Further reading: OECD (2006), Education at a Glance: OECD Indicators, OECD, Paris.
0102030405060708090
100
Women Men
Greece
Portug
al
Slovak
Rep
ublic
New Zea
landSpa
in
Icelan
d
Sweden Ita
ly
Poland
Denmark
France
Irelan
d
OECD aver
age
Hungary
Turke
y
Czech
Rep
ublic
Canad
aKor
ea
Mexico
Australi
a
Belgium
Norway
German
y
United
States
Finlan
d
United
Kingdo
mAustr
ia
Netherl
ands
Switzerl
andJa
pan

14
3W O M E N A N D M E N I N O E C D C O U N T R I E S Labour market3W O M E N A N D M E N I N O E C D C O U N T R I E S Labour market
Inactive youths constitute both a present and future problem. Present because they are more likely to be involved in various kinds of anti-social behaviour including property crime and drug abuse. Future, because lacking work experience or marketable skills they are likely to join the pool of the “socially excluded” for much of their lifetimes.
In most OECD countries less than 10% of those aged 15 to 19 are inactive and less than 5% in eight. Rates in excess of 10% were recorded in Turkey, Mexico, Portugal, Spain and the United Kingdom.
Percentage of people aged 15-19 who were not in education or work (2004)
Did you know?“Inactive youths” are those between 15 and 19 who have no jobs and are not at school.In most countries the gender differences are small but there were substantially fewer young inactive women than men in Norway, Belgium and Sweden and many more inactive women than men in Mexico and Turkey.
The good news is that youth inactivity rates have been falling in most countries since 1995 – the first year for which these data are available. (In the chart below negative “growth rates” mean a decline.)
For the OECD as a whole, female youth inactivity rates have been falling at just over 3.0% per year compared with 1.9% for men. In most countries where youth unemployment has been rising, the increases have been larger for young men than young women. In Sweden, on the other hand, the annual growth of the inactivity rate for women has been relatively high while the rate for men has been falling.
Average annual growth in rates of youth inactivity1995 or earliest year available to 2004
05
10 15
20253035404550
Men Women
Poland
Netherl
ands
Denmark
Norway
Luxe
mbourg
German
y
Icelan
d
Belgium
Sweden
Franc
e
Finlan
d
Hungary
Czech
Rep
ublic
Canad
a
Switzerl
and
Slovak
Rep
ublic
United
States
Austra
lia
Austri
a
OECD aver
age
Irelan
dIta
ly
United
Kingdo
mGree
ceSpa
in
Portug
al
Mexico
Turke
y
Source: OECD Education database.
Further reading: OECD (2006), Education at a Glance: OECD Indicators, OECD, Paris. OECD (2005), OECD Employment Outlook, OECD, Paris.
-25-20-15-10-505
10152025
Men Women
Icelan
d
Switzerl
and
Belgium
Luxe
mbourg
Poland
Slovak
Rep
ublic
Italy
Denmark
Hunga
ry
Netherl
ands
Australi
a
OECD aver
age
Greece
Mexico
United
States
Canad
aSpain
Czech
Rep
ublic
German
y
Turke
y
Portug
al
Sweden
France
United
Kingdo
mIre
land
Inactive youths

15
3W O M E N A N D M E N I N O E C D C O U N T R I E S Labour market
Almost all OECD countries legislate to ensure equal pay for equal work regardless of gender. But there are all sorts of reasons why this is insufficient to close the gender gap. Discrimination may continue, if legislation is not or cannot be applied. More generally, women may end up in lower-paid occupations than men, and may struggle to be promoted as often as men.
Gender wage gapsGender gap in median earnings of full-time employees,
2004 or latest year available
Gender wage gapsThe chart below shows the gender gaps in wages – men’s minus women’s – for low paid and for high paid workers. (Low and high paid are defined as those in the 20th and 80th percentiles of the wage distribution respectively.) In a majority of countries, the gender gap is larger for the high wage earners. This is evidence that the “glass ceiling” is no myth – women are less likely to get into higher paid and managerial occupations.
Gender gap at the top and bottom of the earnings distribution2003 or latest year available
Did you know?In all OECD countries median wages for men are higher than those for women. The average difference is more than 15% and exceeds 20% in several countries.Male median earnings are more than 20% higher than those of women in Korea, Japan, Germany, Switzerland, Canada and the United States. Note that these are median earnings in full-time jobs and so are not affected by a widespread preference for part-time work by women (though men tend to work longer hours than women). At the other end of the scale, the gender gap is less than 12% in New Zealand, Belgium, Poland, Greece and France.
0
5
10
15
20
25
30
35
40
45
New Zea
land
Belgium
Poland
Greece
Franc
e
Hunga
ry
Denmark
Australi
a
Sweden
Spain
OECD aver
age
Czech
Rep
ublic
Portug
al
Irelan
d
United
Kingdo
m
Finlan
d
United
States
Canad
a
Switzerl
and
German
yJa
pan
Korea
Source: OECD Employment and Labour Market Statistics.
Further reading: OECD (2005), OECD Employment Outlook, OECD, Paris. OECD (2002-2004), Babies and Bosses – Reconciling Work and Family Life, series, OECD, Paris.
0
510
1520
2530
3540
45% Low earners (20th percentile) High earners (80th percentile)
Greece
Portug
al
Belgium
New Zea
land
France
Denmark
United
Kingdo
mPola
nd
Austra
lia
OECD aver
age
Sweden
Canad
a
United
States
Switzerl
and
Finlan
d
German
yJa
panKor
ea
16
3W O M E N A N D M E N I N O E C D C O U N T R I E S Labour market3W O M E N A N D M E N I N O E C D C O U N T R I E S Labour market
Employment
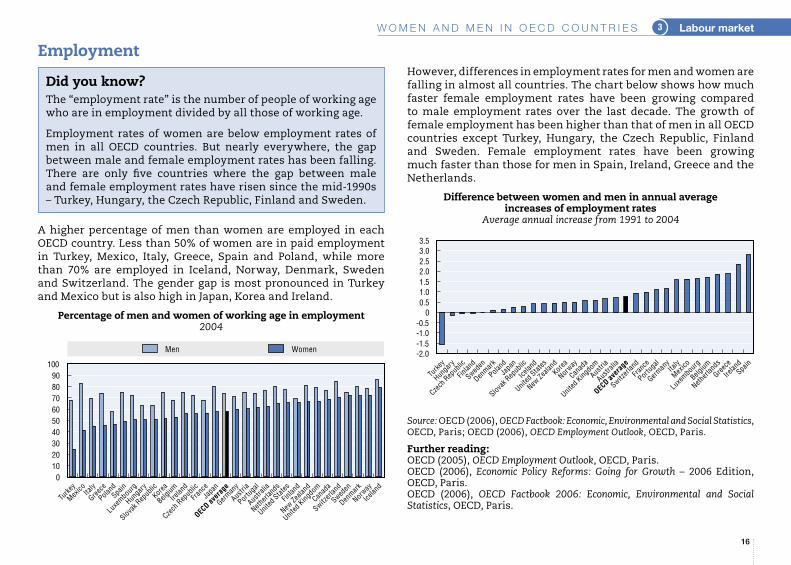
A higher percentage of men than women are employed in each OECD country. Less than 50% of women are in paid employment in Turkey, Mexico, Italy, Greece, Spain and Poland, while more than 70% are employed in Iceland, Norway, Denmark, Sweden and Switzerland. The gender gap is most pronounced in Turkey and Mexico but is also high in Japan, Korea and Ireland.
Percentage of men and women of working age in employment2004
Did you know?The “employment rate” is the number of people of working age who are in employment divided by all those of working age.
Employment rates of women are below employment rates of men in all OECD countries. But nearly everywhere, the gap between male and female employment rates has been falling. There are only five countries where the gap between male and female employment rates have risen since the mid-1990s – Turkey, Hungary, the Czech Republic, Finland and Sweden.
However, differences in employment rates for men and women are falling in almost all countries. The chart below shows how much faster female employment rates have been growing compared to male employment rates over the last decade. The growth of female employment has been higher than that of men in all OECD countries except Turkey, Hungary, the Czech Republic, Finland and Sweden. Female employment rates have been growing much faster than those for men in Spain, Ireland, Greece and the Netherlands.
Difference between women and men in annual average increases of employment rates
Average annual increase from 1991 to 2004
0102030405060708090
100
Men Women
Turke
y
Mexico Ita
ly
Greece
Poland
Spain
Luxe
mbourg
Hunga
ry
Slovak
Rep
ublicKor
ea
BelgiumIre
land
Czech
Rep
ublic
Franc
eJa
pan
OECD aver
age
German
y
Austri
a
Portug
al
Australi
a
Netherl
ands
United
States
Finlan
d
New Zea
land
United
Kingdo
m
Canad
a
Switzerl
and
Sweden
Denmark
Norway
Icelan
d
Source: OECD (2006), OECD Factbook: Economic, Environmental and Social Statistics, OECD, Paris; OECD (2006), OECD Employment Outlook, OECD, Paris.
Further reading: OECD (2005), OECD Employment Outlook, OECD, Paris. OECD (2006), Economic Policy Reforms: Going for Growth – 2006 Edition, OECD, Paris.OECD (2006), OECD Factbook 2006: Economic, Environmental and Social Statistics, OECD, Paris.
-2.0-1.5-1.0-0.5
00.51.01.52.02.53.03.5
Turke
y
Hunga
ry
Czech
Rep
ublic
Finlan
d
Sweden
Denmark
PolandJa
pan
Slovak
Rep
ublic
Icelan
d
United
States
New Zea
landKor
ea
Norway
Canad
a
United
Kingdo
m
Austria
Australi
a
OECD aver
age
Switzerl
and
Franc
e
Portug
al
German
yIta
ly
Mexico
Luxe
mbour
g
Belgium
Netherl
ands
Greece
Irelan
dSpain

17
3W O M E N A N D M E N I N O E C D C O U N T R I E S Labour market
Unemployment
Compared to men, women have a higher risk of being unemployed in most OECD countries. Twenty-seven countries are shown in the chart and the female unemployment rate is higher than that for men in 20 of them. The gender gap in favour of men is particularly large in Greece, Spain, and Italy. On the other hand, women are somewhat less likely than men to be unemployed in Korea, Norway, Ireland, Japan and the United Kingdom.
Unemployment as a percentage of the male and female labour forces (2004)
Did you know?For statisticians, the “labour force” is everybody who is either working or is “unemployed”. The “unemployed” are people who are actively looking for work but who have not found more than one hour of paid work in the last week. The unemployment rate is the number of unemployed as a percentage of the labour force. The female unemployment rate is the number of unemployed women as a percentage of the female labour force.Poland has the highest with nearly 20% of the female labour force out of work in 2004; the Slovak Republic was second with just over 19%.
Have unemployment rates been falling or rising for women over the past decade? The chart below compares female unemployment rates in 1994 and 2004. Countries that fall on the diagonal line have exactly the same female unemployment rates in both years. If they are below the diagonal, the 2004 rate is higher than the 1994 rate. Fifteen of the 27 countries lie above the diagonal meaning that in most countries female unemployment rates have fallen over the decade.
Female unemployment rates in 1994 and 2004
0
5
10
15
20
25
Men Women
Korea
Norway
Irelan
d
United
Kingdo
mJa
pan
New Zea
land
Netherl
ands
Switzerl
and
Austria
United
States
Australi
a
Denmark
Hunga
ry
Sweden
Luxe
mbourg
Canad
a
OECD aver
age
Portug
al
Finlan
d
Belgium
Czech
Rep
ublic
Franc
e
German
yIta
lySpa
in
Greece
Slovak
Rep
ublic
Poland
Source: Quarterly Labour Force Statistics and Annual Labour Force Statistics; OECD (2006), OECD Factbook: Economic, Environmental and Social Statistics, OECD, Paris.
Further reading: OECD (2005), OECD Employment Outlook, OECD, Paris. OECD (2006), Economic Policy Reforms: Going for Growth – 2006 Edition, OECD, Paris.OECD (2006), OECD Factbook 2006: Economic, Environmental and Social Statistics, OECD, Paris.
0
5
10
15
20
25
30
0 5 10 15 20 25 30
1994
OECD
USAGBR
CHE
SWE
ESP
SVK
PRT
POL
NOR
NZLNLD
LUXKORJPN
ITAIRLHUN
GRC
DEU
FRAFIN
DNK CZE
CAN
BEL
AUT
AUS
2004 or latest year available

18
3W O M E N A N D M E N I N O E C D C O U N T R I E S Labour market3W O M E N A N D M E N I N O E C D C O U N T R I E S Labour market
Self-employment
Self-employment may be seen either as a survival strategy for those who cannot find any other means of earning an income or as evidence of entrepreneurship and a desire to be one’s own boss.
Percentage of self-employed as a percentage of employed men and women
Excluding self-employed in agriculture, 2004 or latest years available
Did you know?According to the standard ILO definition any person who works for more than one hour per week is counted as being employed. As a result, self-employment rates are very high in countries where there are many small farms because virtually all family members will do at least an hour’s work on the farm.Ignoring self-employment in agriculture, Greece, Korea, Italy and Mexico have the highest rates of self-employment while Norway, France and the United States have the lowest.The self-employment rate for men is more than twice that of women in most OECD countries.
Excluding the agricultural sector, more men than women are self-employed in all OECD countries except Mexico. The gender gaps are particularly large in Turkey, Greece, Italy and Ireland and are smallest in Mexico, France and Canada.
In most OECD countries, self-employment rates have been falling since 1990: rates for women have declined somewhat faster than those for men.
Female self-employment outside of agriculture is negatively correlated with levels of economic development as measured by per capita GDP; the richer the country the lower the share of women in self-employment. The same result is also found for men.
Female self-employment and per capita GDP2004 or latest year available
0
5
10
15
20
25
30
35
Women Men
Norway
Franc
e
United
States
Canad
a
Denmark
AustriaJa
pan
Sweden
Finlan
d
German
y
Poland
Australi
a
Slovak
Rep
ublic
Hunga
ry
OECD aver
age
United
Kingdo
m
Icelan
dSpain
Irelan
d
Portug
al
New Zela
nd
Czech
Rep
ublic
Turke
y
Mexico Ita
lyKor
ea
Greece
Source: OECD (2005), Labour Force Statistics, OECD, Paris.
Further reading: OECD (2005), OECD Employment Outlook, OECD, Paris. OECD (2001), Women Entrepreneurs in SMEs: Realising the Benefits of Globalisation and the Knowledge-based Economy, OECD, Paris.
0
5 00010 000
15 000
20 00025 000
30 000
35 00040 000
45 000
0 2 4 6 8 10 12 14 16 18Self-employed women (excluding agriculture) as a percentage of all employed women
Per capita GDP
OECD average GRC
ITA
TUR
CZENZL
PRT
IRL
ESP
ISL GBR
HUN
AUS
POL
DEU
FIN
SWE
JPN
AUT
DNK
CAN
USA
FRA
NOR
y = -1206.8x + 36943R2 = 0.2499

19
3W O M E N A N D M E N I N O E C D C O U N T R I E S Labour market
Working hours
People who work for less than 30 hours per week in their main job are considered as part-time workers, although not all countries use this definition. Part-time work is particularly favoured by women in the Netherlands, Switzerland, the United Kingdom, Germany, Belgium and Ireland but is rare in central Europe, Turkey, Mexico and the United States. The only country in which part-time employment of men significantly exceeds 10% is the Netherlands.
Percentage of employed persons who work less than 20 hours per week (2002)
Did you know?More than one in four women work part-time and nearly three out of four part-time jobs are held by women. Part-time work by women increases when they live with a partner and increases still further if they have dependent children.Men tend to work longer hours than women in paid employment, but women work more hours in unpaid activities – housework and caring for children and elderly parents. Most OECD countries carry out “time-use” surveys to measure this unpaid employment, but these are not done regularly or on a comparable basis.
In most OECD countries the standard working week is around 40 hours but many people work longer. Working paid or unpaid long workweeks is a “man’s thing” in all OECD countries. In Iceland, Mexico and Turkey 60% or more of men report that they work more than 45 hours per week. High percentages of women also work more than 45 hours in Turkey and Mexico. On the other hand, workaholics of either gender are rare in Netherlands, Norway, Luxembourg, Austria and Sweden.
Percentage of employees who work more than 45 hours per weekYears around 2002
Source: OECD Employment and Labour Market Statistics.
Further reading: OECD (2005), OECD Employment Outlook, OECD, Paris. OECD (2006), Economic Policy Reforms: Going for Growth – 2006 Edition, OECD, Paris.OECD (2006), OECD Factbook 2006: Economic, Environmental and Social Statistics, OECD, Paris.0
10
20
30
40
50
60
70
Men Women
Slovak
Rep
.
Turke
y
Hunga
ry
Poland
Czech
Rep
.
Mexico
United
States
Portug
al
Japan
Greece
Canad
a
Finlan
dSpa
in
New Zea
land
OECD aver
age
Sweden
Denmark
Franc
e
Australi
aIta
ly
Austri
a
Luxe
mbourg
Norway
Icelan
d
Irelan
d
Belgium
German
y
United
Kingdo
m
Switzerl
and
Netherl
ands
0
10
20
30
40
50
60
70
80
Men Women
Netherl
ands
Norway
Luxe
mbourg
Austria
Switzerl
and
German
y
Canad
a
Belgium
Sweden
Finlan
d
Hunga
ry
France
Irelan
d
Slovak
Rep
ublic
Czech
Rep
ublic
Denmark
Spain
Portug
al
United
States
OECD aver
age
Poland
United
Kingdo
mIta
ly
Australi
a
New Zea
landJa
pan
Icelan
d
Greece
Mexico
Turke
y

20
3W O M E N A N D M E N I N O E C D C O U N T R I E S Labour market3W O M E N A N D M E N I N O E C D C O U N T R I E S Labour market
Occupations of men and women
Comparable information on occupations is available only for the European members of the OECD and the United States. In these countries, at least half of all working women are in eleven of the 110 occupations while half of the men work in more than twenty of them. This suggests that women tend to enter a more restricted range of professions than men. But it could also be partly a statistical illusion. It is possible that a gender bias may have inadvertently appeared due to a more detailed breakdown of the occupations that are typically chosen by men. Gender gaps – whether real or statistical – are particularly marked in the United States, Italy, Ireland, Greece and the United Kingdom.
Number of occupations that account for half of total employment2004 or latest year available
Did you know?Women tend to work in a much narrower range of occupations than men.The International Labour Organisation lists 110 major occupation groups in their classification of occupations (ISCO). In OECD countries for which information is available, half of all women work in eleven or fewer of these occupations.
The table below shows the top ten “gender-biased” occupations on average in Europe and the United States. In the first column, the numbers in brackets are the ratios of women to men in these occupations. For example, 14.5 times more women than men work as “pre-primary teaching associate professionals”. In the second column the genders are reversed so that, for example, there are just over 80 men working as “miners, shot-firers, stone cutters and carvers” for each woman in this occupation.
05
101520253035404550
Women Men
Denmark
Spain
Portug
al
United
Kingdo
m
Finlan
d
Poland
Slovak
Rep
ublic
Switzerl
and
German
y
Greece
Irelan
d
OECD aver
age
France
Hunga
ry
Netherl
ands
Norway
Sweden
Belgium Ita
ly
Czech
Rep
ublic
United
Stat
es
Concentration of employment in 20 OECD countries
Many more women than men work as: Many more men than women work as:
Pre-primary education teaching associate professionals (14.5 )
Miners, shot firers, stone cutters and carvers (80.2)
Nursing and midwifery professionals (10.1)
Building frame and related trades workers (64.8)
Secretaries and keyboard-operating clerks (9.8 )
Ships’ deck crews and related workers (52.9)
Nursing and midwifery associate professionals (9.5)
Building finishers and related trades workers (35.4)
Personal care and related workers (9.3) Mining and construction labourers (35.3)
Primary education teaching associate professionals (6.2)
Agricultural and other mobile plant operators (30.5)
Shop, stall and market salespersons and demonstrators (5.8)
Mining and mineral-processing-plant operators (24.5)
Special education teaching professionals (5.6)
Metal moulders, welders, sheet-metal workers, structural-metal preparers, and related trades workers (23.1)
Domestic and related helpers, cleaners and launderers (5.4) Machinery mechanics and fitters (21.7)
Primary and pre-primary education teaching (5.3)
Power-production and related plant operators (15.9)
Source: European Labour Force Survey and March Current Population Survey for the United States.
Further reading: OECD (2005), OECD Employment Outlook, OECD, Paris.

21
3W O M E N A N D M E N I N O E C D C O U N T R I E S Labour market
Immigrants and employment
In most OECD countries, finding a job is harder for immigrant women than for immigrant men and is harder for immigrant women than for native-born women.
The chart below shows the gender gaps for employment of foreign-born versus native born people. It shows, for example, that native-born Finnish women are almost as likely to be employed as native-born Finnish men, but foreign-born Finnish women are far less likely to work than foreign-born Finnish men.
Gender gap in employment of native-born and foreign-born adultsEmployment rates for men less employment rates for women (2004)
Did you know?Statisticians define employment as work for pay or profit of at least one hour in the last week.Like native-born women, immigrant women are less often employed than their male counterparts. But the difference between men and women is larger for immigrants. Immigrant women can be said to have a double “handicap” in the labour market: as immigrants, they have lower employment rates compared to non-immigrants and as women, lower employment rates compared to men.
This is a common pattern – in all except two countries unemployment among the foreign-born is higher than that of native-born people. The two exceptions are Spain and the Czech Republic.
Although immigrant women are not employed as often as immigrant men, differences in unemployment rates between immigrant men and women are small. Indeed, when the bars in the chart below fall below the zero-line, immigrant women are less likely to be unemployed than immigrant men. Ireland, Sweden, Germany and Norway are countries where this is the case. Overall, if native-born women find it harder than native-born men to find work, then it is generally also the case for foreign-born women compared to foreign-born men.
Gender gap in unemployment rates, native-born and foreign-bornUnemployment rate for women minus unemployment rate for men in 2004
0
5
10
15
20
25
30
35
40
Native-born Foreign-born
Sweden
Finlan
d
Norway
Denmark
Canad
a
United
States
German
y
France
United
Kingdo
mAustr
ia
Slovak
Rep
ublic
Hunga
ry
Portug
al
Switzerl
and
OECD aver
age
Netherl
ands
Belgium
Australi
a
Czech
Rep
ublic
Irelan
d
Luxe
mbourg
Italy
Spain
Greece
-4
-2
0
2
4
6
8
10
12
14
Native-born Foreign-born
United
States
Irelan
d
Sweden
United
Kingdo
m
German
y
Canad
a
Norway
Hunga
ry
Austri
a
Australi
a
Finlan
d
Switzerl
and
Denmark
Netherl
ands
OECD aver
age
Slovak
Rep
ublic
Portug
al
Belgium
Franc
e
Luxe
mbour
g
Czech
Rep
ublic Ita
lySpa
in
Greece
Source: OECD (2006), International Migration Outlook, OECD, Paris.
Further reading: OECD (2006), International Migration Outlook – 2006 Edition, OECD, Paris.

22
4W O M E N A N D M E N I N O E C D C O U N T R I E S Political and economic power4W O M E N A N D M E N I N O E C D C O U N T R I E S Political and economic power
Women in parliament
In nine OECD countries at least one-third of parliamentary seats are held by women. The Nordic countries and the Netherlands stand out with more than 35% of parliamentary seats held by women. In most OECD countries though, women hold under a quarter and the shares are 15% or less in Japan, Italy, France and the United States.
Percentage of parliamentary seats held by women2005 or latest year available
Did you know?Women are outnumbered by men in all the world’s parliaments.Women hold close to half the parliamentary seats in Rwanda and Sweden and about a third in the Nordic countries, in Cuba, Costa Rica and Argentina.There is no reliable relationship between how rich a country is, and how many women are in parliament.
On the other hand, there does seem to be a link between the percentage of women in employment and the percentage of parliamentary seats held by women. The chart below plots the percentage of women in parliament against the percentage of the total female population of working age (15-64) in employment. Women’s participation in political life appears to reflect, at least to some extent, their participation in economic life. Percentages of women in parliament are high in Nordic countries where women make up a large part of the labour market and low in Turkey, Greece, Italy and Hungary.
Percentage of women in parliament and percentage of women in employment
2004
05
101520253035404550
Turke
yJa
pan
Hunga
ryIta
ly
Franc
e
Greece
Irelan
dKor
ea
United
States
Slovak
Rep
ublic
Czech
Rep
ublic
United
Kingdo
mPola
nd
Canad
a
Portug
al
Luxe
mbourg
OECD aver
age
Mexico
Austra
lia
Switzerl
and
German
y
New Zea
land
Icelan
d
Austri
a
BelgiumSpa
in
Netherl
ands
Denmark
Finlan
d
Norway
Sweden
Do women participate more in political life in richer countries? Not necessarily. Percentages are low in rich countries like the United States, Ireland, France and Japan and are high in countries with lower per capita incomes such as New Zealand, Spain and Austria.
Source: Many countries have both a lower and upper house (bi-cameral parliaments) with different election rules for each one. For countries with bilateral parliaments the percentages shown here refer to the total of both houses. Inter-Parliamentary Union (IPU): www.ipu.org/wmn-e/classif.htm.
Further reading: Jütting, J. P., C. Morrisson; J. Dayton-Johnson; D. Drechsler (2006), “Measuring Gender (In)equality: Introducing the Gender, Institutions and Development Data Base (GID)”, OECD Development Centre Working Papers, No. 247, OECD, Paris.
0
10
20
30
40
50
60
70
80
90
0 5 10 15 20 25 30 35 40 45 50
y = 0.6336x + 43.028 R2 = 0.3573
Percentage of women in parliament
Percentage of women in employment
OECD average
TUR
JPN
HUN
ITA
FRA
GRC
IRLKOR
USA
SVK
CZE
GBR
POL
CANPRT
LUX
MEX
AUS
CHE
DEU
NZL
ISL
AUT
BEL
ESP
NLD
DNK
FIN
NORSWE

4W O M E N A N D M E N I N O E C D C O U N T R I E S Political and economic power
23
Managerial and professional posts
There are huge differences in the percentage of employees who are “managers” across countries, reflecting differences in how different workers see themselves in different countries. Nevertheless, there is a gender gap in managerial posts in all countries. The gender gap is particularly high in the United Kingdom, Norway, Finland, the Netherlands and Denmark. Gaps are much smaller in eastern Europe.
Percentage of employees in managerial posts2004 or latest year available
Did you know?In all OECD countries for which data are available, higher percentages of men work as managers or directors compared to women.On the other hand, a greater percentage of women who work do so in occupations for which a professional qualification is required than men. However, because more men work than women, this does not mean that there are more professional women than men.
Professional posts are those for which a formal qualification is usually required. They include most occupations in the health care and education sectors and in services such as accountancy and the law. In about two-thirds of the countries shown in the chart below, the percentages of the female labour force in professional posts exceed the percentages for males, with the gender gap in favour of women particularly high in Belgium, Ireland, Greece and Poland. Part of the explanation is the preference among women to work in the health and education sectors.
Percentage of employees in professional posts2004 or latest year available
02468
101214161820
Women Men
Spain
Greece
Italy
Luxe
mbourg
Portug
al
German
y
Denmark
Sweden
Czech
Rep
ublic
Slovak
Rep
ublic
Poland
Netherl
ands
Finlan
d
OECD aver
age
Franc
e
Norway
Belgium
Hunga
ry
Icelan
d
Irelan
d
United
Kingdo
m
United
States
Source: European Labour Force Survey and March Current Population Survey for the United States.
Further reading: OECD (2002-2004), Babies and Bosses – Reconciling Work and Family Life, series, OECD, Paris.
0
5
10
15
20
25
30
Women Men
Norway
Italy
German
y
Czech
Rep
ublic
Franc
e
United
Kingdo
m
Portug
al
Denmark
Slovak
Rep
.
Icelan
d
OECD aver
age
Hunga
rySpain
Luxe
mbourg
Finlan
d
Netherl
ands
Sweden
Poland
United
States
Greece
Irelan
d
Belgium

24
5W O M E N A N D M E N I N O E C D C O U N T R I E S Social issues5W O M E N A N D M E N I N O E C D C O U N T R I E S Social issues
Life satisfaction
In over half of OECD countries, more than three-quarters of both men and women reported “above average” scores (7 to 10) for life satisfaction. However, the percentages were 50% or less in the four eastern European countries and in Korea and Japan.
Percentage of people who feel an above average level of satisfaction with their livesYears between 1999 and 2002
Did you know?The World Value Surveys ask respondents to rank their feelings of satisfaction with their lives on a scale from 1 to 10. The surveys now cover 80 countries and use standardised questionnaires. The latest wave of surveys took place between 1999 and 2002.Test your prejudices. In two of these countries – United Kingdom, Turkey, Norway and Korea – women are significantly more satisfied with their lives than men. Which were they?Answer. In Turkey and Korea, women report greater life satisfaction than men. Women report lower life satisfaction than men in the United Kingdom and Norway.
There is some correlation between life satisfaction and per capita income, though some people argue that the correlation becomes weaker when comparisons are limited to the richest countries.Over time, societies which get richer do not report greater life satisfaction.
In most countries more men than women reported feeling satisfied “above average” with their lives. The chart below shows the percentage of satisfied men minus the percentage of satisfied women. The “satisfaction gap” favours men in twenty countries. Do women tend to apply higher standards than men in assessing their life satisfaction? Or do cultural and economic factors conspire to create less satisfying lives for women in most OECD countries?
The satisfaction gapPercentage of satisfied men minus percentage of satisfied women
0102030405060708090
100
Men Women
Hunga
ry
Turke
y
Slovak
Rep
ublicKor
ea
PolandJa
pan
Greece
Portug
al
Franc
eSpa
in
Czech
Rep
ublic
Italy
United
Kingdo
m
OECD aver
age
Norway
New Zea
land
United
States
Sweden
Mexico
Austra
lia
Belgium
German
y
Luxe
mbour
g
Canad
a
Austri
a
Switzerl
and
Irelan
d
Denmark
Finlan
d
Icelan
d
Netherl
ands
Source: OECD (2005), Society at a Glance, OECD, Paris; EFILWIC (2003), Quality of Life in Europe: an illustrative report, European Foundation for the Improvement of Living and Working Conditions, Dublin; World Value Surveys.
Further reading: OECD (2005), Society at a Glance: OECD Social Indicators, OECD, Paris. OECD (2006), Economic Policy Reforms: Going for Growth – 2006 Edition, OECD, Paris.
-15
-10
-5
0
5
10
Turke
y
Australi
aKor
eaJa
pan
Finlan
d
Icelan
d
German
y
BelgiumSpa
in
Canad
a
New Zea
land
Czech
Rep
ublic
Hungary
Poland
Slovak
Rep
ublic
OECD aver
age
United
States
Mexico
Greece
Netherl
ands
Luxe
mbour
g
Sweden
Denmark
Irelan
d
Austria
Portug
al
France
Italy
Norway
Switzerl
and
United
Kingdo
m
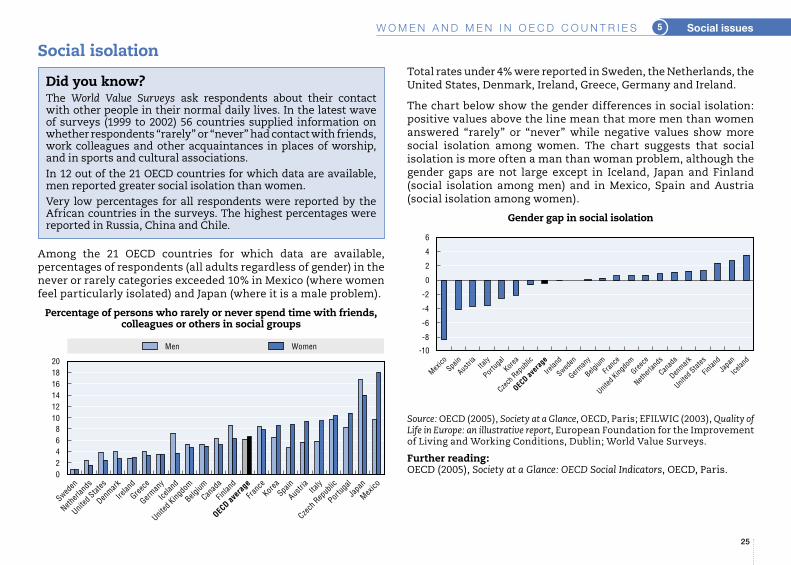
5W O M E N A N D M E N I N O E C D C O U N T R I E S Social issues
25
Social isolation
Among the 21 OECD countries for which data are available, percentages of respondents (all adults regardless of gender) in the never or rarely categories exceeded 10% in Mexico (where women feel particularly isolated) and Japan (where it is a male problem).
Percentage of persons who rarely or never spend time with friends, colleagues or others in social groups
Did you know?The World Value Surveys ask respondents about their contact with other people in their normal daily lives. In the latest wave of surveys (1999 to 2002) 56 countries supplied information on whether respondents “rarely” or “never” had contact with friends, work colleagues and other acquaintances in places of worship, and in sports and cultural associations. In 12 out of the 21 OECD countries for which data are available, men reported greater social isolation than women.Very low percentages for all respondents were reported by the African countries in the surveys. The highest percentages were reported in Russia, China and Chile.
Total rates under 4% were reported in Sweden, the Netherlands, the United States, Denmark, Ireland, Greece, Germany and Ireland.
The chart below show the gender differences in social isolation: positive values above the line mean that more men than women answered “rarely” or “never” while negative values show more social isolation among women. The chart suggests that social isolation is more often a man than woman problem, although the gender gaps are not large except in Iceland, Japan and Finland (social isolation among men) and in Mexico, Spain and Austria (social isolation among women).
Gender gap in social isolation
02468
101214161820
Men Women
Sweden
Netherl
ands
United
States
Denmark
Irelan
d
Greece
German
y
Icelan
d
United
Kingdo
m
Belgium
Canad
a
Finlan
d
OECD aver
age
Franc
eKor
eaSpain
Austria
Italy
Czech
Rep
ublic
Portug
al
Japan
Mexico
Source: OECD (2005), Society at a Glance, OECD, Paris; EFILWIC (2003), Quality of Life in Europe: an illustrative report, European Foundation for the Improvement of Living and Working Conditions, Dublin; World Value Surveys.
Further reading: OECD (2005), Society at a Glance: OECD Social Indicators, OECD, Paris.
-8
-10
-6
-4
-2
0
2
4
6
Mexico
Spain
Austria
Italy
Portug
alKor
ea
Czech
Rep
ublic
OECD aver
age
Irelan
d
Sweden
German
y
Belgium
Franc
e
United
Kingdo
mGree
ce
Netherl
ands
Canad
a
Denmark
United
States
Finlan
dJa
pan
Icelan
d

26
5W O M E N A N D M E N I N O E C D C O U N T R I E S Social issues5W O M E N A N D M E N I N O E C D C O U N T R I E S Social issues
Prison population
In all OECD countries except Portugal, Spain, the Netherlands and the United States less than 7% of prison populations are women. The commonest crimes for which women are convicted include prostitution, drug abuse and fraud. These offences are not punished by prison sentences in most countries although the high percentage of women in American prisons is partly explained by prison sentences for economic crimes such as cheque and credit card fraud.
Female prisoners as a percentage of total prison populationIncluding pre-trial and remand prisoners 2004 or latest year available
Did you know?The Prison Population Rate is the number of people (adults as well as those under 18) in prison per 100 000 population. In every country far more men are in prison than women but there are large differences between countries. For instance, there are the same number of female prisoners per 100 000 population in the United States as female and male prisoners combined in Japan.
Half of the OECD countries have less than 100 people in prison per 100 000 inhabitants. Thirteen have between 100 and 200. Two countries exceed this – Poland with 230 and the United States with more than 700. The US rate is the highest in the world followed by Russia with about 600 per 100 000 inhabitants. Except in the United States imprisonment rates for women are negligible.
Prisoners per 100 000 inhabitants Including pre-trial detainees and remand prisoners
2004 or latest year available
0123456789
10
Poland
Turke
y
Irelan
d
Franc
e
Belgium
Slovak
ia
Denmark
Czech
Rep
ublic
Italy
Luxe
mbourg
Canad
a
Mexico
German
y
Norway
SwedenKor
ea
Austri
a
Switzerl
and
OECD aver
age
Engla
nd & W
ales
Hunga
ry
GreeceJa
pan
Icelan
d
New Zea
land
Finlan
d
Austra
lia
Portug
alSpa
in
Netherl
ands
United
States
Source: International Centre for Prison Studies, King’s College, London, website: www.prisonstudies.org and then select World Prison Brief.
Further reading: OECD (2006), OECD Factbook 2006: Economic, Environmental and Social Statistics, OECD, Paris.OECD (2005), Society at a Glance: OECD Social Indicators, OECD, Paris.
0
50
100
150
200
250
Women Men
Icelan
d
Turke
y
Irelan
dJa
pan
Franc
e
Denmark
Portug
al
Belgium
Sweden
Norway
Switzerl
and
Finlan
d
German
yIta
ly
Greece
Canad
a
Austria
Netherl
andsKor
ea
Slovak
Rep
ublic
OECD aver
age
Engla
nd & W
ales
Mexico
Luxe
mbour
g
Australi
a
Czech
Rep
ublic
Hunga
rySpa
in
Poland
New Zea
land
United
States
724 total

6W O M E N A N D M E N I N O E C D C O U N T R I E S Health
27
Life expectancy at birth
For the OECD total, the life expectancy gender gap in favour of women is now just under six years; it is eight years or more in Hungary, the Slovak Republic and Poland and is lowest in the United Kingdom, Iceland and Sweden.
Why do women live longer than men? Differences in longevity can in part be explained by their different behavioural, lifestyle and working patterns. Women are also thought to have a possible genetic advantage which makes them more resistant to a range of conditions.
Life expectancy at birth (2004)
Did you know?Japan, Iceland, Spain and Switzerland have the highest life expectancies in the World – just over 80 years. Botswana, Malawi, Zimbabwe and Zambia have the lowest – all under 40 years. The lowest regions are all Sub-Sahara Africa at 47 years and the Indian sub-continent at 64 years.In virtually all countries life expectancies at birth are higher for women than for men. For the world as a whole female life expectancy is currently about 6% higher than for men.
Since 1960 life expectancies at birth have been rising in all countries. The chart below shows that the increase has been most marked in Korea, Turkey, Mexico, Japan and Portugal where life expectancies were low at the beginning of the period. In recent years men have been raising their life expectancies faster than women in most countries. This seems to be due to a reduction in “risk factor behaviour” by men – notably smoking and alcohol consumption – and an increase in these risk factors for women.
Average annual percentage growth in life expectancy1960-2004 or nearest years available
65
70
75
80
85
90
Men Women
Turke
y
Hunga
ry
Mexico
Slovak
Rep
ublic
Czech
Rep
ublic
Poland
Denmark
United
States
Portug
al
Irelan
d
United
Kingdo
mKor
ea
Luxe
mbourg
OECD aver
age
New Zea
land
German
y
Greece
Netherl
ands
BelgiumAustr
ia
Finlan
d
Norway
Canad
aIta
ly
Icelan
d
Sweden
Austra
lia
Switzerl
and
France
SpainJa
pan
Source: OECD (2005), Health at a Glance – OECD Indicators 2005, OECD, Paris; OECD (2006), OECD Health Data 2006, OECD, Paris; OECD Development Centre, Gender, Institutions, and Development database (GID), www.oecd.org/dev/institutions/GIDdatabase; Measures of Australia’s progress 2004, Australian Bureau of Statistics, 2004, p. 32.
Further reading: OECD (2004), The OECD Health Project: Towards High-Performing Health Systems, OECD, Paris.
00.10.20.30.40.50.60.70.80.91.0
Men Women
Slovak
Rep
.
Denmark
Czech
Rep
.
Netherl
ands
Canad
a
Norway
United
Kingdo
m
United
States
Hunga
ry
New Zea
land
Icelan
d
Sweden
BelgiumPola
nd
Luxe
mbour
g
Irelan
d
Australi
a
Switzerl
andIta
ly
German
y
Greece
Finlan
d
France
Austria
OECD aver
ageSpa
in
Portug
al
Japan
Mexico
Turke
yKor
ea

28
6W O M E N A N D M E N I N O E C D C O U N T R I E S Health6W O M E N A N D M E N I N O E C D C O U N T R I E S Health
Causes of death
Men are more prone to die from circulatory diseases than women in all OECD countries, once adjustments are made to reflect the differences in age structures. Mortality rates from circulatory diseases are particularly high in the Slovak Republic, Hungary, the Czech Republic and Poland and are lowest in Japan and France. Clearly, diet explains at least part of these differences.
Deaths from circulatory diseases Number of deaths, standardised for differences in age structures,
per 100 000 population (2003 or latest year available)
Did you know?For the population as a whole, the four main causes of death are circulatory diseases such as strokes and heart attacks, cancers, respiratory diseases such as bronchitis and emphysema, and external causes such as suicide, homicide and traffic accidents.At any given age, men are more likely to die from one of these conditions than are women. However, eventually these same sources of mortality are the reason why most women die as well – they are just more likely to strike women at an older age.
Cancer is the second leading cause of death in most OECD countries, accounting for between 25% and 30% of deaths among men and women. In all countries, mortality rates from cancer are higher among men than among women. The gender gap is particularly large in Spain, France, Korea and the Slovak Republic. Lung cancer still accounts for the greatest number of cancer deaths among men in all OECD countries (except Sweden and Iceland), while it is one of the main causes of cancer mortality among women. As the gap in tobacco consumption between men and women declines, so will differences in rates of lung cancer.
Some cancers of course affect one sex more than the other – breast cancer and prostate cancer. These diseases are very widespread. Fortunately, advances in screening and treatment mean many women and men now survive these cancers.
Deaths from cancerNumbers of deaths, standardised for differences in age structures,
per 100 000 population (2003 or latest year available)
0
100
200
300
400
500
600
700
Women Men
Japan
Franc
e
Canad
a
Switzerl
andSpa
in
Australi
a
Icelan
d
Netherl
ands
Norway
Korea
Italy
Sweden
Denmark
New Zea
land
Finlan
d
United
Kingdo
m
United
States
Luxe
mbour
g
OECD aver
age
Irelan
d
Portugal
Austria
German
y
Greece
Poland
Czech
Rep
ublic
Hunga
ry
Slovak
Rep
ublic
Source: OECD (2005), Health at a Glance – OECD Indicators 2005, OECD, Paris; OECD (2006), OECD Health Data 2006, OECD, Paris.
0
50
100
150
200
250
300
350
400
Women Men
Japan
SpainKor
ea
Portug
al
Greece
Finlan
d
Switzerl
and
Franc
eIta
ly
Austra
lia
Austria
German
y
Luxe
mbourg
Sweden
OECD aver
age
Norway
Slovak
Rep
ublic
United
States
Canad
a
Netherl
ands
Poland
New Zea
land
Icelan
d
Irelan
d
United
Kingdo
m
Czech
Rep
ublic
Hunga
ry
Denmark

6W O M E N A N D M E N I N O E C D C O U N T R I E S Health
29
Tobacco consumption
More men than women smoke in all OECD countries except Sweden. In 2004 (or the latest year available), the gender gap in smoking rates was particularly large in Korea, Turkey and Japan and, to a lesser extent, in Greece, Mexico and Poland.
Percentage of men and women reporting that they smoke daily2004 or latest year available
Did you know?The World Health Organisation estimates that over 15 billion cigarettes are smoked each day. One in three of these is smoked in China. The United States is the next biggest cigarette market followed by Japan, Russia and Indonesia.
Globally, far more men than women smoke although the gender gap is falling and cigarette advertising is increasingly aimed at women in Asia and other developing countries. In OECD countries, however, the most important change has been a decline in smoking by men. Women do also smoke less than previously, but the rate of decline has been much slower.
The proportion of daily smokers among adult women and men varies greatly across OECD countries. Sweden, Canada, Australia and the United States have the lowest overall percentage of daily smokers, with less than 18% of adults reporting smoking each day in 2004. Greece reported the highest rate of 39%.
Between 1980 and 2004, the percentage of smokers in the male populations of all OECD countries has declined. The same is true for women in most countries although in at least two – Finland and France – a greater proportion of women now smoke than in 1980.
For the 16 OECD countries for which unbroken time series are available from 1980, the decline in smoking by men has been more marked than for women so that the gender gap is narrowing. In 1980 the gap was 18% but had narrowed to 7% by 2004.
Long-term fall in tobacco consumption in 16 OECD countriesPercentage of men and women 15 years or older who report
that they smoke daily 1980-2004
0
10
20
30
40
50
60
70
Women Men
Sweden
Canad
a
Australi
a
United
States
Icelan
d
New Zea
land
Slovak
Rep
ublic
United
Kingdo
m
Norway
Finlan
d
Franc
e
Irelan
d
Denmark
German
y
Belgium
Luxe
mbour
g
Czech
Rep
ublic
Switzerl
and
OECD aver
age
Italy
Netherl
ands
Spain
Hunga
ry
Poland
Mexico
GreeceJa
pan
Turke
yKor
ea
Source: OECD (2005), Health at a Glance – OECD Indicators 2005, OECD, Paris; OECD (2006), OECD Health Data 2006, OECD, Paris.
World Health Organisation (2006), www.who.int/tobacco/en/atlas8.pdf
Further reading: OECD (2005), Health at a Glance: OECD Indicators 2005, OECD, Paris.
05
101520253035404550
1980 1982 1984 1986 1988 1990 1992 1994 1996 1998 2000 2002 2004
MenWomen

30
6W O M E N A N D M E N I N O E C D C O U N T R I E S Health6W O M E N A N D M E N I N O E C D C O U N T R I E S Health
Overweight and obese
More men than women are overweight in all OECD countries. In Austria, more than twice as many men are overweight as women, but there are also large gender gaps in Australia, Iceland, Italy and the Slovak Republic.
Percentage of adults considered overweight (Body Mass Index between 25 and 30kg/m²)
2004 or latest year available
Did you know?The standard test of being overweight is the Body Mass Index or BMI. It is calculated by dividing a person’s weight in kilograms by the square of their height in metres (kg/m²). According to the World Health Organisation guidelines, a BMI of 25 to 30 is considered “overweight” and more than 30 is considered “obese”. More men than women are overweight but obesity is pretty evenly distributed in all OECD countries. For most countries in the charts below, the statistics were obtained by “self assessment” surveys, but in Canada, New Zealand, Australia, the United Kingdom and the United States, actual measurements were made. The percentages for these five countries are among the highest in the OECD region. This is no coincidence.
Obese men are substantially more numerous than obese women in Greece whereas the reverse is true in the United States and Mexico. In other countries the gender gaps are small. The low percentages for both men and women in Korea and Japan are most likely associated with their traditional diets which are low in carbohydrates.
In most countries, data on weight and height are self-reported. Evidence suggests that both men and women underestimate their weight and/or overestimate their height, so leading to an underestimate of the true prevalence of overweight and obesity problems. For example, evidence from Canada is that 13.3% of women and 15.4% of men were obese in 2003 based on self-reported data, whereas when actual measures were used in 2004, 22.5% of women were obese as were 22.3% of men.
Percentage of adults considered obese (Body Mass Index exceeds 30kg/m²) 2004 or latest year available
0
10
20
30
40
50
60
Women Men
Japan
Franc
e
Austria
Switzerl
and
Belgium
Finlan
d
Denmark
Slovak
Rep
ublic
Irelan
d
SwedenIta
lyKor
ea
Poland
Luxe
mbourg
Norway
OECD aver
ageSpain
Icelan
d
United
States
Australi
a
New Zea
land
Turke
y
German
y
Canad
a
Hunga
ry
Netherl
ands
Greece
Czech
Rep
ublic
Portug
al
United
Kingdo
m
Mexico
Source: OECD (2005), Health at a Glance – OECD Indicators 2005, OECD, Paris; OECD (2006), OECD Health Data 2006, OECD, Paris.
Further reading: OECD (2005), Health at a Glance: OECD Indicators 2005, OECD, Paris.
0
5
10
15
20
25
30
35
Women Men
Korea
Japan
Switzerl
and
Norway
Ita
ly
Austri
a
Denmark
Franc
e
Sweden
Irelan
d
Netherl
ands
German
y
Poland
Icelan
d
Belgium
Spain
Portug
al
Finlan
d
Turke
y
OECD aver
age
Slovak
Rep
ublic
Czech
Rep
ublic
Luxe
mbourg
Hunga
ry
Greece
Australi
a
New Zea
land
Canad
a
United
Kingdo
m
Mexico
United
States

OECD PUBLICATIONS, 2 rue André-Pascal, 75775 PARIS CEDEX 16 PINTED IN FRANCE
(00 2006 3B 1 P) – No. 83841 2006
ORGANISATION FOR ECONOMIC CO-OPERATION AND DEVELOPMENT
www.oecd.org
Women and Men in OECD Countries Women and Men in OECD Countries Women and Men in OECD Countries Women and Men in OECD Countries Women and Men in OECD Countries Women and Men in OECD Countries Women and Men in OECD Countries Women and Men in OECD Countries Women and Men in OECD Countries Women and Men in OECD Countries Women and Men in OECD Countries Women and Men in OECD Countries Women and Men in OECD Countries Women and Men in OECD Countries Women and Men in OECD Countries Women and Men in OECD Countries Women and Men in OECD Countries Women and Men in OECD Countries Women and Men in OECD Countries Women and Men in OECD Countries Women and Men in OECD Countries Women and Men in OECD Countries Women and Men in OECD Countries Women and Men in OECD Countries Women and Men in OECD Countries Women and Men in OECD Countries Women and Men in OECD Countries Women and Men in OECD Countries Women and Men in OECD Countries Women and Men in OECD Countries Women and Men in OECD Countries Women and Men in OECD Countries Women and Men in OECD Countries Women and Men in OECD Countries Women and Men in OECD Countries Women and Men in OECD Countries Women and Men in OECD Countries Women and Men in OECD Countries Women and Men in OECD Countries Women and Men in OECD Countries Women and Men in OECD Countries Women and Men in OECD Countries Women and Men in OECD Countries Women and Men in OECD Countries Women and Men in OECD Countries Women and Men in OECD Countries Women and Men in OECD Countries Women and Men in OECD Countries Women and Men in OECD Countries Women and Men in OECD Countries Women and Men in OECD Countries Women and Men in OECD Countries Women and Men in OECD Countries Women and Men in OECD Countries Women
and Men in OECD Countries Women and Men in OECD Countries Women and Men in OECD Countries Women and Men in OECD Countries Women and Men in OECD Countries Women and Men in OECD Countries Women and Men in
Women and Men in OECD Countries Women and Men in OECD Countries Women and Men in OECD Countries Women and Men in OECD Countries Women and Men in OECD Countries Women and Men in OECD Countries Women and Men in OECD Countries Women and Men in OECD Countries Women and Men in OECD Countries Women and Men in OECD Countries Women and Men in OECD Countries Women and Men in OECD Countries Women and Men in OECD Countries Women and Men in OECD Countries Women and Men in OECD Countries Women and Men in OECD Countries Women and Men in OECD Countries Women and Men in OECD Countries Women and Men in OECD Countries Women and Men in OECD Countries Women and Men in OECD Countries Women and Men in OECD Countries Women and Men in OECD Countries Women and Men in OECD Countries Women and Men in OECD Countries Women and Men in OECD Countries Women and Men in OECD Countries Women and Men in OECD Countries Women and Men in OECD Countries Women and Men in OECD Countries Women and Men in OECD Countries Women and Men in OECD Countries Women and Men in OECD Countries Women and Men in OECD Countries Women and Men in OECD Countries Women and Men in OECD Countries Women and Men in OECD Countries Women and Men in OECD Countries Women and Men in OECD Countries Women and Men in OECD Countries Women and Men in OECD Countries Women and Men in OECD Countries Women and Men in OECD Countries Women and Men in OECD Countries Women and Men in OECD Countries Women and Men in OECD Countries Women and Men in OECD Countries Women and Men in OECD Countries Women and Men in OECD Countries Women and Men in OECD Countries Women and Men in OECD Countries Women and Men in OECD Countries Women and Men in OECD Countries Women and Men in OECD Countries Women and Men in OECD Countries Women and Men in OECD Countries Women and Men in OECD Countries Women and Men in OECD Countries Women and Men in OECD Countries Women and Men in OECD
Women and Men in OECD Countries Women and Men in OECD Countries Women and Men in OECD Countries Women and Men in OECD Countries Women and Men in OECD Countries Women and Men in OECD Countries Women and Men in OECD Countries Women and Men in OECD Countries Women and Men in OECD Countries Women and Men in OECD Countries Women and Men in OECD Countries Women and Men in OECD Countries Women and Men in OECD Countries Women and Men in OECD Countries Women and Men in OECD Countries Women and Men in OECD Countries Women and Men in OECD Countries Women and Men in OECD Countries Women and Men in OECD Countries Women and Men in OECD Countries Women and Men in OECD Countries Women and Men in OECD Countries Women and Men in OECD Countries Women and Men in OECD Countries Women and Men in OECD Countries Women and Men
Women and Men in OECD Countries Women and Men in OECD Countries Women and Men in OECD
and Men in OECD Countries Women and Men in OECD Countries Women and Men in OECD Countries Women and Men in OECD Countries Women and Men in OECD Countries Women and Men in OECD Countries Women and Men in OECD Countries Women and Men in OECD Countries Women and Men in
Women and Men in OECD Countries Women and Men in OECD Countries Women and Men in OECD Countries Women and Men in OECD Countries Women and Men in OECD Countries Women and Men in OECD Countries Women and Men in OECD Countries Women and Men in OECD Countries Women and Men in OECD Countries Women and Men in OECD Countries Women and Men in OECD Countries Women and Men in OECD Countries Women and Men in OECD Countries Women and Men in OECD Countries Women and Men in OECD Countries Women and Men in OECD Countries Women and Men in OECD Countries Women
and Men in OECD Countries Women and Men in OECD Countries Women and Men in OECD Countries
Women and Men in OECD Countries Women and Men in OECD Countries Women and Men in OECD
OECD Countries Women and Men in OECD Countries Women and Men in OECD Countries Women and Men in OECD Countries Women and Men in OECD Countries Women and Men in OECD Countries Women and Men in OECD Countries Women and Men in OECD Countries Women and Men in OECD Countries Women and Men in OECD Countries Women and Men in OECD Countries Women and Men in OECD Countries Women and Men in OECD Countries Women and Men in OECD Countries Women and Men in OECD Countries Women and Men in OECD Countries Women and Men in OECD Countries Women and Men in OECD Countries Women and Men in OECD Countries Women and Men in OECD Countries Women and Men in OECD Countries Women and Men in OECD Countries Women and Men in OECD Countries Women and Men in OECD Countries Women and Men in OECD Countries Women and Men in OECD Countries Women and Men in OECD Countries Women and Men in OECD Countries Women and Men in OECD Countries Women and Men in OECD Countries Women and Men in OECD Countries Women and Men in OECD Countries Women
and Men in OECD Countries Women and Men in OECD Countries Women and Men in OECD Countries Women and Men in OECD Countries Women and Men
OECD Countries Women and Men in OECD Countries Women and Men in OECD Countries Women and Men in OECD Countries Women and Men in OECD Countries Women and Men in OECD Countries Women and Men in OECD Countries Women and Men in OECD Countries Women and Men in OECD Countries Women and Men in OECD Countries Women and Men in OECD Countries Women and Men in OECD Countries Women and Men in OECD Countries Women and Men in OECD Countries Women and Men in OECD Countries Women and Men in OECD Countries Women and Men in OECD Countries Women and Men in OECD Countries Women and Men in OECD Countries Women and Men in OECD Countries Women and Men in OECD Countries Women and Men in OECD Countries Women and Men in OECD Countries Women and Men in OECD Countries Women and Men in OECD Countries Women and Men in OECD Countries Women and Men in OECD Countries Women and Men in OECD Countries Women and Men in OECD Countries Women
WOMEN AND MEN IN OECD COUNTRIES
Countries Women and Men in OECD Countries Women and Men in OECD Countries Women and Men in OECD Countries Women and Men in OECD Countries Women and Men in OECD Countries Women and Men in OECD Countries Women and Men in OECD Countries Women and Men in OECD Countries Women and Men in OECD Countries Women and Men in OECD Countries Women and Men in OECD Countries Women and Men in OECD Countries Women and Men in OECD Countries Women and Men in OECD Countries Women and Men in OECD Countries Women and Men in OECD Countries Women and Men in OECD Countries Women and Men in OECD Countries Women and Men in OECD Countries Women and Men in OECD Countries Women and Men in OECD Countries Women and Men in OECD Countries Women and Men in OECD Countries Women and Men in OECD Countries Women and Men in OECD Countries Women and Men in OECD Countries Women and Men in OECD Countries Women and Men in OECD Countries Women and Men in OECD Countries Women and Men in OECD Countries Women and Men in OECD Countries Women and Men in OECD Countries Women and Men in OECD Countries Women and Men in OECD Countries Women and Men in OECD Countries Women and Men in OECD Countries Women and Men in
Men in OECD Countries Women and Men in OECD Countries Women and Men in OECD Countries Women and Men in OECD Countries Women and Men in OECD Countries Women and Men in OECD Countries Women and Men in OECD Countries Women and Men in OECD Countries Women and Men in OECD Countries Women and Men in OECD Countries Women and Men in OECD Countries Women and Men in OECD Countries Women and Men in OECD Countries Women and Men in OECD Countries Women and Men
OECD Countries Women and Men in OECD Countries Women and Men in OECD Countries Women and Men in OECD Countries Women and Men in OECD Countries Women and Men in OECD Countries Women and
Men in OECD Countries Women and Men in OECD Countries Women and Men in OECD Countries Women and Men in OECD Countries Women and Men in OECD Countries Women and Men in OECD Countries
Countries Women and Men in OECD Countries Women and Men in OECD Countries Women and Men in
in OECD Countries Women and Men in OECD Countries Women and Men in OECD Countries Women and Men in OECD Countries Women and Men in OECD Countries Women and Men in OECD Countries Women and Men in OECD Countries Women and Men in OECD Countries Women and Men in OECD Countries Women and Men in OECD Countries Women and Men in OECD Countries Women and Men in OECD Countries Women and Men in OECD Countries Women and Men in OECD Countries Women and Men in OECD Countries Women and Men in OECD Countries Women and Men in OECD Countries Women and Men in OECD Countries Women and Men in OECD Countries Women and Men in OECD Countries Women and Men in OECD Countries Women and Men in OECD Countries Women and Men in OECD Countries Women and Men in OECD Countries Women and Men in OECD Countries Women and Men in OECD Countries Women and Men in OECD Countries Women and Men in OECD Countries Women and Men in OECD Countries Women
and Men in OECD Countries Women and Men in OECD Countries Women and Men in OECD Countries Women and Men in OECD Countries Women and Men
in OECD Countries Women and Men in OECD Countries Women and Men in OECD Countries Women and Men in OECD Countries Women and Men in OECD Countries Women and Men in OECD Countries Women and Men in OECD Countries Women and Men in OECD Countries Women and Men in OECD Countries Women and Men in OECD Countries Women and Men in OECD Countries Women and Men in OECD
in OECD Countries Women and Men in OECD Countries Women and Men in OECD Countries Women and Men in OECD Countries Women and Men in OECD Countries Women and Men in OECD Countries Women and Men in OECD Countries Women and Men in OECD Countries Women and Men in OECD Countries Women and Men in OECD Countries Women and Men in OECD Countries Women and Men in OECD Countries Women and Men in OECD Countries Women and Men in OECD Countries Women and Men in OECD Countries Women and Men in OECD Countries Women and Men in OECD Countries Women and Men in OECD Countries Women and Men in OECD Countries Women and Men in OECD Countries Women and