women and men in himachal pradeshadmis.hp.nic.in/himachal/economics/reports/manwomenhp2015_a1… ·...
TRANSCRIPT

1
WOMEN AND MEN
IN
HIMACHAL PRADESH
DEPARTMENT OF ECONOMICS AND STATISTICS GOVERNMENT OF HIMACHAL PRADESH, SHIMLA

2
PREFACE
Significant importance is being given to women empowerment and related issues. As such the need for sensitizing the data collection system toward the gender statistics has been felt deeply. In order to capture the social and structural changes in the economy and to meet out the needs of planners, policy makers, research scholars and others data users, the Department of Economics and Statistics has brought out the publication ‘Women & Men in Himachal Pradesh’ which presents a holistic view of the situation of women in Himachal Pradesh. It delineates the strides made and the challenges that persist in relation to the violence against women, economic and political empowerment, health, education etc. It is well know that women’s issues are complex, not easily recognized and often reflect conditions of grievous social evils. Furthermore, when one takes into account the multiple roles of women, one tends to ignore women’s non-domestic roles working double-shifts with their unpaid domestic work.
The department has endeavored to focus in this publication on such crucial statistical indicators of socio-economic relevance as are deemed best in portraying Gender inequality, gender bias and gender discrimination. In present publication, concerted efforts have been made to incorporate the latest available information on the various issues in this regard.
This publication has been brought out with the active cooperation of various departments in making available the statistical data presented in this publication. I am grateful to all of them for their cooperation. I hope the publication would be extremely useful to planners, policy makers, research workers and academicians. Suggestions for improvement in the in the publication will be highly appreciated.
(PRADEEP CHAUHAN)
Economic Adviser.
June, 2014.
INTRODUCTION 1.1 A BRIEF HISTORY OF GENDER STATISTICS:

3
The UN observed 1975 as International Women’s Year and held that
same year the first World Conference on Women in Mexico City. This World
Conference was the first international forum to recognize the importance of
producing statistics on women. Women’s machinery and women’s advocates were
the main forces behind the initial efforts in this area and focused prevalently on
making better use of existing data. Over the years, the compilation on existing
statistics and indicators necessary to address the demand of those concerned with
women’s issues revealed many data gaps and problems in data collection methods.
Subsequently, two other UN conferences on women were held: Copenhagen (1980)
and Nairobi (1985). By the time of the Third World Conference in Nairobi in 1985, the
international statistical system had initiated some work in this area, including training
programmes to strengthen the cooperation between policy makers and data
producers. After the conference in Nairobi, the general approach in development
strategy moved from “women in development” to “gender and development”. In
statistics, the focus likewise moved from “statistics on women”, to “statistics on women and men” and to the mainstreaming of gender issues into the overall
statistical system.
Internationally, efforts to develop guidelines and recommendations for
the production of statistics that take into consideration women and men’s different
roles in society were initiated by all relevant agencies. By the time of the Fourth
World Conference in Beijing in 1995, many national statistical offices had already
prepared user-friendly publications on statistics concerning women and men and had
shown considerable effort to improve data collection and adapt their concepts,
definitions, and methods to international standards.
The Beijing Conference on women in 1995 marked an important step in
the development of gender statistics. For the first time, an international instrument
comprehensively addressed the questions of producing and disseminating gender
statistics. Government agreed on a set of important actions to “generate and disseminate gender-disaggregated data and information for planning and evaluation” (platform for Action and Beijing Declaration, Strategic objective H.3,
United Nations 1996). International and national work on gender statistics gained
new momentum with the Beijing Conference, and over the last few years, many
countries ‘statistical offices have created gender statistics units and developed

4
specific programs for the mainstreaming of gender issues into the overall production
of official data. Examples of work done in countries show that national statisticians
have developed a good understanding of those gender issues that need to be
addressed and have begun to produce adequate statistical outputs. The increased
availability and dissemination of statistical outputs has in turn generated more
demand by users for data and for more refined statistics and indicators to inform and
monitor gender-related polices.
1.2 WHAT ARE GENDER STATISTICS?
The term gender statistics refers to two separate but related
dimensions of statistical data: disaggregation by sex for all individual-level statistics
to show the different roles and activities of women and men; and the specific
collection of statistics that relate to important gender issues. Depending on individual
country circumstances, these might include statistics on unpaid domestic work and
childcare, gender-based violence on women, trafficking in women, and /or migrant
workers. In the past, statistics offices and researches have presented only aggregate
labour forces data, for example, for the entire population. However, labour force
participation for women (defined as the proportion of the total population of women
aged 15-60 who are actually in the work force) is usually much lower than for men.
Similarly, the distribution of the male and female labour force by sector is usually
quite different. In many countries, a higher proportion of the female labour force is
employed in the services sector, while a higher proportion of the male labour is
employed in the industry, and particularly in heavy industries. There are also clear
differences by occupation, with some “feminized” occupations such as teaching or
nursing being dominated by women while others, such as engineering, tend to be
dominated by men. A consequence of the failure to recognize and routinely
distinguish the different patterns for women and men is that the situation of men
tends to be regarded as the norm or standard, and the different situation of women is
overlooked. Furthermore, policies and programmes may be based on stereotypes
that are significantly different from the empirical reality. For example, agricultural
programmes continue to assume that “farmers are men” even in the countries such
as Thailand and Vietnam where sex-disaggregated data show that a majority of

5
farmers in many rural areas are actually women. For these reasons, the early work
on gender statistics focused primarily on ensuring that individual-level data are
collected, tabulated, presented and analyzed by sex.
While sex disaggregation is important, it is not sufficient because
traditional statistical system have collected data on the issues that government
officials and development analysts-most of whom were men–considered to be
important. Issues that are important to women rather men were overlooked. As a
result, most developing countries do not collect data on issues such as domestic
violence or on unpaid household and domestic work and child care. Thus, later work
on gender statistics has also encouraged statistical agencies to collect of data on
gender issues and has provided technical support for the collection of data on
violence Against women and on Time use, which show how much time women and
men spend on paid work, unpaid household work, child care, recreation, commuting
etc. Gender statistics is a field of statistics that cuts across the traditional fields to
identify, produce and disseminate statistics that reflect the realities of the lives of
women and men policy issues relating to gender. Gender statistics allow for a
systematic study of gender differentials and gender issues.
A gender issues in any issue or concern determinate by gender (The
term gender refers to socially constructed differences between the sexes and to the
social relationships between women and men. These differences between the sexes
are shaped over the history of social relations and change over time and across
cultures. Gender identity depends on the circumstances in which women and men
live and include economic, cultural, historical, ideological, and religious factors.
Gender relations also vary according to the economic and social conditions of the
society and differ between social and ethnic groups) based and/ or sex (The term
sex refers to biological differences between women and men. Biological differences
are fixed and (mostly) unchangeable and vary little across cultures and over time
(the age of menarche for instance). Gender does not necessarily refer to differences
or concerns linked to biological characteristics of women and men, although gender-
based differences and sex-based differences are often interrelated. While sex-based
differences are unchangeable, gender-based differences and gender relations are
affected by policies, regulations, and (legislations, and can be changed) based

6
differences between women and men. Gender issues are all aspects and concerns
with how women and men interrelate, their differences in access to and use of
resources, their activities and how they react to changes, interventions and policies.
Gender issues exist in all spheres of society and are therefore relevant
to the production of statistics in all fields and intervene at every step of the
production process. Gender statistics are not necessarily and not only statistics
disaggregated by sex. Producing statistics that adequately reflect gender issues
imply that all statistics are produced taking into consideration the different socio-
economic realities women and men face in society. This means that all data - both
those on individuals as well as those not directly related to individuals - are collected,
compiled, and analyses, taking into consideration that gender-based factors
influence women and men differently - this can be called the gender - mainstreaming
of statistics.
The impact on women and men needs to be considered in every step
of statistical production and in all statistical fields. Concepts and methods used in
data collection need to be adequately formulated to ensure that they reflect existing
gender concerns and differentials. Additionally, social and cultural factors must be
taken into consideration as they can result in gender-based biases in data collection,
analytics, and presentation.
1.3 IMPORTANCE OF GENDER STATISTICS:
As noted above, failure to disaggregate statistics by sex meant that the
differences between women and men were largely overlooked in the design and
implementation of development policies, plans and programmes. In particular,
women’s specific needs tended to be neglected. Thus, gender statistics were
essential in order to assist policy makers and planners and development projects
and programmes to identify and meet women’s needs equally with those of men.
(a) Statistics and indicators on the situation of women and men are needed
to formulate and monitor policies and plans to monitor changes to inform the public

7
(b) Statistical information on the situation of women and men in all spheres of
society is an important tool in promoting equality and in monitoring progress
towards full equality.
(c) Gender statistics can help eliminate gender-based stereotypes by
providing evidence on the actual situation of women and men.
(d) Gender statistics provide an impartial and comparable basis for evaluating
progress towards the internationally agreed goals to improve the situation of
women.
(e) Gender statistics are a valuable tool for gender advocates, policy makers,
and others working on gender related issues. The importance of statistics
was further strengthened at the fourth World Conference on women (Beijing
1995) in setting the generation and dissemination of gender-disaggregated
data and information as strategic objectives for planning and evaluation.
IMPORTANT CONSTITUTIONAL AND LEGAL PROVISIONS FOR WOMEN IN INDIA
The principle of gender equality is enshrined in the India Constitution in
its Preamble, Fundamental Rights, Fundamental Duties and Directive Principles. The
Constitution not only grants equality to women, but also empowers the State to adopt
measures of positive discrimination in favour of women. Within the framework of a
democratic policy, our laws, development policies, Plans and programmes have
aimed at women’s advancement in different spheres. India has also ratified various
international conventions and human rights instruments committing to secure equal
rights of women. Key among them is the ratification of the Convention on Elimination
of All Forms of Discrimination Against Women (CEDAW) in 1993.
2.1 CONSTITUTIONAL PROVISIONS:
8
The Constitution of India not only grants equality to women but also
empowers the State to adopt measures of positive discrimination in favour of women
for neutralizing the cumulative socio economic, education and political
disadvantages faced by them. Fundamental Rights, among others, ensure equality
before the low and equal protection of low; prohibits discrimination against any
citizen on grounds of religion, race, caste, sex or place of birth, and guarantee
equality of opportunity to all citizens in matters relating to employment. Articles 14,
15, 15(3), 16, 39(a), 39(b), 39(c) and 42 of the Constitution are of specific
importance is this regard.
2.1.1 Constitutional Privileges: i. Equality before law for women (Article 14) ii. The State not to discriminate against any citizen on grounds only of religion,
race, caste, sex, place of birth or any of them (Article 15 (i)) iii. The state to make any special provision in favour of women and children
(Article 15 (3)) iv. Equality of opportunity for all citizens in matters relating to employment or
appointment to any office under the state (Article 16) v. The State to direct its policy towards securing for men and women equally the
right to an adequate means of live hood (Article 39(a)); and equal pay for
equal work for both men and women (Article 39(d)) vi. To promote justice, on a basis of equal opportunity and to provide free legal
aid by suitable legislation or scheme or in any other way to ensure that
opportunities for securing justice are not denied to any citizen by reason of
economic or other disabilities (Article 39A) vii. The State to make provision for securing just and humane conditions of work
and for maternity relief (Article 42) viii. The State to promote with special care the educational and economic
interests of the weaker sections of the people and to protect them from social
injustice and all forms of exploitation (Article 46) ix. The state to raise the level of nutrition and the standard of living of its people
(Article 47)

9
x. To promote harmony and the spirit of common brotherhood amongst all the
people of India and to renounce practices derogatory to the dignity of women
(Article 51 (A)) xi. Not less than one-third (including the number of seats reserved for women
belonging to the scheduled castes and the Scheduled Tribes) of the total
number of seats to be filled by direct election in every Panchayat to be
reserved for women and such seats to be allotted by rotation to different
constituencies in a Panchayat (Article 243 D(3)) xii. Not less than one-third of the total number of offices of Chairpersons in the
Panchayat at each level to be reserved for women (Article 243 D (4)) xiii. Not less than one-third (including the number of seats reserved for women
belonging to the Scheduled Casts and the Scheduled Tribes) of the total
number of seats to be filled by direct election in every Municipality to be
reserved for women and such seats to be allotted by rotation to different
constituencies in Municipality (Article 243 T(3)) xiv. Reservation of offices of Chairpersons in Municipalities for the Scheduled
Castes, the Scheduled Tribes and women in such manner as the legislature
of a State may by law provide (Article 243 T(4))
2.2 LEGAL PROVISIONS:
To uphold the Constitutional mandate, the State has enacted various
legislative measure intended to ensure equal rights, to counter social discrimination
and various forms of violence and atrocities and to provide support services
especially to working women.
Although women may be victims of any of the crimes such as ‘Murder’,
Robbery’, ‘Cheating’, etc., the crimes, which are directed specifically against women,
are characterized as ‘Crime against women’. These are broadly classified under two
categories.
2.2.1 The Crimes Identified Under the Indian Penal Code: (IPC) (a) Rape (Sec.376 IPC) (b) Kidnapping & Abduction for different purpose (Sec.363-373)

10
(c) Homicide for Dowry, Dowry Deaths or their attempts
(Sec.302/304-B IPC)
(d) Torture, both mental and physical (Sec.498-A IPC)
(e) Molestation (Sec.354 IPC)
(f) Sexual Harassment (Sec.509 IPC)
(g) Importation of girls (up to 21 Years of age)
2.2.2 The Crimes identified under the Special Laws: (SLL)
Although all laws are not gender specific, the provisions of low affecting
women significantly have been reviewed periodically and amendments carried out to
keep pace with the emerging requirements. Some acts which have special
provisions to safeguard women and their interests are:
a. The Employees State Insurance Act, 1948
b. The Plantation Labour Act, 1951
c. The Family Courts Act,1954
d. The Special Marriage Act, 1954
e. The Hindu Marriage Act,1955
f. The Hindu Succession Act, 1956 with amendment in 2005
g. Immoral Traffic (Prevention) Act, 1956
h. The Maternity Benefit Act, 1961 (Amended in 1995)
i. Dowry Prohibition Act, 1961
j. The Medical Termination of Pregnancy Act, 1971
k. The Contract Labour (Regulation and Abolition) Act, 1976
l. The Equal Remuneration Act, 1976
m. The Prohibition of Child Marriage Act, 2006
n. The Criminal Law (Amendment) Act, 1983
o. The Factories (Amendment) Act 1986
p. Indecent Representation of women (Prohibition) Act,1986
q. Commission of Sati (Prevention) Act,1987
r. The Protection of women from Domestic Violence Act,2005
2.3 SPECIAL INITIATIVES FOR WOMEN:

11
i. National Commission for women: In January 1992, the Government set-up this statutory body with a specific
mandate to study and monitor all matters relating to the constitutional and
legal safeguards provided for women review the existing legislation to suggest
amendments wherever necessary, etc.
ii. Reservation for women in Local Self-Government: The 73rd Constitutional Amendment Acts Passed in 1992 by Parliament
ensure one-third of the total seats for women in all elected offices in local
bodies whether in rural areas or urban areas.
iii. The National plan of Action for the Girl Child: (1991-2000) The plan of Action is to ensure survival, protection and development of the girl
child with the ultimate objective of building up a better future for the girl child.
iv. National Policy for the Empowerment of Women, 2001: The department of Women & Child Development in the Ministry of Human
Resource Development has prepared a “National Policy for the Empowerment of Women” in the year 2001. The goal of this policy is to
bring about the advancement, development and empowerment of women.
v. Hindu Succession (Amendment) Act, 2005:
The Hindu succession (Amendment) Act is to remove gender discriminatory
provision in the Hindu Succession Act, 1956 and gives the following rights to
daughters under Section 6:
(a) The daughter of coparcener shall by birth become a coparcener in her
own right in the same manner as the son;
(b) The daughter has the same rights in the coparcenary property as she
would have had if she had been son;
(c) The daughters shall be subject to the same liability in the said
coparcenary property as that of son; and any reference to a Hindu
Mitakshara coparcener shall be deemed to include a reference to a
daughter of a coparcener;
(d) The daughter is allotted the same share as is allotted to a son;
(e) The share of the Pre-deceased son or a pre-deceased daughter shall
be allotted to the surviving child of such pre-deceased son or of such
pre-deceased daughter;

12
(f) The share of the pre-deceased child of pre-deceased son or of a pre-
deceased daughter shall be allotted to the child of such pre-deceased
child of the pre-deceased son or pre-deceased daughter.
vi. The Protection of women from domestic Violence Act, 2005: This is an Act to provide for more effective protection of the rights of women
guaranteed under the Constitution who are victims of violence of any kind
occurring within the family and for matter connected therewith or incidental
thereto.
HIMACHAL PRADESH STATE GOVERNMENT INITIATIVES FOR GENDER EMPOWERMENT
Government of Himachal Pradesh also initiated Programmes/schemes
for gender empowerment these programmes - schemes appended below:
3.1 Mukhya Mantri Kanyadan Yojna:
Under this scheme, marriage grant of `25,000 is given to the
parents/guardians of the girls or to the girl herself to solemnize her marriage
provided their annual income does not exceed `20,000.
3.2 Window/Destitute/Single Woman Pension Scheme:
Pension @ ` 500 per month are provided to the following:
i. Widows;
ii. Destitute Women (Legally separated from husband);
iii. Single women above 45 year of i.e women (above 45 years of age) whose
individual annual income does not exceed ` 9000 or their family income
does not exceed `15,000
3.3 Widow Re-Marriage Scheme:

13
The State Government is implementing Widow Re-Marriage Scheme
for rehabilitation of young widows by increasing them to enter into wedlock. Under
this scheme and amount of `50,000 is provided as a grant for the couple.
3.4 Mother Teressa Asahay Matri Sambal Yojana:
Under this scheme `3,000 per child per annum given to the destitute
women belonging to the BPL families or having income less than `18,000 for the
maintenance of their children till they attain the age of 18 years. The assistance will
be provided only for two children.
3.5 Matri Seva Yojna: Under this scheme free institutional deliveries of expectant mothers,
irrespective of their income are being done in all Government hospitals in the State.
3.6 Self-Employment Scheme for Women:
Under this scheme `2,500 provided to the women whose annual
income is less than ` 7,500 for carrying income generating activities.
3.7 State Homes: For destitute women and wayward girls/women State Home is being
run at Mashobra (Shimla) by the department. The inmates of this home are provided
free education, clothes, boarding and lodging facilities. Besides, training in various
vocation trades is also imparted to them. For rehabilitation of such women, after
leaving State Home, financial Assistance of `10,000 per women is also provided.
3.8 State Level Council for Empowerment of women: State Level Council for Empowerment of women has been set up in the
State for effective implementation and monitoring of National Policy for
Empowerment of women.
3.9 Women Development Corporation: Women Development Corporation has been set up in the State. This
corporation helps needy women to avail loan from banks for setting up self-
employment ventures on low rate of interest.
3.10 State Commission for Women: State women Commission has been set up in the State for redressal of
grievance of women and to make them aware about their legal rights. This

14
commission is providing counseling services and legal aid to women. The
Commission also looks into the complaints of violence and atrocities against women.
3.11 Beti Hai Anmol: With a view to change negative family and community attitudes towards
the girl child at birth and towards her mothers and to improve enrollment and
retention of girls (2 girls only) are belonging to the BPL families. Under the Scheme
post birth grant of `10,000 and scholarships ranging from `300 to `1,500 is provided
from class 1 to class 10+2. 3.12 Kishori Shakti Yojna:
This scheme is implemented to improve the nutritional and health
status of girls in the age group of 11-18 years, to provide the required literacy and
numeracy skills through non-formal education to train and equip the adolescent girls
to improve/ upgrade home-based and vocational skills and to promote awareness of
health, hygiene, nutrition and family welfare, home management/ child care and to
take all measure as to facilitate their marrying only after attaining the age of 18 years
and if possible, even later; The scheme is being implemented in 8 Districts (46
Projects).viz. Shimla, Sirmaur, Kinnaur, Mandi, Hamirpur, Bilaspur, Una and Lahaul
& Spiti.
3.13 Rajiv Gandhi Scheme for Empowerment of Adolescent Girls:
This scheme has been started in 4 districts viz Solan, Kullu, Chamba,
and Kangra in place of Kishori Shakti Yojna and also Nutritional Programme for
Adolescent Girls (NPAG) in Kangra District.
a. 11-14 years age – Out of school adolescent girls.
b. 15-18 years age – all AGs (school going plus out of school).
3.14 Indira Gandhi Matritava Sahyog Yojna: During the financial year 2010-11 Government of India has approved
the implemention of 100%Centrally Sponsored Scheme “India Gandhi Mattritava
Sahyog Yojna” on Pilot basis in Hamirpur District.Main objective of the Scheme is to
improve the health and nutrition status of pregnant and lactating women and infant
by promoting appropriate practice, care and service utilization during pregnancy,

15
delivery and lactation period.
3.15 Mata Shabri Mahila Sashaktikaran Yojna: This scheme has been benefitting women belonging to BPL families of
SC category. Under the scheme, 50 percent subsidy, subject to a maximum of
`1,300 is given to eligible women for purchase of gas connection. As per schematic
norms every year 75 SC BPL women will be benefited in each Vidhan Sabha
Constituency.
3.16 Vishesh Mahila Utthan Yojna: State Government has started “Vishesh Mahila Utthan Yojna” as
100% State Plan Scheme for training and rehabilitation of women in moral danger in
the State. There is a provision to provide stipend @ `3,000 per month per trainee
and test fee of ` 800 per trainee through the department of Women and Child
Development. Further, for those women who intend to start their own self
employment projects, a back ended subsidy is provided @ 20% of the project cost
subject to maximum of `10,000 per beneficiary, on loan arranged through HP Mahila
Vikas Nigam.
3.17 Financial Assistance and Support Services to Victims of Rape Scheme 2012:
The scheme aims to provide financial assistance and support services
such as counseling, medical aid, legal assistance, education and vocational training;
depending upon the needs of rape victims. An affected woman shall be entitled to
financial assistance and restorative support/ services adding up to a maximum
amount of `75,000. Additional assistance of `25,000 can also be given in special
cases. 3.18 Self Help Groups:
With a view to empower poor women, the state is forming Self Help
Groups of women through Anganwari workers. These SHGs are doing income
Generating activities. So far, 66,106 SHGs have been formed out of which 64,451
SHGs have been linked with banks.
3.19 Prevention of Sexual Harassment of Women at work Place: Mechanism has been created in the State by forming committees for
prevention of Sexual Harassment of women at work Places as per the direction of
the Hon’ble Supreme Court.

16
GENDER STATISTICS OF HIMACHAL PRADESH 4.1 Current Population of India:
India, with 1,21,05,69,573 crore people is the second most populous
country in the world, while China is on the top with over 1,35,00,44,605 crore people.
The figures show that India represents almost 17.31% of the world’s population,
which means one out of six people on this planet live in India. The female population
constitutes 48.46 per cent of the total population in India as per 2011 census.
4.2 Sex Ratio of India:
Sex Ratio is a term used to define number of females per 1000 males.
It’s a great source to find the equality of males and females in a society at a given
period of time. In India sex Ratio was okay till the time of independence, thereafter it
has declined regularly: According to Census of India 2011, India sex ratio has shown
some improvement in the last 20 years. It has gone up from 927 in 1991 census to
933 in 2001 and 943 in 2011 census of India.
Total Male Population in India 2011 62,31,21,843
Total female population in India 2011 58,74,47,730
Total Population in India 2011 1,21,05,69,573
Sex Ratio 943
17
4.3 Current Population of Himachal Pradesh:
The Current population of Himachal Pradesh is 68,64,602. The figures
show that Himachal Pradesh represents almost 0.57% of the India. Population and
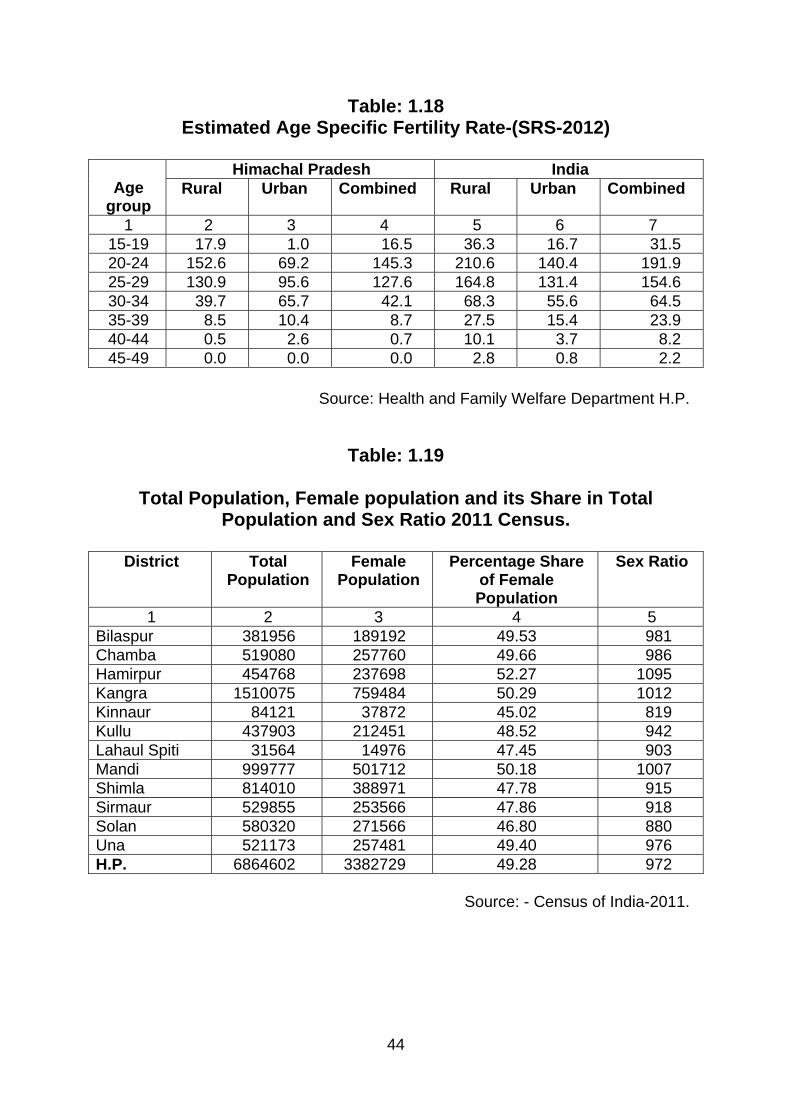
ranked 21st in India. The female population constitutes 49.28 per cent of the total
population in Himachal Pradesh as per 2011 census.
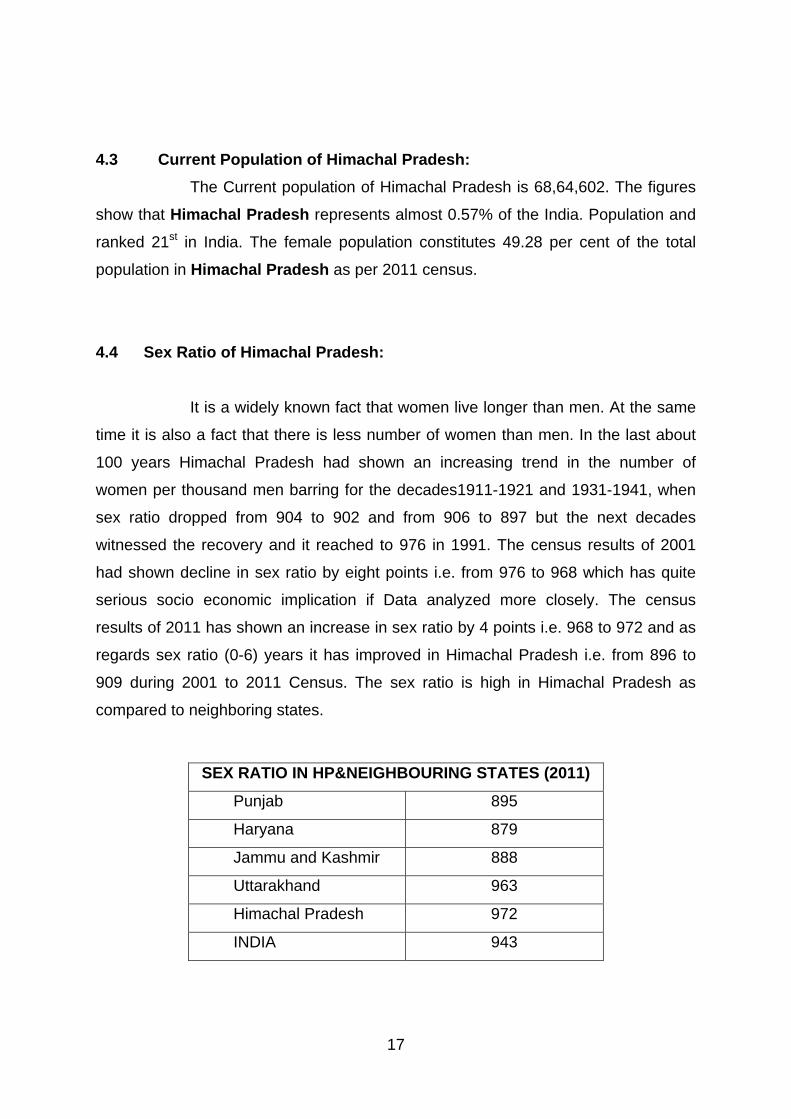
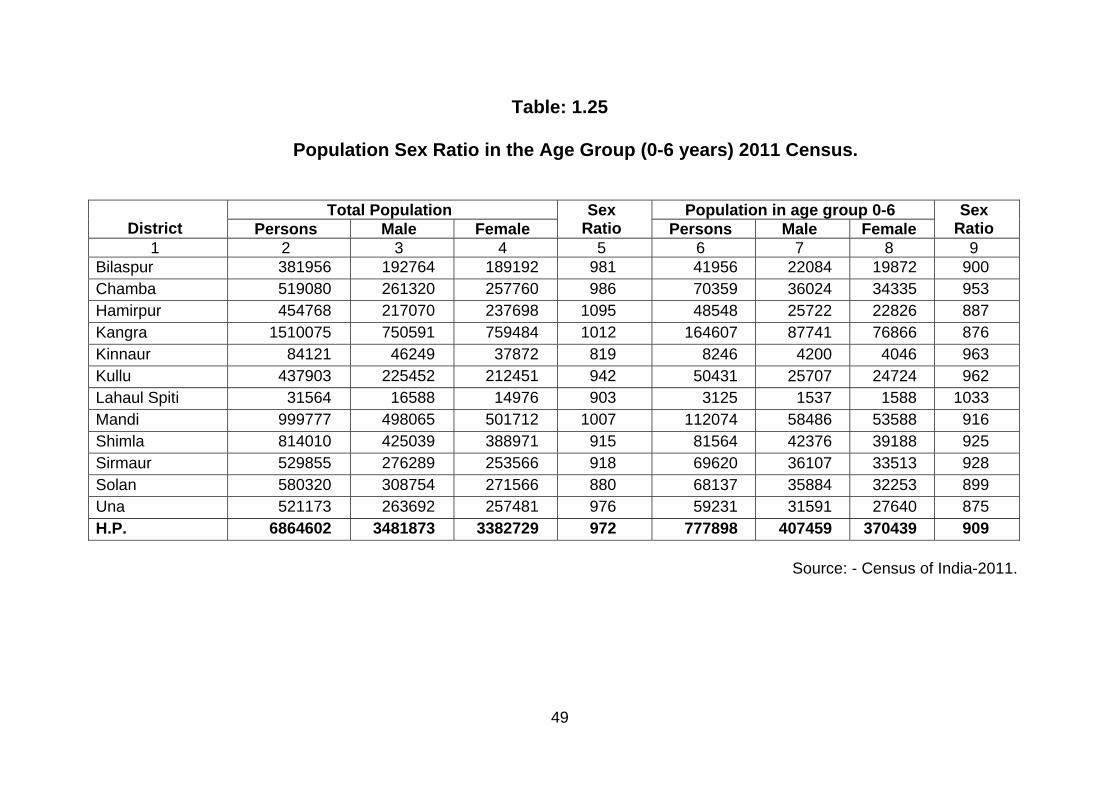
4.4 Sex Ratio of Himachal Pradesh:
It is a widely known fact that women live longer than men. At the same
time it is also a fact that there is less number of women than men. In the last about
100 years Himachal Pradesh had shown an increasing trend in the number of
women per thousand men barring for the decades1911-1921 and 1931-1941, when
sex ratio dropped from 904 to 902 and from 906 to 897 but the next decades
witnessed the recovery and it reached to 976 in 1991. The census results of 2001
had shown decline in sex ratio by eight points i.e. from 976 to 968 which has quite
serious socio economic implication if Data analyzed more closely. The census
results of 2011 has shown an increase in sex ratio by 4 points i.e. 968 to 972 and as
regards sex ratio (0-6) years it has improved in Himachal Pradesh i.e. from 896 to
909 during 2001 to 2011 Census. The sex ratio is high in Himachal Pradesh as
compared to neighboring states.
SEX RATIO IN HP&NEIGHBOURING STATES (2011)
Punjab 895
Haryana 879
Jammu and Kashmir 888
Uttarakhand 963
Himachal Pradesh 972
INDIA 943

18
The growth of female population (2.10%) was slightly higher than that
of the male population (2.06%) During the decade 1981-1991.but over the last
decade viz.1991-2001, the female population growth rate was 1.17 percent slightly
lower as compared to the 1.80 percent growth rate of the male population. During
the decade viz 2001-2011 the female population growth rate of male population.
895879 888
963 972
943
820840860880900920940960980
SEX RATIO
19
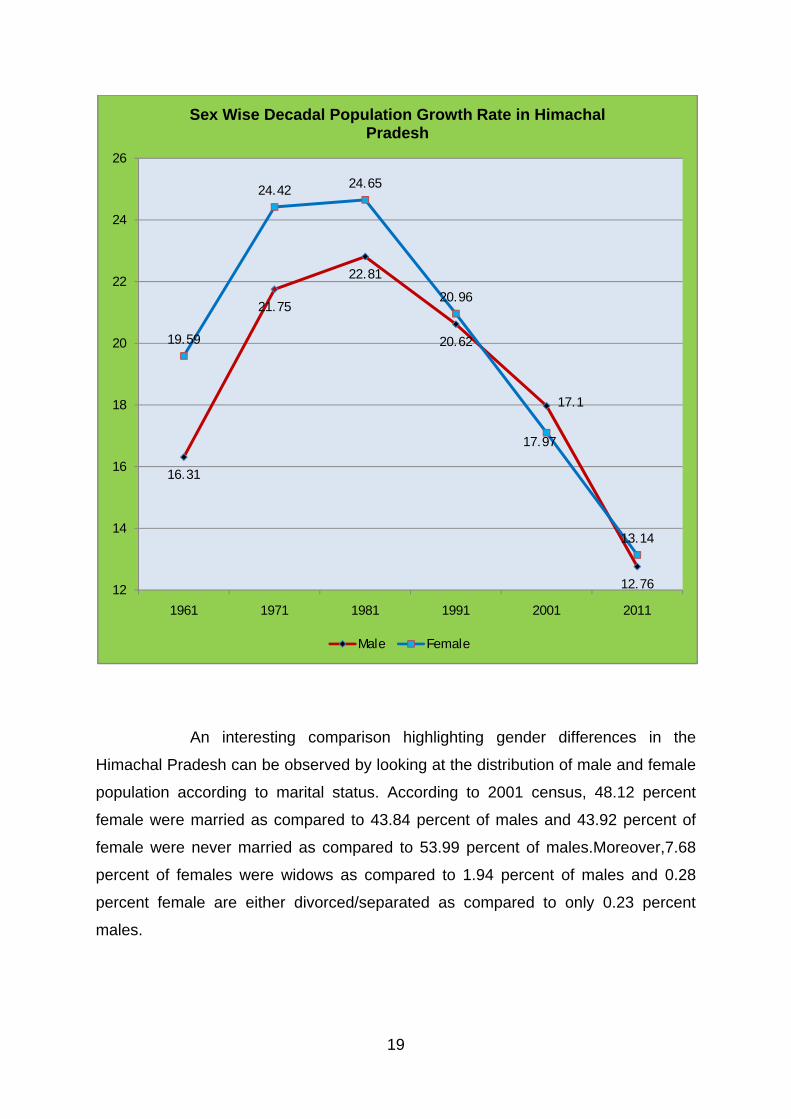
An interesting comparison highlighting gender differences in the
Himachal Pradesh can be observed by looking at the distribution of male and female
population according to marital status. According to 2001 census, 48.12 percent
female were married as compared to 43.84 percent of males and 43.92 percent of
female were never married as compared to 53.99 percent of males.Moreover,7.68
percent of females were widows as compared to 1.94 percent of males and 0.28
percent female are either divorced/separated as compared to only 0.23 percent
males.
16.31
21.75
22.81
20.62
17.97
12.76
19.59
24.42 24.65
20.96
17.1
13.14
12
14
16
18
20
22
24
26
1961 1971 1981 1991 2001 2011
Sex Wise Decadal Population Growth Rate in Himachal Pradesh
Male Female

20
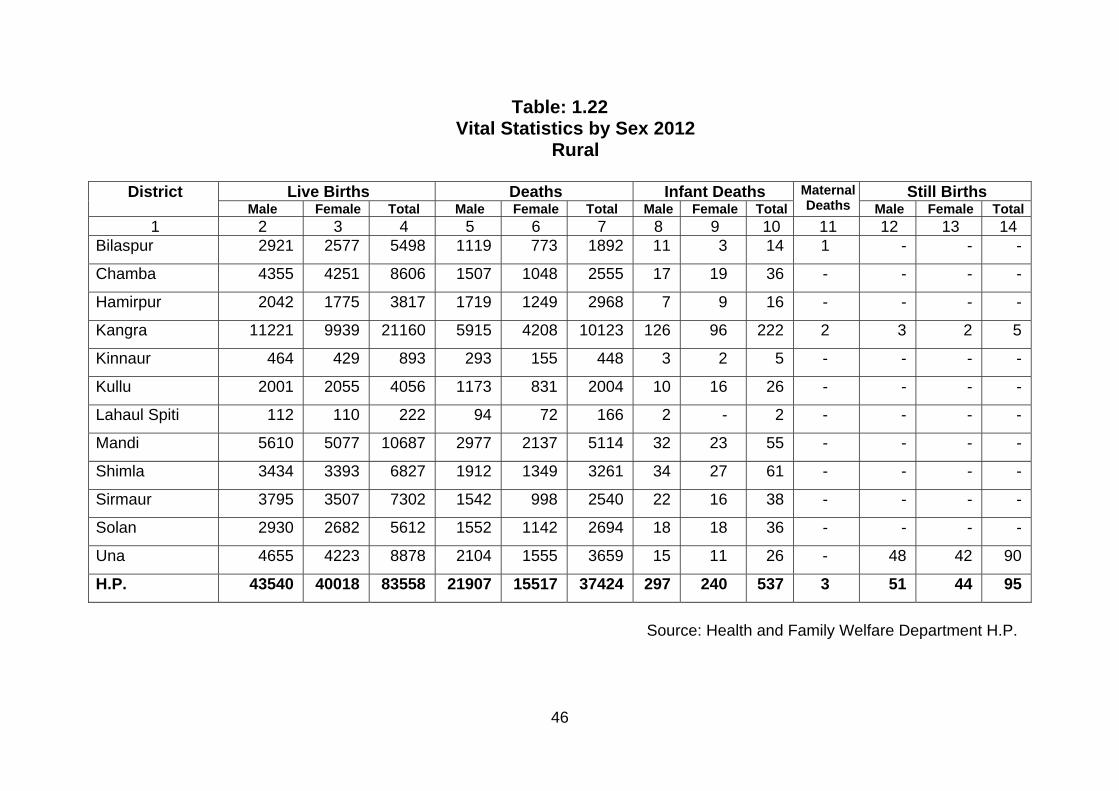
4.5 Vital Statistics:
With greater awareness about the family planning, increased
availability of the family planning methods and more freedom in its use, the age-
specific fertility rates have shown an increasing trend over years in all age-groups. In
2012, there were about 56.1 percent live births per 1000 women in the age group 15-
49 years (General Fertility Rate) as compared to about 57.3 live births per 1000
women in the same age group in 2011.The average number of children that a
women is expected to give birth to (Total Fertility Rate), during the entire child
bearing age-group, if she experiences the current fertility pattern throughout, has
been decreasing over the years. The total Fertility Rate for 2012 was 1.7.
48.12
43.92
7.68
43.84
53.99
1.94
0
10
20
30
40
50
60
Married Never Married Widowed
Perc
enta
ge
Martial Status
Percentage of Population according to Martial Status by Sex for Himachal Pradesh
Females Males

21
Age specific fertility rate in Himachal Pradesh have shown an
increasing trend over years in all age-groups. In 2012, there were about 145.3
percent live births per 100 women in the age group 20-24 years as compared to
about 127.6 live births per 1000 women in the 25-29 age groups.
4.6 Health Status:
Women and men have somewhat different kind of health risks
throughout their life span. Women were expected to a peculiar and major health risk
due to child bearing. Good health and family planning services are important for the
general well-being of the women, children and the entire family-giving women, in
72.567.5
61.7 62.3 60.6 59.3 57.3 56.1
2.2 2 1.9 1.9 1.9 1.8 1.8 1.70
102030405060708090
2005 2006 2007 2008 2009 2010 2011 2012
General Fertility & Total Fertility Rates in Himachal Pradesh
General Fertility Total Fertility
020406080
100120140160180200
15-19 20-24 25-29 30-34 35-39 40-44 45-49
Age Specific Fertlity Rate-2012
Himachal Pradesh India

22
particular, an opportunity to decide when and how many children do they want.
Reduced infant Mortality would give women better chance to have the desired size of
the family with few numbers of pregnancies. Discrimination against a female child is
evident from the fact that girls experience higher rate of mortality in younger age-
groups as compared to the boys. In 2012, the female infant mortality rate was
observed to be 38 as compared to male infant mortality rate of 35. Life expectancy at
birth has increased continuously over years. For the period 2006-10, the male life
expectancy at birth was 67.7 years as compared to 72.4 years for females.
Health of women is an important factor in determining the overall health
of the society. If pregnant women are not well nourished they are more likely to give
births to weaker babies leading to a higher infant mortality rate. It is also observed
that wherever the infant and child mortality is higher the birth rates are also higher.
Women are exposed to a high risk of death due to pregnancy.
66.3 66.5
67.767.1 67.3
72.4
63
64
65
66
67
68
69
70
71
72
73
2001-05 2002-06 2006-10
Gender wise Expectation of Life at Birth in Himachal Pradesh
Male Female

23
4.7 Planning the Family:
The provision of contraceptives information is fundamental to the ability
of women and man to make informed choices about reproductive health decisions.
The use of contraceptives and family Planning methods has been increasing
uniformly over the years. This would not only give better chances to women to
achieve the desired size of the family with the reduced number of pregnancies but
would also help her to ensure desired spacing of the consecutive pregnancies. This
would go a long way for the well-being of the mother as well as the entire family.
Female sterilization is the widely know family planning method followed
by male sterilization during 2009-10. It has been observed that three out of four
users rely on sterilization in Himachal Pradesh. Sterilization accounts for roughly
99% of all modern contraceptive methods used. Although reported by a negligible
minority, sterilization is the most common method used even among married women
and men. The reported use of traditional contraceptive methods and male/couple
dependent methods is negligible.
In the year 2013-14, Out of the total accepters of family planning
methods only 1.42 percent adopted vasectomy, 13.07 percent adopted tubectomy,
14.03 percent adopted IUD insertion, 57.54 per cent were CC users and 13.93 per
30
35
40
45
50
55
60
2005 2006 2007 2008 2009 2010 2011 2012
Infant Mortality Rates by Sex in H.P.
Total Males Females

cent ad
4.8
or state
due to
the sta
per cen
(Male 8
been s
4.9
Prades
Out of
margin
worker
men, t
indicate
Perc
enta
ge
dopted ora
EducationLite
e. The liter
the decrea
ate Govern
nt in 1951
89.53 perc
shown in th
ParticipatAcc
sh was 35.
total wom
nal workers
rs, 29.58 p
there were
es the wide
0102030405060708090
100
g
al pills as fa
nal Achieveracy is ver
racy rate in
ase in pop
ment. Lite
(male 7.5
cent and F
his graph:
tion of wocording to
59 lakh of
en worker
s. Similarl
ercent wer
e 55.18 &
e differenc
Dist
amily plann
vements:ry importan
ncrease eit
pulation. Sp
racy rates
5 percent a
Female 75.
men and census, 2
f which 15.
s, 41.13 p
ly out of
re margina
& 41.31 p
ce in the pa
trict wis
Person
24
ning metho
nt indicato
ther due to
pecial atten
in the stat
and female
.93 per ce
Men in the2011 the
16 lakh we
ercent wer
total men
al workers.
percent no
articipation
se Lite
ns Male
ods.
r of develo
o the increa
ntion is be
te have ris
e 2 percent
nt) Distric
e Economtotal work
ere women
re main wo
workers,
Out of tota
on-workers
n of women
eracy R
Female
opment of
ase in num
ing laid to
sen drastic
t) to 82.80
ct wise Lite
my: ker popula
n and 20.4
orkers, 58.
70.42 pe
al populati
s respectiv
n and men
Rates
particular
mber of liter
these asp
cally from o
0 percent in
eracy Rate
ation In Hi
43 lakh wer
.87 per ce
ercent wer
on of wom
vely. This
in the eco
country
rates or
pects by
only 4.8
n 2011.
es have
machal
re men.
nt were
re main
men and
clearly
onomy.
25
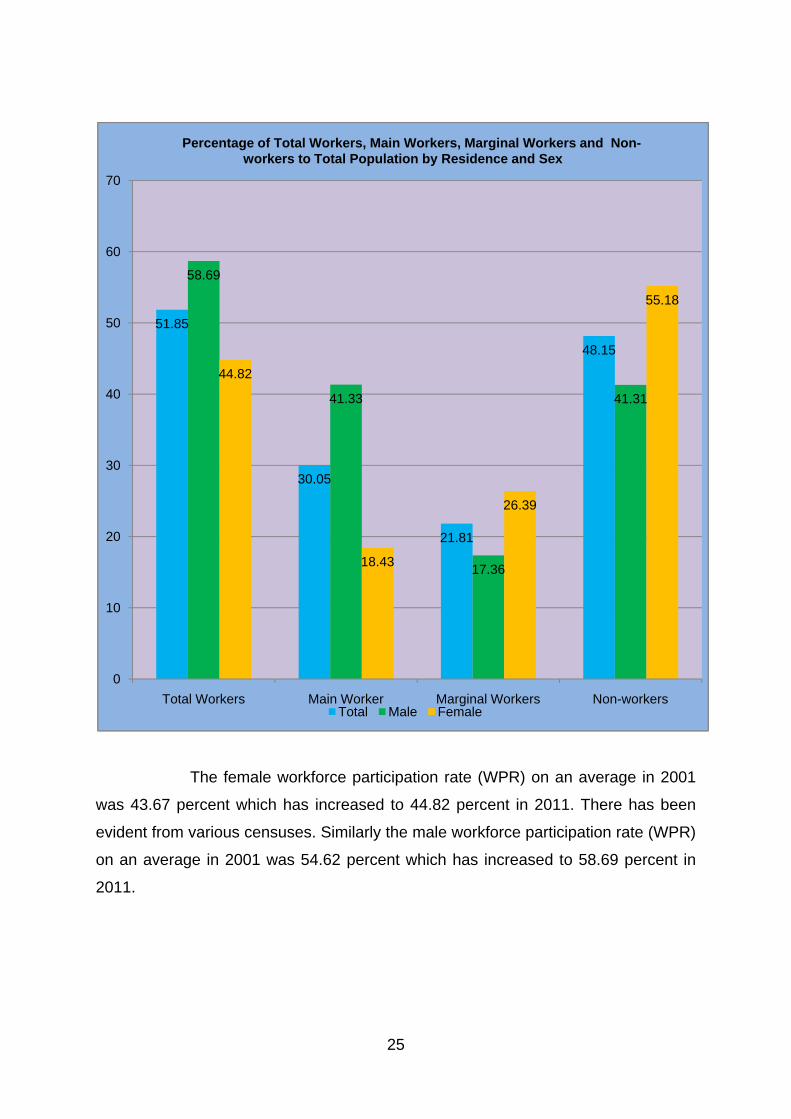
The female workforce participation rate (WPR) on an average in 2001
was 43.67 percent which has increased to 44.82 percent in 2011. There has been
evident from various censuses. Similarly the male workforce participation rate (WPR)
on an average in 2001 was 54.62 percent which has increased to 58.69 percent in
2011.
51.85
30.05
21.81
48.15
58.69
41.33
17.36
41.31
44.82
18.43
26.39
55.18
0
10
20
30
40
50
60
70
Total Workers Main Worker Marginal Workers Non-workers
Percentage of Total Workers, Main Workers, Marginal Workers and Non-workers to Total Population by Residence and Sex
Total Male Female

26
In respect of women employment in the government services it reveals
from the census of Himachal Pradesh Government employees-2012-13 that only
21.2 percent of total government employees were women. However, this share of
women government employees during 2013 has moderately improved from 20.4
percent in 2012.
43.67 44.82
54.6258.69
-
20.00
40.00
60.00
80.00
100.00
120.00
2001 2011
Male & Female work Participation Rate in Himachal Pradesh
Female Male

4.10
Wome
presen
percen
Suprem
women
Ministe
female
high Co
empow
under-r
in the
represe
Women aDec
n is under
nt women
nt of Rajya
me courts.
n cabinet
ers. There
e judges ar
ourt there
Wo
werment. In
represente
state leg
entatives.
18
18.5
19
19.5
20
20.5
21
20
2
nd Decisicision mak
r-represent
occupy le
a seats an
. As on M
ministers,
are only
re there in
is no wom
men’s po
n the politi
ed. At pres
gislative as
AS
006 2007
20.4
19.6
Percen
on Makingking is the
ted in the
ess than 1
nd less tha
May 2011,
out of 37
44 wome
Supreme
an judge a
olitical pa
cal particip
sent in Him
ssembly is
SSEMBLY
7 2008
6 19.7
ntage of FeGovern
27
g: foremost
governanc
12 percen
an 4 per c
out of 34
7 Ministers
n judges
Court of
as on1st Ap
articipation
pation and
machal Pra
s 3 only
Y
2009 20
19.51
emales Emnment Em
step to th
ce and de
nt of parlia
cent of sea
4 cabinet
s of States
out of 512
India out o
pril, 2011.
is an
decision m
desh the n
4.41 per
010 2011
19.7
20.1
mployees ployees
he ladder o
ecision ma
ament sea
ats in High
Ministers
s there ar
2 in the c
of 31. In H
important
making po
number of
cent to
W
2012
1
20.4
to Total
of empowe
king positi
ats, less t
h Courts a
there are
re only 4
country. O
Himachal P
input to
osition wom
woman me
the total
WOMEN
2013
21.2
erment.
ons. At
han 11
and the
only 2
women
nly two
Pradesh
o their
men are
embers
elected

28
TWELEWTH LEGISLATIVE ASSEMBLY- (2012-2017) 3
ELEVENTH LEGISLATIVE ASSEMBLY- (2007-2012) 5
TENTH LEGISLATIVE ASSEMBLY- (2003-2007) 4
NINTH LEGISLATIVE ASSEMBLY- (1998-2003) 7
EIGHTH LEGISLATIVE ASSEMBLY- (1993-1998) 4
SEVENTH LEGISLATIVE ASSEMBLY- (1990-1992) 4
SIXTH LEGISLATIVE ASSEMBLY- (1985-1990) 3
FIFTH LEGISLATIVE ASSEMBLY- (1982-1985) 3
FOURTH LEGISLATIVE ASSEMBLY- (1977-1982) 1
THIRD LEGISLATIVE ASSEMBLY- (1977-1982) 5
However, elected women representative in the Panchayati Raj
Institutions and urban local bodies have significantly increased due to good number
of women which have actively entered in Politics in Himachal Pradesh. With the
representation of seats a good number of women have been elected to Panchayati
Raj institutions in Himachal Pradesh for the term 2011-2016. In Himachal Pradesh
there are 3243 Gram Panchayats, out of which 1639(50.54 per cent) seats have
been occupied by women in 2011 Panchayat elections. Out of total seats occupied
by women, 987 (60.21 per cent) occupied by general women, 421,(25.68 per cent)
scheduled caste women, 104 (6.34 per cent) scheduled tribes women and 127 (7.74
per cent) occupied by OBC women.
Similarly, out to total 77 Chairman Panchayat Simities seats, 42 seats
(54, 55 percent) of the seats in this category have been occupied by women. Among
total seats occupied by women in Chairman Panchayat Simities category, 20 (48 per
cent) occupied by general women, 13(31 per cent) by scheduled caste women, 4 (9
per cent) by scheduled tribes women and 5 (12 per cent) occupied by OBC women.
Out of the total 12 seats chairpersons of Zila Parisad seats, 6 (50 per
cent) of the seats have been occupied by women in 2011 elections.
4.11 Social Obstacles in Women’s Empowerment:
Crimes against women is a universal phenomenon prevalent in every
society irrespective of the social or economic class to which the women belong crime

29
and Violence committed against women in the society is the prime obstacle for
women to go forward and achieve the goal of success in her life Gender violence is
the greatest manifestation of gender bias and gender inequality. It is difficult to
acquire accurate data on violence against women because of the social, cultural and
legal barriers, lack of evidences and amount of secrecy and sensitivity involved. The
crime against women in the year 2012-13 is 1523 in Himachal Pradesh.
CONTENTS
Introduction & Brief History: i-xxvii
TABLE NO.
TITLE PAGE NO.
1.1 Population and number of Literates and Literacy Rate - 2011 Census.
1
1145 11121024
1523
0
200
400
600
800
1000
1200
1400
1600
2010 2011 2012 2013
Crimes against women
H.P.

30
1.2 Rural-Urban/Male-Female Population of Himachal Pradesh. 2 1.3 District wise Rural-Urban/Male-Female Population - 2011 Census. 3 1.4 District-wise Male-Female Percentage of Population - 2011
Census. 4
1.5 Decadal Population Growth Rate. 4 1.6 Age-wise Distribution of Female Population - 2001 Census. 5 1.7 District-wise Females per Thousand Males. 5 1.8 District-wise Population of Females per Thousand Males in the
Age Group of 0-6 Years. 6
1.9 District-wise Population of Female Target Groups - 2001 Census. 6 1.10 Sex-wise Scheduled Castes Population- 2011 Census. 7 1.11 Sex-wise Scheduled Tribes Population- 2011 Census. 7 1.12 Marital Status by Age and Sex. 2001 Census. 8 1.13 Death by Age and Sex 2012. 9 1.14 Mean Age at Effective Marriage of Females by Residence-HP 9 1.15 Proportion of Married Females in Selected Age Groups - 2001
Census.
10 1.16 General Fertility Rates of H.P. and India. 11 1.17 Total Fertility Rates of H.P. and India. 12 1.18 Estimated Age Specific Fertility Rate. 13 1.19 Total Population, Female population and its Share in Total
Population and Sex Ratio 2011 Census.
13 1.20 Residence/Sex wise Births & Deaths in Himachal Pradesh during,
2012.
14 1.21 Sex Wise Registration of Births & Deaths. 14 1.22 Vital Statistics by Sex 2012 Rural. 15 1.23 Vital Statistics by Sex 2012 Urban. 16 1.24 Population Sex Ratio in the Age Group (0-6 years). 2001 & 2011
Census.
17 1.25 Population Sex Ratio in the Age Group (0-6 years) 2011 Census. 18 1.26 Age-wise Distribution of Population - 2001 Census. 19 1.27 Age-wise Distribution of Population - 2011 Census. 20 1.28 Infant Mortality Rates by Sex and Residence of Himachal
Pradesh,1994-2012.
21 1.29 Sex-Wise Infant Mortality Rates. 22 1.30 Death Rates by Sex and Residence of Himachal Pradesh, 1990-
2012.
23 1.31 Expectation of Life at Birth. 24 1.32 Family Planning Acceptors by Methods. 25
TABLE
NO. TITLE PAGE
NO. 1.33 Percentage of Couples Protected by Family Welfare Methods in
Himachal Pradesh. 26
1.34 Family Indicators by level of education of Women 2012. 27 1.35 Distribution of Total Workers by Sex - 2011 Census. 28 1.36 Percentage of Total Workers, Main Workers, Marginal Workers
and Non-workers to Total Population by Residence and Sex State

31
and District – 2011. 29 1.37 District-wise Female Work Participation Rate -2001 & 2011 Census 30 1.38 District-wise Male Work Participation Rate - 2001 & 2011 Census. 30 1.39 Employment in State Government. 31 1.40 Regular State Government Employees by Gazetted and Non-
Gazetted Status.
32 1.41 Employment by Activity and by type of Establishments. 33 1.42 Principal Characteristics of Establishments Agricultural. 34 1.43 Principal Characteristics of Establishments Non-Agricultural. 35 1.44 Number of Employment in Selected Characteristics of
Establishments.
36 1.45 Number of Employment in Selected Characteristics of
Establishments.
37 1.46 District wise Number & Percentage of Mandays Generated For
Women in Himachal Pradesh.
38 1.47 Progress of Literacy. 39 1.48 District-wise Literacy Rates. 40 1.49 Literacy Rates among the Scheduled Castes Population - 2011
Census.
41 1.50 Literacy Rates among the Scheduled Tribes Population - 2011
Census.
42 1.51 Enrolment in Various Schools in Himachal Pradesh. 43 1.52 Number of Teachers in Schools of Himachal Pradesh. 44 1.53 Number of Seats Reserved for Women Representatives in
Panchayats,Pradhan Gram Panchayat.
45 1.54 Number of Seats Reserved for Women Representatives in
Panchayats, Member Gram Panchayat.
46 1.55 Number of Seats Reserved for Women Representatives in
Panchayats, Chairman Panchayat Simiti.
47 1.56 Number of Seats Reserved for Women Representatives in
Panchayats, Member Panchayat Samities.
48 1.57 Number of Seats Reserved for Women Representatives in
Panchayats, Chairman Zila Parishad.
49 1.58 Number of Seats Reserved for Women Representatives in
Panchayats, Member Zila Parishad.
50 1.59 Number of Women Elected on Un-Reserved Seats in Gram
panchayats.
51 TABLE
NO. TITLE PAGE
NO. 1.60 Number of Women Elected on Un-Reserved Seats in Panchayat
Samities
52 1.61 Number of Women Elected on Un-Reserved Seats in Zila
Parishad.
53 1.62 Number of Electors and Percentage Voting in Various General
Election of the State.
54 1.63 Year-Wise Number of Different Crimes against Women in
Himachal Pradesh.
55

32
1.64 District-wise Number of Total Crimes against Women in Himachal Pradesh.
56
1.65 Year-wise Incidence of Cognizable Crime by Female in Himachal Pradesh
56
1.66 District wise/year wise Disposal of Total Cognizable Crimes by Courts under IPC in Himachal Pradesh.
57
1.67 Strength of Armed Police Force in Himachal Pradesh. 60 1.68 Strength of Un-Armed Police Forces in Himachal Pradesh. 61 1.69 Statement showing the cases Received by the Himachal Pradesh
State Women Commission.
62 1.70 Representation of Women in the Rajya Sabha. 63 1.71 Representation of Women in the Central Council of Ministers. 63 1.72 Number of Judges by Sex in Supreme Court/High Courts, as on
1st April, 2014.
64 1.73 Females Employees in Central Government in India. 65
Table: 1.1
Population and number of Literates and Literacy Rate - 2011 Census.
District Total Population Number of Literates
Persons Male Female Persons Male Female
1 2 3 4 5 6 7
Bilaspur 381956 192764 189192 287620 155599 132021
Chamba 519080 261320 257760 323842 186064 137778
Hamirpur 454768 217070 237698 358091 180555 177536
Kangra 1510075 750591 759484 1152640 606443 546197
Kinnaur 84121 46249 37872 60699 36697 24002
Kullu 437903 225452 212451 307672 174550 133122
Lahaul-Spiti 31564 16588 14976 21845 12897 8948
Mandi 999777 498065 501712 723747 393669 330078
Shimla 814010 425039 388971 612642 342846 269796
Sirmaur 529855 276289 253566 362645 205617 157028

33
Solan 580320 308754 271566 428578 244372 184206
Una 521173 263692 257481 399715 213281 186434
Himachal Pradesh 6864602 3481873 3382729 5039736 2752590 2287146
Source: - Census of India-2011.
Table: 1.2
Rural-Urban/Male-Female Population of Himachal Pradesh.
Year
Rural Urban Combined
Total Male Female
Sex Ratio
Total
Male
Female
Sex
Ratio
Total Male Female
Sex
Ratio
1 2 3 4 5 6 7 8 9 10 11 12 13
19
51
2232
154
1155
384
1076
770
93
2
153
827
924
42
613
85
66
4
2385
981
1247
826
1138
155
91
2
19
61
2634
188
1343
271
1290
917
96
1
178
275
108
063
702
12
60
6
2812
463
1451
334
1361
129
93
8
19
71
3218
544
1628
623
1589
921
97
6
241
890
138
334
103
556
74
9
3460
434
1766
957
1693
477
95
8
19
81
3954
847
1988
331
1966
516
98
9
325
971
181
600
144
371
79
5
4280
818
2169
931
2110
887
97
3
19
91
4721
681
2372
193
2349
488
99
0
449
196
245
274
203
922
83
1
5170
877
2617
467
2553
410
97
6
20
01
5482
319
2756
073
2726
246
98
9
595
581
331
867
263
714
79
5
6077
900
3087
940
2989
960
96
8
20
11
6176
050
3110
345
3065
705
98
6
688
552
371
528
317
024
85
3
6864
602
3481
873
3382
729
97
2

34
Table: 1.3
District wise Rural-Urban/Male-Female Population - 2011 Census.
District
Total Rural
Persons Male Female Persons Male Female
1 2 3 4 5 6 7
Bilaspur 381956 192764 189192 356827 179653 177174
Chamba 519080 261320 257760 482972 241963 241009
Hamirpur 454768 217070 237698 423338 200748 222590
Kangra 1510075 750591 759484 1423794 705365 718429
Kinnaur 84121 46249 37872 84121 46249 37872
Kullu 437903 225452 212451 396512 203269 193243
Lahaul-Spiti 31564 16588 14976 31564 16588 14976
Mandi 999777 498065 501712 937140 466050 471090
Shimla 814010 425039 388971 612659 314295 298364
Sirmaur 529855 276289 253566 472690 246175 226515
Solan 580320 308754 271566 478173 249736 228437
Una 521173 263692 257481 476260 240254 236006
Himachal Pradesh 6864602 3481873 3382729 6176050 3110345 3065705
Source: - Census of India-2011.
35
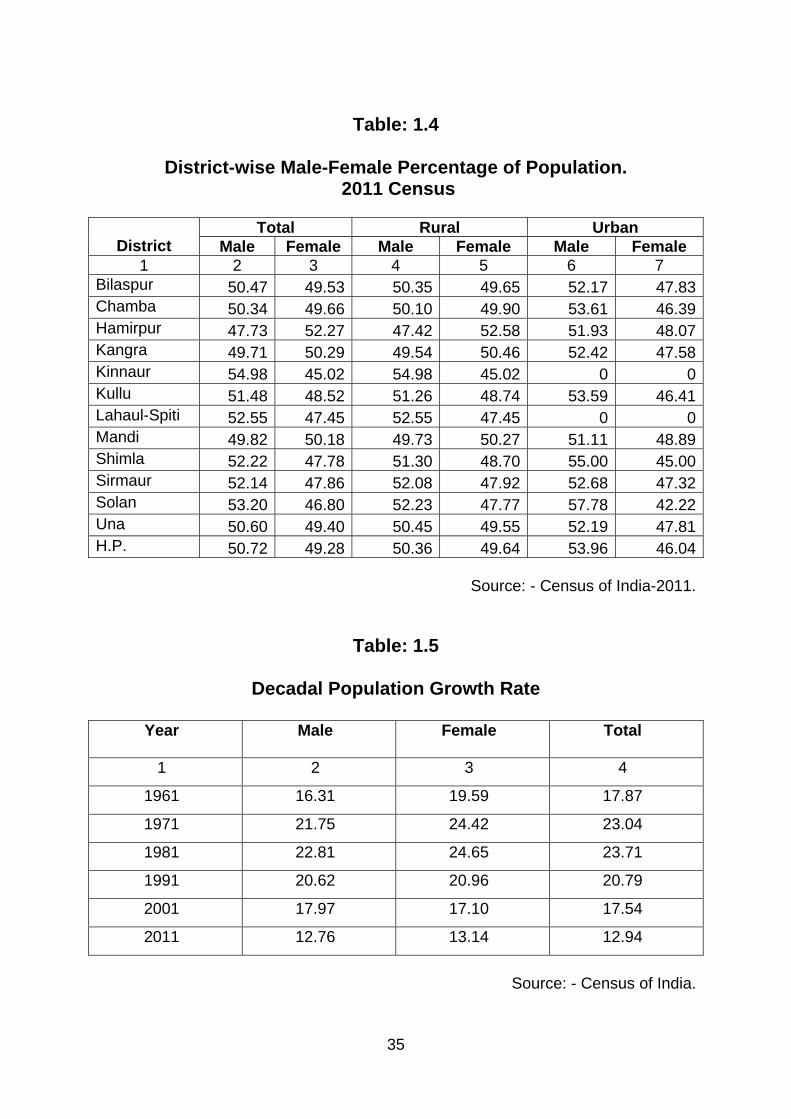
Table: 1.4
District-wise Male-Female Percentage of Population.
2011 Census
District
Total Rural Urban Male Female Male Female Male Female
1 2 3 4 5 6 7 Bilaspur 50.47 49.53 50.35 49.65 52.17 47.83Chamba 50.34 49.66 50.10 49.90 53.61 46.39Hamirpur 47.73 52.27 47.42 52.58 51.93 48.07Kangra 49.71 50.29 49.54 50.46 52.42 47.58Kinnaur 54.98 45.02 54.98 45.02 0 0Kullu 51.48 48.52 51.26 48.74 53.59 46.41Lahaul-Spiti 52.55 47.45 52.55 47.45 0 0Mandi 49.82 50.18 49.73 50.27 51.11 48.89Shimla 52.22 47.78 51.30 48.70 55.00 45.00Sirmaur 52.14 47.86 52.08 47.92 52.68 47.32Solan 53.20 46.80 52.23 47.77 57.78 42.22Una 50.60 49.40 50.45 49.55 52.19 47.81H.P. 50.72 49.28 50.36 49.64 53.96 46.04
Source: - Census of India-2011.
Table: 1.5
Decadal Population Growth Rate
Year
Male Female Total
1 2 3 4
1961 16.31 19.59 17.87
1971 21.75 24.42 23.04
1981 22.81 24.65 23.71
1991 20.62 20.96 20.79
2001 17.97 17.10 17.54
2011 12.76 13.14 12.94
Source: - Census of India.

36
Table: 1.6
Age-wise Distribution of Female Population 2001 Census.
District
0-6
7-10
11-14
15-19
20-24
25-59
60& above
Age not
stated
Total
1 2 3 4 5 6 7 8 9 10 Bilaspur 20095 14073 14871 16170 15711 69997 18403 302 169622Chamba 33985 23215 22736 23650 20405 84688 16173 817 225669Hamirpur 23301 16340 18057 21119 20220 89849 26883 338 216107Kangra 74931 53846 59162 70991 66489 281464 69436 1457 677776Kinnaur 4603 3108 3374 3387 3154 14622 3855 58 36161Kullu 25865 17695 18204 18577 17294 72020 13587 313 183555Lahaul-Spiti 1796 1192 1140 1476 1392 6287 1468 32 14783Mandi 57414 38183 41044 45197 44874 183722 41874 1164 453472Shimla 40984 29470 30765 35091 34046 143783 26726 641 341506Sirmaur 33055 22179 21651 22638 19416 82565 15412 378 217294Solan 31475 20064 20376 22347 23547 94470 17461 526 230266Una 27207 18829 19235 21663 20778 90107 25440 490 223749H.P. 374711 258194 270615 302306 287326 1213574 276718 6516 2989960
Source: - Census of India-2001
Table: 1.7
District-wise Females per Thousand Males.
District
1981
Census 1991
Census 2001
Census 2011
Census 1 2 3 4 5
Bilaspur 1002 1002 990 981 Chamba 936 949 959 986 Hamirpur 1149 1105 1099 1095 Kangra 1016 1024 1025 1012 Kinnaur 885 856 857 819 Kullu 918 920 927 942 Lahaul Spiti 767 817 802 903 Mandi 999 1013 1012 1007 Shimla 878 894 896 915 Sirmaur 873 897 901 918 Solan 929 909 852 880 Una 1028 1006 997 976 H.P. 973 976 968 972
Source: - Census of India.

37
Table: 1.8
District-wise Population of Females per Thousand Males in the Age Group of 0-6 Years.
District
1981
Census 1991
Census 2001
Census 2011
Census 1 2 3 4 5
Bilaspur 952 923 882 900 Chamba 979 965 955 953 Hamirpur 972 938 850 887 Kangra 978 939 836 876 Kinnaur 993 958 979 963 Kullu 970 966 960 962 Lahaul Spiti 965 951 961 1033 Mandi 986 968 918 916 Shimla 983 958 929 925 Sirmaur 975 973 934 928 Solan 944 951 900 899 Una 924 923 837 875 H.P. 971 951 896 909
Source: - Census of India.
Table: 1.9
District-wise Population of Female Target Groups. * 2001 Census
District Early Child-hood (0-6
years)
Girl Child (0-19 years)
Adolescent Girl
(11-18 years)
Reprodu-ctive Age
(15-44 years)
Economi-cally Active
(15-59 years)
Old Age (60 + years)
1 2 3 4 5 6 7 Bilaspur 20095 65209 28393 80784 101878 18403Chamba 33985 103586 42750 104539 128743 16173Hamirpur 23301 78817 35701 102110 131188 26883Kangra 74931 258930 118443 330958 418944 69436Kinnaur 4603 14472 6213 16905 21163 3855Kullu 25865 80341 33738 87751 107891 13587Lahaul Spiti 1796 5604 2380 7234 9155 1468Mandi 57414 181838 78497 219035 273793 41874Shimla 40984 136310 60197 172438 212920 26726Sirmaur 33055 99523 40989 100831 124619 15412Solan 31475 94262 39076 114986 140364 17461Una 27207 86934 37606 104790 132548 25440H.P. 374711 1205826 523983 1442361 1803206 276718*Age groups referred to in the context of developmental planning
Source: - Census of India.

38
Table: 1.10 Sex-wise Scheduled Castes Population- 2011 Census.
District
Male
Female
Total Percentage of SC females to total SC population
1 2 3 4 5 Bilaspur 50271 48718 98989 49.22 Chamba 56154 55536 111690 49.72 Hamirpur 53727 55529 109256 50.82 Kangra 159697 159688 319385 50.00 Kinnaur 7433 7317 14750 49.61 Kullu 62686 59973 122659 48.89 Lahaul Spiti 1154 1081 2235 48.37 Mandi 147250 146489 293739 49.87 Shimla 110828 104949 215777 48.64 Sirmaur 83017 77728 160745 48.35 Solan 85482 79054 164536 48.05 Una 58601 56890 115491 49.26 H.P. 876300 852952 1729252 49.32
Source: - Census of India-2011.
Table: 1.11 Sex-wise Scheduled Tribes Population- 2011 Census.
District
Male
Female
Total Percentage of ST females to total ST population
1 2 3 4 5 Bilaspur 5485 5208 10693 48.70 Chamba 67900 67600 135500 49.89 Hamirpur 1531 1513 3044 49.70 Kangra 41745 42819 84564 50.64 Kinnaur 23609 25137 48746 51.57 Kullu 8493 8329 16822 49.51 Lahaul Spiti 12748 12959 25707 50.41 Mandi 6345 6442 12787 50.38 Shimla 4554 4201 8755 47.98 Sirmaur 5912 5350 11262 47.50 Solan 13351 12294 25645 47.94 Una 4445 4156 8601 48.32 H.P. 196118 196008 392126 49.99
Source: - Census of India-2011.

39
Table: 1.12
Marital Status by Age and Sex. 2001 Census.
Age Group
Never Married
Married Widow Divorced/ Separated
Total
Male Female Total Male Female Total Male Female Total Male Female
1 2 3 4 5 6 7 8 9 10 11 12 13 < 10
1175391 619613 559738 0 0 0 0 0 0 0 0 0
10-14
698661 359007 339654 5521 1993 3528 639 152 487 218 105 113
15-19
591844 317720 274124 33940 6349 27591 521 129 392 319 120 199
20-24
336870 232763 104107 243715 62312 181403 1372 300 1072 1072 328 744
25-29
104713 88234 16479 407754 166992 240762 3470 728 2742 1570 578 992
30-34
19838 15769 4069 405267 197774 207493 5853 1140 4713 1717 718 999
35-39
8686 6221 2465 390477 191238 199239 9896 1530 8366 2003 857 1146
40-44
5355 3900 1455 310719 160727 149992 12818 2046 10772 1777 732 1045
15-44
2945318 1643227 1302029 17973993 787385 1010008 34569 6025 28544 8676 3438 5238
45-49
4162 3143 1019 278154 144199 133955 18997 2951 16046 1569 730 839
50-54
3746 2925 821 208842 115280 93562 24312 4191 20121 1345 679 666
55-59
2688 2085 603 159516 87295 72221 25365 4814 20551 968 527 441
60-64
3238 2486 752 129231 75499 52732 40620 7405 33215 1041 560 481
65-69
2353 1779 574 88258 51958 36300 37639 7348 30291 656 371 285
70-74
3133 2298 835 62068 41928 20140 41023 8961 32062 483 299 184
75-79
1697 1240 457 32253 21679 10574 22669 5941 16728 246 161 85
80+
2331 1580 751 34161 25849 8312 44167 12317 31850 297 187 110
Age not Stated
11585 6433 5152 2769 1668 1101 342 86 256 20 13 7
All Ages
2980251 1667196 1313055 2792645 1353740 1438905 289703 60039 229664 15301 6965 8336
Source: - Census of India-2001.

40
Table: 1.13
Death by Age and Sex 2012
Age Group
Rural Urban Total Male Female Total Male Female Total Male Female Total
1 2 3 4 5 6 7 8 9 10 < 1 Year 297 240 537 273 224 497 570 464 1034 1-4 Years 179 171 350 34 27 61 213 198 411 5-14 Years 233 191 424 49 41 90 282 232 514 15-24 Years 556 381 937 165 123 288 721 504 1225 25-34 Years 860 465 1325 259 126 385 1119 591 1710 35-44 Years 1296 596 1892 417 196 613 1713 792 2505 45-54 Years 2300 1194 3494 617 282 899 2917 1476 4393 55-64 Years 3652 1934 5586 787 400 1187 4439 2334 6773 65-69 Years 2311 1527 3838 394 211 605 2705 1738 4443 70 & above 9482 8219 17701 1163 812 1975 10645 9031 19676 Age not Stated
741 599 1340 154 93 247 895 692 1587
Source: Health and Family Welfare Department H.P.
Table: 1.14
Mean Age at Effective Marriage of Females by Residence-HP (SRS)
Year Total Rural Urban <18 18-
20 21+ All
ages <18 18-20 21+ All
ages<18 18-20 21+ All
ages1 2 3 4 5 6 7 8 9 10 11 12 13
2004 16.7 19.3 23.2 21.7 16.7 19.3 23.2 21.7 17.0 20.0 24.2 23.8 2005 16.1 19.3 23.5 22.0 15.9 19.3 23.4 21.9 16.6 19.1 24.3 22.6 2006 16.8 19.2 23.4 21.7 16.8 19.2 23.3 21.6 17.0 19.4 24.2 23.3 2007 17.0 19.4 23.3 22.1 17.0 19.4 23.2 22.0 17.0 19.5 24.0 22.7 2008 16.5 19.3 23.1 21.8 16.5 19.3 23.0 21.7 16.5 19.7 23.6 22.6 2009 16.7 19.2 23.4 22.2 16.6 19.2 23.3 22.1 17.0 19.8 25.0 23.9 2010 16.1 19.4 23.7 22.2 16.1 19.4 23.5 22.0 16.0 19.3 25.4 24.8 2011 17.0 19.4 23.6 22.4 17.0 19.4 23.5 22.2 17.0 19.5 24.9 24.1 2012 16.9 19.4 23.4 22.4 16.9 19.4 23.3 22.2 17.0 19.8 25.1 24.3
Source: Health and Family Welfare Department H.P.

41
Table: 1.15
Proportion of Married Females in Selected Age Groups. 2001 Census.
Source: - Census of India-2001.
District Percentage of married females to total females in the age groups 10-14 15-19 20-24 15-44 60-69 70-79 80+ Age not
stated All
ages1 2 3 4 5 6 7 8 9 10
Bilaspur 0.9 9.6 69.3 72.8 61.7 39.8 18.6 17.2 50.5
Chamba 1.1 12.0 69.8 69.8 48.5 32.1 17.9 12.4 43.8
Hamirpur 1.0 7.5 66.2 71.3 58.3 35.3 16.0 14.2 50.5
Kangra 1.0 5.5 53.9 67.1 31.9 35.8 18.6 18.2 48.3
Kinnaur 0.5 14.2 59.9 65.1 58.2 43.1 26.0 22.4 44.7
Kullu 0.8 14.6 70.5 71.6 54.0 40.2 25.2 21.1 46.7
Lahaul Spiti 0.9 10.0 55.0 61.4 57.1 44.6 34.3 15.6 44.6
Mandi 1.0 12.4 74.0 73.1 59.1 40.3 21.8 16.2 50.0
Shimla 1.3 8.4 54.3 67.2 58.2 40.5 25.0 20.1 47.8
Sirmaur 0.9 10.3 66.9 69.9 59.7 40.7 28.1 17.5 45.3
Solan 1.0 10.4 69.6 72.9 56.3 35.9 19.7 19.6 49.1
Una 1.2 5.1 53.5 68.0 61.7 39.3 18.5 13.1 47.9
H.P. 1.0 9.1 63.1 69.8 57.6 37.9 20.3 16.9 48.1

42
Table: 1.16
General Fertility Rates of H.P. and India (since 1988 SRS)
Year
Himachal Pradesh India Rural Urban Combined Rural Urban Combined
1 2 3 4 5 6 7 1988 130.2 89.7 127.3 139.5 103.9 131.0
1989 113.0 80.8 110.7 135.7 97.6 126.5
1990 N.A N.A. N.A. 132.6 96.1 123.9
1991 114.0 70.8 110.9 127.2 93.3 119.2
1992 111.9 75.8 109.3 127.6 89.1 118.6
1993 105.8 74.9 102.8 125.2 93.5 116.6
1994 101.6 69.3 98.9 128.6 89.7 118.3
1995 95.0 65.4 92.7 126.7 87.3 117.0
1996 86.1 61.9 84.3 122.7 81.5 112.5
1997 82.9 61.4 81.3 119.5 80.7 109.9
1998 82.3 61.6 80.8 115.2 79.2 106.5
1999 86.7 59.8 84.7 112.8 77.6 103.2
2000 80.2 59.6 78.6 112.7 76.5 102.8
2001 76.6 60.7 75.4 108.6 74.4 99.5
2002 74.9 57.4 73.5 106.0 72.5 97.1
2003 74.2 56.4 72.9 103.5 71.9 95.3
2004 74.4 44.7 71.4 109.5 72.0 98.6
2005 75.5 45.8 72.5 106.2 70.9 95.8
2006 70.2 42.5 67.5 103.4 69.1 93.3
2007 63.8 43.0 61.7 98.6 67.3 89.5
2008 64.6 41.5 62.3 96.9 66.5 88.0
2009 62.8 39.7 60.6 94.9 65.9 86.5
2010 61.5 39.1 59.3 91.9 64.0 83.9
2011 59.3 37.8 57.3 88.9 62.0 81.2
2012 58.1 37.3 56.1 87.6 61.5 80.3
Source: Health and Family Welfare Department H.P.

43
Table: 1.17 Total Fertility Rates of H.P. and India (since 1988 SRS)
Year Himachal Pradesh India
Rural Urban Combined Rural Urban Combined 1988 3.7 2.5 3.7 4.3 3.1 4.0
1989 3.3 2.3 3.2 4.2 2.8 3.9
1990 N.A. N.A. N.A. 4.1 2.8 3.8
1991 3.2 2.0 3.2 3.9 2.7 3.6
1992 3.1 2.2 3.1 3.9 2.6 3.6
1993 2.9 2.2 2.8 3.8 2.8 3.5
1994 3.0 2.0 2.9 3.8 2.7 3.5
1995 2.8 1.9 2.7 3.9 2.6 3.5
1996 2.5 1.8 2.4 3.7 2.4 3.4
1997 2.4 1.8 2.4 3.6 2.4 3.3
1998 2.4 1.8 2.4 3.5 2.4 3.2
1999 2.5 1.8 2.4 3.5 2.3 3.2
2000 2.3 1.8 2.3 3.5 2.3 3.2
2001 2.2 1.8 2.2 3.4 2.3 3.1
2002 2.1 1.8 2.1 3.3 2.2 3.0
2003 2.1 1.7 2.1 3.2 2.2 3.0
2004 2.2 1.4 2.1 3.3 2.1 2.9
2005 2.2 1.5 2.2 3.2 2.1 2.9
2006 2.1 1.4 2.0 3.1 2.0 2.8
2007 1.9 1.4 1.9 3.0 2.0 2.7
2008 2.0 1.4 1.9 2.9 2.0 2.6
2009 1.9 1.3 1.9 2.9 2.0 2.6
2010 1.9 1.3 1.8 2.8 1.9 2.5
2011 1.8 1.2 1.8 2.7 1.9 2.4
2012 1.7 1.2 1.7 2.6 1.8 2.4
Source: Health and Family Welfare Department H.P.
44
Table: 1.18 Estimated Age Specific Fertility Rate-(SRS-2012)
Age group
Himachal Pradesh India Rural Urban Combined Rural Urban Combined
1 2 3 4 5 6 7 15-19 17.9 1.0 16.5 36.3 16.7 31.5 20-24 152.6 69.2 145.3 210.6 140.4 191.9 25-29 130.9 95.6 127.6 164.8 131.4 154.6 30-34 39.7 65.7 42.1 68.3 55.6 64.5 35-39 8.5 10.4 8.7 27.5 15.4 23.9 40-44 0.5 2.6 0.7 10.1 3.7 8.2 45-49 0.0 0.0 0.0 2.8 0.8 2.2
Source: Health and Family Welfare Department H.P.
Table: 1.19
Total Population, Female population and its Share in Total Population and Sex Ratio 2011 Census.
District Total
Population Female
Population Percentage Share
of Female Population
Sex Ratio
1 2 3 4 5 Bilaspur 381956 189192 49.53 981 Chamba 519080 257760 49.66 986 Hamirpur 454768 237698 52.27 1095 Kangra 1510075 759484 50.29 1012 Kinnaur 84121 37872 45.02 819 Kullu 437903 212451 48.52 942 Lahaul Spiti 31564 14976 47.45 903 Mandi 999777 501712 50.18 1007 Shimla 814010 388971 47.78 915 Sirmaur 529855 253566 47.86 918 Solan 580320 271566 46.80 880 Una 521173 257481 49.40 976 H.P. 6864602 3382729 49.28 972
Source: - Census of India-2011.

45
Table: 1.20
Residence/Sex wise Births & Deaths in
Himachal Pradesh during, 2012.
Items
Rural Urban Total Male Female Total Male Female Total Male Female Total
1 2 3 4 5 6 7 8 9 10 Births 43540 40018 83558 23066 20987 44053 66606 61005 127611
Deaths 21907 15517 37424 4312 2535 6847 26219 18052 44271
Source: Health and Family Welfare Department H.P.
Table: 1.21
Sex Wise Registration of Births & Deaths
Year Wise Registration
Births Deaths Sex Ratio at Birth Males Females Males Females
1 2 3 4 5 6 1993 39155 35175 9996 7667 898 1994 43740 38411 11771 8178 878 1995 51671 45664 13742 9354 884 1996 58933 51808 16088 11395 879 1997 62206 53417 17097 11574 859 1998 62220 52848 17771 11944 849 1999 64646 56010 18746 12838 866 2000 67379 57771 19408 12805 857 2001 71993 61607 20932 14048 856 2002 70285 60872 21500 14269 866 2003 70885 62177 22512 14941 877 2004 73418 64055 21984 14402 872 2005 72167 62497 22453 15206 866 2006 74438 65891 24066 16271 885 2007 69971 63186 23710 16205 903 2008 71208 64367 24986 17400 904 2009 71467 65861 25230 17163 922 2010 70497 64222 24719 17079 911 2011 67409 61854 25079 17445 918 2012 66606 61005 26219 18052 916
Source: Health and Family Welfare Department H.P.
46
Table: 1.22 Vital Statistics by Sex 2012
Rural
District Live Births Deaths Infant Deaths Maternal Deaths
Still Births Male Female Total Male Female Total Male Female Total Male Female Total
1 2 3 4 5 6 7 8 9 10 11 12 13 14 Bilaspur 2921 2577 5498 1119 773 1892 11 3 14 1 - - -
Chamba 4355 4251 8606 1507 1048 2555 17 19 36 - - - -
Hamirpur 2042 1775 3817 1719 1249 2968 7 9 16 - - - -
Kangra 11221 9939 21160 5915 4208 10123 126 96 222 2 3 2 5
Kinnaur 464 429 893 293 155 448 3 2 5 - - - -
Kullu 2001 2055 4056 1173 831 2004 10 16 26 - - - -
Lahaul Spiti 112 110 222 94 72 166 2 - 2 - - - -
Mandi 5610 5077 10687 2977 2137 5114 32 23 55 - - - -
Shimla 3434 3393 6827 1912 1349 3261 34 27 61 - - - -
Sirmaur 3795 3507 7302 1542 998 2540 22 16 38 - - - -
Solan 2930 2682 5612 1552 1142 2694 18 18 36 - - - -
Una 4655 4223 8878 2104 1555 3659 15 11 26 - 48 42 90
H.P. 43540 40018 83558 21907 15517 37424 297 240 537 3 51 44 95
Source: Health and Family Welfare Department H.P.

47
Table: 1.23 Vital Statistics by Sex 2012
Urban
District Live Births Deaths Infant Deaths Maternal Deaths
Still Births Male Female Total Male Female Total Male Female Total Male Female Total
1 2 3 4 5 6 7 8 9 10 11 12 13 14 Bilaspur 1275 1150 2425 230 135 365 25 14 39 - - - -
Chamba 1054 1008 2062 306 194 500 21 23 44 - 1 - 1
Hamirpur 2736 2471 5207 324 213 537 18 17 35 - 2 - 2
Kangra 2822 2521 5343 441 214 655 12 5 17 - - - -
Kinnaur - - - - - - - - - - - - -
Kullu 2053 1971 4024 340 199 539 22 14 36 - 6 8 14
Lahaul Spiti - - - - - - - - - - - - -
Mandi 3157 2871 6028 494 332 826 39 32 71 - - - -
Shimla 4800 4427 9227 1293 733 2026 98 86 184 2 - - -
Sirmaur 1818 1568 3386 343 164 507 28 19 47 - - - -
Solan 2830 2590 5420 379 234 613 10 13 23 - - - -
Una 521 410 931 162 117 279 - 1 1 - - - -
H.P. 23066 20987 44053 4312 2535 6847 273 224 497 2 9 8 17
Source: Health and Family Welfare Department H.P.

48
Table: 1.24
Population Sex Ratio in the Age Group (0-6 years). 2001 & 2011 Census.
District 2001 Census 2011 Census
Persons Male Female Sex Ratio Persons Male Female Sex Ratio1 2 3 4 5 6 7 8 9 10
Bilaspur Total 42890 22795 20095 882 41956 22084 19872 900Rural 40403 21441 18962 884 39501 20752 18749 903Urban 2487 1354 1133 837 2455 1332 1123 843
Chamba Total 69579 35594 33985 955 70359 36024 34335 953Rural 65902 33610 32292 961 67015 34286 32729 955Urban 3677 1984 1693 853 3344 1738 1606 924
Hamirpur Total 50699 27398 23301 850 48548 25722 22826 887Rural 47466 25643 21823 851 45625 24189 21436 886Urban 3233 1755 1478 842 2923 1533 1390 907
Kangra Total 164566 89635 74931 836 164607 87741 76866 876Rural 157047 85574 71473 835 156586 83419 73167 877Urban 7519 4061 3458 852 8021 4322 3699 856
Kinnaur Total 9304 4701 4603 979 8246 4200 4046 963Rural 9304 4701 4603 979 8246 4200 4046 963Urban 0 0 0 0 0 0 0 0
Kullu Total 52820 26955 25865 960 50431 25707 24724 962Rural 49661 25252 24409 967 46400 23575 22825 968Urban 3159 1703 1456 855 4031 2132 1899 891
Lahaul Spiti Total 3664 1868 1796 961 3125 1537 1588 1033Rural 3664 1868 1796 961 3125 1537 1588 1033Urban 0 0 0 0 0 0 0 0
Mandi Total 119949 62535 57414 918 112074 58486 53588 916Rural 113933 59266 54667 922 106402 55468 50934 918Urban 6016 3269 2747 840 5672 3018 2654 879
Shimla Total 85089 44105 40984 929 81564 42376 39188 925Rural 69146 35404 33742 953 64881 33558 31323 933Urban 15943 8701 7242 832 16683 8818 7865 892
Sirmaur Total 68431 35376 33055 934 69620 36107 33513 928Rural 62772 32290 30482 944 63387 32780 30607 934Urban 5659 3086 2573 834 6233 3327 2906 873
Solan Total 66434 34959 31475 900 68137 35884 32253 899Rural 56506 29666 26840 905 57250 30029 27221 906Urban 9928 5293 4635 876 10887 5855 5032 859
Una Total 59712 32505 27207 837 59231 31591 27640 875Rural 54824 29819 25005 839 54404 29061 25343 872Urban 4888 2686 2202 820 4827 2530 2297 908
Himachal Pradesh
Total 793137 418426 374711 896 777898 407459 370439 909Rural 730628 384534 346094 900 712822 372854 339968 912Urban 62509 33892 28617 844 65076 34605 30471 881
Source: - Census of India.
49
Table: 1.25
Population Sex Ratio in the Age Group (0-6 years) 2011 Census.
District Total Population Sex
Ratio Population in age group 0-6 Sex
Ratio Persons Male Female Persons Male Female 1 2 3 4 5 6 7 8 9
Bilaspur 381956 192764 189192 981 41956 22084 19872 900 Chamba 519080 261320 257760 986 70359 36024 34335 953 Hamirpur 454768 217070 237698 1095 48548 25722 22826 887 Kangra 1510075 750591 759484 1012 164607 87741 76866 876 Kinnaur 84121 46249 37872 819 8246 4200 4046 963 Kullu 437903 225452 212451 942 50431 25707 24724 962 Lahaul Spiti 31564 16588 14976 903 3125 1537 1588 1033 Mandi 999777 498065 501712 1007 112074 58486 53588 916 Shimla 814010 425039 388971 915 81564 42376 39188 925 Sirmaur 529855 276289 253566 918 69620 36107 33513 928 Solan 580320 308754 271566 880 68137 35884 32253 899 Una 521173 263692 257481 976 59231 31591 27640 875 H.P. 6864602 3481873 3382729 972 777898 407459 370439 909
Source: - Census of India-2011.

50
Table: 1.26
Age-wise Distribution of Population 2001 Census.
Age
Group (Years)
Total Rural Urban Total Male Female Total Male Female Total Male Female
1. 2. 3. 4. 5. 6. 7. 8. 9. 10. 0-4 560187 296555 263632 517539 273478 244061 42648 23077 19571
5-9 619164 323058 296106 566404 294317 272087 52760 28741 24019
10-14 705039 361257 343782 644995 329113 315882 60044 32144 27900
15-19 626624 324318 302306 564788 289354 275434 61836 34964 26872
20-24 583029 295703 287326 515945 256218 259727 67084 39485 27599
25-29 517507 256532 260975 458593 224315 234278 58914 32217 26697
30-34 432675 215401 217274 381339 187653 193686 51336 27748 23588
35-39 411062 199846 211216 362046 173247 188799 49016 26599 22417
40-44 330669 167405 163264 291109 144391 146718 39560 23014 16546
45-49 302882 151023 151859 270052 131634 138418 32830 19389 13441
50-54 238245 123075 115170 214098 108551 105547 24147 14524 9623
55-59 188537 94721 93816 171610 84952 86658 16927 9769 7158
60-64 174130 86950 87180 161344 80078 81266 12786 6872 5914
65-69 128906 61456 67450 119674 56746 62928 9232 4710 4522
70-74 106707 53486 53221 99721 49780 49941 6986 3706 3280
75-79 56865 29021 27844 53005 27014 25991 3860 2007 1853
80+ 80956 39933 41023 76577 37801 38776 4379 2132 2247
Age not
Stated
14716
8200 6516 13480 7431
6049
1236 769 467All
Ages
6077900
3087940 2989960 5482319 2756073
2726246
595581 331867 263714
Source: Census of India-2001.
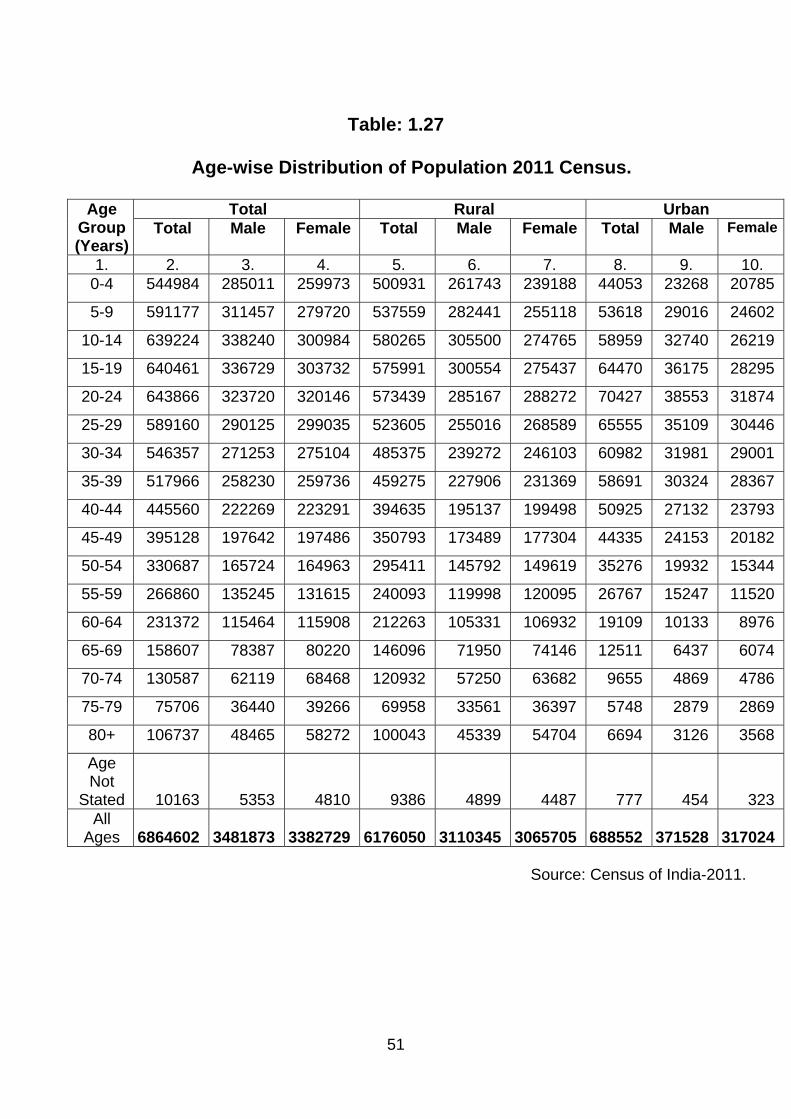
51
Table: 1.27
Age-wise Distribution of Population 2011 Census.
Age
Group (Years)
Total Rural Urban Total Male Female Total Male Female Total Male Female
1. 2. 3. 4. 5. 6. 7. 8. 9. 10. 0-4 544984 285011 259973 500931 261743 239188 44053 23268 20785
5-9 591177 311457 279720 537559 282441 255118 53618 29016 24602
10-14 639224 338240 300984 580265 305500 274765 58959 32740 26219
15-19 640461 336729 303732 575991 300554 275437 64470 36175 28295
20-24 643866 323720 320146 573439 285167 288272 70427 38553 31874
25-29 589160 290125 299035 523605 255016 268589 65555 35109 30446
30-34 546357 271253 275104 485375 239272 246103 60982 31981 29001
35-39 517966 258230 259736 459275 227906 231369 58691 30324 28367
40-44 445560 222269 223291 394635 195137 199498 50925 27132 23793
45-49 395128 197642 197486 350793 173489 177304 44335 24153 20182
50-54 330687 165724 164963 295411 145792 149619 35276 19932 15344
55-59 266860 135245 131615 240093 119998 120095 26767 15247 11520
60-64 231372 115464 115908 212263 105331 106932 19109 10133 8976
65-69 158607 78387 80220 146096 71950 74146 12511 6437 6074
70-74 130587 62119 68468 120932 57250 63682 9655 4869 4786
75-79 75706 36440 39266 69958 33561 36397 5748 2879 2869
80+ 106737 48465 58272 100043 45339 54704 6694 3126 3568
Age Not
Stated 10163 5353 4810 9386 4899 4487 777 454 323 All
Ages 6864602 3481873 3382729 6176050 3110345 3065705 688552 371528 317024
Source: Census of India-2011.

52
Table: 1.28
Infant Mortality Rates by Sex and Residence of Himachal Pradesh 1994-2012 (SRS).
Year Total Rural Urban
Total Males Females Total Males Females Total Males Females
1 2 3 4 5 6 7 8 9 10 1995 61 68 56 63 70 57 39 37 43
1996 62 57 71 63 58 73 40 41 31
1997 63 64 61 64 65 63 38 46 28
1998 64 60 77 66 61 79 38 42 33
1999 62 57 51 43 58 52 38 39 35
2000 60 57 45 62 58 45 37 34 38
2001 54 48 36 56 49 38 32 25 14
2002 52 66 55 53 68 57 28 26 31
2003 49 46 38 51 47 39 26 26 9
2004 51 56 45 54 61 47 15 16 13
2005 49 47 51 53 48 53 20 27 14
2006 50 45 55 52 47 57 26 20 31
2007 47 45 49 49 47 51 25 22 28
2008 44 43 45 45 45 46 27 21 34
2009 45 44 45 46 46 46 28 28 29
2010 40 35 47 41 35 48 29 29 29
2011 38 36 39 38 37 40 28 20 35
2012 36 35 38 37 36 38 25 22 27
Source: Health and Family Welfare Department H.P

53
Table: 1.29
Sex-Wise Infant Mortality Rates (SRS)
Year
Himachal Pradesh India Males Females Combined Males Females Combined
1 2 3 4 5 6 7 1995 68 56 61 73 75 74
1996 57 71 62 73 72 72
1997 64 61 63 70 72 71
1998 59 76 64 70 74 72
1999 57 51 62 70 71 70
2000 57 45 60 67 69 68
2001 48 36 54 64 68 66
2002 66 55 52 62 65 63
2003 46 38 49 57 64 60
2004 56 45 51 58 58 58
2005 47 51 49 56 61 58
2006 45 55 50 56 59 57
2007 45 49 47 55 56 55
2008 43 45 44 52 55 53
2009 44 45 45 49 52 50
2010 35 47 40 46 49 47
2011 36 39 38 43 46 44
2012 35 38 36 41 44 42
Source: Health and Family Welfare Department H.P.

54
Table: 1.30
Death Rates by Sex and Residence of Himachal Pradesh 1990-2012(SRS)
Year Combined Rural Urban
Total Males Females Total Males Females Total Males Females1 2 3 4 5 6 7 8 9 10
1991 8.9 9.8 8.0 9.2 10.1 8.2 5.2 6.0 4.2
1992 8.8 9.6 8.0 9.1 10.0 8.3 4.6 5.2 3.9
1993 8.7 9.9 7.4 9.0 10.3 7.7 5.5 6.4 4.5
1994 8.6 11.0 6.3 8.9 11.6 6.3 5.7 5.6 5.8
1995 8.7 9.7 7.6 8.9 10.0 7.8 6.1 6.9 5.2
1996 8.0 8.9 7.2 8.2 9.1 7.3 6.0 6.9 4.9
1997 8.1 9.3 7.0 8.3 9.5 7.2 5.9 6.8 4.8
1998 7.7 8.8 6.8 7.9 9.0 6.9 5.4 6.2 4.6
1999 7.3 8.2 6.5 7.5 8.5 6.6 5.2 5.6 4.8
2000 7.2 8.2 6.2 7.3 8.4 6.3 5.5 6.0 4.8
2001 7.1 8.1 6.0 7.2 8.3 6.2 5.3 6.6 4.0
2002 7.5 9.1 6.1 7.7 9.3 6.2 5.1 5.9 4.1
2003 7.1 8.3 6.0 7.3 8.6 6.1 4.9 5.6 4.2
2004 6.8 7.7 5.8 7.0 8.0 6.0 4.5 4.9 3.9
2006 6.8 8.4 5.4 7.1 .. .. 4.8 .. ..
2007 7.1 8.1 6.1 7.3 .. .. 5.0 .. ..
2008 7.4 8.7 6.1 7.7 9.1 6.3 4.7 5.1 4.2
2009 7.2 8.4 6.0 7.4 8.7 6.2 4.9 5.5 4.2
2010 6.9 7.8 6.1 7.2 8.1 6.3 4.2 4.8 3.5
2011 6.7 7.7 5.7 7.0 8.1 6.0 3.6 4.1 3.1
2012 6.7 8.2 5.2 7.0 8.7 5.5 3.6 4.2 3.0
Source: Health and Family Welfare Department H.P.

55
Table: 1.31
Expectation of Life at Birth (SRS)
Year Himachal Pradesh India
Males Females Combined Males Females Combined 1 2 3 4 5 6 7
1970-75 54.8 50.9 .. 50.5 49.0 49.7
1976-80 58.1 54.9 .. 52.5 52.1 52.3
1981-85 58.5 62.9 .. 55.4 55.7 55.4
1986-90 62.4 62.8 62.8 57.7 58.1 57.7
1993-97 64.6 65.2 65.1 60.4 61.8 61.1
1995-99 65.1 65.8 65.6 60.8 62.5 61.7
1997-01 65.5 66.1 65.9 61.3 63.0 62.2
1998-02 65.7 66.3 65.9 61.6 63.3 62.5
1999-03 65.8 66.6 66.2 61.8 63.5 62.7
2000-04 66.1 66.8 66.5 62.1 63.7 63.0
2001-05 66.3 67.1 .. 62.3 63.9 ..
2002-06 66.5 67.3 .. 62.6 64.2 ..
2006-10 67.7 72.4 70.0 64.6 67.7 66.1
Source: Health and Family Welfare Department H.P.
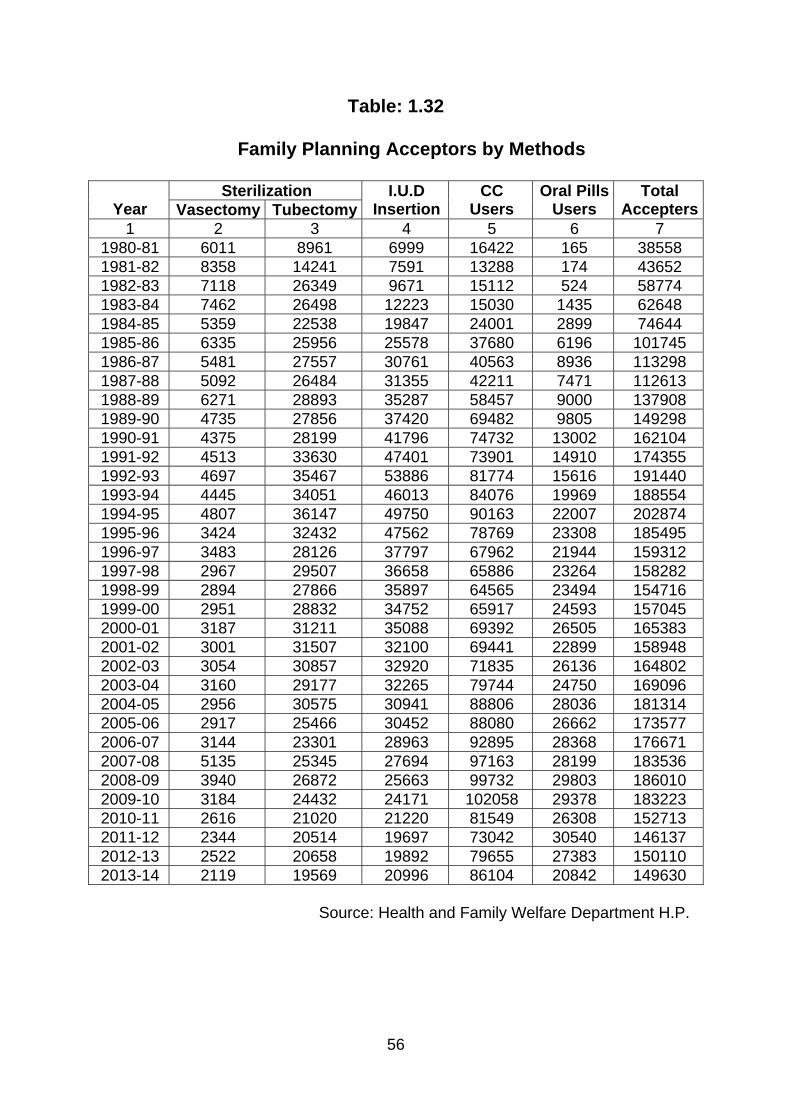
56
Table: 1.32
Family Planning Acceptors by Methods
Year
Sterilization I.U.D Insertion
CC Users
Oral Pills Users
Total AcceptersVasectomy Tubectomy
1 2 3 4 5 6 7 1980-81 6011 8961 6999 16422 165 38558 1981-82 8358 14241 7591 13288 174 43652 1982-83 7118 26349 9671 15112 524 58774 1983-84 7462 26498 12223 15030 1435 62648 1984-85 5359 22538 19847 24001 2899 74644 1985-86 6335 25956 25578 37680 6196 101745 1986-87 5481 27557 30761 40563 8936 113298 1987-88 5092 26484 31355 42211 7471 112613 1988-89 6271 28893 35287 58457 9000 137908 1989-90 4735 27856 37420 69482 9805 149298 1990-91 4375 28199 41796 74732 13002 162104 1991-92 4513 33630 47401 73901 14910 174355 1992-93 4697 35467 53886 81774 15616 191440 1993-94 4445 34051 46013 84076 19969 188554 1994-95 4807 36147 49750 90163 22007 202874 1995-96 3424 32432 47562 78769 23308 185495 1996-97 3483 28126 37797 67962 21944 159312 1997-98 2967 29507 36658 65886 23264 158282 1998-99 2894 27866 35897 64565 23494 154716 1999-00 2951 28832 34752 65917 24593 157045 2000-01 3187 31211 35088 69392 26505 165383 2001-02 3001 31507 32100 69441 22899 158948 2002-03 3054 30857 32920 71835 26136 164802 2003-04 3160 29177 32265 79744 24750 169096 2004-05 2956 30575 30941 88806 28036 181314 2005-06 2917 25466 30452 88080 26662 173577 2006-07 3144 23301 28963 92895 28368 176671 2007-08 5135 25345 27694 97163 28199 183536 2008-09 3940 26872 25663 99732 29803 186010 2009-10 3184 24432 24171 102058 29378 183223 2010-11 2616 21020 21220 81549 26308 152713 2011-12 2344 20514 19697 73042 30540 146137 2012-13 2522 20658 19892 79655 27383 150110 2013-14 2119 19569 20996 86104 20842 149630
Source: Health and Family Welfare Department H.P.

57
Table: 1.33
Percentage of Couples Protected by Family Welfare Methods in Himachal Pradesh.
Year Sterilization IUD CC Users OP Users Total
1 2 3 4 5 6
1990-91 37.50 8.70 4.40 1.50 52.10
1991-92 38.50 9.50 4.30 1.70 54.00
1992-93 38.60 10.50 4.60 1.70 54.00
1993-94 39.90 10.30 4.60 2.20 57.00
1994-95 40.73 10.41 4.86 2.37 58.37
1995-96 40.86 10.25 4.16 2.46 57.73
1996-97 40.52 9.32 3.54 2.29 55.67
1997-98 39.76 8.55 3.33 2.37 54.00
1998-99 39.14 7.98 3.22 2.34 52.69
1999-00 38.13 7.81 3.23 2.41 51.57
2000-01 38.79 7.39 3.43 2.62 52.24
2001-02 38.10 6.91 3.37 2.22 50.60
2002-03 37.48 6.64 3.43 2.49 50.04
2003-04 36.62 6.37 3.73 2.32 49.04
2004-05 35.92 6.09 4.08 2.58 48.67
2005-06 34.77 5.84 3.98 2.41 47.01
2006-07 33.49 5.55 4.13 2.52 45.69
2007-08 32.95 5.46 4.07 2.48 44.97
2008-09 31.80 4.93 4.30 2.57 43.59
2009-10 30.76 4.59 4.33 2.49 42.17
2010-11 31.53 4.47 3.65 2.35 42.00
2011-12 30.28 4.09 3.23 2.70 40.30
2012-13 29.10 3.83 3.52 2.41 38.77
Source: Health and Family Welfare Department H.P.

58
Table: 1.34
Family Indicators by level of education of Women 2012 (SRS)
Indicators
Age Group
Education Level ILLit-erat-es
Illiterate Literate Total
Literate Without
any Formal
education
Below Primary
Prim-ary
Middle Class X
Class XII
Graduate & Above
1 2 3 4 5 6 7 8 9 10 11 Total
Age specific Fertility rates
15-19 21.0 16.5 0.0 112.3 32.4 14.5 12.8 16.8 0.0 20-24 246.7 142.7 0.0 324.1 195.1 149.6 149.0 105.7 136.1 25-29 45.6 130.9 143.2 75.4 63.5 92.2 157.6 151.6 146.3 30-34 28.9 43.6 0.0 11.4 28.2 16.6 55.5 58.9 66.8 35-39 5.9 9.3 0.0 0.0 2.3 9.7 5.7 20.3 30.8 40-44 0.3 0.8 7.1 1.1 0.0 0.8 1.1 0.0 1.6 45-49 0.0 0.0 0.0 0.0 0.0 0.0 0.0 0.0 0.0
General fertility rates 16.5 61.5 10.5 38.8 35.3 39.9 72.7 86.3 87.1 Total fertility rates 1.7 1.7 0.8 2.6 1.6 1.4 1.9 1.8 1.9
Rural Age specific Fertility rates
15-19 24.6 17.9 0.0 124.6 33.5 15.6 14.0 19.1 0.0 20-24 251.2 149.8 0.0 334.3 197.5 152.5 153.7 112.6 159.4 25-29 46.4 134.4 131.3 74.1 62.7 92.0 159.4 159.4 163.8 30-34 30.0 40.8 0.0 7.3 27.6 13.9 55.0 60.4 60.2 35-39 6.1 9.0 0.0 0.0 2.4 10.3 4.2 24.4 39.9 40-44 0.0 0.7 7.7 1.2 0.0 0.8 0.7 0.0 0.0 45-49 0.0 0.0 0.0 0.0 0.0 0.0 0.0 0.0 0.0
General fertility rates 16.7 64.2 9.7 39.2 35.5 41.0 76.5 93.8 103.7 Total fertility rates 1.8 1.8 0.7 2.7 1.6 1.4 1.9 1.9 2.1
Urban Age specific Fertility rates
15-19 0.0 1.0 0.0 0.0 0.0 0.0 0.0 4.4 0.0 20-24 158.1 67.9 0.0 116.6 142.3 88.8 77.1 53.2 61.1 25-29 32.8 97.3 255.6 109.8 83.8 95.0 129.6 78.4 93.3 30-34 0.0 68.2 0.0 135.7 42.1 77.3 60.2 47.2 84.8 35-39 0.0 11.1 0.0 0.0 0.0 0.0 16.8 4.7 16.9 40-44 8.1 2.0 0.0 0.0 0.0 0.0 3.1 0.0 3.5 45-49 0.0 0.0 0.0 0.0 0.0 0.0 0.0 0.0 0.0
General fertility rates 12.2 38.6 19.2 31.3 30.9 24.1 36.3 37.6 50.9 Total fertility rates 1.0 1.2 1.3 1.8 1.3 1.3 1.4 0.9 1.3

59
Table: 1.35
Distribution of Total Workers by Sex
2011 Census.
District
Total Rural Urban Total Male Female Total Male Female Total Male Female
1 2 3 4 5 6 7 8 9 10 Bilaspur 205871 111543 94328 195691 104537 91154 10180 7006 3174
Chamba 294035 158791 135244 280855 148335 132520 13180 10456 2724
Hamirpur 241931 118724 123207 230983 110846 120137 10948 7878 3070
Kangra 675170 403756 271414 645181 380728 264453 29989 23028 6961
Kinnaur 56273 33863 22410 56273 33863 22410 - - -
Kullu 269084 148829 120255 252150 136089 116061 16934 12740 4194
Lahaul Spiti
19295
10763 8532 19295 10763 8532
- - -
Mandi 572671 297464 275207 549714 280944 268770 22957 16520 6437
Shimla 430926 258628 172298 346311 194824 151487 84615 63804 20811
Sirmaur 280083 169399 110684 260263 153678 106585 19820 15721 4099
Solan 298737 190001 108736 253163 152576 100587 45574 37425 8149
Una 215346 141612 73734 199505 129175 70330 15841 12437 3404
H.P. 3559422 2043373 1516049 3289384 1836358 1453026 270038 207015 63023
Source: - Census of India-2011.

60
Table: 1.36
Percentage of Total Workers, Main Workers, Marginal Workers and Non-workers to Total Male, Female Population
of State and District: 2011
Source: Census of India, 2011.H.P.
District
Total Workers Main Workers Marginal Workers Non-workers Total
Male Female Total Male Female Total Male Fe-
male Total Male Fe-
male 1 2 3 4 5 6 7 8 9 10 11 12 13
Bilaspur 53.90 57.87 49.86 27.07 38.08 15.86 26.83 19.79 34.00 46.10 42.13 50.14
Chamba 56.65 60.76 52.47 23.05 33.41 12.54 33.60 27.35 39.93 43.35 39.24 47.53
Hamirpur 53.20 54.69 51.83 27.74 34.73 21.36 25.46 19.96 30.48 46.80 45.31 48.17
Kangra 44.71 53.79 35.74 20.79 32.74 8.98 23.92 21.06 26.76 55.29 46.21 64.26
Kinnaur 66.90 73.22 59.17 55.61 64.67 44.55 11.28 8.55 14.63 33.10 26.78 40.83
Kullu 64.45 66.01 56.60 44.27 52.81 35.22 17.17 13.21 21.38 38.55 33.99 43.40
Lahaul Spiti
61.13
64.88
56.97
48.12
52.64
43.12
13.01
12.24
13.85
38.87
35.12
43.03
Mandi 57.28 59.72 54.85 28.42 37.27 19.64 28.86 22.46 35.21 42.72 40.28 45.15
Shimla 52.94 60.85 44.30 38.30 50.58 24.88 14.64 10.27 19.41 47.06 39.15 55.70
Sirmaur 52.86 61.31 43.65 36.60 48.84 23.25 16.26 12.47 20.40 47.14 38.69 56.35
Solan 51.48 61.54 40.04 37.78 51.18 22.55 13.70 10.36 17.49 48.52 38.46 59.96
Una 41.32 53.70 28.64 25.80 40.17 11.09 15.52 13.53 17.55 58.68 46.30 71.36
H.P. 51.85 58.69 44.82 30.05 41.33 18.43 21.81 17.36 26.39 48.15 41.31 55.18

61
Table: 1.37
District-wise Female Work Participation Rate 2001 & 2011 Census.
District Female work participation rate Rank in
2001 2011 2001 2011 1 2 3 4 5
Bilaspur 45.56 49.86 7 7 Chamba 45.97 52.47 6 5 Hamirpur 48.74 51.83 4 6 Kangra 37.41 35.74 11 11 Kinnaur 54.67 59.17 2 1 Kullu 52.91 56.60 3 3 Lahaul Spiti 57.39 56.97 1 2 Mandi 48.19 54.85 5 4 Shimla 44.24 44.30 8 8 Sirmaur 41.35 43.65 10 9 Solan 42.63 40.04 9 10 Una 37.05 28.64 12 12
Source: Census of India, 2001 & 2011.
Table: 1.38
District-wise Male Work Participation Rate
2001 & 2011 Census.
District
Male work participation rate Rank in 2001 2011 2001 2011
1 2 3 4 5 Bilaspur 52.22 57.87 10 9 Chamba 53.87 60.76 7 7 Hamirpur 50.90 54.69 11 10 Kangra 50.73 53.79 12 11 Kinnaur 66.49 73.22 2 1 Kullu 60.30 66.01 4 2 Lahaul Spiti 68.35 64.88 1 3 Mandi 52.64 59.72 9 8 Shimla 57.52 60.85 5 6 Sirmaur 56.37 61.31 6 5 Solan 61.15 61.54 3 4 Una 52.90 53.70 8 12
Source: Census of India, 2001 & 2011.

62
Table: 1.39
Employment in State Government.
Year as on 31st March
State Government Employees Female Total Female (Percent)
1 2 3 4
1987 15878 101395 15.66 1988 16591 103211 16.07 1989 18120 107669 16.83 1990 19220 111700 17.21 1991 19794 113851 17.39 1992 20387 114831 17.75 1993 20131 112717 17.86 1994 20373 113039 18.02 1995 21241 115493 18.39 1996 22150 117944 18.78 1997 23290 120703 19.30 1998 24905 123626 20.15 1999 27682 131919 20.98 2000 29218 136085 21.47 2001 30422 139882 21.75 2002 31193 144446 21.59 2003 31649 147039 21.52 2004 32001 146933 21.78 2005 31836 145556 21.87 2006 33087 161803 20.45 2007 34197 174388 19.61 2008 36026 182746 19.71 2009 36848 189065 19.49 2010 37555 190560 19.71 2011 37638 187604 20.06 2012 38221 187419 20.39 2013 39143 184761 21.19
Source: Economics & Statistics Department, H.P

63
Table: 1.40
Regular State Government Employees by Gazetted and Non-Gazetted Status as on 31st March.
Year
( as on 31st March)
Gazetted Non-Gazetted Total Male Female Total Male Female Total Male Female Total
1 2 3 4 5 6 7 8 9 10 2000 9063 1506 10569 97804 27712 125516 106867 29218 1360852001 9182 1593 10775 100278 28829 129107 109460 30422 1398822002 7404 1011 8415 105849 30182 136031 113253 31193 1444462003 7785 1198 8983 107605 30451 138056 115390 31649 1470392004 7920 1337 9257 107012 30664 137676 114932 32001 1469332005 7890 1383 9273 105830 30453 136283 113720 31836 1455562006 7463 1261 8724 121253 31826 153081 128716 33087 1618032007 7573 1281 8854 132618 32916 165534 140191 34197 1743882008 7752 1422 9174 138968 34604 173572 146720 36026 1827462009 8476 1545 10021 143741 35303 179044 152217 36848 1890652010 8233 1563 9796 144772 35992 180764 153005 37555 1905602011 8201 1707 9908 141765 35931 177696 149966 37638 1876042012 8382 1822 10204 140816 36399 177215 149198 38221 1874192013 8119 1892 10011 137499 37251 174750 145618 39143 184761
Source: Economics & Statistics Department, H.P.

64
Table: 1.41 Employment by Activity and by type of Establishments.
Sr.No.
Major Activity Group Total Number of Persons usually working
Adult male
Adult Female
Child Male
Child Female
Total
1 2 3 4 5 6 7 1 Farming of Animals 9564 4277 90 58 13989 2 Agricultural Services 4412 277 2 0 4691 3 Fishing etc. 432 4 0 0 436 Total Agricultural Activities 14408 4558 92 58 19116 1 Mining and Quarrying 2838 133 3 0 2974 2 Manufacturing 107410 11358 14 8 118790 3 Electricity Gas & Water 19394 1182 3 0 20579 4 Construction 6622 318 0 0 6940 5 Sale, Maintenance & Repairs m/v m/c 12036 176 0 0 12212 6 Wholesale trade 3694 146 1 0 3841 7 Retail Trade 118912 6349 33 11 125305 8 Restaurants and Hotels 33698 1992 28 7 35725 9 Transport and Storage 29850 299 12 0 30161
10 Posts and Telecommunications 12019 1569 1 0 13589 11 Financial Intermediation 10256 1443 0 0 11699 12 Real Estate, Banking and Service 9293 620 2 0 9915 13 Public, Administration, Defence, Social Security 77865 11953 1 1 89820 14 Education 62855 49074 10 4 111943 15 Health & Social work 17945 8615 0 4 26564 16 Other community, personal Service 16043 3837 3 0 19883 17 Other activities 298 125 0 0 423
Total: Non-Agricultural Activities 541028 99189 111 35 640363 Total: Agricultural & Non-Agricultural Activities 555436 103747 203 93 659479
Source: Economic Census, 2005.
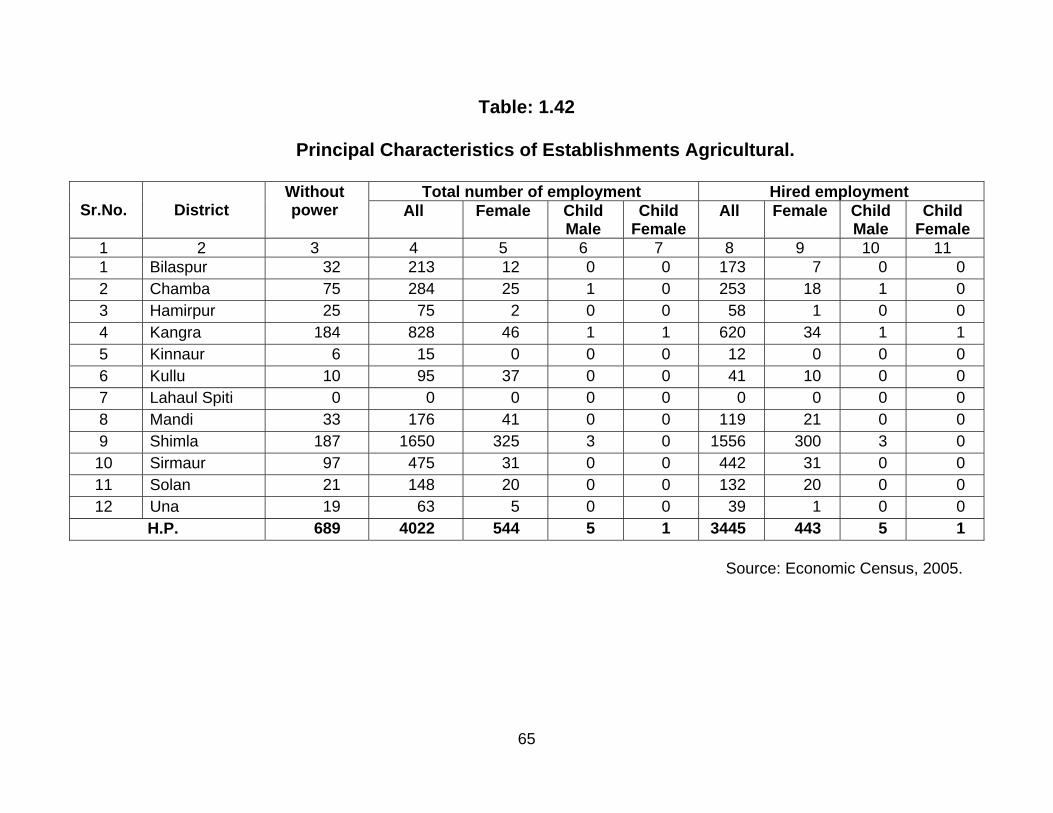
65
Table: 1.42
Principal Characteristics of Establishments Agricultural.
Sr.No.
District
Without power
Total number of employment Hired employment All Female Child
Male Child
Female All Female Child
Male Child
Female 1 2 3 4 5 6 7 8 9 10 11 1 Bilaspur 32 213 12 0 0 173 7 0 0 2 Chamba 75 284 25 1 0 253 18 1 0 3 Hamirpur 25 75 2 0 0 58 1 0 0 4 Kangra 184 828 46 1 1 620 34 1 1 5 Kinnaur 6 15 0 0 0 12 0 0 0 6 Kullu 10 95 37 0 0 41 10 0 0 7 Lahaul Spiti 0 0 0 0 0 0 0 0 0 8 Mandi 33 176 41 0 0 119 21 0 0 9 Shimla 187 1650 325 3 0 1556 300 3 0 10 Sirmaur 97 475 31 0 0 442 31 0 0 11 Solan 21 148 20 0 0 132 20 0 0 12 Una 19 63 5 0 0 39 1 0 0
H.P. 689 4022 544 5 1 3445 443 5 1
Source: Economic Census, 2005.

66
Table: 1.43
Principal Characteristics of Establishments Non-Agricultural.
Sr.No.
District
Without power
Total number of employment Hired employment All Female Child
Male Child
Female All Female Child
Male Child
Female 1 2 12 13 14 15 16 17 18 19 20 1 Bilaspur 2331 22959 4133 7 0 20567 4065 7 02 Chamba 2805 24654 5219 6 0 23292 5162 6 03 Hamirpur 2894 24308 5300 1 1 22111 5175 1 14 Kangra 7443 75890 17192 7 1 70346 16981 7 15 Kinnaur 432 8311 1611 1 0 7918 1586 1 06 Kullu 2056 27273 4589 8 2 24512 4383 8 27 Lahaul Spiti 115 4481 947 0 0 4324 926 0 08 Mandi 2629 49689 11305 11 2 45607 11123 9 29 Shimla 6625 79106 14341 10 2 74211 14085 9 210 Sirmaur 2742 35465 5553 21 12 33538 5498 19 1111 Solan 3587 74842 11064 1 1 70383 10941 1 112 Una 2125 25320 5796 0 1 23062 5752 0 1
H.P. 35784 452298 87050 73 22 419871 85677 68 21
Source: Economic Census, 2005.

67
Table: 1.44
Number of Employment in Selected Characteristics of Establishments.
Sr.No.
Characteristics
Number of Persons usually working (Agricultural) Total Hired
All Female Child Male Child Female Total Female 1 2 3 4 5 6 7 8 1 Non-Perennial 413 63 0 0 304 282 Without Premises 706 60 0 0 484 22 Social Group
3 i) SC 110 12 0 0 81 24 ii) ST 225 16 0 0 127 115 iii) OBC 270 14 0 0 172 96 Ownership (without Power) 2359 410 5 1 1959 3407 i) Govt. & PSU 1967 152 0 0 1967 1528 ii) Private Non-Profit inst. 56 11 1 1 48 109 iii) Private Unincorp Propri 1911 371 4 0 1343 27110 iv) Private Unincorp Partner 1 0 0 0 1 011 iv) Private Corp non finance 14 0 0 0 13 012 iv) Private Corp finance 0 0 0 0 0 013 iv) Private Co-operative 73 10 0 0 73 10
Source: Economic Census, 2005.

68
Table: 1.45
Number of Employment in Selected Characteristics of Establishments.
Sr.No.
Characteristics
Number of Persons usually working (Non Agricultural) Total Hired
All Female Child Male Child Female Total Female 1 2 9 10 11 12 13 14 1 Non-Perennial 7061 1269 0 0 6371 12342 Without Premises 19829 780 8 0 15326 683 Social Group
3 i) SC 11285 795 2 0 8004 6784 ii) ST 4426 419 5 1 3479 3475 iii) OBC 14436 1168 2 0 11382 10606 No Power ownership 146464 28414 22 7 131092 276667 i) Govt. & PSU 264940 66787 16 7 264940 667878 ii) Private Non-Profit inst. 10267 3489 13 10 9602 34399 iii) Private Unincorp Propri 159848 13763 42 4 128833 1247910 iv) Private Unincorp Partner 6884 878 0 0 6523 85911 iv) Private Corp non finance 3978 564 0 0 3892 55712 iv) Private Corp finance 841 78 0 0 767 7713 iv) Private Co-operative 5540 1491 2 1 5314 1479
Source: Economic Census, 2005.

69
Table: 1.46
District wise number and Percentage of Mandays Generated For Women in Himachal Pradesh Under MGNREGA.
Sr.No. District 2011-12 2012-13 2013-14
Mandays (In Lakh)
Percentage Mandays (In Lakh)
Percentage Mandays (In Lakh)
Percentage
1 2 3 4 5 6 7 8 1 Bilaspur 3.74 56 6.94 56 6.74 55 2 Chamba 13.41 43 17.27 46 14.84 47 3 Hamirpur 9.91 75 9.28 74 9.35 75 4 Kangra 37.42 67 31.49 71 37.94 72 5 Kinnaur 2.11 77 2.55 75 3.50 69 6 Kullu 10.05 58 9.79 58 10.53 58 7 Lahaul Spiti 0.83 63 0.79 68 1.04 68 8 Mandi 54.38 75 54.7 75 50.94 76 9 Shimla 11.45 47 11.24 49 8.51 51
10 Sirmaur 4.33 24 4.82 28 5.24 32 11 Solan 6.69 42 4.92 42 4.46 44 12 Una 6.02 58 5.26 60 6.02 63
Source: Rural Development Department.

70
Table: 1.47
Progress of Literacy since 1951
Year Literacy Rate
Male Female Total 1 2 3 4
1951 11.94 4.02 7.98
1961 30.94 11.12 21.03
1971 43.19 20.23 31.71
1981 53.19 31.46 42.33
1991 75.36 52.13 63.75
2001 85.35 67.42 76.48
2011 89.53 75.93 82.80
Source: Census of India.

71
Table: 1.48
District-wise Literacy Rates
Sr.No.
District
1991 Census 2001 Census 2011 Census Male Female Combined Male Female Combined Male Female Combined
1 2 3 4 5 6 7 8 9 10 11 1 Bilaspur 77.97 56.55 67.17 86.0 69.5 77.8 91.16 77.97 84.59 2 Chamba 59.96 28.57 44.70 76.4 48.8 62.9 82.59 61.67 72.17 3 Hamirpur 85.11 65.90 74.88 90.2 75.7 82.5 94.36 82.62 88.15 4 Kangra 80.12 61.39 70.57 87.5 73.0 80.1 91.49 80.02 85.67 5 Kinnaur 72.04 42.04 58.36 84.3 64.4 75.2 87.27 70.96 80.00 6 Kullu 69.64 38.53 54.82 84.0 60.9 72.9 87.39 70.91 79.40 7 Lahaul Spiti 71.78 38.05 56.82 82.8 60.7 73.1 85.69 66.84 76.81 8 Mandi 76.65 49.12 62.74 85.9 64.8 75.2 89.56 73.66 81.53 9 Shimla 75.96 51.75 64.61 87.2 70.1 79.1 89.59 77.13 83.64
10 Sirmaur 63.20 38.45 51.62 79.4 60.4 70.4 85.61 71.36 78.80 11 Solan 74.67 50.69 63.30 84.8 66.9 76.6 89.56 76.97 83.68 12 Una 81.15 61.01 70.91 87.7 73.2 80.4 91.89 81.11 86.53
H.P. 75.36 52.13 63.86 85.3 67.4 76.5 89.53 75.93 82.80
Source: Census of India-2011.

72
Table: 1.49
Literacy Rates among the Scheduled Castes Population -2011 Census.
Sr.No District Male Female Total
1 2 3 4 5 1 Bilaspur 88.0 74.2 81.2
2 Chamba 79.7 59.3 69.6
3 Hamirpur 91.9 80.3 85.9
4 Kangra 88.1 74.7 81.4
5 Kinnaur 85.6 69.0 77.3
6 Kullu 83.6 66.1 75.1
7 Lahaul Spiti 90.0 69.1 80.0
8 Mandi 85.9 69.1 77.5
9 Shimla 85.9 71.4 78.8
10 Sirmaur 81.4 67.5 74.7
11 Solan 86.7 72.6 79.9
12 Una 90.8 78.5 84.7
H.P. 86.2 71.5 78.9
Source: Census of India-2011.

73
Table: 1.50
Literacy Rates among the Scheduled Tribes Population -2011 Census.
Sr.No District Male Female Total
1 2 3 4 5 1 Bilaspur 84.6 66.0 75.5
2 Chamba 80.3 58.0 69.1
3 Hamirpur 92.6 78.2 85.4
4 Kangra 82.8 65.7 74.1
5 Kinnaur 89.2 71.5 80.0
6 Kullu 90.2 76.0 83.2
7 Lahaul Spiti 86.9 67.2 76.9
8 Mandi 83.8 68.2 75.9
9 Shimla 79.8 70.8 75.5
10 Sirmaur 69.7 48.7 59.7
11 Solan 82.5 63.0 73.1
12 Una 87.8 71.8 80.0
H.P. 83.2 64.2 73.6
Source: Census of India-2011.

74
Table: 1.51
Enrolment in Various Schools in Himachal Pradesh.
Year/ District Primary Schools Middle Schools High/Sr.Sec.Schools
Boys Girls Total Boys Girls Total Boys Girls Total 1 2 3 4 5 6 7 8 9 10
2012-13 188357 192342 380699 132418 130360 262778 206316 200023 4063392013-14 178303 182743 361046 126592 126649 253241 200682 192227 392909District: Bilaspur 8750 8981 17731 6585 6484 13069 11095 10702 21797Chamba 22200 22620 44820 13924 13424 27348 18901 16693 35594Hamirpur 8095 8080 16175 6857 6686 13543 13359 12578 25937Kangra 24618 25906 50524 22155 21821 43976 44793 41415 86208Kinnaur 2124 2220 4344 1354 1567 2921 1595 1817 3412Kullu 13872 14549 28421 9281 9913 19194 12286 12759 25045Lahaul Spiti 764 843 1607 461 474 935 563 699 1262Mandi 25820 27491 53311 19345 20047 39392 30290 30018 60308Shimla 21458 22058 43516 13233 13828 27061 21198 21287 42485Sirmaur 19903 20251 40154 12321 12615 24936 16204 16255 32459Solan 16947 16736 33683 10907 10634 21541 14841 14313 29154Una 13752 13008 26760 10169 9156 19325 15557 13691 29248
Source: Education Department, H.P.
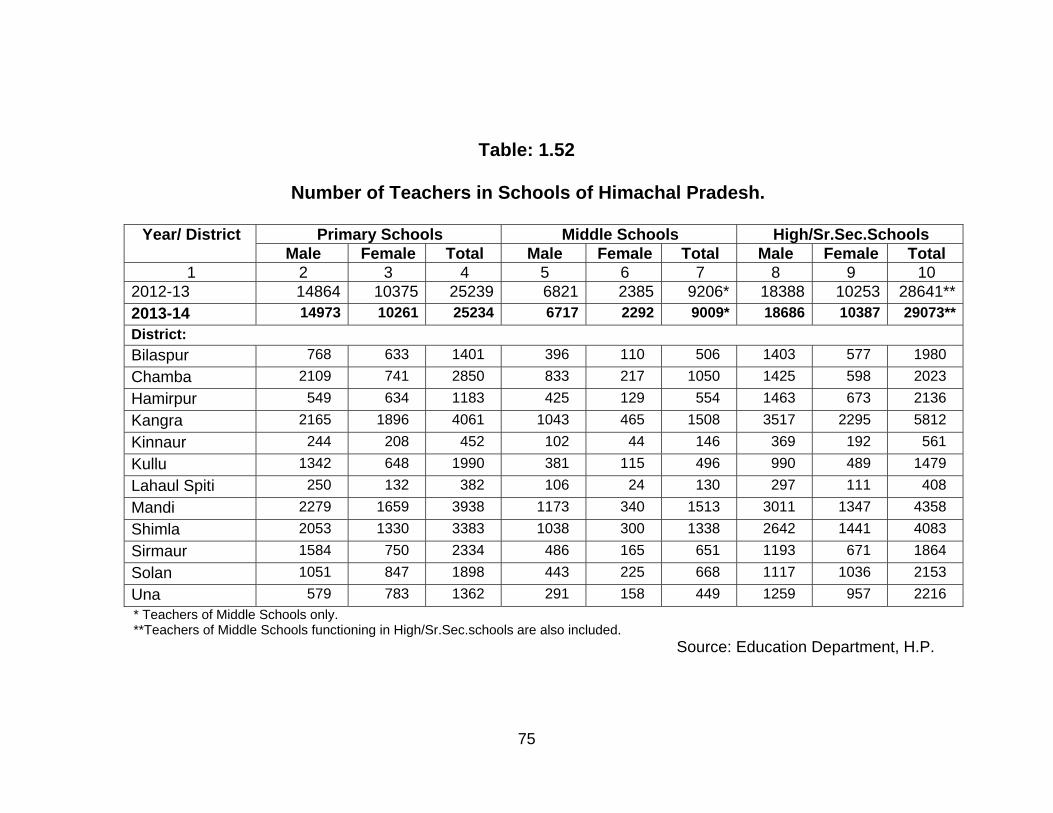
75
Table: 1.52
Number of Teachers in Schools of Himachal Pradesh.
Year/ District Primary Schools Middle Schools High/Sr.Sec.Schools Male Female Total Male Female Total Male Female Total
1 2 3 4 5 6 7 8 9 10 2012-13 14864 10375 25239 6821 2385 9206* 18388 10253 28641**2013-14 14973 10261 25234 6717 2292 9009* 18686 10387 29073**District: Bilaspur 768 633 1401 396 110 506 1403 577 1980Chamba 2109 741 2850 833 217 1050 1425 598 2023Hamirpur 549 634 1183 425 129 554 1463 673 2136Kangra 2165 1896 4061 1043 465 1508 3517 2295 5812Kinnaur 244 208 452 102 44 146 369 192 561Kullu 1342 648 1990 381 115 496 990 489 1479Lahaul Spiti 250 132 382 106 24 130 297 111 408Mandi 2279 1659 3938 1173 340 1513 3011 1347 4358Shimla 2053 1330 3383 1038 300 1338 2642 1441 4083Sirmaur 1584 750 2334 486 165 651 1193 671 1864Solan 1051 847 1898 443 225 668 1117 1036 2153Una 579 783 1362 291 158 449 1259 957 2216* Teachers of Middle Schools only. **Teachers of Middle Schools functioning in High/Sr.Sec.schools are also included.
Source: Education Department, H.P.

76
Table: 1.53
Number of Seats Reserved for Women Representatives in Panchayats, Pradhan Gram Panchayat (Term 2011 to 2016)
Sr.No
District
Total Posts
Posts Reserved For Scheduled
Castes
Posts Reserved For Scheduled
Tribes
Posts Reserved For OBC
Reserv-ation
For generalWomen
Reservation For Women
Reservation Percentage (%)
General Women General Women General Women Total % SC ST OBC 1 2 3 4 5 6 7 8 9 10 11 12 13 14 15 1 Bilaspur 151 19 20 0 0 4 5 51 76 50.33 25.83 0.00 5.96
2 Chamba 283 25 27 43 46 2 3 67 143 50.53 18.37 31.45 1.77
3 Hamirpur 229 26 29 0 0 11 11 75 115 50.22 24.02 0.00 9.61
4 Kangra 760 78 85 0 0 50 58 241 384 50.53 21.45 0.00 14.21
5 Kinnaur 65 0 0 32 33 0 0 0 33 50.77 0.00 100.00 0.00
6 Kullu 204 30 31 1 2 0 0 69 102 50.00 29.90 1.47 0.00
7 Lahaul Spiti 41 0 0 20 21 0 0 0 21 51.22 0.00 100.00 0.00
8 Mandi 473 68 72 0 0 9 11 157 240 50.74 29.60 0.00 4.23
9 Shimla 363 51 55 0 0 5 5 124 184 50.69 29.20 0.00 2.75
10 Sirmaur 228 35 39 1 2 9 11 63 115 50.44 32.46 1.32 8.77
11 Solan 211 32 35 0 0 4 5 67 107 50.71 31.75 0.00 4.27
12 Una 235 26 28 0 0 15 18 73 119 50.64 22.98 0.00 14.04
H.P. 3243 390 421 97 104 109 127 987 1639 50.54 25.01 6.20 7.28
Source: Panchayati Raj Department, H.P.

77
Table: 1.54
Number of Seats Reserved for Women Representatives in Panchayats, Member Gram Panchayat (Term 2011 to 2016)
Sr.No
District
Total Posts
Posts Reserved For Scheduled
Castes
Posts Reserved For Scheduled
Tribes
Posts Reserved For OBC
Reserv-ation For
general Women
Reservation For Women
Reservation Percentage (%)
General Women General Women General Women Total % SC ST OBC
1 2 3 4 5 6 7 8 9 10 11 12 13 14 15 1 Bilaspur 1011 90 171 5 22 0 0 388 581 57.47 25.82 2.67 0.00
2 Chamba 1585 77 228 176 278 0 0 428 934 58.93 19.24 28.64 0.00
3 Hamirpur 1341 94 242 0 0 0 0 543 785 58.54 25.06 0.00 0.00
4 Kangra 4554 271 761 0 0 0 0 1893 2654 58.28 22.66 0.00 0.00
5 Kinnaur 359 8 34 133 165 0 0 12 211 58.77 11.70 83.01 0.00
6 Kullu 1228 128 226 2 26 0 0 462 714 58.14 28.83 2.28 0.00
7 Lahaul Spiti 209 0 22 72 85 0 0 17 124 59.33 10.53 75.12 0.00
8 Mandi 2877 289 570 1 34 0 0 1072 1676 58.26 29.86 1.22 0.00
9 Shimla 2077 205 401 0 3 0 0 813 1217 58.59 29.18 0.14 0.00
10 Sirmaur 1390 169 277 5 9 0 0 523 809 58.20 32.09 1.01 0.00
11 Solan 1345 162 262 0 0 0 0 513 775 5762 31.52 0.00 0.00
12 Una 1437 94 218 0 0 0 0 619 837 58.25 21.71 0.00 0.00
H.P. 19413 1587 3412 394 622 0 0 7283 11317 58.30 25.75 5.23 0.00
Source: Panchayati Raj Department, H.P.

78
Table: 1.55
Number of Seats Reserved for Women Representatives in Panchayats, Chairman Panchayat Simiti (Term 2011 to 2016)
Sr.No
District
Total Posts
Posts Reserved For Scheduled
Castes
Posts Reserved For Scheduled
Tribes
Posts Reserved For OBC
Reserv-ation
For generalWomen
Reservation For Women
Reservation Percentage (%)
General Women General Women General Women Total % SC ST OBC 1 2 3 4 5 6 7 8 9 10 11 12 13 14 15 1 Bilaspur 3 0 1 0 0 0 0 1 2 66.67 33.33 0.00 0.00
2 Chamba 7 0 1 1 1 0 0 2 4 57.14 14.29 28.57 0.00
3 Hamirpur 6 0 1 0 0 0 1 1 3 50.00 16.67 0.00 16.67
4 Kangra 15 1 2 0 0 1 1 5 8 53.33 20.00 0.00 13.33
5 Kinnaur 3 0 0 1 2 0 0 0 2 66.67 0.00 100.00 0.00
6 Kullu 5 0 1 0 0 0 0 2 3 60.00 20.00 0.00 0.00
7 Lahaul Spiti 2 0 0 1 1 0 0 0 1 50.00 0.00 100.00 0.00
8 Mandi 10 1 2 0 0 0 1 2 5 50.00 30.00 0.00 10.00
9 Shimla 10 1 2 0 0 0 0 3 5 50.00 30.00 0.00 0.00
10 Sirmaur 6 1 1 0 0 0 1 1 3 50.00 33.33 0.00 16.67
11 Solan 5 1 1 0 0 0 0 2 3 60.00 40.00 0.00 0.00
12 Una 5 0 1 0 0 0 1 1 3 60.00 20.00 0.00 20.00
H.P. 77 5 13 3 4 1 5 20 42 54.55 23.38 9.09 7.79
Source: Panchayati Raj Department, H.P.

79
Table: 1.56
Number of Seats Reserved for Women Representatives in Panchayats, Member Panchayat Samities (Term 2011 to 2016)
Sr.No
District
Total Posts
Posts Reserved For Scheduled
Castes
Posts Reserved For Scheduled
Tribes
Posts Reserved For OBC
Reserv-ation
For generalWomen
Reservation For Women
Reservation Percentage (%)
General Women General Women General Women Total % SC ST OBC 1 2 3 4 5 6 7 8 9 10 11 12 13 14 15 1 Bilaspur 93 11 12 0 0 3 4 31 47 50.54 24.73 0.00 7.53
2 Chamba 136 11 14 20 25 1 1 30 70 51.47 18.38 33.09 1.47
3 Hamirpur 125 15 16 0 0 4 8 41 65 52.00 24.80 0.00 9.60
4 Kangra 374 36 43 0 0 20 27 115 185 49.47 21.12 0.00 12.57
5 Kinnaur 45 1 3 15 17 0 0 4 24 53.33 8.89 71.11 0.00
6 Kullu 103 14 17 1 1 0 0 36 54 52.43 30.10 1.94 0.00
7 Lahaul Spiti 30 0 2 11 12 0 0 3 17 56.67 6.67 76.67 0.00
8 Mandi 244 34 37 0 0 4 6 83 126 51.64 29.10 0.00 4.10
9 Shimla 179 24 27 0 0 2 3 63 93 51.96 28.49 0.00 2.79
10 Sirmaur 120 18 20 0 1 6 6 35 62 51.67 31.67 0.83 10.00
11 Solan 118 17 20 0 0 2 3 38 61 51.69 31.36 0.00 4.24
12 Una 115 11 15 0 0 6 9 35 59 51.30 22.61 0.00 13.04
H.P. 1682 192 226 47 56 48 67 514 863 51.31 24.85 6.12 6.84
Source: Panchayati Raj Department, H.P.

80
Table: 1.57
Number of Seats Reserved for Women Representatives in Panchayats, Chairman Zila Parishad (Term 2011 to 2016)
Sr.No
District
Total Posts
Posts Reserved For Scheduled
Castes
Posts Reserved For Scheduled
Tribes
Posts Reserved For OBC
Reserv-ation For
general Women
Reservation For Women
Reservation Percentage (%)
General Women General Women General Women Total % SC ST OBC
1 2 3 4 5 6 7 8 9 10 11 12 13 14 15 1 Bilaspur 1 0 0 0 0 0 0 0 0 0.00 0.00 0.00 0.00
2 Chamba 1 0 0 0 0 0 0 0 0 0.00 0.00 0.00 0.00
3 Hamirpur 1 0 0 0 0 0 0 1 1 100.00 0.00 0.00 0.00
4 Kangra 1 0 0 0 0 0 1 0 1 100.00 0.00 0.00 100.00
5 Kinnaur 1 0 0 1 0 0 0 0 0 0.00 0.00 100.00 0.00
6 Kullu 1 0 0 0 0 0 0 0 0 0.00 0.00 0.00 0.00
7 Lahaul Spiti 1 0 0 0 1 0 0 0 1 100.00 0.00 100.00 0.00
8 Mandi 1 1 0 0 0 0 0 0 0 0.00 100.00 0.00 0.00
9 Shimla 1 0 0 0 0 0 0 0 0 0.00 0.00 0.00 0.00
10 Sirmaur 1 0 1 0 0 0 0 0 1 100.00 100.00 0.00 0.00
11 Solan 1 0 1 0 0 0 0 0 1 100.00 100.00 0.00 0.00
12 Una 1 0 0 0 0 0 0 1 1 100.00 0.00 0.00 0.00
H.P. 12 1 2 1 1 0 1 2 6 50.00 25.00 16.67 8.33
Source: Panchayati Raj Department, H.P.

81
Table: 1.58
Number of Seats Reserved for Women Representatives in Panchayats,
Member Zila Parishad (Term 2011 to 2016)
Sr.No
District
Total Posts
Posts Reserved For Scheduled
Castes
Posts Reserved For Scheduled
Tribes
Posts Reserved For OBC
Reser-vation
For generalWomen
Reservation For Women
Reservation Percentage (%)
General Women General Women General Women Total % SC ST OBC 1 2 3 4 5 6 7 8 9 10 11 12 13 14 15 1 Bilaspur 14 2 2 0 0 0 1 4 7 50.00 28.57 0.00 7.14
2 Chamba 18 2 2 2 3 0 0 4 9 50.00 22.22 27.78 0.00
3 Hamirpur 18 2 2 0 0 1 1 6 9 50.00 22.22 0.00 11.11
4 Kangra 56 6 6 0 0 4 4 18 28 50.00 21.43 0.00 14.29
5 Kinnaur 10 0 1 3 4 0 0 0 5 50.00 10.00 70.00 0.00
6 Kullu 14 2 2 0 0 0 0 5 7 50.00 28.57 0.00 0.00
7 Lahaul Spiti 10 0 1 3 4 0 0 1 6 60.00 10.00 70.00 0.00
8 Mandi 36 5 6 0 0 1 1 11 18 50.00 30.56 0.00 5.56
9 Shimla 24 3 4 0 0 0 0 8 12 50.00 29.17 0.00 0.00
10 Sirmaur 17 2 3 0 0 1 1 5 9 52.94 29.41 0.00 11.76
11 Solan 17 2 3 0 0 0 1 5 9 52.94 29.41 0.00 5.88
12 Una 17 2 2 0 0 1 1 6 9 52.94 23.53 0.00 11.76
H.P. 251 28 34 8 11 8 10 73 128 51.00 24.70 7.57 7.17
Source: Panchayati Raj Department, H.P.

82
Table: 1.59
Number of Women Elected on Un-Reserved Seats in
Gram panchayats (Term 2011-2016)
Sr.No. District No of Women Elected on Un-Reserved seats
Pradhan Up-Pradhan Members
1 2 3 4 5
1 Bilaspur 2 0 7
2 Chamba 5 0 2
3 Hamirpur 2 0 34
4 Kangra 13 5 186
5 Kinnaur 1 2 17
6 Kullu 0 1 1
7 Lahaul Spiti 0 1 6
8 Mandi 3 3 43
9 Shimla 2 1 13
10 Sirmaur 0 2 13
11 Solan 3 2 5
12 Una 1 3 25
H.P. 32 20 352
Source: - Panchayati Raj Department,H.P.

83
Table: 1.60
Number of Women Elected on Un-Reserved Seats in Panchayat Samities (Term 2011-2016)
Sr.No. District No of Women Elected on Un-Reserved seats
Chairman Vice-Chairman Members 1 2 3 4 5 1 Bilaspur 0 0 2
2 Chamba 0 0 1
3 Hamirpur 0 0 2
4 Kangra 3 6 8
5 Kinnaur 0 2 2
6 Kullu 0 0 1
7 Lahaul Spiti 0 0 3
8 Mandi 0 2 3
9 Shimla 0 0 1
10 Sirmaur 0 1 1
11 Solan 0 0 1
12 Una 0 0 0
H.P. 3 11 25
Source: - Panchayati Raj Department,H.P.

84
Table: 1.61
Number of Women Elected on Un-Reserved Seats in
Zila Parishad (Term 2011-2016)
Sr.No. District No of Women Elected on Un-Reserved seats Chairman Vice-Chairman Members
1 2 3 4 5 1 Bilaspur 0 0 0
2 Chamba 1 0 1
3 Hamirpur 0 0 0
4 Kangra 0 0 1
5 Kinnaur 1 0 0
6 Kullu 0 1 1
7 Lahaul Spiti 0 0 0
8 Mandi 0 1 0
9 Shimla 0 0 0
10 Sirmaur 0 0 1
11 Solan 0 0 0
12 Una 0 0 0
H.P. 2 2 4
Source: - Panchayati Raj Department,H.P.

85
Table: 1.62
Number of Electors and Percentage Voting in Various General Election of the State
General Election
Year
Total number of electors Percentage of electors participatingin the election
Female Male Total Female Male Total 1 2 3 4 5 6 7 8
First 1952 .. .. 531018 .. .. 33.86* Second 1957 .. .. 676659 .. .. 59.94* Third 1962 .. .. 710624 .. .. 34.52* Fourth 1967 .. .. 1582103 .. .. 51.22 Fifth 1972 .. .. 1805448 .. .. 49.95 Sixth 1977 969744 1027661 1997405 45.39 54.61 58.57 Seventh 1982 1109961 1101563 2211524 48.63 51.37 71.06 Eighth 1985 1183713 1173219 2356932 49.13 50.87 70.36 Ninth 1990 1511087 1547307 3058394 48.11 51.89 67.74 Tenth 1993 1624429 1643296 3267725 49.36 50.64 71.71 Eleventh 1998 1801571 1827293 3628864 50.35 49.65 71.23 Twelfth 2003 2019973 2081120 4101093 49.25 50.75 74.51 Thirteenth 2007 2267604 2336839 4604443 74.06 69.23 71.61 Fourteenth 2012 2373379 2234980 4608359 69.39 77.87 73.51
* Calculated on the basis of valid votes polled.
Source: Election Department, H.P.

86
Table: 1.63
Year-Wise Number of Different Crimes against Women in Himachal Pradesh
Year
Head of Crimes Dowry Death Rape Murder
1 2 3 4 1998 7 128 40 1999 5 109 36 2000 3 129 34 2001 10 124 36 2002 6 137 28 2003 6 126 31 2004 8 153 29 2005 2 141 24 2006 3 113 24 2007 7 159 30 2008 3 157 36 2009 1 182 37 2010 2 160 27 2011 4 168 34 2012 2 183 30 2013 0 250 28
Source: Director General of Police, H.P.

87
Table: 1.64
District-wise Number of Total Crimes against Women in Himachal Pradesh.
District Year
2010 2011 2012 2013 1 2 3 4 5
Bilaspur 99 63 73 144 Chamba 77 77 54 77 Hamirpur 107 61 63 110 Kangra 202 229 204 298 Kinnaur 15 15 13 23 Kullu 59 96 65 135 Lahaul Spiti 4 1 3 3 Mandi 181 160 162 202 Shimla 114 120 125 185 Sirmaur 93 97 82 110 Solan 87 97 95 77 Una 107 96 85 159 H.P. 1145 1112 1024 1523
Source: Director General of Police, H.P.
Table: 1.65
Year-wise Incidence of Cognizable Crime by
Female in Himachal Pradesh.
Source: Director General of Police, H.P.
Head of crime 2011 2012 Total Female Total Female
1 2 3 4 5 Murder 132 17 112 19 Dacoity 1 0 2 0 Robbery 10 0 9 0 Burglary 861 9 782 3 Theft 1042 21 769 20 Riots 529 177 494 204 Other Crimes 11841 1247 10482 1176
Total 14416 1471 12650 1422

88
Table: 1.66
District wise/year wise Disposal of Total Cognizable Crimes by Courts under IPC in Himachal Pradesh.
District
Year
Total Cases for Trial during the year including cases carried
over from previous year
Number of cases compounded and
withdrawn
Cases in which trial were completed Cases pending for trial at the end of
year Total Cases convicted Cases Acquitted
Total Female Total Female Total Female Total Female Total Female Total Female 1 2 3 4 5 6 7 8 9 10 11 12 13 14
Bilaspur 2009 7287 563 98 23 289 37 73 0 216 37 6900 503
2010 7848 683 38 9 316 48 70 0 246 48 7494 626
2011 8346 737 58 22 308 67 59 2 249 65 7980 648
2012 8787 756 77 27 327 72 52 0 275 72 8383 657
Chamba 2009 3555 506 109 14 338 29 85 7 253 22 3108 463
2010 3651 546 85 9 315 37 66 5 249 32 3251 500
2011 3763 569 88 12 261 41 54 10 207 31 3414 516
2012 3889 571 98 14 360 39 79 10 281 29 3431 518
Hamirpur 2009 4203 672 136 28 505 35 70 5 435 30 3562 609
2010 4348 733 110 32 330 29 67 3 263 26 3908 672
2011 4620 782 105 18 310 47 108 7 202 40 4205 717
2012 4931 837 289 26 332 63 66 4 266 59 4310 748
Kangra 2009 9845 2286 - - 1151 39 275 4 876 35 8694 2247
2010 10491 2466 - - 540 45 74 6 466 39 9951 2421
2011 11902 2649 - - 743 35 131 5 612 30 11159 2614
2012 13253 2878 - - 472 7 103 1 369 6 12781 2871
Contd...

89
Table: 1.66
District wise/year wise Disposal of Total Cognizable Crimes by Courts under IPC in Himachal Pradesh.
District
Year
Total Cases for Trial during the year including cases carried
over from previous year
Number of cases compounded and
withdrawn
Cases in which trial were completed Cases pending for trial at the end of
year Total Cases convicted Cases Acquitted
Total Female Total Female Total Female Total Female Total Female Total Female 1 2 3 4 5 6 7 8 9 10 11 12 13 14
Kullu 2009 3863 962 92 20 244 45 49 6 195 39 3527 898
2010 4145 1052 103 32 311 73 62 10 249 63 3731 947
2011 4507 1070 142 33 342 70 109 10 233 60 4023 967
2012 4610 1063 84 14 297 53 87 21 210 32 4229 996
Kinnaur 2009 1874 240 40 1 193 27 36 22 157 5 1641 212
2010 2053 294 34 9 154 25 59 16 95 9 1865 260
2011 2143 286 32 9 136 8 68 6 68 2 1975 269
2012 2300 295 29 4 163 10 42 2 121 8 2108 281
Lahaul 2009 229 34 24 6 86 5 59 5 27 0 119 23
Spiti 2010 168 33 25 3 58 9 41 8 17 1 85 21
2011 175 33 5 1 92 11 80 9 12 2 78 21
2012 163 36 0 0 92 20 68 12 24 8 71 16
Mandi 2009 10098 1819 9 1 1190 310 246 12 944 297 8899 1508
2010 10442 1822 17 1 996 29 159 4 837 25 9429 1792
2011 10756 2034 223 5 796 35 168 2 628 33 9737 1994
2012 11116 2254 49 12 1357 64 162 3 1195 61 9740 2178
Contd...

90
Table: 1.66
District wise/year wise Disposal of Total Cognizable Crimes by Courts under IPC in Himachal Pradesh.
District
Year
Total Cases for Trial during the year including cases carried
over from previous year
Number of cases compounded and
withdrawn
Cases in which trial were completed Cases pending for trial at the end of
year Total Cases convicted Cases Acquitted
Total Female Total Female Total Female Total Female Total Female Total Female 1 2 3 4 5 6 7 8 9 10 11 12 13 14
Shimla 2009 7997 128 276 2 1156 7 159 1 957 6 6556 119
2010 7752 130 283 6 1162 12 159 5 1003 7 6307 112
2011 7479 161 247 6 664 3 129 0 535 3 6575 152
2012 8303 76 103 11 423 12 100 2 323 10 7777 53
Sirmaur 2009 3501 415 48 12 217 30 48 2 169 28 3226 373
2010 3981 468 34 8 199 20 52 2 147 18 3748 440
2011 4435 512 56 14 519 56 94 7 425 49 3860 442
2012 4602 540 73 13 573 49 122 4 451 45 3956 478
Solan 2009 7054 738 156 9 985 21 430 2 555 19 5913 708
2010 6861 820 93 11 768 46 301 13 467 33 6000 763
2011 7163 857 140 20 886 48 367 8 519 40 6137 789
2012 7237 840 178 33 1056 55 575 24 521 31 6003 752
Una 2009 4550 579 80 27 617 121 217 28 400 93 3853 431
2010 4604 669 39 14 406 100 106 13 300 87 4159 555
2011 4898 762 84 32 409 128 74 21 335 107 4405 602
2012 5008 801 72 26 1242 216 189 19 1053 197 3694 559
Source: - Police Department, Himachal Pradesh. Conclude.
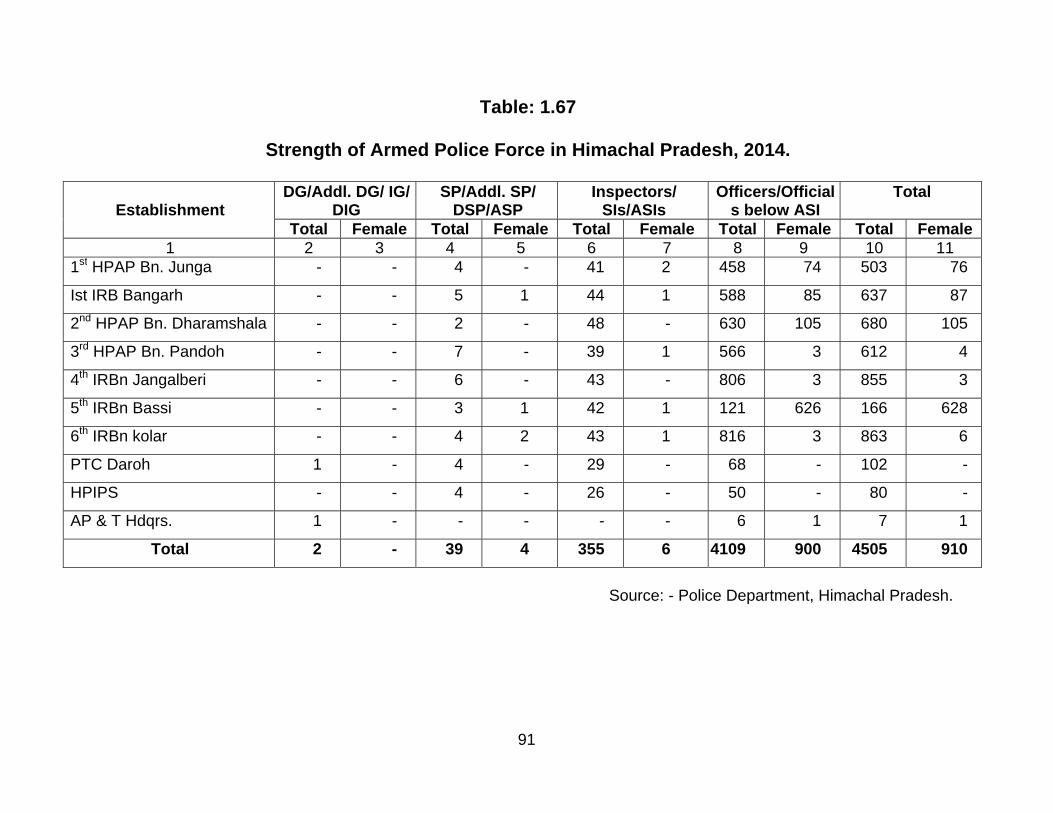
91
Table: 1.67
Strength of Armed Police Force in Himachal Pradesh, 2014.
Establishment
DG/Addl. DG/ IG/ DIG
SP/Addl. SP/ DSP/ASP
Inspectors/ SIs/ASIs
Officers/Officials below ASI
Total
Total Female Total Female Total Female Total Female Total Female1 2 3 4 5 6 7 8 9 10 11
1st HPAP Bn. Junga - - 4 - 41 2 458 74 503 76
Ist IRB Bangarh - - 5 1 44 1 588 85 637 87
2nd HPAP Bn. Dharamshala - - 2 - 48 - 630 105 680 105
3rd HPAP Bn. Pandoh - - 7 - 39 1 566 3 612 4
4th IRBn Jangalberi - - 6 - 43 - 806 3 855 3
5th IRBn Bassi - - 3 1 42 1 121 626 166 628
6th IRBn kolar - - 4 2 43 1 816 3 863 6
PTC Daroh 1 - 4 - 29 - 68 - 102 -
HPIPS - - 4 - 26 - 50 - 80 -
AP & T Hdqrs. 1 - - - - - 6 1 7 1
Total 2 - 39 4 355 6 4109 900 4505 910
Source: - Police Department, Himachal Pradesh.

92
Table: 1.68 Strength of Un-Armed Police Forces in Himachal Pradesh, 2014.
District/Establishment
Inspectors/ SIs/ASIs Officers/Officials below ASI Total Total Female Total Female Total Female
Bilaspur 69 1 530 35 599 36Chamba 66 0 616 40 682 40Hamirpur 61 3 324 25 385 28Kangra 160 1 1120 63 1280 64Kinnaur 34 0 322 15 356 15Kullu 66 1 374 38 440 39Lahaul Spiti 24 0 182 7 206 7Mandi 113 3 794 46 907 49Shimla 142 0 1341 78 1483 78Sirmaur 52 3 538 41 590 44Solan 98 4 715 71 813 75Una 58 1 390 22 448 23Total 943 17 7246 481 8189 498Other establishments: Police Hqrs. 0 0 9 0 9 0AP&T 0 0 7 1 7 1IGP/SR 0 0 4 0 4 0IGP /NR 0 0 4 0 4 0IGP /CR 0 0 4 0 4 0State C.I.D. 156 5 369 42 525 47F.S.L. 0 0 8 0 8 0Wireless 227 1 119 11 346 12Railways & Traffic 16 1 63 16 79 17PTC 24 0 60 0 84 0Institution of Police studies 18 0 25 2 43 2SV & ACB 89 3 172 22 261 25Total 530 10 844 94 1374 104Grand Total 1473 27 8090 575 9563 602
Source: Police Department, Himachal Pradesh.

93
Table: 1.69
Statement showing the cases Received by the Himachal Pradesh State Women Commission.
Year
Cases of Harassment by
Husband/ Father-in-Law and
Mother-in-Law
Cases of Harassment
at Work Place
Cases of Harassment
by Neighbours
Cases of Murder/ Death
Cases of
Dowry
Cases of Harassment
By Wives
Rape Cases
Cases Related to
Department
Other Cases
Total Cases
1 2 3 4 5 6 7 8 9 10 11 1999-2000 44 2 11 4 3 2 2 8 53 129
2000-01 54 5 4 2 3 - 4 21 29 122 2001-02 185 4 5 - - 8 3 34 146 385 2002-03 179 7 27 5 8 9 6 31 158 430 2003-04 320 7 14 4 4 9 5 20 203 586 2004-05 346 6 22 6 7 10 5 20 186 608 2005-06 365 5 19 6 8 9 5 20 167 604 2006-07 429 6 14 7 8 10 5 39 323 841 2007-08 278 11 17 5 13 13 3 32 97 469 2008-09 191 18 62 22 25 42 20 75 40 495 2009-10 277 19 88 7 6 43 8 35 116 599 2010-11 219 15 21 57 11 1 6 97 52 479 2011-12 197 13 49 3 1 54 4 8 127 456 2012-13 269 8 56 9 2 61 - 15 119 539 2013-14 288 9 85 8 - 74 - 13 112 589
Source: - H.P. State Women Commission.

94
Table: 1.70 Representation of Women in the Rajya Sabha.
Representation of Women in the Rajya Sabha
Year Number of all Members Number of Women Members
1990 245 24 1994 245 20 1996 245 18 1997 245 18 1998 245 19 1999 245 19 2000 245 22 2001 245 22 2002 245 25 2003 245 25 2004 245 28 2011 241 26
Source: - Rajya Sabha Secretariat, New Delhi.
Table: 1.71
Representation of Women in the Central Council of
Ministers.
Representation of Women in the Central Council of Ministers Year Number of Ministers Number of Women Ministers
Cabinet
Minister
Minister of
State
Deputy Ministe
r
Cabinet
Minister
Minister of
State
Deputy Ministe
r
1985a
15 25 0 1 3 0
1990b
17 17 5 0 1 1
1995c
12 37 3 1 4 1
1996d
18 21 0 0 1 0
1997e
20 24 0 0 5 0
1998f 21 21 0 1 3 0 2002g
32 41 0 2 6 0
2004h
29 39 0 1 6 0

95
2011i 34 37 0 2 4 0 a=As on 4th February g= As on January Source: - Lok Sabha Secretariat, New Delhi. b=As on 31st August h=As on 25th May c=As on 31st January i= Including Prime Minister d=As on 5th August j= Including 2 MOS (independent Charge. e=As on 10th June f=As on 19th March Total Number of Women Members in 15th Lok Sabha 60/542.
Table: 1.72
Number of Judges by Sex in Supreme Court/High Courts, As on 1st April, 2014.
Name of the
Court Number of Judges
Female Male Total
1 2 3 4 Supreme Court 2 29 31 High Courts: Allahabad 3 63 66 Andhra Pradesh 1 19 20 Mumbai 6 37 43 Calcutta 3 28 31 Chhattisgarh 0 5 5 Delhi 5 22 27 Gauhati 1 11 12 Gujarat 3 21 24 Himachal Pradesh
0 5 5
Jammu & Kashmir
0 7 7
Jharkhand 1 8 9 Karnataka 2 29 31 Kerala 1 25 26 Madhya Pradesh 2 23 25 Chennai 5 33 38 Manipur 0 2 2 Meghalaya 0 3 3 Orissa 1 14 15 Patna 2 24 26 Punjab & Haryana
3 30 33
Rajasthan 3 17 20 Sikkim 0 2 2

96
Tripura 0 4 4 Uttaranchal 0 7 7
Total 44 468 512
Source: Department of Justice, Ministry of Law and Justice, New Delhi.
Table: 1.73
Females Employees in Central Government in India.
Year No. of employees Percentage of females employees out of Total
employees Female Total(In Lakh)
1 2 3 4 1971 67869 26.99 2.51 1972 70874 27.51 2.58 1973 72879 28.58 2.55 1974 80371 29.12 2.76 1975 84051 29.70 2.83 1976 99272 30.45 3.26 1978 102321 31.01 3.30 1979 107172 31.71 3.38 1980 117139 33.21 3.53 1982 132010 34.78 3.80 1984 142011 36.14 3.93 1988 238984 36.99 6.46 1989 247158 37.48 6.60 1990 283380 37.74 7.51 1991 288999 38.13 7.58 1995 295721 39.82 7.43 2001 291800 38.76 7.53 2004 306298 31.64 9.68 2006 320335 31.16 10.28 2008 314097 31.12 10.09 2009 311002 30.99 10.04
Source: Census of Central Govt. Employees, Directorate of Employment & Training, Ministry of Labour, New Delhi.