wolters kluwer 2005 half-year results
DESCRIPTION
TRANSCRIPT

1
3 August 2005 - Amsterdam
Q2/HY 2005 Results
Nancy McKinstry Chairman Executive Board/CEO
Boudewijn BeerkensMember Executive Board/CFO
3 August 2005 - AmsterdamQ2/HY 2005 Results 2
Agenda
Highlights
Key Performance Indicators
Divisional Operating Performance
Financial Performance
Outlook & Summary
Q&A
2
3 August 2005 - AmsterdamQ2/HY 2005 Results 3
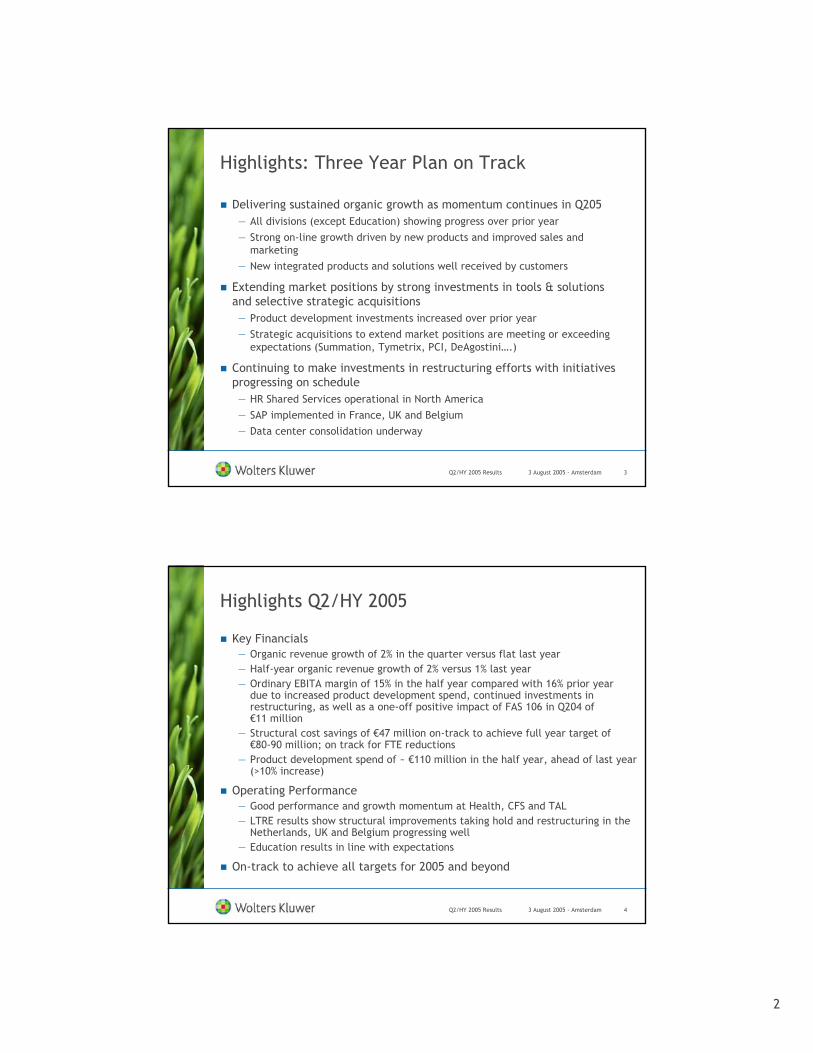
Highlights: Three Year Plan on Track
Delivering sustained organic growth as momentum continues in Q205— All divisions (except Education) showing progress over prior year
— Strong on-line growth driven by new products and improved sales and marketing
— New integrated products and solutions well received by customers
Extending market positions by strong investments in tools & solutions and selective strategic acquisitions— Product development investments increased over prior year
— Strategic acquisitions to extend market positions are meeting or exceeding expectations (Summation, Tymetrix, PCI, DeAgostini….)
Continuing to make investments in restructuring efforts with initiatives progressing on schedule— HR Shared Services operational in North America
— SAP implemented in France, UK and Belgium
— Data center consolidation underway
3 August 2005 - AmsterdamQ2/HY 2005 Results 4
Highlights Q2/HY 2005
Key Financials— Organic revenue growth of 2% in the quarter versus flat last year — Half-year organic revenue growth of 2% versus 1% last year— Ordinary EBITA margin of 15% in the half year compared with 16% prior year
due to increased product development spend, continued investments in restructuring, as well as a one-off positive impact of FAS 106 in Q204 of €11 million
— Structural cost savings of €47 million on-track to achieve full year target of €80-90 million; on track for FTE reductions
— Product development spend of ~ €110 million in the half year, ahead of last year (>10% increase)
Operating Performance— Good performance and growth momentum at Health, CFS and TAL — LTRE results show structural improvements taking hold and restructuring in the
Netherlands, UK and Belgium progressing well— Education results in line with expectations
On-track to achieve all targets for 2005 and beyond

3
3 August 2005 - AmsterdamQ2/HY 2005 Results 5
** After Tax *** Fully diluted
WACC is currently 8% after tax
Well On-Track to Achieve 2005 Guidance
€0.51
n/a
€182 mln
111%
16%
1%
HY04
€0.44
n/a
€23 mln
57%
15%
2%
HY05
€0.27
n/a
€11 mln
61%
17%
2%
Q205
€0.17
n/a
€12 mln
53%
14%
2%
Q105
€0.92-€1.01€1.02Ordinary EPS***
6-7%7%ROIC %**
≥ €250 mln€456 mlnOrdinary free cash flow
1-2%1%Organic revenue growth
15-16%16%Ordinary EBITA margin
95-105%
Target 2005*
126%Cash conversion
Key Financial Measures
2004Key Operational Measures
* At constant currencies EUR/USD 1.24
3 August 2005 - AmsterdamQ2/HY 2005 Results 6
(USD)(EUR)
(USD)(EUR)
16
3327
202160
Q205
20
3932
191158
Q204
0
0
Acquisition/Divestment
Change (million)
(5)
2
Total
(8)10Revenues
0(5)Ord. EBITA
Ord. EBITA margin%
CurrencyOrganicMillions
Health ResultsOrganic growth of 6% for the quarter and 4% for HY, on-track to achieve full year guidance of 3-5%
All customer units contributing to revenue growth, driven by:
— New product introductions— Strong online revenue growth (16%) — Good customer adoption of electronic drug
information/business intelligence tools
Margins impacted by investments in new products and FAS106 in Q204 ($ 4 mln)
Pharma Solutions
18%
Clinical Tools7%
Medical Research
45%
Professional & Education
30%
4
3 August 2005 - AmsterdamQ2/HY 2005 Results 7
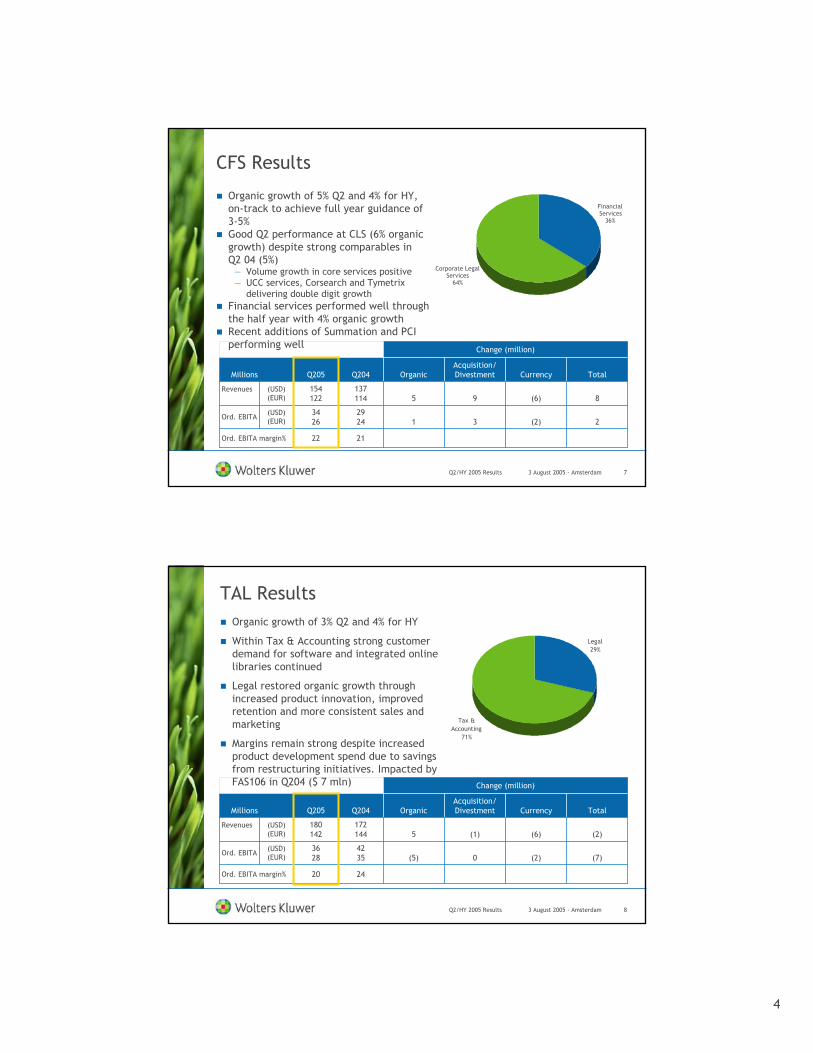
CFS Results
Financial Services
36%
Corporate Legal Services
64%
(USD)(EUR)
(USD)(EUR)
22
3426
154122
Q205
21
2924
137114
Q204
3
9
Acquisition/Divestment
Change (million)
2
8
Total
(6)5Revenues
(2)1Ord. EBITA
Ord. EBITA margin%
CurrencyOrganicMillions
Organic growth of 5% Q2 and 4% for HY, on-track to achieve full year guidance of 3-5%Good Q2 performance at CLS (6% organic growth) despite strong comparables in Q2 04 (5%)
— Volume growth in core services positive— UCC services, Corsearch and Tymetrix
delivering double digit growthFinancial services performed well through the half year with 4% organic growthRecent additions of Summation and PCI performing well
3 August 2005 - AmsterdamQ2/HY 2005 Results 8
TAL Results
Legal29%
Tax & Accounting
71%
(USD)(EUR)
(USD)(EUR)
20
3628
180142
Q205
24
4235
172144
Q204
0
(1)
Acquisition/Divestment
Change (million)
(7)
(2)
Total
(6)5Revenues
(2)(5)Ord. EBITA
Ord. EBITA margin%
CurrencyOrganicMillions
Organic growth of 3% Q2 and 4% for HY
Within Tax & Accounting strong customer demand for software and integrated online libraries continued
Legal restored organic growth through increased product innovation, improved retention and more consistent sales and marketing
Margins remain strong despite increased product development spend due to savings from restructuring initiatives. Impacted by FAS106 in Q204 ($ 7 mln)

5
3 August 2005 - AmsterdamQ2/HY 2005 Results 9
LTRE ResultsFlat organic growth; improvement on last year (-3%)
Growth momentum in Spain, France, Central Europe and Italy continued
Restructuring progressing well in the Netherlands, UK and Belgium
Continued strong on-line growth across the board
Plans fully in place to manage further pruning of products
FR18%
IT/SP19%
GER/CEE15%
TLR6%
BEL8%
UK13%
SC3%
NL18%
15
49
322
Q205
17
56
335
Q204
(1)
(10)
Acquisition/Divestment
Change (million)
(7)
(13)
Total
0(3)Revenues (EUR)
1(7)Ord. EBITA (EUR)
Ord. EBITA margin%
CurrencyOrganicMillions
3 August 2005 - AmsterdamQ2/HY 2005 Results 10
Education ResultsResults in line with expectations (1% organic growth for Q2; -1% for HY) and on track to achieve 1-2% organic growth for 2005
Performance Education second half weighted
Good HY performance in the Netherlands and Belgium; challenging markets remain in Sweden and Germany
Margins strong as 2004 restructuring yields savings
Other5%
Netherlands30%
Sweden34%
UK22%
Germany / Aus9%
25
21
88
Q205
24
21
87
Q204
0
0
Acquisition/Divestment
Change (million)
0
1
Total
01Revenues (EUR)
(1)1Ord. EBITA (EUR)
Ord. EBITA margin%
CurrencyOrganicMillions

6
3 August 2005 - AmsterdamQ2/HY 2005 Results 11
Supporting the integrated businesses
Off-shoring
Shared Services
Restructuring On-Track
Increased bandwidth with utilization of offshore IT and editorial resourcesExpansion of production and editorial center in Kuala Lumpur
SAP operational in France, UK and BelgiumHuman Resources shared services operational in NA
Business unitrestructuring
UK, Belgium and the Netherlands progressing well
Global contentPlatform
First release in August 2005
Data centerconsolidation
Operations and personnel transferred to outsource provider
3 August 2005 - AmsterdamQ2/HY 2005 Results 12
3 Year Strategy & Restructuring
± 800 (200 incr. spend over 3 yr period)
200+80
(CC = 265)
200+70
(CC = 255)
200+50
(AC = 220)
200Product development spend
± 215
103025-Non-exceptional restructuringcosts
-104496Exceptional restructuringcosts
100-110 (run-rate)
± 1800
Total
100-110
200
2006E
80-90
400
2005E
724521FTEreductions
7029Total cost savings
20042003EUR Million
AC = actual currenciesCC = constant currencies

7
3 August 2005 - AmsterdamQ2/HY 2005 Results 13
Impact of Restructuring
47
181
7
16
HY05
30
549
37
7
HY04
25
98
4
7
Q205
16
289
34
4
Q204
309253Non-exceptional restructuring costs
103443Exceptional restructuring costs
80-90
400
FY05E
22
83
Q105
724260FTE reductions
7014Total cost savings
FY04Q104EUR Million
3 August 2005 - Amsterdam
Financials
Boudewijn BeerkensMember Executive Board/CFO

8
3 August 2005 - AmsterdamQ2/HY 2005 Results 15
Financial Highlights
On-track to achieve FY KPI’s— Acceleration of organic revenue growth of 1% in HY04 to 2% in HY05
— Ordinary EBITA margin of 15% in the half year compared with 16% prior year due to increased product development spend, continued investments in restructuring, as well as a one-off positive impact of FAS 106 in Q204 of €11 million ($14 million)
— Increased restructuring expenditure (Shared services US, Fix and Transform and ETC in Europe) and increased product development spend (mainly CFS and Health)
Increased Financing costs due to IFRS
Net income in-line with last year at €106 million
Effective tax rate on pre-tax ordinary income of 28% is slightly below last year (28.5%)
Net debt increased with 4% to € 1.9 bln from € 1.8 bln due to acquisition spending
3 August 2005 - AmsterdamQ2/HY 2005 Results 16
Key Financials
(6)
2
Organic Growth
%
(6)
(5)
(5)
1
Constant Currencies
%
1415EBITA margin %
1615Ordinary EBITA margin %
(14)
(12)
(7)
(1)
Actual Currencies
%
1,6031,580Revenues
261242Ordinary EBITA
150132Ordinary Net Income
18223Free cash flow
€0.51€0.44Ordinary EPS (fully diluted)
HY04HY05EUR Million
9
3 August 2005 - AmsterdamQ2/HY 2005 Results 17
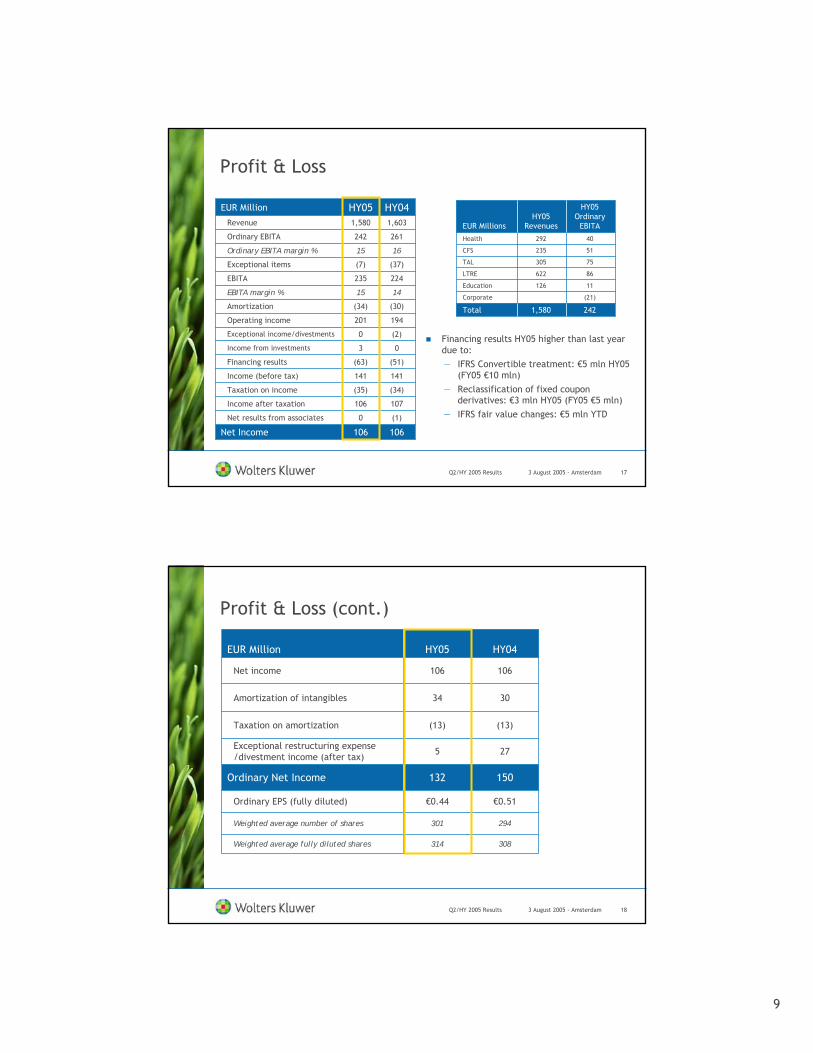
Profit & Loss
(2)0Exceptional income/divestments
(37)(7)Exceptional items
(30)(34)Amortization
1615Ordinary EBITA margin %
(1)0Net results from associates
107106Income after taxation
(34)(35)Taxation on income
141141Income (before tax)
(51)(63)Financing results
03Income from investments
194201Operating income
1415EBITA margin %
224235EBITA
1,6031,580Revenue
261242Ordinary EBITA
106106Net Income
HY04HY05EUR Million
(21)Corporate
2421,580Total
11126Education
86622LTRE
305
235
292
HY05Revenues
75
51
40
HY05Ordinary
EBITA
Health
CFS
TAL
EUR Millions
Financing results HY05 higher than last year due to:— IFRS Convertible treatment: €5 mln HY05
(FY05 €10 mln) — Reclassification of fixed coupon
derivatives: €3 mln HY05 (FY05 €5 mln) — IFRS fair value changes: €5 mln YTD
3 August 2005 - AmsterdamQ2/HY 2005 Results 18
Profit & Loss (cont.)
294301Weighted average number of shares
€0.51€0.44Ordinary EPS (fully diluted)
275Exceptional restructuring expense /divestment income (after tax)
(13)(13)Taxation on amortization
106106Net income
3034Amortization of intangibles
150132Ordinary Net Income
308314Weighted average fully diluted shares
HY04HY05EUR Million

10
3 August 2005 - AmsterdamQ2/HY 2005 Results 19
4632Deferred tax
3,0823,332Capital Employed
191200Provisions
2,0932,124Long-term liabilities
752976Group equity
(205)(480)Working capital
(1,934)(1,941)Total current liabilities
3,2873,812Total fixed assets
1,7291,461Total current assets
3,0823,332Total Financing
Dec 04June 05EUR Million
Consolidated Balance Sheet
Increase in fixed assets related to:
- Acquisitions (De Agostini, PCi, Nolis)
- Currency effect (stronger $)
Shareholders’ equity increase due to stronger US dollar and net income
3 August 2005 - AmsterdamQ2/HY 2005 Results 20
Cash Flow from Operating Activities
377Exceptional restructuring expense
20960Cash Flow from Operating Activities
315177Cash Flow from Operations
38Other
(28)(23)Appropriation of reorganizing provisions
(40)(38)Paid corporate income tax
(41)(64)Financing costs
4(109)Autonomous movements in working capital
194201Operating Income
8078Amortization & Depreciation
HY04HY05EUR Million Lower Cash flow from operations due to:
- increase in product development and restructuring spending
- increase of working capital including payments of royalties, profit sharing and bonuses
Financing costs higher due to interest payment on new € 700 m bond issued in 2003

11
3 August 2005 - AmsterdamQ2/HY 2005 Results 21
Cash Flow from Investments
-46Movement in bank overdrafts
-1Divestment of activities
-1Dividends received
(83)(18)Cash Flow Financing
(52)(288)Cash Flow Investments
20960Cash Flow from Operating Activities
(82)(69)Dividend payments
(1)(3)Movement in (long-term) loans
-8Exercise of stock options
-30Cash from derivatives
(25)(282)Acquisition spending
(27)(38)Capital expenditure fixed assets
HY04HY05EUR Million
Higher Capital expenditure due to IT spend in LTRE (UK - SAP) and US Shared Services (Perot transition)
Higher acquisition spending is mainly due to recent De Agostiniacquisition
Cash from derivatives: realized swap gains (FY 2005 will be € 100 m)
Dividend 2004 57% stock versus 49% over 2003
3 August 2005 - AmsterdamQ2/HY 2005 Results 22
0011Dividends received
404687Cash and cash equivalents as at January 1
18223Free Cash Flow
(27)(38)Capital expenditure fixed assets
20960Cash flow from operating activities
480447Cash and Cash Equivalents as at June 30
74(246)Net Cash Flow
26Exchange differences on cash equivalents
(83)(18)Cash flow financing
20960Cash flow from operating activities
(52)(288)Cash flow investments
HY04HY05EUR Million
Free Cash Flow
12
3 August 2005 - AmsterdamQ2/HY 2005 Results 23
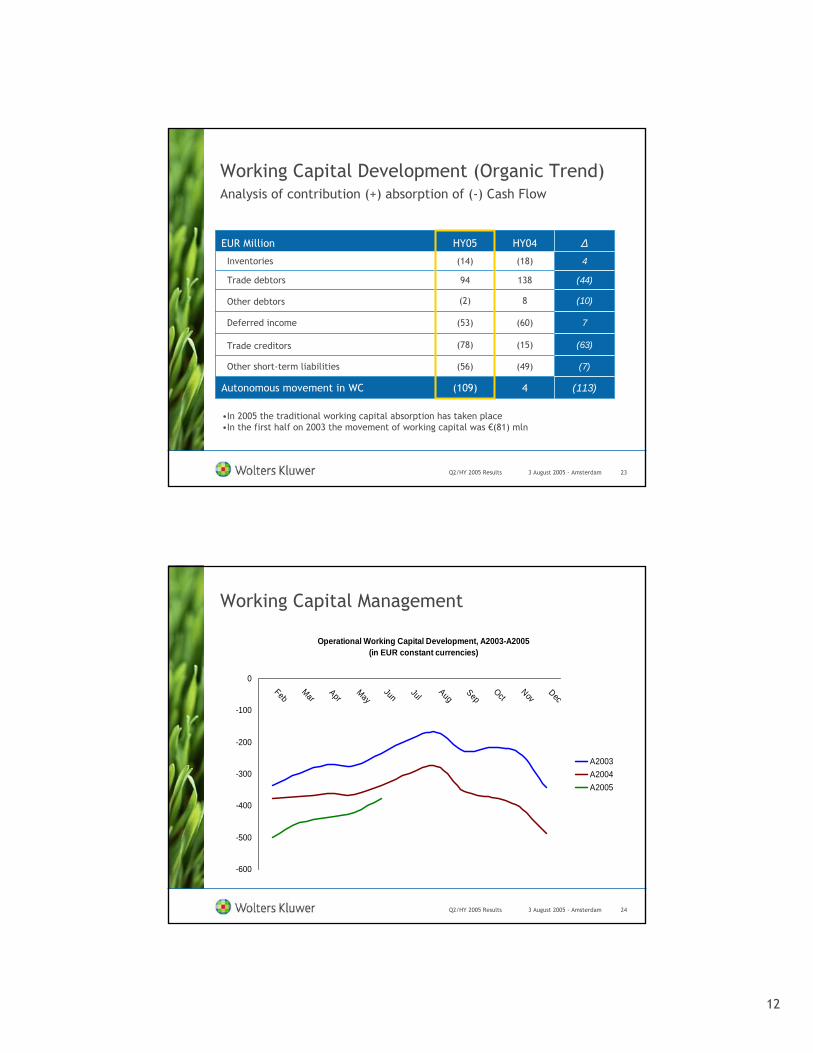
Working Capital Development (Organic Trend)
(113)
(7)
(63)
7
(10)
(44)
4
∆
(109)
(56)
(78)
(53)
(2)
94
(14)
HY05
(49)Other short-term liabilities
(15)Trade creditors
(60)Deferred income
4Autonomous movement in WC
8Other debtors
(18)Inventories
138Trade debtors
HY04EUR Million
Analysis of contribution (+) absorption of (-) Cash Flow
•In 2005 the traditional working capital absorption has taken place•In the first half on 2003 the movement of working capital was €(81) mln
3 August 2005 - AmsterdamQ2/HY 2005 Results 24
Operational Working Capital Development, A2003-A2005 (in EUR constant currencies)
-600
-500
-400
-300
-200
-100
0Feb
MarApr
MayJun Jul
AugSep
OctNov
Dec
A2003A2004A2005
Working Capital Management

13
3 August 2005 - AmsterdamQ2/HY 2005 Results 25
Acquisitions HY 2005
Acquisitions: Revenues
— De Agostini Professionale / UTET (Italy) - € 70 mln
— PCi (US) - $ 21 mln
— Nolis (France) - € 7 mln
— Eon (Romania) - € 1 mln
Total acquisition spending €282 million; including earn-outs of past deals
Total consideration on acquisitions was €295 million
All acquisitions are accretive to ordinary EPS in year 1 and cover their cost of capital within 3 to 5 years
3 August 2005 - AmsterdamQ2/HY 2005 Results 26
Summary
Supporting Operational Performance
Strong Financial Position
Facilitating growth opportunities

14
3 August 2005 - Amsterdam
Outlook
Nancy McKinstry Chairman Executive Board/CEO
3 August 2005 - AmsterdamQ2/HY 2005 Results 28
The Professional’s First Choice
Execute restructuring
Commitment to thoroughly know and understand our customers
Extend positions inhighest return markets
Deliver stronger growth
2005 Outlook: Growth Momentum Continues
Support the integrated businessShared services; Global Platform, SAP, Off-shoringData center consolidation
HealthCFSTax & Accounting
Continued investmentsNew productsStronger customer relationship

15
3 August 2005 - AmsterdamQ2/HY 2005 Results 29
2005 Outlook & Beyond: Reiterated
** After Tax *** Fully diluted
WACC is currently 8% after tax
€1.40-€1.50 €0.92-€1.01€1.02€1.18Ordinary EPS***
≥ WACC
≥ €300 mln
~ 100%
19-20%
4%
2007 Onwards*
95-105%126%109%Cash conversion
6-7%
≥ €250 mln
15-16%
1-2%
Target 2005*
1%-2%Organic Revenue growth
16%18%Ordinary EBITA margin
Key Financial Measures
7%7%ROIC %**
€456 mln€393 mlnOrdinary free cash flow
20042003Key Operational Measures
* At constant currencies EUR/USD 1.24
3 August 2005 - AmsterdamQ2/HY 2005 Results 30
Summary
Fulfilling the Promise to Be…
Momentum to deliver stronger and sustained growth
Restructuring progressing well with cost savings on target for full year
Customer adoption of online and integrated tools and solutions affirms core WK strategy
Three year strategy yielding results on all fronts

16
3 August 2005 - AmsterdamQ2/HY 2005 Results 31
The Professional’s First Choice
Provide information, tools and solutions to help professionals make their most critical decisions
effectively and improve their productivity
3 August 2005 - Amsterdam
Q2/HY 2005 Results
Nancy McKinstry Chairman Executive Board/CEO
Boudewijn BeerkensMember Executive Board/CFO