without cover india health report nutrition 2015 · urban 0 10 20 30 40 50 60 70 80 90 100 82.7%...
TRANSCRIPT

5POPULATION
3,673,9175
SHARE OF INDIA’S POPULATION
0.3%
1.76
Fertility Rate
322,5665
Children under 5
56,2755
Newborns
787.7Per Capita Net
8 State Domestic Product
14.1%
NA10
State Hunger Index
0.2Rural
0.3Urban
0 10 20 30 40 50 60 70 80 90 100
82.7%
49%51%
73.8%26.2%
17.8% 31.7%
This section highlights the demographic composition of the state in terms of male-female, rural-urban, and SC-ST ratios, literacy and
fertility rates. In addition, it also includes the size of the population of newborns and children less than five years of age (as of the Census of
India, 2011) to illustrate the size of the target population for nutrition-related interventions that need to reach this vulnerable population.
I. CONTEXT
A. DEMOGRAPHIC CONTEXT
5 Source : Primary Census Abstract, Census, 2011
6 Source : SRS, 2009
7 Source : Planning Commission Estimates: NSSO 66th round-Employment and Unemployment Survey, 2009-10
8 Source : Press Releases and Statements, Ministry of Statistics and Programme Implementation, 2013-14 : http://mospi.nic.in/Mospi_New/site/inner.aspx?status=3&menu_id=82
9 Source : Press Note on Poverty Estimates, 2011-12, Planning Commission, Government of India, 2011-12 : http://planningcommission.nic.in/news/pre_pov2307.pdf
10 Source : IFPRI, India State Hunger Index, 2009
TRIPURA
5Female Literacy (7 years and above)
5Scheduled Caste / Tribe population
AGINI COEFFICIENT
7of Consumption
A : Gini coefficient is a measure of inequality of distribution. A Gini coefficient of 0 represents perfect equality, while a value of 100 implies perfect inequality. (See Appendix A for more information)
Population below
State Specific9
Poverty line
5Male / Female population
5Urban / Rural population

This section illustrates trends in mortality in neonates, infants and children under 5 years, since 1992. The purpose of this is to highlight the
success achieved by individual states in averting deaths of children since the economic growth of the 1990s.
UNDER-5 MORTALITY RATE NEONATAL MORTALITY RATEINFANT MORTALITY RATE
1992-93 | NFHS-1 1998-99 | NFHS-2 2006 | NFHS-3 2013 | SRS
B. CHILD MORTALITY PER THOUSAND LIVE BIRTHS
75.8
51.3
104.6
28.6
43.644.2
51.5
59.2
NA
33.1
NA
26
This section presents data on nutrition outcome indicators (stunting, wasting, and underweight) and anemia prevalence. Anthropometric
measures for children under 5 (stunting, wasting, and underweight) are presented over time periods, by age groups and by background
characteristics. This data aims to convey the prevalence and severity of undernutrition in the state.
II. NUTRITIONAL STATUS AMONG CHILDREN
NFHS-3 2006 RSoC 2014
STUNTING WASTING UNDERWEIGHT
Moderate Severe
35.7
31
Moderate
30.5
SevereModerate Severe
Figu
res
insi
de g
raph
s ar
e in
per
cent
ages
State’s share in the total number of stunted
11children in India
1in
1010.9%
1in
67
State’s share in the total number
*of wasted 11
children in India
1.5%1in
88
State’s share in the total number of underweight
11children in India
1.1%
* Wasting is subject to seasonal variations either in food supply or disease prevalence and hence may not be comparable across groups of children measured at different times of the year within a
survey round as well as between different survey rounds.
11 Source : NFHS-3, 2006
24.6
17.1
39.6
8.67
15.7 16.814.7 15
TRIPURA
A. CHILD UNDERNUTRITION , BY TIME PERIOD
ANTHROPOMETRIC MEASURES
Stunting is inadequate height for age, which is indicative of chronic or cumulative nutritional deprivation in early childhood. A stunted child's
height-for-age is below -2 standard deviations from the median height-for-age (termed HAZ) of the WHO Child Growth Standards, while a
severely stunted child is below -3 standard deviations.
Wasting is inadequate weight for height, which points to acute or short-term undernutrition. A wasted child's weight-for-height (WHZ) is
below -2 standard deviations from the WHO Child Growth Standards; a severely wasted child is below -3 standard deviations. (Another way
to determine severe wasting or severe acute malnutrition is through a measurement of a child's mid-upper arm circumference (MUAC).
Underweight is inadequate weight for age, a composite indicator that encompasses stunting and wasting. An underweight child's weight-
for-age (WAZ) is below -2 standard deviations from the WHO Child Growth Standards; again, a severely underweight child is below -3
standard deviations.

In this section, child undernutrition outcomes are presented, along with key socioeconomic drivers that are known to be associated with
child nutrition, such as caste, residence, mother's health and education, and household income.
C. PREVALENCE OF CHILD UNDERNUTRITION , BY BACKGROUND CHARACTERISTICS
<6 6-11 12-23 24-35 36-47 48-59 <6 6-11 12-23 24-35 36-47 48-59 <6 6-11 12-23 24-35 36-47 48-59
WASTINGSTUNTING UNDERWEIGHT
Severe | X-axis indicates Age in Months | Y-axis indicates prevalence rates in percentages Moderate
Percentage of moderate (below -2 SD from the WHO growth standards) and severe (below -3 SD) stunting, wasting and underweight are
available for 6 age groups among children under 5.
No
edu
cati
on
< 5
yea
rs c
ompl
ete
5-9
yea
rs c
ompl
ete
10
or
mor
e ye
ars
com
plet
e
Low
est
Sec
ond
Mid
dle
Four
th
Hig
hest
Und
erw
eigh
t (B
MI b
elow
18
.5)
Nor
mal
(B
MI1
8.5
-24
.9)
Ove
rwei
ght
(BM
I mor
e th
an 2
5.0
)
0
10
20
30
40
50
60
70
12 Source : NFHS-3, 2006
12MOTHERS' EDUCATION
12WEALTH INDEX
12MOTHERS' BMI
22.723.8
35.8
41.638.4
38
12.812.3
12.9
13.8
19
15.6
30.5 27.9
15.2
27.524.3 26.4
14.9
10.26
10.2
8.8 6.1
36.3 3234.1
37.7
47.9
43.8
23.5
16.4
10.3
15.317.6
15.9
Wasting UnderweightStunting
CASTE
Wasting UnderweightStunting
Rural Urban Rural Urban Rural Urban
RESIDENCE
0
20
30
50
60
70
80
40
10
0
20
30
50
60
70
80
40
10
TRIPURA
Scheduled Caste
Scheduled Tribe
Other Backward
Class
Others Scheduled Caste
Scheduled Tribe
Other Backward
Class
Others Scheduled Caste
Scheduled Tribe
Other Backward
Class
Others
Stunting Wasting Underweight | Y-axis indicates prevalence rates in percentages
NFHS-3 2006 RSoC 2014 | Y-axis indicates prevalence rates in percentages
NFHS-3 2006 RSoC 2014 | Y-axis indicates prevalence rates in percentages
12B. CHILD UNDERNUTRITION , BY AGE GROUPS

Anemia can impair physical and cognitive development among children and create long term impacts on productivity and wellbeing. This
section features data on anemia prevalence by severity and age groups for children under 5.
D. ANEMIA PREVALENCE
0 20 40 60 80 100
6-11 months
12-23 months
24-35 months
36-47 months
48-59 months
Mild Moderate Severe
0 10 20 30 40 50 60 70 80
Mild
Moderate
Severe
Any Anemia
13Anemia Status, by hemoglobin level
13 Source : DLHS-4, 2012-13
14 Source : NFHS-3, 2006
21.3
27
2.9
51.2
24.8 57.3 0
25.6 46.7 1.5
30.8 25.6 0
30 30.8 1.1
25.3 26.2 0.8
14Anemia Prevalence, by age
III. IMMEDIATE DETERMINANTS
15A. INFANT AND YOUNG CHILD FEEDING (IYCF) PRACTICES
This section presents indicators for assessing IYCF practices as recommended by the WHO and revised in 2008. Following optimal IYCF
practices during the first 1,000 days is crucial for early child survival and growth as well as long-term health and wellbeing.
39.9%
57.7%
60.8%
51.9%
15B. CHILD HEALTH
9.8%
7%
3%
15 Source : RSoC, 2014
B The 7 food groups include the following: i. grains, roots and tubers ii. legumes and nuts iii. dairy products (milk, yoghurt, cheese) iv. Flesh foods (meat, fish, poultry, and liver/organ meats) v. eggs vi.
Vitamin-A rich fruits and vegetables vii. other fruits and vegetables.
21%
Children aged 0-23 months breastfed immediately/within an hour of birth
Children aged 6-8 months who were fed complementary foods
For breastfed children (6-23 months)- A. Fed minimum number of times.
Note : At least twice a day for breastfed infants 6-8 months old and at least three times a day for breastfed children 9-23 months old
B. Had minimum dietary diversity B
Note : Minimum dietary diversity refers to four or more food groups fed to children aged 6-23 months
TRIPURA
Children aged 0-5 months who were exclusively breastfed
Prevalence of childhood illnesses (in children aged 0-59 months)
Had diarrhea in 15 days prior to survey
Had fever in 15 days prior to survey
Had symptoms of Acute Respiratory Infection (ARI) in 15 days prior to survey

CBMI levels of women aged 15-49 years
66.1%
11.3%2.4%
20.2%
Thin
Normal
Overweight
Obese
Anemia prevalence in pregnant women aged 15-49 years
16C.2. PREGNANT WOMEN
16C.1. WOMEN 15-49 YEARS OLD
C.3. ADOLESCENT GIRLS
17BMI levels of adolescent girls aged 15-18 years
Thin Overweight and Obese
16.3%
51.9%
Maternal health and nutrition, as well as adolescent nutrition, have important consequences for intergenerational transmission of
undernutrition. Data on Body Mass Index (BMI), anemia prevalence and heightamong women of reproductive age are presented in this
section, as are data on adolescent BMI and anemia.
C. NUTRITIONAL STATUS OF WOMEN AND ADOLESCENT GIRLS
Women aged 15-49 years are anemic
45.6%
1.6%
Mild Moderate Severe None Any
59.8%
1.3%
Normal
31.8%
C Body Mass Index (BMI) is defined as the weight in kilograms by the square of the height in metres (kg/m2).
It is a simple index of weight-for-height which is commonly used to classify underweight, overweight and obesity in adults. Range: BMI<18.5=total thin, BMI 18.5-24.9=normal, BMI 25.0-29.9=Overweight, BMI>30.0=Obese [per WHO Standards]
20.1
16.662.9
37.1
16 Source : DLHS-4, 2012-13
17 Source : RSoC, 2014
17a Source : NFHS-3, 2006
0.4
Women aged 15-49 years are severely anemic
Adolescent girls aged 15-19 years 16
are anemic
Adolescent girls aged 15-19 years 16
are severely anemic
IV. UNDERLYING DETERMINANTS
A. SOCIAL STATUS OF WOMEN
Women's status is recognized to contribute in significant ways to improving nutrition. This section presents indicators that are
representative of women's social status, including measures of education, age at marriage and first birth, employment, decision making and
domestic violence. It also includes the Gender Empowerment Measure that captures gender inequality along three dimensions: political
participation and decision-making power, economic participation and decision-making power, and power over economic resources.
23Currently married women who make decisions about :
Purchases for daily household needs
Major household purchase
Visits to her family/friends/relatives
Own healthcare26.2% 8.9%
32.9% 25.6%
Currently married women who have 10 or more years
18 of schooling25.1%
Women who have experienced any
form of physical/23
sexual/emotional violence
46.6%Ever married women who justify hitting/wife-beating (for either
23of the reasons mentioned)
52.3%
Gender Empowerment
20 Measure 0.4 0.5
National20
AverageD,
TRIPURA
D The Gender Empowerment Measure is a weighted average index based on indicators that are classified into three dimensions: a. political participation and decision-making power b. economic
participation and decision-making power and c. power over economic resources. The index ranges from a minimum of 0 to a maximum of 1, with a higher score indicating greater empowerment of women. (More information available at http://wcd.nic.in/publication/GDIGEReport/Part3.pdf.)
23.6%Female workforce
22participation rate
Women aged 20-24 years who were married
19before the age of 18
40.8%Average age
19at marriage
21
18 Source : DLHS-4, 2012-13
19 Source : RSoC, 2014
20 Source : MoWCD, 2006
22 Source : Women and Men in India, 16th Issue MoSPI, 2014
23 Source : NFHS-3, 2006

C. AGRICULTURE AND FOOD SECURITY
Agriculture productivity and food security can affect household access to foods necessary for a healthy diet. Thus, this section presents
indicators related to agricultural growth and food consumption patterns in the state, indicating the level of food security in the state relative
to the national situation.
Growth rate of
agriculture from 26
2007-2012
1.4%
Share in
India’s total foodgrain 27
production
0.3%
28Mean Calorie intake per person per day (in Kcal)
NA NA 2206
RURAL 2233INDIA AVG TRIPURA INDIA AVG
B. WATER AND SANITATION
Poor hygiene and sanitation, by directly increasing exposure and susceptibility to infections, are associated with undernutrition among
children. This section covers key indicators on access to safe drinking water and availability of sanitation facilities at the state level. It also
includes the expenditure on toilet construction under the Total Sanitation Campaign.
87.2%Households with access to
improved sources of E, 24
drinking water
58%Households using improved
sanitation facilityF, 24
3.5%Households practicing
open defecation24
7.4 MExpenditure on toilets under
G, 25 Total Sanitation Campaign (TSC)
$ 1,065 M25
National Average
URBAN
TRIPURA
28Expenditure on food items by income quintiles
24 Source : RSoC, 2014
25 Source : Indiastat, Rajya Sabha Unstarred Question No. 2950, dated on 30.08.2011, 2011-12
26 Source : Indiastat, complied by datanet from Rajyasabha & Loksabha unstarred questions no. 3039, 4535. 2007-12
27 Source : Indiastat, Ministry of Agriculture, Government of India 2011-2012
28 Source : NSSO, 68th round-Nutritional Intake in India, 2011-12
EGGS, MEAT AND FISH FRUITS INTOXICANTS
5% 10%
VEGETABLES PULSES
5% 10%
Q1
Q5
Q4
Q3
Q2
MILK
10%5% 20%10% 20%10%
E Improved sources of drinking water include: piped water into dwelling, piped water to yard/plot, public tap or standpipe, tubewell or borehole, protected dug well, protected spring, and rainwater (as per
Joint Monitoring Programme definition: http://www.wssinfo.org/definitions-methods/watsan-categories/.FImproved sanitation means households using improved toilets that include: flush toilet, piped sewer system, septic tank, flush/pour flush to pit latrine, ventilated improved pit latrine, pit latrine with
slab, composting toilet, special case (as per Joint Monitoring Programme definition: http://www.wssinfo.org/definitions-methods/watsan-categories/); excludes those households who are using improved toilets but sharing toilet facilities with other households.G Besides toilet construction subsidies, this expenditure also includes funding other activities such as solid and liquid waste management, IEC activities for sustainable demand generation for
sanitation facilities, assistance to production centers of sanitary materials and rural sanitary marts, provision of construction of community sanitary complexes, provision of sanitation facilities in govt. schools and Anganwadis in govt. buildings etc.
2% 4%30%
V. STATUS OF NUTRITION-RELEVANT INTERVENTIONS
A. NUTRITION-SPECIFIC INTERVENTIONS
The financial resources allocated to, and spent on direct nutrition-specific interventions can determine the scale, coverage and quality of
interventions to reach vulnerable target populations. These services, in India, are delivered both by the Integrated Child Development
Scheme (ICDS) and the National Health Mission (NHM). This section includes data on the coverage of interventions delivered by these two
key centrally-sponsored schemes that directly impact maternal and child nutrition and health. We also include here information on the
human resources and service availability of these schemes and expenditures.
A.1. COVERAGE OF ICDS AND NHM:
The Integrated Child Development Services (ICDS) aims to improve the nutrition and health status of children under-six through a package
of services (supplementary nutrition, immunization, health check-up, referral services, etc.) delivered through frontline workers at the
Anganwadi Centres (AWCs). This section provides information on expenditure on ICDS and coverage of its supplementary nutrition
programme (SNP). This section also covers critical services provided by the health system, including provision of care for pregnant women
and child immunization. Immunization plays a crucial role in complementing actions to improve nutrition. The link between undernutrition
and infectious diseases is cyclical, poor nutrition increases vulnerability to infections, which in turn worsen nutrition status. Data on
immunization among children are presented by residence. Here, full immunization refers to children covered with BCG, measles and 3 doses
each of DPT and polio.
29 Source : RSoC, 2014
0%
39.3%
49.5%
0%
Children aged 6-35 months
Children aged 36-71 months
Pregnant women
Lactating women
Beneficiaries who received supplementary food for at least 21 days in the month prior to the survey
27.2%
60%Pregnant women
Lactating mothers
70%
78.4%
Children 6-35 months
Children 36-71 months
29Beneficiaries who availed supplementary food under ICDS
TRIPURA

Women who had live birth in 35 months
where delivery was assisted by skilled
30health provider
80.4%31
WOMEN GIVEN ADVICE ON :
Breastfeeding Nutrition of mother and child
Institutional delivery
Children aged 12-23 months 30
who are fully immunised
Rural
56.2%Urban
68.5% 11.9%Children aged 12-23 months who have not received
30any immunisation
A.2. PERSONNEL CAPACITY OF ICDS AND NRHM:
This section features data on availability of healthcare personnel and services available to women of reproductive age (antenatal care,
tetanus toxoid coverage, iron-folic acid supplementation coverage, institutional delivery and counseling). Household and individual access
to health services can directly impact children's nutrition and welfare during the crucial first 1,000 days of life.
H, 30Availability of Anganwadi Centres and Workers (AWCs and AWWs) Value
*Pending or vacant Anganwadi workers to sanctioned number of workers 0.1%
AWWs living in the AWC village/ward 66.8%
AWWs having 10 or more years of schooling 61.4%
Median age of AWWs 36 years
AWCs serving to population more than the stipulated norm 2.9%
20.9%
94.8%
AWCs having functional baby weighing scale
AWCs having functional adult weighing scale
Growth Monitoring30
Value
93.6%Available WHO growth chart at AWCs
30 Source : RSoC, 2014
31 Source : DLHS-4, 2012-13
* Source : MoWCD, 2012
H Number of AWCs surveyed for Tripura as per RSoC 2014 is 263.
73.1% 70.4% 43.9%
Received 2 or more TT injections prior to delivery
Consumed 100 or more IFA tablets/syrup during
pregnancy
Had Institutional delivery
Received 3 or more antenatal checkupsprior to delivery
67% 89.8% 24.6% 79.5%
30SERVICES PROVIDED TO WOMEN WHO HAD A LIVE BIRTH IN LAST 35 MONTHS
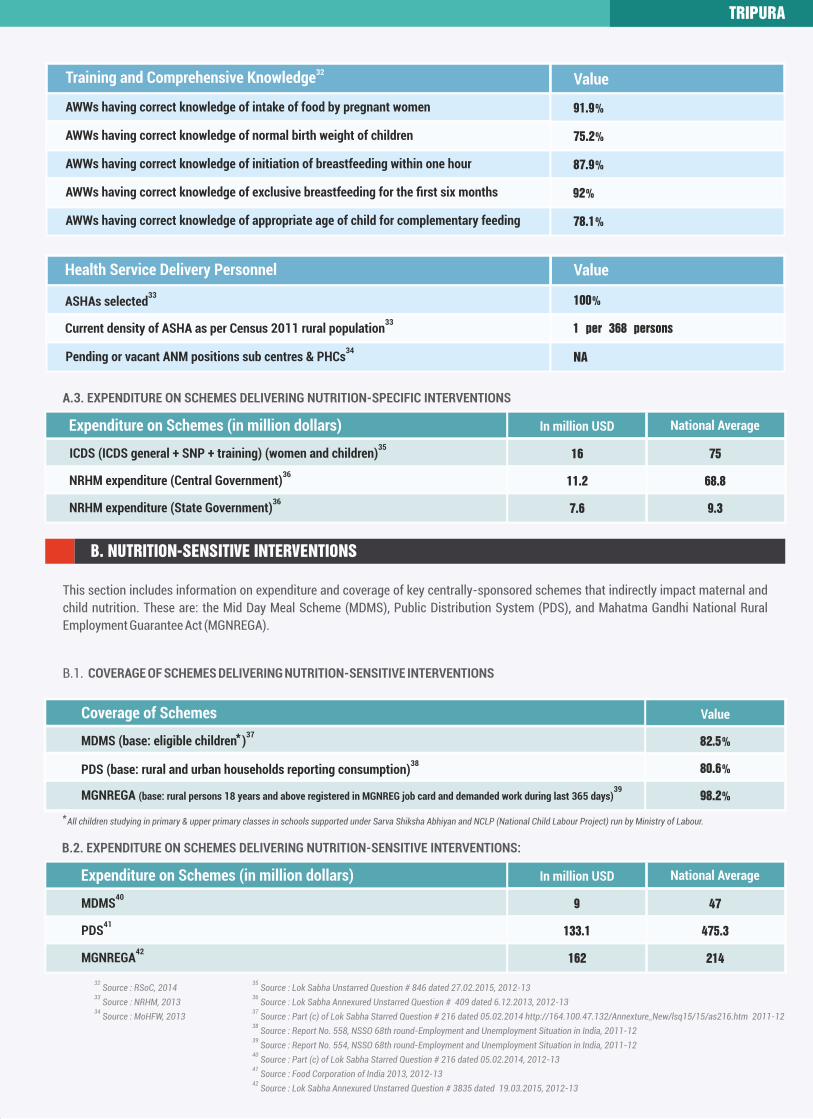
Health Service Delivery Personnel Value
33ASHAs selected 100%
33Current density of ASHA as per Census 2011 rural population 1 per 368 persons
34Pending or vacant ANM positions sub centres & PHCs NA
32Training and Comprehensive Knowledge Value
91.9%
75.2%
87.9%
92%
78.1%
AWWs having correct knowledge of normal birth weight of children
AWWs having correct knowledge of intake of food by pregnant women
AWWs having correct knowledge of exclusive breastfeeding for the first six months
AWWs having correct knowledge of appropriate age of child for complementary feeding
AWWs having correct knowledge of initiation of breastfeeding within one hour
A.3. EXPENDITURE ON SCHEMES DELIVERING NUTRITION-SPECIFIC INTERVENTIONS
Expenditure on Schemes (in million dollars) In million USD
36NRHM expenditure (Central Government)
36NRHM expenditure (State Government)
35ICDS (ICDS general + SNP + training) (women and children)
11.2 68.8
7.6 9.3
16 75
National Average
B. NUTRITION-SENSITIVE INTERVENTIONS
This section includes information on expenditure and coverage of key centrally-sponsored schemes that indirectly impact maternal and
child nutrition. These are: the Mid Day Meal Scheme (MDMS), Public Distribution System (PDS), and Mahatma Gandhi National Rural
Employment Guarantee Act (MGNREGA).
B.1. COVERAGE OF SCHEMES DELIVERING NUTRITION-SENSITIVE INTERVENTIONS
B.2. EXPENDITURE ON SCHEMES DELIVERING NUTRITION-SENSITIVE INTERVENTIONS:
Expenditure on Schemes (in million dollars)
35 Source : Lok Sabha Unstarred Question # 846 dated 27.02.2015, 2012-13
36 Source : Lok Sabha Annexured Unstarred Question # 409 dated 6.12.2013, 2012-13
37 Source : Part (c) of Lok Sabha Starred Question # 216 dated 05.02.2014 http://164.100.47.132/Annexture_New/lsq15/15/as216.htm 2011-12
38 Source : Report No. 558, NSSO 68th round-Employment and Unemployment Situation in India, 2011-12
39 Source : Report No. 554, NSSO 68th round-Employment and Unemployment Situation in India, 2011-12
40 Source : Part (c) of Lok Sabha Starred Question # 216 dated 05.02.2014, 2012-13
41 Source : Food Corporation of India 2013, 2012-13
42 Source : Lok Sabha Annexured Unstarred Question # 3835 dated 19.03.2015, 2012-13
32 Source : RSoC, 2014
33 Source : NRHM, 2013
34 Source : MoHFW, 2013
* All children studying in primary & upper primary classes in schools supported under Sarva Shiksha Abhiyan and NCLP (National Child Labour Project) run by Ministry of Labour.
41PDS
42MGNREGA
40MDMS
In million USD National Average
133.1 475.3
162 214
9 47
Coverage of Schemes
38PDS (base: rural and urban households reporting consumption)
39MGNREGA (base: rural persons 18 years and above registered in MGNREG job card and demanded work during last 365 days)
37*MDMS (base: eligible children )
Value
80.6%
98.2%
82.5%
TRIPURA
Women who had live birth in 35 months
where delivery was assisted by skilled
30health provider
80.4%31
WOMEN GIVEN ADVICE ON :
Breastfeeding Nutrition of mother and child
Institutional delivery
Children aged 12-23 months 30
who are fully immunised
Rural
56.2%Urban
68.5% 11.9%Children aged 12-23 months who have not received
30any immunisation
A.2. PERSONNEL CAPACITY OF ICDS AND NRHM:
This section features data on availability of healthcare personnel and services available to women of reproductive age (antenatal care,
tetanus toxoid coverage, iron-folic acid supplementation coverage, institutional delivery and counseling). Household and individual access
to health services can directly impact children's nutrition and welfare during the crucial first 1,000 days of life.
H, 30Availability of Anganwadi Centres and Workers (AWCs and AWWs) Value
*Pending or vacant Anganwadi workers to sanctioned number of workers 0.1%
AWWs living in the AWC village/ward 66.8%
AWWs having 10 or more years of schooling 61.4%
Median age of AWWs 36 years
AWCs serving to population more than the stipulated norm 2.9%
20.9%
94.8%
AWCs having functional baby weighing scale
AWCs having functional adult weighing scale
Growth Monitoring30
Value
93.6%Available WHO growth chart at AWCs
30 Source : RSoC, 2014
31 Source : DLHS-4, 2012-13
* Source : MoWCD, 2012
H Number of AWCs surveyed for Tripura as per RSoC 2014 is 263.
73.1% 70.4% 43.9%
Received 2 or more TT injections prior to delivery
Consumed 100 or more IFA tablets/syrup during
pregnancy
Had Institutional delivery
Received 3 or more antenatal checkupsprior to delivery
67% 89.8% 24.6% 79.5%
30SERVICES PROVIDED TO WOMEN WHO HAD A LIVE BIRTH IN LAST 35 MONTHS
Health Service Delivery Personnel Value
33ASHAs selected 100%
33Current density of ASHA as per Census 2011 rural population 1 per 368 persons
34Pending or vacant ANM positions sub centres & PHCs NA
32Training and Comprehensive Knowledge Value
91.9%
75.2%
87.9%
92%
78.1%
AWWs having correct knowledge of normal birth weight of children
AWWs having correct knowledge of intake of food by pregnant women
AWWs having correct knowledge of exclusive breastfeeding for the first six months
AWWs having correct knowledge of appropriate age of child for complementary feeding
AWWs having correct knowledge of initiation of breastfeeding within one hour
A.3. EXPENDITURE ON SCHEMES DELIVERING NUTRITION-SPECIFIC INTERVENTIONS
Expenditure on Schemes (in million dollars) In million USD
36NRHM expenditure (Central Government)
36NRHM expenditure (State Government)
35ICDS (ICDS general + SNP + training) (women and children)
11.2 68.8
7.6 9.3
16 75
National Average
B. NUTRITION-SENSITIVE INTERVENTIONS
This section includes information on expenditure and coverage of key centrally-sponsored schemes that indirectly impact maternal and
child nutrition. These are: the Mid Day Meal Scheme (MDMS), Public Distribution System (PDS), and Mahatma Gandhi National Rural
Employment Guarantee Act (MGNREGA).
B.1. COVERAGE OF SCHEMES DELIVERING NUTRITION-SENSITIVE INTERVENTIONS
B.2. EXPENDITURE ON SCHEMES DELIVERING NUTRITION-SENSITIVE INTERVENTIONS:
Expenditure on Schemes (in million dollars)
35 Source : Lok Sabha Unstarred Question # 846 dated 27.02.2015, 2012-13
36 Source : Lok Sabha Annexured Unstarred Question # 409 dated 6.12.2013, 2012-13
37 Source : Part (c) of Lok Sabha Starred Question # 216 dated 05.02.2014 http://164.100.47.132/Annexture_New/lsq15/15/as216.htm 2011-12
38 Source : Report No. 558, NSSO 68th round-Employment and Unemployment Situation in India, 2011-12
39 Source : Report No. 554, NSSO 68th round-Employment and Unemployment Situation in India, 2011-12
40 Source : Part (c) of Lok Sabha Starred Question # 216 dated 05.02.2014, 2012-13
41 Source : Food Corporation of India 2013, 2012-13
42 Source : Lok Sabha Annexured Unstarred Question # 3835 dated 19.03.2015, 2012-13
32 Source : RSoC, 2014
33 Source : NRHM, 2013
34 Source : MoHFW, 2013
* All children studying in primary & upper primary classes in schools supported under Sarva Shiksha Abhiyan and NCLP (National Child Labour Project) run by Ministry of Labour.
41PDS
42MGNREGA
40MDMS
In million USD National Average
133.1 475.3
162 214
9 47
Coverage of Schemes
38PDS (base: rural and urban households reporting consumption)
39MGNREGA (base: rural persons 18 years and above registered in MGNREG job card and demanded work during last 365 days)
37*MDMS (base: eligible children )
Value
80.6%
98.2%
82.5%
TRIPURA