within-case displays: exploring and describing displays: exploring and describing in this chapter we...
TRANSCRIPT

",:
Within-Case Displays: Exploring and Describing
In this chapter we explore a series of displays for drawing and verifying descriptive conclusions about the phenom~ ena in a bounded context that make up a single "case"whether that case is an individual in a setting, a small group, or a larger unit such as a department, organization, or community,
These analysis methods can be used either during or after data collection, They depend on the sorts of early analysis we describe in Chapter 4-particularly, coding. At first they provide preliminary conclusions about what is happening in the case-and how-and suggest leads toward new data Later, as fuller, more complete descriptions are in hand, these displays can supply the basic material for explanations-plausible reasons for why things are happening as they are, We explore that topic in Chapter6,
First we talk about the analytic progression from what and how to why, and then about the basic idea of data display, Then we describe a series of within-case descriptive display types, H1ustrating how they can be designed and used to draw and verify conclusions.
90
Describing and Explaining
Looking at a situation, any researcher wants to know clearly what is going on and how things are proceedingand usually wants as wen to understand and explain coherently why things occur as they do, This innocent formula~ tion can be embroidered endlessly, which we do not propose to do. We can, however, define some terms and make some useful distinctions,
Description. in Bernard's (1988) terms, means "making Gomplicated things understandable by reducing them to their component parts." The issue is making a clear accounting of the phenomena at hand. Explanation is dicier: As Bernard suggests, it means "making complicated things understandable by showing how their component parts fit together according to some rules"-that is, theory.
Qualitative studies are often mounted to explore a new area and to build or "emerge" a theory about it. But they also can be designed to confirm or test an existing theory. In the confirmatory mode, as Gherardi and Turner (1987) point out, data are used to fill in gaps in a puzzle, In the

exploratory mode,. it's as i~ we are trying to solve, an unstated or ambiguous problem, which has to be framed and reframed as we go. Wolcott (1992) talks about this as the "theory first" or "theory after" approach. Both are work-able. .
So what is theory? We can talk about implicit theory, the preconceptions, biases, values, frames, and rhetorical habits that (for example) lead us or the people we are studying to refer to a situation as a "single-parent famHy"-or to the same situation as a "broken home" (Rein & Schon, 1977). In this case the implicit theories are each biased. The first puts a certain kind of human group into a class called «family" and implicitly asserts its right to exist. The second classifies the situation as imperfect or damaged and implies that "a home" must have more than one parent
We can speak also of explicit theory: a set of concepts that might be organized in list form, or in a hierarchy, or in a network of propositi~nal statements. As Wolcott (1992) notes, these might be at the level of "grand theory" (e.g., symbolic interactionism) or, more typically, include modest middle-range concepts such as culture or commitment or innovation adoption. Conceptual frameworks, as we describe them in Chapter 2, are the researcher's first cut at making some explicit theoretical statements.
One more distinction, to which we alluded before, seems important. Efforts to describe and explain may be "paradigmatic" (Maxwell, 1992a; Maxwell & Miller, 1992)they involve a variable·oriented approach (Ragin, 1987) that deals essentially with the relations among well·de.· fined concepts. For example, you might study adolescents' decisions to attend college by examining the relationships among variables such as socioeconomic class, parental expectations, school grades, and peer support.
Or studies may be "syntagmatic," or process-oriented, following the events in a specified case context over time (Maxwell, 1992a; Mohr, 1982). For example, you might study a particular adolescent, Nynke van der Molen, over a period of several months to follow the events and condi· tions (e.g., a poignant discussion with her mother on why she had never worked outside the home; Jane's experience in dissecting a frog) that were related to her decision to go to veterinary school. (For further discussion of this distinc· tion, see Chapter 7, section A, on cross-case analysis.)
We concur with these authors that both approaches need to be combined for careful description and explanation. This chapter inc1udes methods of both sorts.
From describing to explaining: The analytic progres· sion. Usually it is hard to explain something satisfactorily until you understand just what the something is. Thus a natural progression, as Rein and Schon (1977) suggest, is from telling a first "story" about a specified situation (what
A. How Data Displays Work • 91
happened, and then what happened?), to constructing a "map" (formalizing the elements of the story, locating key variables), to building a theory or model (how the variables are connected, how they influence each other). We have constructed a deeper story, in effect, that is both variableoriented and process-oriented.
The progression is a sort of "ladder of abstraction" (Carney, 1990; see Figure 5.1). You begin with a text, trying out coding categories on it, then moving to identify themes and trends, and then to testing hunches and find~ ings, aiming first to delineate the "deep structure" and then to integrate the data into an explanatory framework. In this sense we can speak. of "data transformation" as information is condensed, clustered, sorted, and linked over time (Gherardi & Turner, 1987).
NaturaI1y there is no clear or clean boundary between describing and explaining; the researcher typically moves through a series of analysis episodes that condense more and more data into a more and more coherent under· standing of what, how, and why. In this chapter we mainly emphasize description, but point forward to more explana· tory metho~s in Chapter 6.
A. How Data Displays Work
The idea of a display is central to this book. By display we mean a visual format that presents information systematically, so the user can draw valid conclusions and take needed action.
For qualitative researchers, the typical mode of display has been extended, unreduced text, usually in the form of written·up field notes, which the analyst scans through, attaching codes and then extracting coded segments and drawing conclusions. The analyst then writes a second form of extended text: a case study report.
Our experience teUs us that extended, unreduced text alone is a weak and cumbersome form of display. It is hard on analysts because it is dispersed over many pages and is not easy to see as a whole. It is sequential rather than simultaneous, making it difficult to look at two or three variables at once. It is usually poorly ordered, and it can get very bulky, monotonously overloading. Comparing several extended texts carefully is very difficult.
The same objections apply with even stronger force for final readers. Indeed, it is been claimed (Mulhauser, 1975) that long case studies are almost useless for poHcymakers, who cannot afford the time required to comprehend a long account and/to draw conclusions for their work. I
The argument of this book is, You know what you dis· play. Valid analysis requires, and is driven by, displays that are focused enough to permit a viewing of a full data set

92 • WITHIN-CASE DISPLAYS: EXPLORING, DESCRIBING
FIgure 5.1 The Ladder of Analytical Abstraction (Carney, 1990)
LEVELS
3 Developing and testing propositions to construct an explanatory framework
3a
, ,
, , , , , , ,b ,
, , ,
'.:
Delineating i Synthesis: integrating the deep , the data into one
.. srructure / explanatory framework ~~-~~- -~~" ~~~~
,- -, , 'r' -----' Testing hypotheses \
: and reducing the bulk I
I of the data for analysis I
Cross-checking tentative findings Matrix analysis of major memes in data \ of trends in it : , ,
~,~~~~ -', , __________________________ ,-,,_~-----"----~~-------,J----- _______________ _ 2 Repackaging and
aggregating the data , , , , ,
Identifying themes and trends in the data overall
, -' .... -...... , , , , ,
Searching for relationships in the data: writing analytical memos
, , Finding out where the emphases and gaps in the data are ..... --~- .~-, ,:
" .. , .. -- ----- ---- -----+'---------'- ---- -'.:.\-- -- -: .. ~-- --- --- --- --- ------ -- --------
Summarizing I Trying out coding \ _ ...... Coding of data and l3Ckaging lb: categories to ftnd I Writing of analytical notes on the ata \ a set that fits " linkages to VanOll$ frameworks
...... ", .. " - .. - ........ / ofinterpretation , ,
,r' -----' \ .. ;' " Creating a text ~ .. - - _.. .. .... Reconstruction of interview tapes
to work on I as written notes , , , Synopses of individual interviews
-
in the same location, and are arranged systematically to answer the research questions at hand. A "full data set" does not. of course, mean the complete field notes. Rather the condensed. distilled data presented are drawn from the..·· full range of persons. events, and processes under study. With extended text. there can easily be "selective stacking" of the data-even with good intentions. An organized dis~ play wards off this problem.
Although such displays may sometimes be busy, they will never be monotonous, Most important, the chances of drawing and verifying va1id conclusions are much greater than for extended text, because the display is arranged co~ herently to permit careful comparisons, detection of differences, noting of patterns and themes, seeing trends. and so on,
We can see the importance of coherence analogically by looking at statistical packages such as SPSS and BMD. Their computational speed is amazing and convenient, but they have an equally important function: They display in~ formation in ways that (a) show the data and analysis in one place, (b) allow the analyst to see where further analy~ ses are called for. (c) make it easier to compare different data sets, and (d) permit direct use of the results in a report, improving the credibility of conclusions drawn.
These virtues are commonplace to survey researchers, who simply expect to see computed data appear in weIl~ labeled histograms, correlation matrices, scatterplots, factor plots. and box~and-whisker displays .. Good displays permit the researcher to absorb large amounts of information quickly (Cleveland. 1985). But the qualitative analyst
1 i
I i

has to handcraft appropriat~ da,ta displays. As yet there are few familiar, agreed~on data setups among qualitative researchers, so each analyst has to adapt those of others or invent new ones. A major purpose of this book is to encourage t~e creation and dissemination of innovative and reliable data displays for qualitative data.
We already have discussed some displays. For example, a contact summary form and a report of a case analysis meeting are data displays. They show reduced, focused, organized information on a single page rather than in extended text. The displays we discuss in this chapter present information in more sophisticated ways to aid conclusion drawing.
We begin with a discussion of how to use displays: building the fonnat. entering data, drawing conclusions. writing analytic text. and cycling onward to revised or new displays.
Building the Display Format
Generating formats for displaying qualitative data turns out to be fairly easy and enjoyable. Formats can be as various as the imagination of the analyst. They fall into two major families: matrices, with defined rows and columns, and networks, with a series of «nodes" with links between them.
The data entries are also multifonn: short blocks of text, quotes, phrases, ratings, abbreviations, symbolic figures, labeled lines and arrows, and so on.
The display fonnat and shape of the entries will depend on what you are trying to understand: a general situation, detailed chronologies, the behavior of people in different roles, or the interplay of conceptual variables.
And it depends on how far along you are in the study and what has priority right now, The need might be for eyeballing data in an exploratory way. Or it could be for carrying out detailed analyses; for setting up data to use in another, more differentiated display; for combining parallel data for a single case; for combining data from several cases; or for reporting findings. A good format will allow all of these uses to some degree, but inevitably will do some well and others less well.
In this chapter we emphasize displays of single-case data-but displays that can be folded easily into multiple. case analysis, which is discussed in Chapters 7 and 8. If the formats of displays in a multicase study are comparable, the work of the cross-case analyst is much easier.
We can make several general points about the process of bUilding appropriate displays. They are illustrated more fuIly as we proceed. First, as we have suggested, it is an interesting and not overly demanding task. Second, creating a good display format usually requires a number of iterations (sometimes with new data collection intervening). Third, form fonows function: Formats must always
A. How Data Displays Work a 93
be driven by the research questions involved and your developing concepts, often in the form of codes.
Illustrative display formats: Matrices. A matrix is essentially the "crossing" of two lists, set up as rows and col· umns. Let's take a look at some formats, explaining and labeling them as we go.
Table 5.1 focuses on understanding a chronology: It is time-ordered. Taken from our school improvement study, it lists the events at Banestown over a 4·year period related to the adoption and implementation of a reading program caned SCORE-ON. The time periods were defined conw ceptually, but were adjusted according to the actual events at Banestown. The events are also sorted according to where they took place: at a specific school (Smithson). other local schools. the school district, and the state/macro level. EVents that proved "barometric"-Ieading decisively to a changed situation-are marked with an asterisk: To find "events," the analyst consulted coded field notes (looking for the "AP-CHRON" codes described in Chapter 3) and thep. wrote a distilled summary phrase for entry in the matrix. Perhaps 10-20 pages of material have been conw densed into the display.
This display is especially helpful for understanding the flow, location, and connection of events. It is good for exploratory eyeballing. It could lead to later, more causal explanation. It can be compared easily with similar matrices from other cases in the study. And, with analysis and commentary attached, it can provide a good thumbnail sketch of the change process for use in the final report.
Here the display is used for a complex case; it can be used also for an individual as the case (see, for example, Table 7.1).
Table 5.2 shows a matrix that's only partially ordered (it specifies a series of unordered "conditions" supporting preparedness for using an innovation, in a checklist format. sorting data by roles). The display calls for heavier data transformation by the analyst. Much condensation and standardization has gone on to get the data ready for entry into this fonnat. A mixture of direct quotes and summary phrases is used. In addition, informants' responses have been pooled and crudely scaled (from none to strong). The matrix lets you sum up the components of "preparedness" vertically, and also compare different roles' preparedness on specific conditions by looking across rows.
For example. it is striking to note that central office staff who understood and were committed to the new program (a new readjng laboratory) apparently did not supply adequate materials, training, or inwservice to the people using the program; the users, naturally, were quite bewildered. (We show more of the analysis shortly.)
If there are multiple cases, you can assemble a full set of such tables, one for each case, and compare them on

94 • WIThIN-CASE DISPLAYS: EXPLORING, DESCRIBING
Table 5.1 Event Listing. Banestown Case
TIM E PERIODS AWARENESS TRAINING AND BUDGET
CONTEXTUAL EMERGENCE OF AND PROPOSAL APPROVAL AND BEGINNINO EXPANSION, REDUCTION, PRESS THE PROBLEM OF SOLUTION PREPARATIONS OPERATIONS NEW OPENINGS DISRUPTION
LEVEL 1976.78 Oct. 1978 Nov. 1918 lan.·Peb. 1979 Much-April 1979 Sept. 1979 May 1980
minimal proposal Smithson middle Reduction In Title
Statel competency discussed, school teachers, 2 I allocations
Macro levels, testing approval at adInlna. trained at introduced in state level DID site <t)days, slate scbools early March supplemental • alarm at .. officials see .. Smithson • 30 4th grade • staff active in .. reduction In skills program failure rale SCORE-ONat pupil folders pupils selected extending county, Title I Introduced in • internal 'awareness screened for Smithson Smithson, budgets reading and solutions fair' - appointments I.b launcbing new - proposed staff
District math proposed, - IV·C made of • materials, labs euts. transfers found proposal Smithson lab tecbnical • funding for all in elementary unacceptable rapidly teacher and assistance lab staff at schools
drawn up, ,,'" intensified for Smithson taken submitted Smithson lab over by Title I
pressures • continuation • rooms, staffing lab opens at • middle schools begin to raise for following completed for Carrington, unaffected by minimal year planned middle schools Banestown cuts
Local levels for 5th grade - 2 other elemen- Middle. - threat of Scbools in 2 middle tat)' schools modified version discontinuation
schools: authorized to opens at Smith at Baneslown teachers implement in Camp, South End Middle named the fall (connIcls)
large numbers • 4tb grade - teachers • lab teacher • Smithson lab Smithson • major shifts In of low teachers approve and aide opens (late expands to 45 lab staffing achievers report 40 pull-out lab replaced; March) pupils in 3rd, announced to placed in pupils 1~3 formula some • preparations 4th grades teachers
Smithson FACILE grade levels disgruntlement inadequate, • new teacher • program to be Scbool classes bebind • Jab room .materiab not added for CUI back,
• teachers created, "" ,od, morning focused on unfavorable minimally scheduling sessions grades 1·3, to central equipped diCflcultles limited to 1.5 Office posts Proposals
.. barometric event
each supporting condition and/or on a total "preparedness" index. We discuss such examples in Chapters 7 and 8.
Matrices can be more heavy-duty. Table 5.3 is aimed at understanding the effects of "assistance" supplied to a school site by various sources. Its format calls for the reo searcher to address five related variables, to distinguish two of them according to time. to pool responses, to align some responses along an evaluative scale, and to explain the response pattern for each type of assistance source. Here condensed information from 20-30 pages of field notes has been packed into a single page.
aptations," the researcher has looked at the data segments in the three preceding columns, checked to see whether they covary in some patterned way, and drawn a secondorder generalization. In this case (see first row) the themes of "relieving pressure," "easing schedules," "feeling backed-up," "controlling fidelity," and users' positive assessment all suggested the reception of help and a sense of user obligation for reasonably faithful implementation.
Note that the data are more abstract: there are no quotes, and generalizations and other inferential remarks appear in the last two columns.
The "consequences" and "explanations" are not direct condensations of informants' remarks or of researchers' observations. Rather, for any given consequence, such as the one in the top row, "users are helped administratively and substantively, feel obliged to do ECRI with minor ad-
A similar process of inductive inference occurs for "researcher explanations." Here, too, we see that the table collects data for easy Viewing in one place, permits detailed analysis, and sets the stage for tater cross-case analysis.
llIustrative display formats: Networks. Anetwork is a col· lection of "nodes" or points connected by lines ("links"). They are very helpful when you want to focus on more than a few variables at a time. Networks can beset up easily and can hold a great deal of readily analyzable information. (For helpful discussion see Bliss et aI., 1983).

A. How Data Displays Work II 95
Table 5.2 Checklist Matrix: Conditions Supporting Preparedness at Smithson School, Banestown Case
Presence of Supporting Conditions
CONDITION FOR USERS FOR ADMINISTRATORS
Commitment s..tmng - "wanted to make it work." J'iJ:ak at building level. Prime movers in central office committed; others not.
Understa~ding "lliIlli;" ("felt I could do it, but I just A.b.s.rn1 at building level and wasn't sure how. ") for teacher. among staff. Ahll!U fo, aide ("didn't understand .B..a.s.U; for 2 prime movers ("got how we were going to get aU this. ll
) all the help we needed from developer. ") ~ for other central office staff.
Materials Inad~gtl,u~: ordered late, puzzling N.A. ("different from anything 1 ever used"), discarded.
Front-end uS ketchy" for teacher ("it all Prime movers in central office training happened so quickly"); no demo had training at .developer site;
class. none for others. Nn.ru: for aide: ("totally unprepared .. I had to learn along with the children. ")
Skills Weak-adequate for teacher. One prime mover (Robeson) "N.o.n.e" for aide. skilled in substance; others
unskilled.
Ougoing ~, except for monthly committee Nn.ru: inservice meeting; no substitute funds.
Planning. N!tn..e: both users on other tasks Nn.ru: coordination during day; lab tightly scbeduled, no time free time.
Provisions for N!m..e systematized; spontaneous Nll.n.e debugging work done by users during summer.
School admin. Adeqnate N.A. support
Central admin. Very strong on part of prime movers. Building admin. only acting on support basis of central office
commitment.
Relevant prior £!.r.rulg and useful in both cases: bad ~ and useful in central experience done individualized instruction, office, esp. Robeson
worked with low achievers. But aide (specialist). no diagnostic experience.

:;; ThbleS.3
Effects Matrix: Assistance Location and Types (Masepa Case)
USER'S LOCATION ASSESSMENT TYPES PROVIDED
++ 1. authorizes cbanges
Building ++ 2. eases schedules Administration
- 3. controls fidelity + 4. consults. offers solutions
+ 1. promotes ECRI Central Office ++ 2. answers building Administration administration. trainers'
requests
++ 1. provides materials Helping Teacber + 2. demonstrates, models
++ 3. answers requests ++ 4. encourages
+- 5. circulates, controls
++ 1. comparing practices with User-Helping otbers Teacber + 2. debugging, complaining Meetings
+ .3. learning about new parts + 4. encouragement
Teacher-Users + 1. sbaring materials in Other + 2. excbanging tips, Schools: solutions Target Scbools + 3. comparing, encouraging
++ 1. tips for presentations Trainers in ++ 2. solution to sbort-term Target School, problems Other School + 3. encourages
+ 4. serves as successful model
~: ++ very effective effective +
+- mixed effective ineffective
SHORT*RUN EFFECTS (USER'S 'STATE')
1. relieves pressure, encourages
2. belps early implementation
3. feeling policed 4. feeling backed.up.
substantially helped
1. pressures nOD*users 2. building administrators
bave material, administrative support
1. reduces effort, increases repertoire
2. trains, facilitates use 3. problems solved rapidly 4. maintains level of
effort 5. ambivalent: helped yet
coerced 1. encourages, regulates
2. cathartic, solves short. run problems
3. e,;pands repertoire 4'. gets through rough
moments
1. increases stock 2. new ideas, practices;
problems solved 3. motivates, stimulates
1. facilitates practice 2. belps expand beyond
c~re format 3. maintains effort 4. stimulates
LONGER-RUN CONSEQUENCES
Users are helped administratively and substantively, feel obliged to do ECR! with minor adaptations
pro gram is percei ved as supported. assis ted, 'protected' by central office
new. experienced users receive systematic instruction, follow· up, materials; stay with program and are careful about making changes in it creates reference group, gives users a voice. solves ongoing problems and lowers andety
increases commitment, regulates use (decreases deviance)
reliable, unthreatening backup provided in school
RESEARCHER EXPLANATIONS
administration. authority, servicing, availability and flexibility lead to sustained. faithful implementation model
central office able to push program and answer requests, yet not perceived as main actor by users
personalized in· service mecbanism. witb botb training and assistance allows for mastery and spread of ECRI in 'faitbful' format
mUlti-purpose forum which consolidates use and users, defuses opposition
additional source of assistance. wbich increases as number of users grows
elaborate and effective lateral network: trainers seen as peers
.-----~
:s
Distrlctwide Grade 2-8-
Extensive
Moderate
Modest
I I I I I I I I I I I
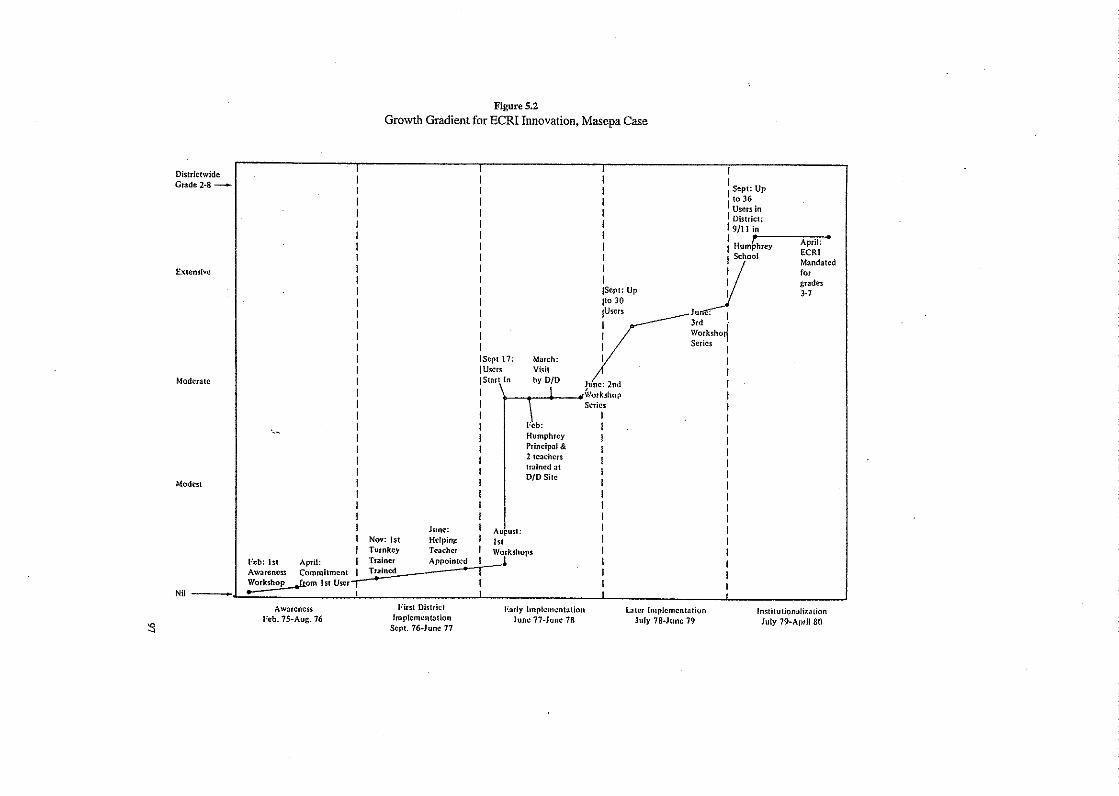
Figure 5.2
Growth Gradient for ECRI Innovation, Masepa Case
I I Sept: Up
to 36 I Users in I District; 19/11 in
: Hum,rh-,,-y---A'-:P::'i""'-School EeRI
1/ Mandated I for I grades
lSept: Up ! 3.7 Ito 30
IS'p'17 Mmh r'/·----g~:hol IU"" Vi,i. y. I IStart In hy DID June; 2nd I
I Workshop I I Series I I I I I Feb: I I I Humphrey I I I Principal & I I I 2 I~achcrs I I I Halned :st I I DfDSilc I :
I I I I I I I I I
June: I August: I I Nov: 1st Helping I 1st I I Turnkey Teacher I Workshops I I
Feb: 1st April: Trainer Appointed I I I Awareness Commitment Trained I I
I Workshop .from 1st User I I
Nil ~l.~o-~::::::::~~~~i-____________________ L-__________________ -1 ____________________ -L __________________ ~ Awareness
Feb. 7S-Aug. 16
First District Implementation
Sepl. 76*Junc 17
Early Implcnu:ntallon June 77·}u"!!. 78
Later Implementatiun July 78-June 79
In~lilu tiona/i7.a lion July 79~Aptil 80

98 • WITHIN·CASE DISPLAYS: EXPLORING, DESCRIBING
In Figure 5.2 we see a simple network display designed to show the "growth gradient" of an innovation's use in one case in our school improvement study. At first it doesn't look like a "network" at all. But it is: The nodes or points are events, and the lines or links have the implicit meaning "is followed by." The network is ordered (the vertical dimension shows numbers of users, and the horizontal one is time), Each point is labeled. You can get a clear idea of the tempo of expansion and can see which events were especially critical (e.g., the August 1st workshops in 1977). More generally, you can see that workshops appear to be the main mechanism for expanding use of the innovation.
In another part of our study, we were interested in how to display the sources of "assistance" that users of an in~ novation received (and requested). Because assistance oc~ curs in an organizational context, we decided on showing a quasi-organizational chart with arrows showing where assistance of various types came from and who received it (Figure 5.3).
This network incorporates a large amount of informa~ tion (see legend). It shows the organizational position of givers and receivers of help; depicts whether the assistance was solicited or not, mutual or not; labels the type of assistance received; and indicates how the receiver felt about it.
In this display we can see patterns readily: that virtually all assistance was received positively; that assistance received included all types except process facilitation; that much. of it was solicited; that the helping teachers and the curriculum coordinator form a mutuaIIy helping team; and that the principal, too, gives assistance, but of a more am~ biguous sort (more control, advocacy, resource giving, along with support and solution giving). Note, too, the within-building help among teachers in the form of support and solution giving.
This network was produced from about two dozen coded pages of transcribed field notes. The analyst re~ trieved the relevant chunks via codes and condensed them into categories, ratings, and directional influences.
Timing. When should formats be generated? If the format . is at hand during data collection, it helps save energy by encouraging focus: You know what information you will be needing. But there are some cautions here. First, qualitative data evolve; later accounts round out, qualify, put in perspective, and disqualify earlier ones. Analysts do not march through data collection as in survey methodology; they scout around. sleuth. and take second and third looks. So there are risks in entering the data into a set format too soon.
Furthermore, for any given research question or issue, you can develop many different displays (like, dozens), using the same set of variables. Each display makes somewhat different assumptions; each has trade~offs among ad-
vantages and costs. We give an example of the typical pluralism among possible display types in section B below.
Another caution is that display formats nearly always evolve, too. The later ones are more data-sensitive than the earlier ones, as things come clearer. For instance, the headings in the display format of Table 5.2 came, in part, from relationships observed in the course of data collection; the display allows you to test those relationships more rigorously. You could have built such a format directly from a conceptual framework, but real clarity typically comes later, when the empirical data begin to take shape.
Formatting is a decisive operation; it detennines which variables will be analyzed in which ways. If a variable isn't in the format, it won't get compared to another variable. Displays can help you summarize and compare findings within (and across) cases, but they also can be straitjackets. They may bully the data into shapes that are superficially comparable across cases, but you actually may be compar~ ing intrinsically different things-on dimensions that turn out to be trivial.
So our general advice is to generate rough formats early during data collection, and revise them to a firmer state closer to the end of data collection. when they can be grounded more contextually and empirically. Expect to make several passes or iterations before the first fonnat of the display is working right. Test a proposed fonnat by entering data. Unworkable or confusing formats, or those that do not incorporate all of the relevant data, will show themselves rapidly.
Entering Data
Creating formats is usually a matter of a few minutes. Revising them as the early items of data are entered is also quick work, especially if your word processor can easily add and switch rows and columns. Just as exploratory data analysis programs (Hartwig & Dearing. 1979) for quantitative data permit the "sculpting" of analysis and display frames to fit the shape of the data as they undergo progres~ sive transformations. so good qualitative software programs can enable reformatting as data are entered and con~ sidered .
What takes time is data entry itself. Coded data segments have to be located in the transcribed field notes: they have to be extracted, condensed, and summarized. Some further data transformation and selection may also be involved: doing ratings. making judgments, picking repre~ sentative quotes. The speed and quality with which data entry is done depend on the technology of storage and retrieval being used (see Chapter 3, section B). Generally speaking, computer~assisted methods both improve quality and reduce the time taken.
The time taken to enter data also depends on (a) the number of variables or dimensions in the display. (b) the
1

:g
Figure 5.3
Illustration of Context Chart with Assistance Flows (Masepa Case)
Helping Teacher
S. Wortman 1979-80
Legend
External to-District
Direction of assistance
~ assistance received ~ mutual assistance ~ solicited and received =====-a. heavy~ frequent
R. Quint 6th grade·
L. Brent 6th grade
+
A. Olkin 2nd grade
Other Schools
+ F. Morelly 2nd grade
Bayeis 4th grade, Trainer
+1 S. Wortmann 4th grade,
Trainer
Orientation
TTR = teaching, training FAe a facilitating, process-helping SOL = solution-giving RES resource-adding CON controlling SUPP = supporting, encouraging
G. Norrist First User, Trainer
a::::J.. EeRI materials ADV = advocating
clients' interests
INQ .. inquiring, feeding back formatively

100 • WITHIN-CASE DISPLAYS: EXPLORING, DESCRIBING
number of respondents, and (c) the ldod and number of transformations made. We'll give time estimates as we proceed with specific methods. As an illustration, a comA plex matrix like Table 5.3, assuming already-coded data, might take an experienced researcher a full day for data entry. given a database of a few dozen interviews. On the other hand, one like Table 5.1, given information from a few informants and some documents, could be managed in a few hours. These figures might be cut by 40% or so with the right software to pull out coded chunks quickly and to create condensed or transformed versions-and build rows and columns or a network structure for easy data entry.
We suspect that, for most people. a traditional extendedtext approach to the same data set would not be accomplished more quickly. And the formats illustrated here, in our view, substantially increase the analytic power of the results-and their readability.
In this overview we do not discuss in detail just how you go about selecting/reducing data from field notes for entry into matrices or figures. A good rule of thumb has been offered by Tufte (1990), the dean of display makers: "to clarify, add detail." In other words, oveneducing data can obscure understanding.
We come back to this issue as we discuss specific display methods. Generally, the choice of data for matrix entry must be driven by the particular row and column headings· involved, or by your definition of network nodes and links. Keeping a precise record of the actual criteria and decision rules used (which will vary from display to display) is essential. Typical decision rules cover how ratings or judgments are arrived at, the basis for selecting particular quotes, and how you balance reports from different people,
Stay open on the question of whether the format you use for analysis should be the same one used for final reporting. The best answer is often yes (just as a quantitative research report normally includes data displays, as well as analytic text); readers can see for themselves how conclusions were drawn, rather ~han being handed study results to be taken on faith. To put it another way. as Wainer (1992, p. 18) does: "Tables are for communication, not data storage." Sometimes, of course, a display wiIJ be used for intermediate purposes and will not necessarily be shown to readers of the final report.
Drawing Conclusions
The displayed data need to be examined with care, and conclusions need to be drawn. Those conclusions nonnally appear in what we called analytic text. For example, the analyst looking at Tp.ble 5.1 wrote paragraphs such as these:
Beginning in 1971 and intensifying in the years 1976·78, the State issued a series of increasingly precise and constraining documents. These texts calIed at first for adequate "standards of quality" in education. These standards }V.ere then outlined in the major subject matter areas. Competency testing was announced, first for grades K-3, then for 4-6 .... After some delays, the first statewide tests keyed to these objectives for reading and math were scheduled for grade 4 in 1979 and for grades 5-6 in 1980-81.
The response at the district level was to create a "supplemental skills program" in order to intensify remedial work in reading and mathematics so that minimal competency levels could be attained ....
The implication was in the air that teachers might be held accountable for excessive rates of failure on statewide competency tests, but the pressures were still diffuse within individual schools. Teachers routinely attributed low performance to subnormal aptitude or to conditions at home over which they had no control.
A special impetus was given in the fall of 1978, when the six fourth-grade teachers at Smithson noticed that they had an unusually large cohort of incoming pupils who were one or more grade levels behind in reading achievement. ... It is not clear how so many of these pupils got to the fourth grade, but no one was surprised. The Vice-Principal says, "They got too tail, they got too bad."
The teachers were worried that either promoting or retaining so many pupils would cause problems; they were leaning toward retention, but feared a massive protest by parents. Essentially, they were covering themselves. by announcing early in the year that they had inherited, not created. the problem.
These excerpts show us that the analytic text draws attention to the features of the displayed data and "makes sense" of them, knitting them together and permitting the analyst to draw conclusions and to add interpretations. It also encourages a return to the field notes to consult information not in the display and to add it to the text for further clarity. In short, the display does not "speak for itself'and the analytic text does not stand alone without reference to the display.
How are conclusions actually drawn? In this example the analyst was using several tactics. One was noting patterns, themes (the idea that teachers were covering themselves in advance); another was building a logical chain of evidence (tracing the downward impact from state actions to the local school). These and other tactics are discussed in detail in Chapter 10. As we illustrate their use in specific situations in the next few chapters, tactics will be marked off in boldface.
The time required for examining data displays and writing the corresponding analytic text usually runs to 20% or less of the time required for data entry. There are many reports of the anguish of trying to write text from an un-
displayed database of hundreds of pages. By contrast, wellformatted disphys, with data entries in which you have confidence, make writing an easier, faster, more pleasur~ able and productive ex.perience for the analyst, judging from our experience.
Moving to the Next Analytic Steps
The act of writing text as you ruminate over the meaning of a display is itself a for;:using and forcing device that propels further analysis. We quote Lofland and Lofland (1984, pp. 142-143) here:
It seems, in fact,lhat you do not truly begin to think until you attempt to layout your ideas and information into successive sentences ...• For better or for worse, when you actually start writing you begin to get new ideas, to see new connections, to remember material you had forgotten .... You are never truly inside a topic-or on top of it-until you face the hard task of explaining it to someone else, ... (Thus "writing blocks" are perhaps better thought of as "thinking blocks.")
Or, as Mills (1959) points out in his essay "On Intellectual Craftsmanship," writing begins in the context of discovery and then must turn to the context of presentation. That effort often turns us back to the context of discovery once more. Writing, in short, does not come after analysis; it is analysis, happening as the writer thinks through the meaning of data in the display. Writing is thinking, not the report of thought.
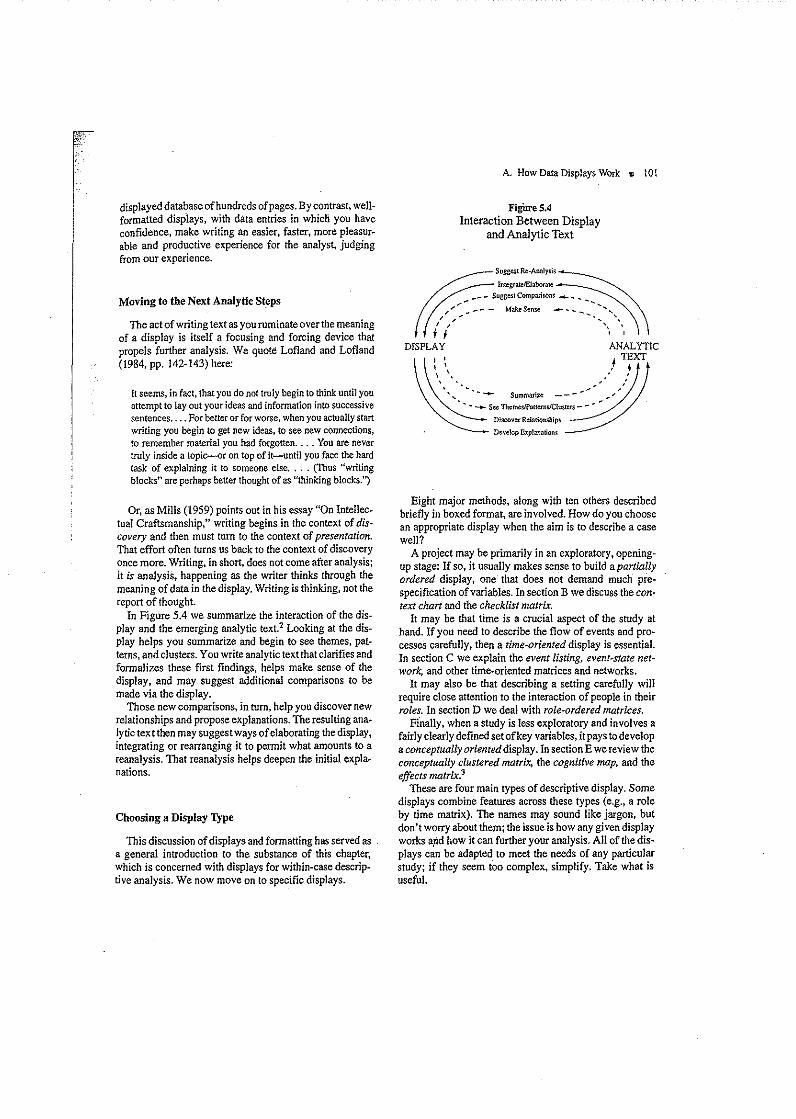
In Figure 5.4 we summarize the interaction of the display and the emerging analytic text? Looking at the display helps you summarize and begin to see themes, patterns, and clusters. You write analytic text that clarifies and formalizes these first findings, helps make sense of the dispJay. and may suggest additional comparisons to be made via the display.
Those new comparisons, in turn. help you discover new relationships and propose explanations. The resulting ana~ lytic text then may suggest ways ofeJaborating the display, integrating or rearranging it to permit what amounts to a reanalysis. That reanalysis helps deepen the initial explanations.
Choosing a Display Type
This discussion of displays and formatting has served as a general introduction to the substance of this chapter, which is concerned with displays for within-case descriptive analysis. We now move on to specific displays.
A. How Data DispJays Work • 101
FigiIreS.4 Interaction Between Display
and Analytic Text
ff!fS""~"'_A'ru",;~ IntegrntelElaoorate
~_ , __ s""~<c'mp",ro,,~ __ ".
,;,; ,..~_-- Make Sense _____ ........ ~ I " ... ,
I I " ' f I I I
DI~SP~L~~ ~N¢i:':fIC I \ , 4 \ \ • t , . , '. ........ _.,...... ...;
"" -~-:roTh:;:;:':moc:;~ D'"""'oJ,ti,,,",p, ~
, Develop Explanations
Eight major methods, along with ten others described briefly in boxed format, are involved. How do you choose an appropriate display when the aim is to describe a case well?
A project may be primarily in an exploratory, openingup stage: If so, it usually makes sense to build a partially ordered display, one that does not demand much prespecification of variables. In section B we discuss the con~ text chart and the checklist matrix.
It may be that time is a crucial aspect of the study at hand. If you need to describe the flow of events and processeS carefully, then a time~oriented display is essential. In section C we explain the event listing, event-state network, and other time-oriented matrices and networks.
It may also be that describing a setting carefully will require close attention to the interaction of people in their roles. In section D we deal with role-ordered matrices.
Ffnally, when a study is less exploratory and involves a fairly clearly defined set of key variables, it pays to develop a conceptually oriented display. In section E we review the conceptually clustered matrix, the cognitive map, and the effects matrix?
These are four main types of descriptive display. Some displays combine features across these types (e.g., a role by time matrix). The names may sound like jargon, but don't worry about them; the issue is how any given display works apd how it can further your analysis. All of the dis~ plays can be adapted. to meet the needs of any particular study; if they seem too complex, simplify. Take what is useful.

102 • WITHIN-CASE DISPLAYS, EXPLORING, DESCRIBING
You may want to review Chapter 9 as well, which in· eludes summary ideas on matrix building and use, Chapter 13 will help you keep an overall, longer term perspective on the flow of work in your study.
B, Partially Ordered Displays
Some displays deliberately have some-but not too much-internal order. They aim to uncover and describe what is happening in a local setting. no matter how messy or surprising it may be. And they impose minimal conceptual, structure on the data they display. Take, for example, the context chart.
Context Chart
Analysis Problem
Most qualitative researchers believe that a person's be· havior has to be understood in a specific context, and that the context cannot be ignored or "held constant." The context can be seen as immediately relevant aspects of the situation (where the person is physically, who else is inM volved, what the recent history of the contact is. etc.), as well as the relevant aspects of the social system in which the person appears (a classroom, a school. a department, a company, a family. a hospital ward, a local community). Focusing solely on individual behavior without attending to contexts runs a serious risk of misunderstanding the meaning of events. Take the individual behavior noted below:
Bill picks up telephone,listens for a while, says. "No, Charlie, I don't think we should do that See you tomorrow. Bye."
Your interpretation of this event, without context, has to be limited to matters such as individual decisiveness, economy of speech, and the like. So, as you read this, you probably constructed a context to help you interpret it. Reflect on that context for a moment and decide what the event means to you.
Now consider some alternative contexts:
Charlie is Bill's attorney, and they are going to court tomorrow. (The issue is something about a strategy to be followed, but Bill is certainly not a passive client.)
Charlie is Bill's boss. (Is Bill giving requested advice or, in effect, vetoing something'?) ,
Charlie is Bill's subordinate. who is proposing that someone new should be invited to a meeting. (It feels like an abrupt dismissal)
Char.lie is Bill's wife, calling from out of town to suggest meeting for a gallery visit before dinner tomorrow. (What ldnd of marriage is implied? Distant? Routine'? Independence respecting?)
".:
Understanding contexts is usually critical. Even that adM jective is too mild. We should quote here the title of Mishler'S (1979) thoughtful article: "Meaning in Context: Is There Any Other Kind?" Contexts drive the way we understand the meaning of events. or, as Mishler notes, meaning is always within context and contexts incorporate meaning.
The problem a qualitative researcher faces is how to map the social context of individual actions economically and reasonably accurately-without getting overwhelmed with detail. A context chart is one way to accomplish these goals.
Brief Description
A context chart is a network, mapping in graphic form the interrelationships among the roles and groups (and, if appropriate, organizations) that go to make up the context of individual behavior.
illustration
Most people do their daily worle in organizations: They have superiors, peers. subordinates; their work is defined in a roleMspecialized way; and they have different relation~ ships with different people in other roles in their social vicinity. (Context charts also can be drawn for people in families or infonnal groups or communities.)4
Suppose you were interested. as we were, in organizaM tions called schools and school districts-and with the general problem of how innovations enter and are impleM mented in those organizations. What are some simple ways to display data to help our understanding of those contexts?
Building the display. Such a network ought to reflect the core characteristics of organizations: authoritylhierarchy and division of labor. So it ought to show who has formal authority over whom and what the role names are. But those things don't tell us very much. We should also know about the quality of the working relation.ships between people in different roles.
And because we're talking about the introduction of an innovation. the display should show us who advocated it, who is actually using the innovation, and people's attitudes toward it (whether or not they are using it). The display should show us how the specific school we are studying is embedded in the larger district organization. Above all, we need a display that wilt not overload us with information,
B. Partially Ordered Displays • J03
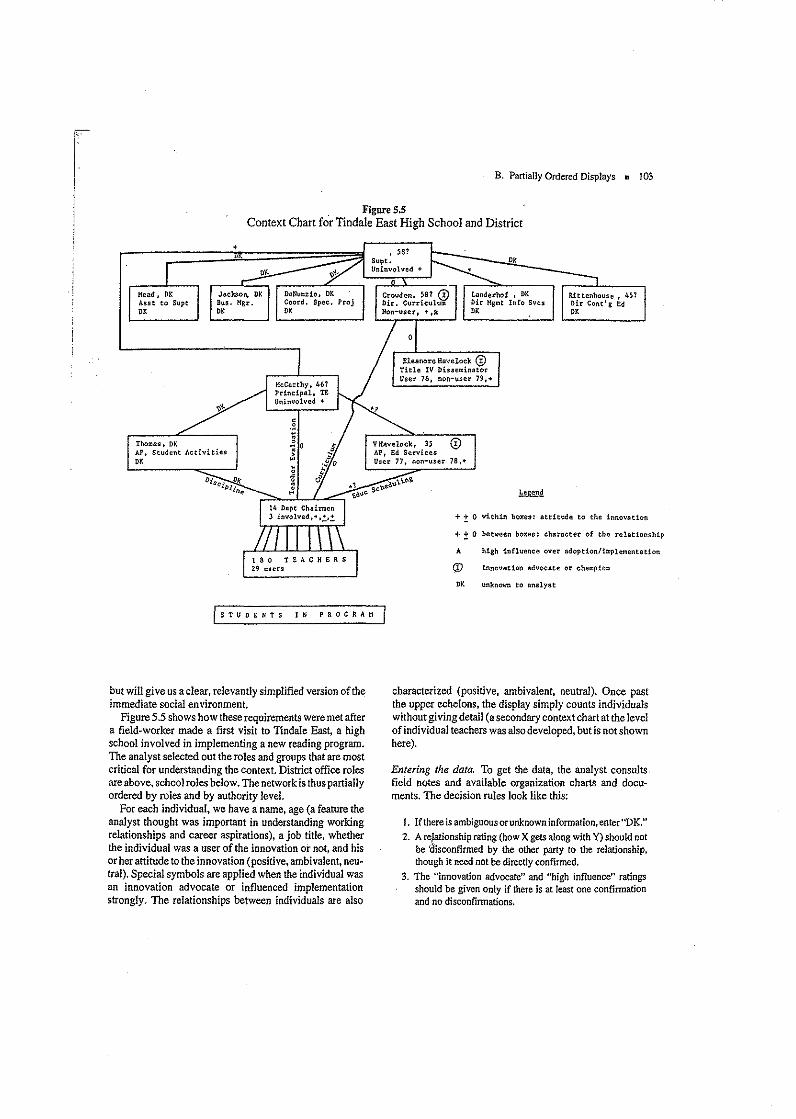
FigureS.s Context Chart for Tindale East High School and District
•
Thomas. DK AI', Student Activities OK
.?
Landerhof , OK Info SVC5
IU.ttenhouse, 451 l}ir Cont'g Ed OK
VHavelock, 3S @ AI', Ed Serviees User 77, non-user 78,+
+ ± 0 within boX'es: attitude to the innovation
+ ± 0 betll"een boxe!1l eharacter of the relationship
It high influence over adoption/implementation
CD innovation advocate or champion
DK unknown to analyst
ISTUDENTS IN PROGRAM
but will give us a clear. relevantly simplified version of the immediate social environment.
Figure 5.5 shows how these requirements were met after a field~worker made a first visit to Tindale East, a high school involved in implementing a new reading program. The analyst selected out the roles and groups that are most critical for understanding the context. District office roles are above. school roJes below. The network is thus partially ordered by roles and by authOrity level.
For each individual. we have a name, age (a feature the analyst thought was important in understanding working relationships and career aspirations), a job title, whether the individual was a user of the innovation or not, and his or her attitude to the innovation (positive. ambivalent, neu~ tral). Special symbols are app1ied when the individual was an innovation advocate or influenced implementation strongly. The relationships between individuals are also
characterized (positive, ambivalent, neutral). Once past the upper echelons, the display simply counts individuals without giving detail (a secondary context chart at the level of individual teachers was also developed, but is not shown here).
Entering the data, To get the data, the analyst consults, fieid notes and available organization charts and docu~ ments. The decision rules look like this:
1, If there is ambiguous or unknown information. enter "DK." 2. A re'ationship rating (how X gets along with Y) should not
be ~isconfirmed by the other party to the relationship. though it need not be directly confirmed,
3. The "innovation advocate" and "high influence" ratings should be given only if there is at least one confirmation and no disconfirmations.

104 • WITHIN-CASE DISPLAYS: EXPLORlNG, DESCRIBING
4. For information such as job title, number of persons, and so on, assume accuracy for the moment and enter it.
Drawing conclusions. The analytic text for this display looked like this, in part:
Looking at Hnes of authority, we can see that only one central office person (Crowden) has direct authority over department chairmen as they work on the innovation. Crowden is not only an advocate but also has high influence over implementation, and seems to have a license from the superintendent todo this.
The department chairs. it appears. have three other masters, depending on the immediate issue involved (discipline, teacher evaluation, scheduling). Because, in this case, the in~ novation does involve scheduling problems, it's of interest that V. Havelock is not only an advocate, but has actually used the innovation and is positive toward it. We might draw the inference that Crowden serves as a general pusher, using cen· tral office authority, and V. Havelock aids directly with im· plementation issues; the field notes support this.
Note, too, that principal McCarthy (a) is not accountable [0 the superintendent for curriculum issues and (b) has a good relationship with V. Havelock. Perhaps McCarthy gets his main information about the innovation from Havelock and thus judges it positively.
The fact that the three chairs involved are ambivalent to positive about the innovation will require more data than displayed here to elucidate. A next-level context chart should display the three chairs, plus the 29 users and their attitudes,
So the chart shown in Figure 5.5 helps us place the behavior of individuals (e.g., Crowden, V. Havelock) in a clear context and understand its meaning. For example, when Crowden, discussing the innov'ation, says, "It is not to be violated; its implementation is not based on the whim of a teacher at any moment in class, and its success is not dependent upon charismatic teachers,'~ the chart helps us understand that this prescriptive stance is backed up with direct authority over department chairs for curriculum issues-an authority that is accepted neutrally. In short, the analyst has been employing the tactic of seeing patterns or themes, as well as subsuming particulars into the general (see Chapter 10, section A, for more on these tactics).
So it is not surprising when a department chair from Tindale says she tells teachers, "If you want to depart from the guide, ask me and also tell me why you want to do it and how it will fulfill the guide's objectives." And she admits to the researcher. "The Tindale West department chair and I mostly decide 'no' before teachers even ask to make changes."
Variations
The specific types of behavior involved in the relation~ ships between roles can be identified on t~e chart as well (see Figure 5.3, where the primary focus is on the different types of assistance [e.g., teaching/training, facilitation]: who gave what kind of help to whom),
Dotted lines can be used to show informal influence. Circles can be drawn enclosing informal groups. In one study of a rural high school, we asked people to draw pic~ tures of the faculty as they saw it, and interviewed them about the meaning of their drawings. This process helped us find six major informal subgroups among the faculty. They included the "old new guard" (progressive teachers who had been around a good while); "boy coaches" ("the last great disciplinarians in the world"); "girl coaches"; "newcomers"; "structuralists" ("a 1950-1960 kind of teacher"); and "goners" ("people who might just as well be in a labor union ... at 3:30 they're gone"). We also found one person, James Colley, who was a group unto himself, according to several respondents.
Linkages to other organizations in the environment can be shown.
In an organizational context that has changed a lot in a short time, successive context charts can be drawn (e.g., in our study the structure and relationships in an alternative school changed rather substantially for each of the 3 years of its existence, and we needed three charts).
In Figure 5.5 certain social·system aspects of the context are emphasized. It is sometimes important to map the physical aspect of an immediate context (e.g., a classroom, with indications of the teacher's desk, resource files, student tables and chairs, entrances) in order to help understand the ebb and flow of events in the setting.·
Advice
If you're new to qualitative research, keep your first context charts simple. They can be embroidered as you go on. Context charts work wen when your case is an individual-they show you the real richness of a person's life setting.
Use context charts early during fieldwork to summarize your first understandings and to ioc?-te questions for nextstep data collection.
Keep the study's main research questions in mind, and design the context chart to display the information most relevant to them.
Remember that you are not simply drawing a standard organizational chart, but are mapping salient properties of the context. Remember, too, that your chart will not be exhaustive or complete: It is a coIlection of organizational

r fragments or excerpts. (In Figure 5.5. for example, custo~ dians, secretaries. and the immediate subordinates' of most of the district office personnel are excluded.)
Time Re9uired
If the fieldwork has involved focused attention to the issues mapped in a context chart, one of the size shown in our illustration can normaUy be put together quite rapw idly-in an hour or so. You may often find that an implicit chart has been materializing in your head as you talk to different people in the site. Drawing it and fil1iilg in the associated details from coded field notes helps you express and test your implicit ideas.
Checklist Matrix
Analysis ProbJel.ll
Let's look at some contrasting stereotypes. The survey researcher is seen as a purposeful, efficient worker who designs instrumentation, marches into a site to administer it to everyone in the sample, marches out, codes and pro~ cesses the data, and analyzes the output. By contrast, the field researcher is seen as a near~aimless loiterer who throws together some orienting instrumentation, hangs around a field site for days, collects all manner of data, fiddles with the instrumentation, talks to some people more than to others, observes without an observation schedule, accumulates pages and pages of words, and then spends days coding and entering them in a complicated homemade chart for analysis-and does al1 this for only one or two cases, to boot.
Of course, we could turn these stereotypes inside out, speaking of the methodological rigidity and blindness of the survey researcher and the "groundedness" of the field~ worker, alert to local reality. There are grains of truth in stereotypes, whichever way they're slanted.s
Sometimes field researchers behave like survey researchers by collecting comparable data from al1 key respondents and entering them in a prespecified format. This may happen when:
• The variable is conceptually important. • The variable can be unbundled easily into distinct indicators
or components. • You need the variable badly (e.g., asagoodoutcomemeasure). • The study has multiple cases requiringcomparabilityoffor
matting and measurement. • You want to relate field data to survey measures of the same
variable.
B, Partially Ordered Displays II 105
Brief Description
A checklist matrix is a format for analyzing field data on a major variab,le or general domain of interest. The basic principle is that the matrix includes several components of a single, coherent variable, though it does not necessarily order the components.
Dlustration
Here is a checklist for assessing "preparedness" prior to executing a new practice (Table 5.2). In our school im~ provement study, we met most of the conditions just de~ scribed. Preparedness was tied to implementation success in our conceptual framework and had strong backing in the literature. It also made good common sense that people do better those things for which they are prepared, Empirical studies had broken down preparedness to distinct components that correlated wen with good project execution. In short, the variable had a lot going for it. In addition, we were studying 12 cases and needed parallel measures. We also wanted to link our findings with a large survey that had a prep'aredness section in its questionnaire.
We did have some doubts about the variable and saw fieldwork as the ideal way of resolving them. We wondered whether the preparedness ~ good execution logic was too mechanistic. We also suspected that other vari~ abIes could get mixed up with preparedness. A highly experienced user could look-well prepared, although the technical training itself may have been dismaL And we believed that many unpredictable school~level factors could wen affect project execution. So a largely individual and technical factor such as preparedness could hardly accOUnt by itself for varying degrees of successful use of the new practice. These were all things that on~siteobservation and interviews could capture, and we needed a display to help us sort out these matters,
The two major research questions we wanted to answer were:
What were the components of the original plan for imple~ mentation?
These might have included front-end training, monitoring and debugging/troubleshooting unexpected problems, and ongoing support How precise and elaborate was this plan? Were people satisfied with itat the time? Did it deal with all of the problems anticipated?
, "
Were the requisite conditions for implementation assured before it began?

106 • WITHIN·CASE DISPLAYS: EXPLORING, DESCRIBING
These might have included commitment, understanding, ma~ tenals and equipment, skills, time allocation, and organiza~ tional backup. Were any important conditions seen as miss· ing? Which were most missing?
Building the display. Table 5.2 is repeated here. The rows are drawn from the various components of the implementation plan and the supporting conditions mentioned in the research questions. During early fieldwork we realized that "relevant prior experience" was an important component of preparedness, and added it as a row.
There is no effort to sort or order the components at this point. We believed that preparedness might well differ for users of the new program and administrators, so the columns reflect that distinction. The matrix is thus partially ordered by role.
In this case the innovation was a remedial lab program in reading, being used for the first time by a teacher and an aide. The cell entries include summary phrases, direct quotes, and an overall adequacy judgment by the analyst, ranging from "absent/none" to "sketchy," "basic," "adequate," "present," and "strong." The quotes are useful devices; they both help justify and illuminate the rating.
Entering the data. The analyst reviews relevant sections of the write-ups, retrieves material by codes, forms a general judgment or rating of the level of adequacy of the component at hand, and locates relevant quotes.
The quotes and the ratings are kept together in the celL The idea here is that ratings only tell you how much there is of something, not what that something means. Brief quotes are enough to communicate-and to help another analyst judge. by going back to the write-ups. whether the rating is justified.
Some decision rules used for data entry:
.. Because there are only two users and they occupy different roles (teacher and aide), don't force a generaljudgment The same applies to administrators.
• Use judgments of users and administrators if they offer them. Put them in quotes,
" Accept direct reports and do not require verification by another person,
Drawing conclusions. Now we can look down the col. umns of the matrix and form a gen~ral idea of the level of preparedness for different components. For example, the analyst wrote, in part:
The image is one of solid 'co'mh1itment and administrative support (except for the building principal), but minimal ade~ quacy in requisite skills and understanding of the practice, and absence offorward~looking mechanisms for training, de· bugging or planning.
The analysis tactic here is one of noting patterns or themes (see Chapter 10). Note that simply adding up judgments in the column is not the way to proceed,
But the display suggests new questio.11$. What's going on here? The central office administrators were committed and had more basic understanding of the program than the users (tactic: making comparisons), Why didn't they help? The analyst went back to field notes and noted:
For Mrs. Baeurs [the administratively oriented, less skilled prime moverJ, all the lab teachers required were the provision of materials and initial training, . , , The teachers, she reasoned, had already done individualized work with children "so they didn't really have to do any kind of mind change," , .. At one point, however, she says, "J don't know, Maybe we got into it too fast."
Even Mrs. Robeson, the reading specialist, acknowledged that the teachers "didn't think they were ready," but saw few ways in which initial preparation could have been better. She also played down the size of the needed changes in teachers,
Thus the analyst found more information: The weak, hasty training and support came because distant adminis~ trators minimized the actual needs of new users,
The analyst also consulted the survey data, finding that aU respondents judged the list of conditions to have been "only partly in place." Administrators emphasized funds and materials; teachers had more doubts about whether there was motivation to achieve project purposes.
That finding. in turn. helped the analyst realize that a major missing row in the matrix was support of other class~ room teachers, whose lack of commitment to and understanding of the lab program led to poor coordination, skepticism. and disgruntlement that was offset only partly by their personal liking for the lab teacher and aide.
Variations
Any given research question and set of variables can have many different displays. Each has advantages and limitations. Let's illustrate. The research questions here asked whether conditions supporting preparedness through an implementation plan were assured before implementation began. The variables included a set of "conditions" with data for users and administrators, Table 5.2 is only one possible display, Let's look at three others .
First, Table 5.4 recasts Table 5.2 by transposing rows and columns so we can easily follow the responses of a specific individual across all conditions, not having to lump them in one cell as in Table 5.2. Table 5.4 also breaks out the building principal separately. But note: We have much more detailed, diverse data, rather than a general judgment such as "adequate" for any given condition, as we had in Table 5.2.
:'11'-.

B. Partially Ordered Displays _ 107
Thble 5.2 (Repeated) Checklist Matrix: Conditions Supporting Preparedness at Smithson School, Banestown Case
Presence of Supporting' Conditions
CONDITION FOR USERS FOR ADMINISTRATORS
Commitment .s..tJ:.ung ~ "wanted to make it work." ~ at building level. Prime movers in central office committed; others not.
Understanding "Jl.alli" ("felt I could do it, but I just A.1:l.s..en.t at building level and wasn't sure how. ") for teacher. among staff. A.lllim.t for aide ("didn't understand B..a.s.i£ for 2 prime movers ("got bow we were going to get all this. ") all the help we needed from
developer. ") ~ for other central office staff.
Materials II!ad~g!Jat~: ordered late. puzzling N.A. ("different from anything I ever used"), discarded.
Front~end "Sketchy" for teacher ("it all Prime movers in central office training bappened so quickly"); no demo had training at developer site;
class. none for others. ~ for aide: ("totally unprepared .. I bad to learn along with tbe children. ")
Skills . Weak-adequate for teacber. One prime mover (Robeson) "Ho.n.e" for aide. skilled in substance; others
unskilled . .
Ongoing N.2.n.e:. except for monthly committee ~ in service meeting; no substitute funds.
Planning. ~: both users on other tasks ~ coordination during day; lab tightly scheduled, no time free time.
Provisions for N.un.e systematized; spontaneous ~ debugging work done by users during summer.
Scbool admin. AdeQnate N.A. support
Central admin. Very strong on part of prime movers. Building admin. only acting on support basis of central office
commitment.
Relevant prior . £..tr.Q.n.g and useful in both cases: bad , Present and useful in central experience done individuaHzed instruction. office. esp. Robeson
we:rked with low achievers. But aide (specialist). no diagnostic experience.

~ Tabl.S.4
Checklist Matrix on Preparedness (alternative format 1)
PSYCHO~SOCIAL CONDITIONS IMPLEMENTATION PLAN
Relevant Scbool Central Ftont- Ongoing Planning. Prior Admin. Admin. End In- Coordination Experience Commitment Understanding Skills Support Support Materials Training Service Time Etc.
1
Users
2
Building 1
Administrator
(principal) 2
1 Central Office Administrator
2
Other Central Office Staff
. ._- , ...... -

r I I
Table 5.5 Checklist Matrix on Preparedness
(alternative format 2)
CONOITIONS USERS ADMINISTRATORS
Strong
Second, the analyst has clustered the conditions into two general domains: psychosocial and the implementation plan. That clustering permits comparing these more easily.
The cell entries for Table 5.4 are a rating of "strong," "moderate," "weak," and "absent," accompanied by a brief explanatory phrase showing what the condition consisted of. as the respondent saw it. (Undef"materials," for exam~' pte, a user might have said. "basic notebook, plus the file cards and prep sheets,")
Table 5.5 takes a different cut. The cell entries here are the names of conditions, together with the N of users or administrators reporting. An asterisk can appear beside condition names in the first row seen as "most" missing, and a number symbol (#) beside those seen by respondents as critical for success.
Table 5.5 thus sorts the conditions by role, according to how "present" they were, and lets us see which were important. But note that we now have lost the data for individuals that appeared in Table 5.4. It is also much harder to track the status of any particular condition. Matrix building is full of this sort of trade-off.
Table 5.6, a third possibility, de-emphasizes the differentiation among administrators and users and takes a decisive turn toward the dynamics of conditions-how and why they are important. It also brings in the researcher's view of the situation. We have retained the idea of specific examples, but we have lost identifi!l-ble individuals and the capacity to make easy comparisons between users and administrators.
Any data set can be dispJay'ed in many different ways. Each way gains you some things and loses you others. The moral: DO,not close up too rapidly on a display format. Try several iterations; get colleagues' ideas and reactions.
Components in a checklist matrix, although they begin as unordered, may sometimes have a meaningful structure. They may fall into several clusters, as in Table 5.5, or even
B. Partially Ordered Displays II 109
Table 5.6 Checklist Matrix on Preparedness
(alternative format 3)
CQNnmQN$
Commitment
Underslln4lng
Materials
Tniftlng
EXAMPLES HOW
IMPORTANT WHY
IMPORT Am-t
Speeltic IIII1Untlou, muted ... lIh A or U fllr admlnlmator or u,er, rupeetlvely.
b. RBtln8 •• v~ry. q~lto. Jllmewhat. or aOI ImpOl1alU. c. Elplann!lon, of :euonl for lmportnllU of condltlon, ~lveD
by re.pOftdenl (A Or U) or ruear;bcr (It.).
can be ordered from peripheral to central, or weak to strong.
Columns also can refer to levels of a site (e.g., classv
room, school, district). Especially for exploratory work, it pays to have a col~
umn headed simply "Remarks," where relevant commentary of any sort can be included to aid understanding.
Advice
Checklist matrices are good when you are exploring a new domain. If you have some rough ideas about some key variable and some first components of it, you can begin and then amplify the display as you learn more.
In fact, a checklist format itself does a good deal to make data collection more systematic, enable verification, encourage comparability, and permit simple quantification where you think it is appropriate.
Always consider several fonnat possibilities: Ask a colleague for ideas. Look at what different formats give you and what they withhold from you.
Be explicit about the decision rules you follow in (a) selecting quotes and (b) making judgments or ratings. Otherwis~ colleagues or readers will be dubious about your conclusions-and you probably wiJI come to doubt them yourself. Keep quotes and ratings together in the matrix so that their mutual, pertinence can be assessed.
Time Req,*ired
If the written-up field notes have been coded to permit easy retrieval of chunks related to each component of a

110 • WITHIN·CASE DISPLAYS, EXPLORING, DESCRIBING
checklist matrix, and iffewer than a dozen or so informants are involved, a display like this can be assembled in 1-3 hours and analyzed rapidly. Most of the hard work-refining the components of the matrix-will have been done during instrumentation and early data collection.
Again, the time estimates are a reasonable range, in our experience. Just how much time it takes depends on the computer software in use, the researcher's skill, the theory underlying the study. the particular research question at hand, the completeness of the data, the number of informants, the number of cases, and so on.
The Transcript as Poem
As a break from the SOrts of complexly crafted displays we have been looking at. consider Box 5,1. Richardson (1992) interviewed Louisa May, an unmarried mother, and converted 36 pages of interview notes into a focused, par· tially ordered display: a 3·page, 5·stanza poem. of which the first appears here. Richardson notes that she used only Louisa May's "words. her tone and her diction, but rel[ied) on poetic devices such as repetition, off-rhyme, meter, and pauses to convey her narrative" (p. 126).
The display is striking. It brings the reader very close to a condensed set of data, has a compeUing flow. and forbids superficial attention by the analyst. You have to treat the data set-and the person it came from-seriously because a "poem" is something you engage with at a deep level. It is not just a figurative transposition, but an emotional state· ment as well.
As Richardson notes, such a display "breaches socia· logical nonns" by ignoring defined variables, by empha· sizing the "lived experience," illuminating the "core" of the case involved. engaging the reader (and theresearcher) emotionally, and shifting the concept of authorship.
The time taken was substantial: 4 weeks, with nine drafts and four critiques by others. Two points: (a) the selection, organization. and presentation of data in a display are decisive analytic actions. and (as in this case) they need to be done in a thoughtful, lucid way; (b) displays owe as much to art and craft as they do to "science."
Richardson wrote very little separate "analytic text." in our terms, but there is nothing in the method to discourage that.
C. Time-Ordered Displays
A second major family of descriptive displays orders data by time and sequence, preserving the historical chronological flow and permitting a good look at what led to what, and when.
Box 5.1 Excerpt From a Transcript as Poem
(Richardson, 1992)'·
LOUISA MAY'S STORY OF HER LIFE
The most important thing to say is that I grew up in the Soum. Being Southern shapes aspirations shapes what you think you are and what you think you're going to be.
(When I hear myself. my Ladybird kind of accent on lape, I think. OH Lord. You're from Tennessee.)
No one ever suggested to me that anything might happen with my life.
I grew up poor in a renti!d house in a very normal sort of way on a very normal sort of street with some nice middJe·class friends
(Some still to this day)
and so I thought I'd have a lot of children.
I Jived outside,
Unhappy home. Stable family, till it fell apart The first divorce in Milfrount County.
So, that's how that was worked out.
Event Listing
Analysis Problem
Life is chronology. We live in a flow of events. Some of these events occur before other events, some after. We usually believe that connections exist between events (e.g., deciding to renovate a bathroom leads to taking out a loan, the arrival of worker~, the knocking down of a ceiling, and the intrusion of plaSter dust into other rooms).
But although we can think of ourselves as being in the midst of a river of events, that metaphor breaks down. because the river's flow is not one-dimensional. Some events occur in one domain of life, others elsewhere (the plaster dust intrusion Qccurs while one is revising the last chapters of a new book). Some events are close to us) some

distant (while the loan is being taken out, the 1984 U.S. federal budget deficit is projected as $191 billion). ' Some events are related coherently to other events (the ceiling removal and the plaster dust), and others are adventitious (a loved old cat dies).
Life goes on. Years later, the plaster dust is long gone, the book is being rewritten. and the federal budget deficit for 1992 is projected at $334 billion. EVents long ago in time have consequences for the present (there is a new cat closely resembling the old one). Distant events can have consequences in close events (one writes a letter to the Times denouncing the newspaper's typically misleading allusion to "the" deficit, rather than to "(his year's deficit").
Qualitative researchers are always interested in events: what they are, when they happened, and what their con~ nections to other events are (or were )-in order to preserve chronology and illuminate the processes occurring. A pro~ cess, after all. is essentially a string of coherently related events. Typically these interests lead to the production of an extended narrative, arranged in proper time sequence (usually without flashbacks or flashforwards). But ex~ tended, unreduced text, as we have noted, has severe disadvantages (its size, its dispersion, and its lack of struc~ ture). Extended text only feebly resolves the problems of multidimensionality, inter-event influence, and differen~ tial salience of events.
However. narratives are probably indispensable if we are to understand a complex chronology in its fuB richness. The problem is tbat going straight to an extended narrative from written~up field notes runs an acute risk: You can tell a story that is partial, biased, or dead wrong-even though it may look vivid, coherent, and plausible to a reader. The event listing is a good way of guarding against false chro~ nologies.
So the problems we face in understanding event flows are those of sorting out the different domains of events, preserving the sequence, showing the salience or signifi~ cance of preceding events for following events-and doing all of this in an easily visible display that lets us construct a valid chronology.
Brief Description
An event listing is a matrix that arranges a series of concrete events by chronological time periods, sorting them into several categories.
Illustration
In the school improvement study, we wanted to display events during the adoption and implementation of an inno~ vaticin at the school level. showing them by different phases or time periods of the process. How might this be done?
C. TIme~Ordered Displays _ III
Building the display. Keeping the classic left-to~right convention for the passage of time, we might make columns of the matrix be successive time periods. These could be defined arbitrarily, (e.g .• Year I, Year 2) or more organi~ cally, by empirically derived phases or stages of the adoption-implementation process.
Which categories might we define for different types of events? A simple set is one dealing with the locale of events: school level, school district level, state, regional, or federal level. They could be rows of the matrix.
Perhaps some events are more critical than others, serv~ ing to cause new events, or move the process forward into a new phase. They could be noted or marked in some way,
Table 5.1 is repeated on the fonowing page. It shows how this technique worked out for an innovation called SCORE-ON, a laboratory for teaching remedial math and reading skills to children "pulled out" of their regular cIasses.1'l1e time periods ("contextual press," "emergence of the problem," etc.) were initially defined conceptually from a general adoption~jmplementation model. but labels for each period came from the actual core activities during that period. A new time period was defined when a signifi-cant shift in' activities occurred. '
The analyst focused mainly on Smithson School. and wanted to have that as the most "local" of the locales (bottom row). However, the innovation was also being imple~ mented in other schools (next row up). And events could be sorted into "district" and "state/macro" levels, which, in tum. influenced the lower levels. ,
Finally, the analyst marked "barometric events" (those that moved the process on into the next time period or phase) with an asterisk.
Entering the data. An exploratory interview question had asked people to describe the history of the innovation ("Can you tell me how SCORE·ON got started in this school?"). Follow-up probes fleshed out the sequence from innovation awareness to adoption. how and by whom key decisions were made, and the reasons involved. Other questions dealt with outside agencies and events and "any~ thing else going on at the time that was important." Similar questions were asked about events during the implementation process.
The analyst looked at coded field notes (here. the codes are any that include the subcode CHRON, for chronology) and extracted accounts of specific events, such as "4th grade teachers report 40 pupils 1-3 grade levels behind," or "officials see SCORE-ON at 'awareness fair.' "
Decision rules for data entry must be clear. In this case the analyst d~fined an event as a specific action or occur~ rence mentioned by any respondent and not denied or disconfirmed by anyone else. A brief phrase describing the event went in the appropriate cell. If at least two people said the event was important, crucial, or "made a big dif~

112 • WITHIN-CASE DISPLAYS; EXPLORING, DESCRIBING
Thble 5.1 (Repeated) Event Listing, Banestown Case
TIM E PERIODS AWARENESS TRAININO AND BUDGET
CONTEXTUAl. EMERGENCE OF AN)) PROPOSAL APPROVAL AND BEGINNING EXPANSION, ~ffRUUC;W~~ PRESS THE PROBLEM O1'80LUTION PREPARATIONS OPERATIONS NEW OPENINGS LEVEL 1976·78 Oel.1978 Nov. 1918 lan.-Feb.191!} March.April 1979 Se. t. 1979 May 1980
minImal proposal Smithson middle Reduction in Tltle
State} competency discussed, school teachetS, 2 I allocations
Macro levels, testing approval at admlns. trained at Introduced In state level DID site (4 days. state schools earlv March) supplemental • alarm at .. officials sec • Smithson • 30 4th grade • staff active in .. reduction In skills program failure rate SCORE-ONat pupil folders pupils selected extending county, Title I introduced in • Internal 'awareness $creened for Smithson Smithson, budgets
District reading and solutions fair' • appointments I,b launcb~ng new ~ proposed staff math proposed, • IV-C made of • materials, labs cuts, transfers
found proposal Smith$on lab technical .. fnnding for all In elementary unacceptable rapidly teacher and ushtance lab slatf'a:t scllools
drawn up, "" intensified for Smithson taken submitted Smithson lab over by Title I
pressures • continuation - rooms, staffing lab opens at • middle scbools begin to raise fot (ollowing completed for CarrIngton, unaffected by minimal year planned middle schools Banestown cuts
Local levels (or Sih grade ~ 2 other elemen- Middle. - threat of Schools in 2 mIddle tMy schools modified version discontinuation
schooh; authorized to opens at Smith at Banestown teachetS implement In Camp, South End Middle named the fall (conflicts)
large numbers .. 4th grade • teachers • Jab teacher - Smithson lab Smithson .. major shifts in of low teachers approve and aide opens (late expands to 45 lab staffing achievers report 40 pUIJ-out lab replaced; Marcb) pupils in 3rd, announced to placed in pupils 1·3 formula . some ~ preparations 4tb grades teacbers
Smithson FACILE grade levels disgruntlement inadequate. • new teacher • program to be School classes behind • lab room materials nOt added for cut back,
• teachers created, arrived, morning focused on unfavorable minimally scbedullng sessions grades 1·3, to central equipped dIfficulties limited to 1.5 office posts proposals
• barometric event
ferenee" for what happened subsequently, an asterisk was probably an alarm or trigger that set off actions already fueled by concern at the district level to meet state re~ quirements.
assigned. "
Drawing conclusions. A quick scan across the display shows us that the process of change is strikingly rapid. A problem seen in one elementary school in the fall of 1978 by the fourth~grade teachers apparently leads to the dis~ covery and introduction of an innovation (SCORE·ON) that was in place in fiv~ district schools by the following fall.
A look at the asterisks helps explain some of the speed: the active involvement of central office officials after they saw the innovation at an awareness fair, leading to justi~ ficatory events such as the pupil folder screening. and to specific school~Ievel planning and the appointment of specific teachers to manage the "remedial laboratory. We also can see that state-level competency requirements were the backdrop, and that the teachers' report of problems was
When we note the repercussions of an externally driven budget crisis during the following school year, we can draw the inference that the original availability of Title I funds might have played a strong part in the original changes.
These are plausible hunches about the meaning of the data in TableS.I. To check them out, the analyst can now begin to piece together a focused narrative that ties together the different streams into a meaningful account, a narrative that could only with difficulty have been aSsem~ bled--or understood-from the diverse accounts spread through the field notes.
Here are some excerpts from the focused narrative the analyst produced. They should be read in conjunction with Table 5.1.

Beginning in 1971 and intensifying in the years 1976-78, the State issued a series of increasingly precise and constraining documents. These texts called at first for adequate "standards of quality" in education (which] were then outlined in the major subject matter areas. Competency testing was announced, first for grades K-3, then for 4-6 .... After some delays, the first statewide tests keyed to these objectives for reading and math were scheduled for grade 4 in 1979 and fbr grades 5-6 in 1980-81..
The response at the district level was to create a "suppleme:nta1 skills program" in order to intensify remedial work in reading and mathematics so that minimal competency levels could be attained ....
Schools throughout the county became more sensitized to the minimal competency obligation .... The implication was in the air that teachers might be held accountable for excessive rates -of failure on statewide competency tests, but the pressures were still diffuse within individual schools. Teachers routinely attributed low performance to subnormal aptitude or to conditions at home over which they had no control.
A special impetus was given in the fall of 1978, when the six fourth-grade teachers at Smithson noticed that they had an unusually large cohort (40) of incoming pupils who were one or more grade levels behind in reading achievement ... Thirty-eight of these forty had comeoutofthe [existing] FACILE program in the first to third grades. It is not clear how so many of these pupils got to the fourth grade, but no one was surprised. The Vice~Principal says, 'They got too tall, they got too bad."
'The teachers were worried that either promoting or retaining so many pupils would cause problems; they were leaning toward retention, but feared a massive protest by parents. Essentially. they were covering themselves, by announcing early in the year that they had inherited, not created, the problem ....
The teachers contacted Mrs. Robeson, through the reading committee which she chaired. She met with them, then brought in Mrs. Bauers, the elementary supervisor ....
During this phase, a circular announcing Federal flmd~ jng ... came to the central office from the State superintendent. An awareness conference, presenting a series of projects, many of them keyed to remedial skill development, was to take place nearby. At Mrs. Bauers' initiative-and with an eye to a solution for the problem at Smithson School-a con~ tingent from' the central office (Mrs. Bauers, Mrs. Robeson, Mr. Rivers) attended the presentations and was attracted to SCORE-ON, It seemed a relatively flexible program, easy to integrate into the school in pull-out form. It was directed specifically to the bottom quartile in reading and math ....
A proposal was written by Mr. Walt ... with a request of $5,600 for training and materials. The request was cleared through the State Department, following a visit to the capital by Mrs. Bauers and Mrs. Robeson, accompanied by Alan Simens, principal of Smithson School.
C. Time-Ordered Displays II 113
Note several things here: (a) the narrative, which is both straightforwardly descriptive and analytic, helps knit together and flesh out events at different levels of the chart, (b) the analyst can.add explanatory conditions or states that show how one event led to another, (c) the return to the field notes often turns up other critical events or supporting information not originally in the display, and (d) the narrative is more understandable when read in conjunction with the display, and vice versa.
The event listing helps ground the analyst' s under~ standing of a complex flow of events, and increases confidence in the associated chronological account. It also lays the basis, as we shall see, for the beginnings of a causal analysis: what events led to what further events, and what mechanisms underlay those associations. Full-fledged causal networks are discussed in Chapter 6.
Variations
Event listings can be limited much more sharply to "critical incidents" (see Box 5.3), defined as important or crucial, andlor limited to an immediate setting.
For a careful reconstruction, the events in a listing can be dated within cells. Or the time periods can be specified much more narrowly. Or an event listing can cover a very brief time span (e.g., 1 hour in a classroom). Microlevel events can be well shown in a networklike flow in the "activity record" (Box 5.5).
Events from a listing also can be shown as a networklike flow that includes more general "states" or "conditions," such as "lack of enthusiasm": see the description of "event-state network" below, and Box 5.4.
Even more selectively, events can be shown as a flow limited to major events, each with a shorthand explanation of the connections or causal pushes that moved the process from one event to another. Box 5.2 shows a network adapted from work by M. Pillet (personal communication, 1983), who was interviewing students who had interrupted their university studies, tracking them through subsequent experiences.
The case here is one student. The succeeding "experiences" are indicated in the left column; at the right we see the researcher's summary of the major forces moving the student to the next experience. The plus marks are an as~ sessment of the strength of the various forces; the minus signs show the student's strength of dissatisfaction with the succeeding experiences.
, Advice "
Event listings are easy to do, and have good payoff in understanding any extended process. They can be done at

Jl4 • WITHIN·CASE DISPLAYS: EXPLORING, DESCRIBING
Box S.2 Event Flow Network:A Student's Learning and Work Experience
many different levels of detail. Think first of how "micro" you want to be. Sorting out a series of candidate events on file cards (or in a computer subfile) can help stabilize the fineness of the approach.
In building matrices, keep the rows to a maximum of four or five levels and be sure they represent a meaning~ fully different.iated set of categories. Do not go finer than the study questions dictate, (In Table 5.1, we didn't need to use events in the classroom locale.)
If you know in advance that you want to construct a chronology of events. then something like a CHRON code is essential to keep you from being overloaded with specific events. Doing an event listing for ongoing (not retrospectively recalled) events can be even more time~ consuming unless clear codes (e.g., CRIT) for various types of critical events are assigned along the way.
As always, keep decision rules for data entry explicit and clean. When you enter a phrase or a piece of data, it helps to have a "source tag" attached so that you can get back to its location in the written~up field notes (e.g .• you might use 2-31 for interview 2, page 31) as you work on the production of the narrative. (Many software programs can assign source tags automatically,) Be sure you have exhausted the coded data chunks before you start taking a summary look.
When the first version of the display is filled in, start a draft of a focused narrative. That step will require you to
'-:'.
Need for ~breathing room"+++
Hard reality of factory work:+++
Lack of a link to + own practical interests
Met "marginal," alienated youth +
Wish to d2 something + +
return to the field notes as you go. Stay open to the idea of adding new events to the listing or subtracting events that seem trivial or irrelevant.
Consider the idea of some quantitative analysis of events and their sequence.6
Time Required
As always, much depends on how well coded the data are, the scope of time covered by the event listing, the fineness of detail, and the scale and complexity of the setting. An event listing like the one in Table 5.1 (one site, perhaps eight key informants, wen-coded notes) can be assembled in half a day. The Pillet variant, on the other hand. was done in 15 minutes by a researcher closely fa~ miIiar with the data in a single interview focusing on one person.
Writing the focused narrative usually takes about as much time as creating the event listing itself-more than for the typical analytical text accompanying other types of display. The illustration in Table 5.1100 to a IO-page nar~ rative, which required about 5 hours of work. This is time wen invested; an event listing and associated focused narrative represent your first basic grasp of what happened and suggest the subsequent lines of deeper description. analysis, and interpretation that will follow.

Critical btciden! Cbart
Sometimes a researcher wants to limit an event listing to those events seen as critical, influential, or decisive in the course of some process. A useful approach w~ devel w
oped by Stiegelbauer et al. (1982), who extracted "critical incidents'.' occurring during implementation of a new language arts program at a school site. The process was aided by specialists in the CBAM (Concerns-Based Adoption Model) approach to school improvement.
In Box 5.3, time goes vertically. That orientation makes it a bit easier to examine and compare events that occurred during a given time period. The columns are not ordered, but easily could be. The dates for events make temporal ordering easy.
The chart selects only two to four critical events per month and marks (with boxes) those seen as having a "strong catalytic effect" on determining the need for the program or on the principal's "game pJan" (strategy) for implementation. Certain events are also marked that afM fected a subprogram for writing skills. The authors' analytic comment is: "Relationships between events can be seen as both temporal and due to an exchange of information. In this school, teacher confusion about the program, discussion of teacher concerns, and new information about the program from the resource teacher aU had a significant effect on program development" (p. 17).
Event·State Network
The alert reader will have noticed that some entries in Table 5.1 are not really specific events, but more general "states," such as "alarm at failure rate," Such states or conditions are not as timeMHmited as events, and often serve as the mediators or links between specific events.
You can display this difference by showing events as boxes (the sharp edges imply specificity and a narrow time. span) and states as bubbles (round edges imply more diffuseness,less concreteness, existence over a longer time). You connect the boxes and bubbles by lines to show what led to what. Box 5.4 shows an excerpt from an event-state network drawn from the data in the event listing in Table 5.1.
EvenHtate networks are a simple, easy way to make sense of an event listing, Once an event listing is done, a network can be generated rather quickly, Write one event per small card. generate "state" cards as you go, and arrange the emerging network on a big sheet of paper, drawing arrows as you go. As we explain in Chapter 6, section D, this method is an especially helpful step toward assessing causal dynamics in a particular case. To create state cards: (a) recheck the field notes for evidence of the consequences andlor antecedents of specific events and (b)
C. Time--Ordered Displays II 115
Box 5.3 Critical Incident Chart and TIme Une
(excerpt from Hawthorn School) (Stiegelbauer, Goldstein, & Huling, 1982)
... "'" PI~trltt ,I ,,~ I«IrhMp 'or ""n"M~ 'or prh.;I ... 1$ t'ffOvrce telC~~" re: CO«IXISltlOn - .. - ..
Sept. 9/4; 919;1IIU '" "00 9/24.29 Prlntlp~1 IlIstrlct "".k· Prlnd ... l _ts "Ith shop for rreeb:"ltl! '''u<lUrce t"IC~.'" on te~chel'J tucht. to c""~O$ltlo'" 'boll! teachers' P14~ for sourrellDo~ 9041s for lelr ye ..
~,.
r!~/IN~l 10114 10ft:! i~~~~ ISBD OM' Pdfl/;I ... , Prlneipol IftteNI_ h" stoff _ts "lth telchu tells WIchers =~ftl:n <'HOUrce I>l'tncl~l of
te.c~er r. otller telchers'
' ... ~~ c""'l'oSltlon cOtlcilrns ,boIIt
«InflrSed Innov.tlon
'bout roo 9 .... "f.n c_ttu. to reYIew<
~ .. IUle<" lIlIO Prlnclpll_ts 1980 hind".) Prlfl/;Ipal , "ltII y.rl""s
, resour<;t I'eSOIIr<;e te •• «.tllt,.,. to encou'" \:Ndler...,.t che ...... t IIItI! 19.""'1'1: ... (_· to ph" ""'0 c""",itt~ {In_ 11t1 ... ·relu,e<l politiOtl , (1IIIIeI6t11 ICtl.ltlH c_IIU:1I grlde lucher)
tim
rr~' "q HI"
c-ttt"tNohOI'l ~r tells Re'lOIIf"Ct teo. ~t"Itt. others ptll>C:lpal of ~h.r "'lets H 9"ld~ level district Ideo. ..ttt. t"""tt~ to .'frlf, In Z notIon,', tnnovUlon ~rPtr .... " IOller
9rodl1ll
,.". lZ/I;)UI5 12110 12/1~ 19aO Prlnotf'lll A Resource t.l· Re'lour.e t!lc~.r
re'lO~ to.· the .. """U dl$trlbutu leellt dl.r_t to "ttll oOOllllttoe .1Id st<l"eft.~ to 411 pI," _pos'. teetlons to I'\!_ to'dl~,.,. Uon ..... ltt" Yiew stope and ""tlft9S tf<!U8Ce
lUI 12118 eo.~lltlon R.'OIIrce tuc~r dl'Cllued O>C!tU "Ith c_ .t ~toff _tlng mlttee nett ....
to pll" * f-. "~.--.-~
LtCE/lD • referl' to events tllat wert! crltlcd In Initiating ..... ltf"9 c~'Htoft I •• proVNa lf011Tl1t. frtn the hog"'ge ~rts nrrlcul"~ I •• I<l101., 1M, ... enb; led to th~ devel_nt M I tIAIlTIIOAA wrttfM p,.." ...... I>Ind on t!ldlerl' Mt'4S alld SO\l""tboo~ guldehn"_
£«IIn w.edO ".~. tt!"Oll9 c.tIIlltl~ .ff~t 011 'otuSllIi the prog_ Or On 'I!¥eloplnv the principal's 'ill>!! phn 'or I""'_"tltlon.
surface your generalized understandings of what was moving events along in the process you are stUdying. By the time an event listing is generated, you usually have a set of implicit generalizations about why things happened as they did. Event-state networks are a way of making those ideas explicit and verifiable. Programs such as Inspiration and MetaDe~ign (see Appendix) permit you to create such networks eaSily, shifting and changing them as your understanding grows.
EvenHtate networks are enjoyable and rapid-an hour or so for the size shown, after the event Jisting is complete. It does not usually help to add a long narrative text (the

0:
at Smithson School
\TtwarenessoftheprOblem: /
Winter 1978-79
Box 5.4
Event-State Network, Banestown Case (excerpt)
discovery of SCQRB.ONat NDN awareness
-' writlOtt for stale funding
competing faction objects to fonnula. approves progmm
elemenuuy school. middle school (rollow~up)
""'h"" hired, tmined
\ ~lulion and preparation for implementati?n: /
Peb. ¥ March 1979
program expanded to2middle schools. 2 elemenlar}' schools
complaints
ov" disruption of schedules. 'easy job' in lab
support soughl from external funds, controlled by other faction
redoubled effort 10' prepare rust ruU-cycle ,, _______ ... implementation E ..
\ -bmPlement.at.fun:;
March 1979
\ T4Expansion and takeover by FACH.B money and supexvision: /
Sept.. 1979

r C. Time·Ordered Displays • 117
Box 5.s Activity Record: Example (Werner, 1992; Werner & Schoepfle, 1987b)
ENTER Change Tire EXIT
get spa IInlsh up p~
""Y g. (lady J.d<
Change Tire
display itself is more economical and illuminating). but a summary set of analytic comments is useful.
Activity Record
It often happens that you want to describe a specific, recurring activity, limited narrowly in time and space: a surgical operation, the sale of a used car, a classroom lesson, an arrest booking, cashing a check, planting a garden. Such activities-really, predictably recurring sequentia1 patterns-are the stuff of daily life.
The activity record, described by Werner (1992) and Werner and Schoepfle (1987b) displays specific actions, each assigned to a link, shown as an arrow (Box 5.5). Each "node" in the network is understood as signifying «and then .. , ," Thus you "get spare" and then "get jack" and then "jack it up part way,"
Note the hierarchical levels: "get ready" is composed of "get spare" and "get jack," and so on. The same appJies to "change tire": Each level of "change tire" subsumes the
later activities beneath it. As Werner points out, the activity of literally changing the tire only appears at the very bottom; the levels above, however, are important contextual preconditions for the subactions below. (You cannot actually change the tire without having jacked up the car.)
Werner notes that the method makes activities very explicit, showing their time boundaries and sequentiallhierarchical structure, and can be used easily with informants for checking accuracy.
Decision Modeling
The activity record is useful in mapping patterned actions. but it does not tell us much about the thoughts and plans, the alternative decisions made during a flow of actions embed~ed in a range of conditions. Decision modeling, also des'cribed by Werner and Schoepfle (1987b), uses displays that combine these internal events with public ones.

118 • WITHIN-CASE DISPLAYS: EXPLORING. DESCRIBING
In this example, the authors begin with text from a cook~ book (Jaffrey. 1975):
There is a slight problem with supermarket spices which you might as well be aware of. Those spices which do no! "move"-i,e .• sell fast-tend to stay on the shelves and gel stale. A few lose their aroma, others fade in the light, some get oily and rancid. Therefore try to buy only whole spices and grind them yourself in small quantities. The grinding can be done in a coffee grinder, or, if the spices are slightly roasted first, some can be crushed between waxed paper with a rolling pin. The electric blender will grind spices, if you do them in sufficiently large quantities. If all else fails. you could use mortar and pestle, though that tends to crush spices ratherthan grind them. Whole spices retain their flavor for very long periods. Make sure you store them injars with tightly screwed lids, well away from dampness and sunlight. Ground cumin and coriander are fine if bought from Indian spice dealers in small quantities. (Werner & Schoepfle, 1987b, pp. 130~ 131)
Box 5.6 shows a flow chart indicating how Jaffrey's directions can be represented systematically. It strips away rich but nonessential information (e.g., different styles of becoming stale, methods of storage) but retains the key conditions and specifies contingently the decisions to be made.
The authors explain how to create such flow charts by analyzing the text sentence by sentence to locate key con· ditions, associated actions, and assumptions, usually checking all of these with key informants. For precision, the data then are displayed in "decision tables"; systematic elimination of redundancies leads to reduced tables. which then are used to draw the flow chart. (Such charts can be drawn by using many different software packages; one of the best is MetaDesign, which also can "hide" extended explanatory text at each of the nodes.)
The method is very useful for making the inexplicit vis· ible and clear and can also be used for recurring decisions involving many people and complex situations (e.g., fann~ ing methods, patient care in an intensive care unit, serving a meal to a party in a restaurant, dealing with customer complaints. producing a contract research proposal). Repeated interviewing of multiple informants "is usually needed. along with attempts to "disconfirm" the model through feedback and verification, and checking with a new, uninterviewed sample of people,
Growth Gradient
Events can sometimes be conceptualized as associated with some underlying variable that changes over time. That is a rather abstract characterization. which will come immediately clear with a look back at Figure 5.1.
N
Box 5.6 Decision Modeling: Example (Werner & Schoepfle. 1987b)
y
eITER BUYING SPICES I
~&Jjgh~y,
grind willi tullu.g pm betwcm waxed
"'"
Here the analyst is interested in a main variable. internal diffusion of an. innovation, defined as growth in the number ofteachers using it. That variable is represented in network form as a single line between points. But the analyst has attached various critical events to the line-appointments of key personnel, training, and the like-that help expand our understanding of the movements of the main variable (e,g .• the sudden jump following the August 1977 workshops),

Time~Ordered Matrix
Analysis Problem
With qualitative data you can track sequences, processes, and flows. and are not restricted to "snapshots." But hoW to display time-linked data referring to phenomena that are bigger than specific "events," so as to understand (and perhaps later explain) what was happening?
Brief Description
A time,-ordered matrix (the more general form of the event listing we reviewed above) has its columns arranged by time period, in sequence, so that you can see when particular phenomena occurred, The basic principle is chronology, The rows depend on what else you're studying.
Dlustration
In our school improvement study, we were concerned with how an innovation was changed and transformed over time during several years of implementation, We predicted that most innovations would show such changes as they were adapted to the needs of users and the pressures of the local situation.
BUilding the display, We broke down the innovation into specific components or aspects, using the'se as rows of the matrix. The columns of the matrix are time periods, from early through later use. If a change in a component occurred during the time period, we could enter a short description of the change, A blank cell would mean no change-a nice feature that permits seeing stability, as well as change.
Table 5.7 shows how this matrix looked. The innovation, CARED. is a work experience program for high school students. The official components were those specified by the original program developer. These components do not necessarily exhaust important aspects of the inno~ vation, so there are rows for "other aspects." such as time and credits or student selection. Such aspects usually ap_ pear after initi,al fieldwork and direct experience with the use and meaning of the innovation.
The columns are time periods, starting with the initial planning period (because we expected changes while this relatively demanding and complex innovation was being readied for use). The three succeeding school years fonow.
Entering the data. In this case the analyst was looking for changes in the innovation. component by component. Those changes could be found in the coded field notes,
C. Time·Ordered Displays • 119
where innovation users had been asked whether they had made any changes in the innovation's standard format. Follow-up probes asked for parts that had been added. dropped. revised •. combined, or selected out for use. In some cases documentary evidence, such as evaluation reports, could be consulted.
In this case six or seven people (users) were reporting on clearly defined changes in the innovation, which itself required rather close teamwork, with mutual monitoring and daily discussion. So we used the decision rule that if a reported change were confirmed by at least one other staff member and not disconfirmed by anyone else, it should be entered in the matrix.
Drawing conclusions. Rather than showing the final analytic text, let's sit at the analyst's elbow as he begins drawing conclusions. Looking across the rows of Table 5.7, you can begin to see "drifts," or gradual shifts expressing an accumulated tendency underlying specific changes. For example, the row "program requirements!curriculum" shows an increasing tendency to make stiffer achievement demands on students. (The tactic here is noting patterns~ themes-see Chapter 10.)
The component "student responsibility and time use" suggests that a process of exerting more and more control over student behavior is occurring (e.g., the «accountability" scheme, the system of passes, etc.).
At this point the analyst can deepen understanding by referring back to other aspects of the field notes, notably what else peop1e said about the changes, or reasons for them, In this example a staff member said: "Your neck is on the block, .. the success and failures of the students redound directly on you .... There's a high possibility of accidents."
The field notes also showed that some parents had complained that "students can't handle the freedom," and that staff were worried about students "fouling up" on their work assignments on the job. So the increased emphasis on control might come from the staff's feeling of vulnerability and mistrust of students (tactic: noting relations between variables).
A third drift can be noted: increased routinization and reduced individualization. occurring mainly in the second year of operation (student "hatching," reduction of unique projects, addition of various standard forms). The field notes showed that the staff was preoccupied with the program's demandingness ("You keep going all the time, .. you can't get sick ... it's more than a job."); after a full year's expegence, they were ready to routinize and streamline the demands that a strongly individualized program made on them. The reduction in parent involvement may also, be a connected issue.

!l
DEVELOPER COMroNENTS
OTHER ASPECTS
TableS.7
Time-Ordered Matrix: Changes in the CARED Innovation (a work-experience program)
Individualization
S'tudent responsibility and time use Direct exposure to work experience
Program requirementsl curriculum Learning strategies
Parental involvement
Time and credits
Student selection
Program size
PLANNING PERIOD Jan.·]une 77
Added logs/time sheets
Did not include employer seminars; intensified "competencies" experience
Reduced to 4·hr time block: students must take 1 other course
FIRST YEAR 77·78
Added "accountability" scheme for discipline
Added direct instruction on basic skills, separate from .iob Wrote new "competencies" Discarded learning style instrument New basic skills materials Parent advisory committee added
32 students
SECOND YEAR 78-79
Some tendency to "batch" students, encourage standard projects, etc. Added system of passes for students to leave room
More competencies required
Student learning plan only 1 semester; more basic skills emphasis
Advisory committee mtgs dwindled and stopped
Moved away from full·random selection to self· selection plus a few random 64 students
THIRD YEAR 79-80
Refusal to accept late work; students were failed
Some tendency to reduce individualization/exploration aspects; more long-term placements; convenience location of jobs More competencies and project required
Journal more routine communication; less counseling emphasis
Reduced level of detail in reporting to parents
Lower SES
70 students. cut to 50 in 2nd semester; 25 for next year (junio_~~<?nly)
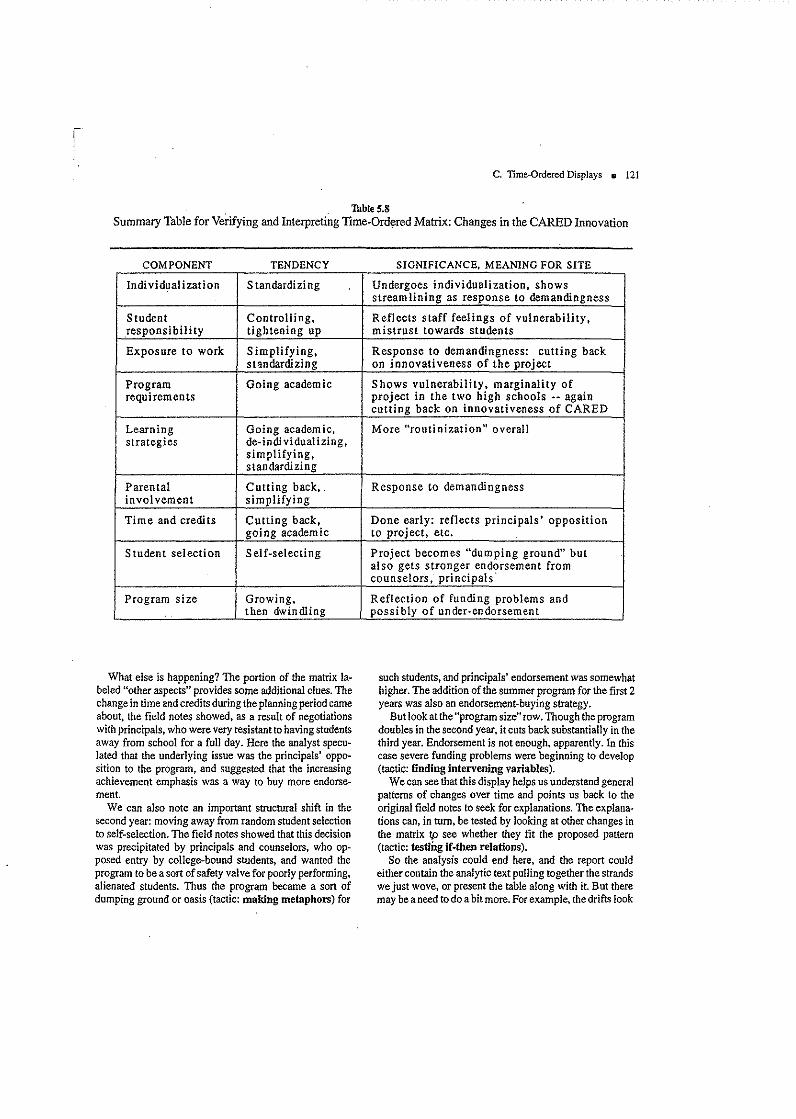
C. TIme·Ordered Displays • 121
'Thbl.5.8 Summary Table for Verifying and Interpreting Time-Ordered Matrix: Changes in the CARED Innovation
COMPONENT TENDENCY
Individual ization Standardizing
Student Controlling, .responsibility tightening up
Exposure to work Simplifying, standardizing
Program Going academic requi rem en ts
Learning Going academic, strategies de-indi vidualizing.
simplifying, standardizing
Parental Cutting back, . invo! vement simplifying
Time and credits Cutting back, going academic
Student selection Self-selecting
Program size Growing. then dwindling
What else is happening? The portion of the matrix labeled "other aspects" provides some additional clues. The change in time and credits during the planning period came about, the field notes showed, as a result of negotiations with principals, who were very resistant to having students away from school for a full day. Here the analyst specu~ lated that the underlying issue was the principals' opposition to the program, and suggested that the increasing achievement emphasis was a way to buy more endorsement.
We can also note an important structural shift in the second year: moving away from random student selection to self-selection. The field notes showed that this decision was precipitated by principals and counselors. who opposed entry by college-bound students, and wanted the program to be a sort of safety valve for poorly performing, alienated students. Thus the program became a sort of dumping ground or oasis (tactic: making metaphors) for
SIGNIFICANCE MEANING FOR SITE
Undergoes individualization. shows streamlining as response to demandingness
Reflects staff feelings of vulnerability, mistrust towards students
Response to demandingness: cutting back on innovativeness of the project
Shows vulnerability, marginality of project in the two high schools -~ again cutting back on innovativeness of CARED
More "routinization" overall
Response to demandingness
Done early: reflects principals' opposition to project, etc.
Project becomes "dumping ground" but also gets stronger endorsement from counselors, principals
Reflection of funding problems and possibly of under-endorsement
such students, and principals' endorsement was somewhat higher. The addition of the summer program for the first 2 years was also an endorsement-buying strategy.
But look at the "program size" row. Though the program doubles in the second year, it cuts back substantially in the third year. Endorsement is not enough, apparently. In this case severe funding problems were beginning to develop (tactic: finding intervening variables).
We can see that this display helps us understand general patterns of changes over time and points us back to the original field notes to seek for explanations. The explanations can, in turn. be tested by looking at other changes in the matrix rp see whether they fit the proposed pattern (tactic: testing jf~then relations).
So the analysis could end here. and the report could either contain the analytic text pulling together the strands we just wove, or present the table along with it. But there may be a need to do a bit more. For example. the drifts look

122 • WITHIN-CASE DISPLAYS: EXPLORING, DESCRIBING
plausible, but we may have been too impressionistic in identifying them (tactic: seeing plausibility). And Table 5.7 may be too "busy" and unfocused for the reader-it is more an interim analysis exhibit than a report of findings.
One way of resolving these problems is to boil down the matrix, to (a) verify the tendencies observed in the initial analysis and (b) summarize the core information for the researcher and the reader.
Table 5.7 could be condensed in myriad ways. One approach is to "standardize" the several drifts by naming them-that is, finding a gerund such as controlling, tight. ening up that indicated what was going on when a change was made in the innovation (tactic: clustering) and then tying that drift to its local context, inferring what the changes mean for the case. The result appears in Table 5.8, a "summary table."
Reading the "tendency" column and using the tactic of counting the number of mentions for each theme confinns the accuracy of the initial analysis. The core themes are, indeed, stiffer achievement demands ("going academic"), more control, increased routinization ("simplifying"), and reduced individualization ("standardization"). You might even try for an overarching label to typify the set-some~ thing like "self-protective erosion," thus subsuming particulars into the general-and this labeling can kick off the final analytic text, usable in the report of findings.
'A scan of the "significance" column helps in summariz~ ing the underlying issues: exhaustion. lack of local endorsement. and the discrepancy between the demands of the innovation and the organizational procedures and norms in the immediate environment.
Variations
It might be helpful, especially for presentation purposes, to add a column to Table 5.7, after each time period, for the researcher's speculations about the issues underlying or possibly causing the changes (endorsement seeking, routinization, etc.).
Here the time periods were relatively long (a full school year), but depending on the phenomena under study, they could be shorter (semesters, months, weeks, days, hours).
The cell entries here were specific changes. But you can also enter specific events. such as decisions, actions, key meetings, or crises.
The rows of this matrix were aspects or components of an innovation. Many other types of rows can be used in a time~ordered matrix. They might be roles (principal, teacher, student, parent); event types (planned/unplanned, critical actions); settings (Classroom I, Classroom 2, playground, principal's office, central office); or activity types (teaching. counseling, formal meetings).
Advice
Use a descriptive time-oriented matrix like this when your data are fairly complete, to begin d.e:ve1oping possible explanations that can be tested by moving back to the coded field notes.
Be sure the time periods chosen are a good fit for the phenomena under study. They should be fine enough to separate events that you want to keep in sequence, rather than blending them into one big pot.
During analysis, remain alert to what this sort of matrix can uniquely give you: timing and sequence. What occurs early. afterward. later? Look for sequences. Look for sta~ bility (in this type of matrix, blank spaces).
After some preliminary analysis, consider whether the rows are organized in a sensible way. You may need to re~ group them into "streams" or domains. Consider whether a boiled~down, next-step matrix is needed to advance your understanding-or that of the reader.
Time Required
If field notes have been coded to pennit easy retrieval of the phenomena under consideration, a matrix of the general size and sort illustrated here usually can be assembled in 2 or 3 hours; analysis and writing may take another hour or so. But a vacuum-cleaner-like matrix trying to display a very large number of data points with a Jess clear conceptual focus will take longer.
D. Role-Ordered Displays
Our third main family of displays orders inforn;tation according to people's roles in a formal or informal setting.
Analysis Problem
People who live in groups and organizations, like most of us, and people who study groups and organizations, like sociologists. health care researchers. anthropologists, and business theorists, know that how you see life depends, in part, on your role. A role is a complex of expectations and behaviors that make up what you do, and should do, as '" certain type of actor in a setting-a family. a classroom, a committee. a hospital, a police department, or a multina~ tional corporation.
Wives tend to see the world differently from husbands, and mothers from fathers and daughters. Doctors tend to see an illness, not a person, and patients often feel unat· tended to. Bosses tend not to see the frustrations faced by workers, partly because they are distant from them, but

r I I
partly because subordinates censor the bad news w~en re~ porting upward. A teacher's'high-speed interactions with several hundred children over the course of a day have a very different cast to them than the principal's diverse transactions with parents, vendors. secretaries, central of· fice administrators, and teachers (cf. Hubennan, 1983).
How can you display data systematically to permitcoffi.parisons across roles on issues of interest to a study? Or to test whether people in the same role do. in fact, see life in similar ways? One answer is the role-ordered matrix.
Brief Description
A role-ordered matrix sorts data in its rows and columns that have been gathered from or about a certain set of "role
. occupants"-data reflecting their views.
Dlustration
Once again we draw on our school improvement study. The question of interest is, How do people react to an innovation when-they first encounter it? This general ques~ tion can be unbundled into several subquestions, such as:
• Which aspects of the innovation are salient, stand out in people's minds?
• How do people size up the innovation in relation to its eventual implementation?
• What changes-at the classroom or organizational leveldo people think the innovation will require?
• How good aftt is the innovation to people's previous classroom styles, or to previous organizational working arrange~ ments?
Building the display. Keeping in mind that we want to see answers to these questions broken out by different roles, we can consider which roles-for example, teachers, prjn~ cipals, central office personnel, department chairs--could be expected to attend to the innovation, and could provide meaningful reactions to it. The matrix rows could be roles, but if we want to make within-role comparisons, the rows should probably be persons, but clustered into role domains. It might be good, too, to order the roles according to how far they are from the actual locus of the innova~ tion-from teachers to central office administrators. The columns can be devoted to the research subquestions.
Table 5.9 shows how this approach looks. The innovation involved is an intensiv'e remediatprogram emphasizing reading, 'implemented in a high school, in the subjects of English, science, and math.
Entering the data. The researcher searches through coded write-ups for relevant data. But which people should be
O. RolewOrdered Displays II 123
included: Only those who were oirectly involved with the innovation, or others with a stake but less direct experience? In Table 5.9 the researcher focuses on all available direct users of the innovation, plus department chairs who were not actually using the innovation but had a real stake in its use, plus key administrators, even though they did not have close contact with users.
The data entered in each cell are a brief summary of what the analyst found for each respondent in the coded field notes. The main decision rule was: If it's in the notes, and not internally contradicted, summarize it and enter a phrase reflecting the summary. There are also "DK" entries where data are missing because the relevant question was never asked of that person, was asked but not answered, or was answered ambiguously.
Drawing conclusions. Now we can begin looking down columns of the matrix, both within and across roJes, to see what is happening. Scanning the first two columns for salient characteristics and how teachers size up the innovation shows us that many teachers-notably in EngUshsee the new· remedial program as prescriptive, with little latitude given for adaptation (tactics: counting and mak .. ing comparisons). And the teachers who see the innova~ tion as prescriptive are also those who have used it the longest, suggesting that prescriptiveness was highest when the program was first introduced (tactic: noting relations between variables). A number of teachers also mention complexity (though note that firstwyear users are more Hkely to see the program as simple and easy to use, suggesting program stabilization).
When we drop down to department chairs and central office administrators, the picture is somewhat different. They are more likely to take the "big picture" view, em~ phasizing the "curriculum," "strands," and the like. Although they, too, emphasize prescriptiveness ("works if followed ... depends on being used as set up"), they either do not give clear answers on the issue of complexity or (as in the case of the curriculum director, a majo'r advocate of the program) say that "any teacher can use it successfully." But teachers, faced with an initially demanding, rigid program, are not so sure, it seems (tactic: making comp~risons).
Moving to the third column of Table 5.9, we can see role-perspective differences. Two teachers mention teaming as an anticipated change, one that curtailed their freedom and made them accountable to peers' schedules and working styips. Administrators, the field notes showed, considered the teaming to be necessary to implement the program's several strands. and as a way of helping weaker teachers do better through learning from stronger ones. Even so, they do not consider it a salient change, saying either that no organizational changes are required ("the

124 • WITHIN-CASE DISPLAYS: EXPLORING, DESCRIBING
Table 5.9 Role-Ordered Matrix: First Reactions to the Innovation
DEPT. CHAIRS
+ FLEMING 4th year
1st year
PRll'CIF'AL I Tm<hle &so
Dirof CENTRAL Curriculum OFHCE
MANN Superintendent
[K Don't know
Good fit: Program replaced old cmrlculum
same teachers wrote curriculum. same
cuniculum revision in district
+ • #
English teacher science teacher math teacher
DK~l question not asked of informant DK·2 asked. but not answered (strayed from question, didn't know answer) DK·3 ambiguous answer
@ Classroom changes question asked of @@ Personal style fit question asked of teachers; teachers: organizational one asked of others. organizational fit question asked of others.

program is designed to fit ~he $tructure") or that they do not know whether organizational changes were anticipated.
Finally, if we continue the making comparisons tactic, the fourth column shows a range of "personal fit" for dif~ ferent teachers, depending on their views of the content, their own styles, and the organizational issues involved. The administr",tors, however, uniformly emphasize good fit at the organizational level, stressing the appropriateness of the curriculum and its fit into the existing structure; the director also invokes the fact that teachers wrote it.
In short, a matrix of this sort lets us see how perspectives differ according to role, as well as within role. In this case users from the English department who came in at the onset of the program had an initially tougher time than later users or than math and science users. Table 5.9 also hints at problems that arise from these differing perspectives (e.g., users' worries about teaming seem to be ignored by administrators-though they regard the teaming as critical to success).
A within-role analysis, moving across rows, shows that the superintendent, as might be expected, knows very little about the innovation. More surprisingly, the principal does not either, In this Case a recheck with the field notes (tactic: follOwing up surprises) told the field-worker that the for~ mal role description for high school principals in this district actually forbids them to make curriculum decisions, which are the province of the curriculum director and department chairs.
We also can apply the tactic of making if~then tests. If the director and the chairs have a shared province of work (curriculum decisions), then their views of the innovation should resemble each other morec1osely than either resem~ b1es teachers' views. Looking vertically once again. we can see that department chairs' views are much more like those of central office administrators than those of teachers.
Variations
This display emphasizes different roles as sources of data and perceptions. It is also possible to develop a role~ ordered matrix that treats roles as targets of others' actions or perceptions. For example, how are teachers treated by department chairs, principals, and central office personnel?
You also may want to have another, closer look at the data after identifying the main trends in the initial analysis. For example, it looks as if the findings are a function of time offtrst implementation (differences between first- and fourth~year users) and of between-role differences (users vs. administrators). So it may be useful to boil down Table 5.9, arraying the infonnation according to these two contrasts (see Table 5.10).
The further condensation in Table 5.10 corresponds to the information in the analytic text, confirming and focus-
D, Role-Ordered Displays • 125
ing it. The contrasts appear more sharply, both between earlier and later users (reflecting debugging and loosening of the innovation over time) and between users and administrators (reflecting their differences of perspective and priority),
The technique used to generate Table 5.10 had the fol~ lowing decision rules: (a) "Standardize" the cell entries to a more generic descriptor and (b) take the modal response. As the table legend shows, these rules were not always so easy to carry out. There are also some nagging problems: small and unequal respondent N's, collapsing of different species of administrator into one family, and missing data. All of these caveats should be acknowledged in text or on the legend for the table.
In retrospect, it's admirable that any useful conclusions could have been wrung out of data as diverse and spotty as those in Table 5.9. If data are thin or of doubtful quality, we have 'no business generating nextRstep matrices that give the misleading appearance of analytic order and ade~ quacy. We see here the risk noted by Dawson (personal communication, 1983): that systematic methods like these can cause ~esearchers to present findings more strongly than they would have otherwise. All the more reason for qualitative researchers to document their procedures,leav~ ing a clear "audit trail" for others to follow (see Chapter 10, section D for more on this).
Advice
If your case is an individual, role-ordered matrices may well be helpful in showing how role partners view or in~ teract with the person at the center of your case. They will be much simpler than this one.
Clarify the list of roles you consider to be most relevant to the issue at hand; avoid overloading the matrix with roles that are clearly peripheral. Differentiate the matrix by subroles (e.g., teachers of math or science) if relevant. If you wish to show the degree of within-role consensus or diversity, show person-level data within role domains.
Keep the questions in columns as parallel as possible for different roles,
Indicate clearly when data are missing, unclear, or not asked for in the first place.
Return to field notes to test emerging conclusions. par~ ticularly if the decision rules for data entry involve, as in this case, a good deal of reduction.
Ask for an audit of your analysis and conclusions from a col1eague. Role~ordered matrices, because of our prior experience o/ith role differences, can lend themselves to too*quick conclusion drawing. For example, in Table 5.9 the analyst originally emphasized teachers' reluctance to team~teach as a main conclusion, thinking of past work on teacher isolation (Lortie, 1975) and the vivid comments of several teachers. But a colleague pointed out that the team-

126 • WITIlIN-CASEDlSPLAYS: EXPLORING, DESCRIBING
Table S.10 Role-Ordered Matrix:
Example of a Next-Step Matrix to Analyze Initial Findings (first reactions to the innovation)
ROLES SALIENT
CHARACTERISTICS SIZUP ANTICIPATED
CHANGES FIT
Early users now Structure, Complex, low Teaming Poor'" in 4th year prescriptiveness latitude (N=3)
Later users now Content focus. Easy to use ----# Good in Islw2nd year variety of modes (N=5)
Administrators Reinforcement, Fidelity of use Few Good (N=5) order. integration is key (aU combined)
,.. Given "don't know" responses, this is inferred from analysis of other responses of 4th-year users \0 this set of questions
# User.unique responses
ing issue appeared only for two early English users and that the "freedom" issue for another English user seemed more related to general pr~scriptiveness of the innovation than to peer constraint. Preliminary analyses. like cognac. need to be disfiIled twice.
Time Required
If, as in this case, there is a fairly clear semistructured interview with questions directly relevant to the columns of the matrix, and if the coded data are available for relevant roles. the matrix. can be constructed and data entered rela~ tively rapidly-2 hours or so for a matrix of this size. Analysis and writing are also fairly rapid-an hour or Jess.
Role~by~Time Matrix
As we saw in the preceding illustration. role~ordered matrices often turn out to involve time as well. When someA thing was do'ne by or to people in a certain role is often an important issue. Box 5.7 shows how assistance to users of an innovation was provided by different roles over time. The analyst' developed a list of types of assistance and
wanted to know when which types were supplied by cer~ tain roles (superintendent or whomever).
We can see immediately that the superintendent is out of the picture as far as assistance giving is concerned, while initial assistance is moderate to heavy early in the game from the principal ("building administration") and from peers. Both offer support (SUP), but the principal also emphasizes advocacy (ADV), while peers provide direct faA eilitation (F AC).
The innovation' s developers provide much training (TfR), solution giving (SOL), resource adding (RES), and support (SUP) during the training, with some light followup, but nothing in the third and fourth years. By then the innovation is running with only light facilitation and sup· port from peers.
Box 5.7 also shows us what is not being done in the way of assistance: no one is "directly controlling (CON) or inquiring/feeding back data (INQ).
The eight assistance types. drawn from prior work on assistance functions (Nash & Culbertson. 1977). are arranged in decreasing order of directiveness; we can conclude that the assistance provided is largely client centered and less directive.

E. Conceptually Ordered Displays • 127
Box 5.7 Role-by-TIme Matrix: Illustration Role Assistance, by Phase
None None None None SUPERINTENDENT
BUILDING ADMINISTRATION
HeavyADV HeavyADV Moderate ADV None Moderate SUP Heavy SUP Moderate SUP
DEVELOPERS Moderate TTR, Light SOL, SUP Light SUP None RES, SOL, SUP
PEER USERS Moderate PAC, Moderate FAC Light FAC Light FAC, SUP SUP Heavy SUP Moderate SUP
TRAINING Spring 1976
CON :::: Controlling TTR = Teaching/training SOL :::: Solution giving RES :::: Resource adding
Using cell entries of such a general, "boiled-down" sort means that (a) a good conceptual scheme should underlie the entries and (b) you must be very clear on decision rules for data entry. The analytic text should refer back to written-up field notes for illustration and clarification.
E. Conceptnally Ordered Displays
Our last family of descriptive displays, rather than relying on time or role as the organizing principle, orders the display by concepts or variables. In a sense, any display is necessarily conceptually ordered, but some are centrally organized this way.
Conceptnally Clustered Matrix
Analysis Problem
Many studies are designed to answer a string of research questions. Sometimes that string becomes a lengthy laundry list. As a result, doing a separate analysis and case report section for each research question is likely to tire out and confuse both analyst and reader. The obvious solution is to cluster several research questions so that meaning can be generated more easily.
FlRSTYEAR SECOND YEAR THIRD-FOURTH 1976-77 1977-78 YEARS
1978-80
ADV :::: Advocacy, representing client interest FAC :::: Facilitating INQ :::: Inquiring, feeding back data SUP :::: Supporting
Brief Description
A conceptually clustered matrix has its rows and columns arranged to bring together items that "belong together." This outcome can happen in two ways: conceptual-the analyst may have some a priori ideas about items that derive from the same theory or relate to the same overarching theme; or emplrical-during early analysis you may find that informants answering different questions are tying them together or are giving similar responses. The basic principle, however, is conceptual coherence.
Dlustration
For example, in our school improvement study, we had a general question about users' and administrators' motives for adopting a new educational practice, and a more specific, question about whether these motives were career centered (e.g., whether informants thought they could get a promotion or a transfer out of the project). So here we had an a priori idea of a possible relationship. Then, during data collection, we saw some inkling of a relationship between the motives questions and two others: a centrality question (whether the innovation loomed larger than other tasks in the daily life of a user) and an attitude question (whether the infonnant liked the new practice when first

128 • WITHIN-CASE DISPLAYS, EXPLORING. DESCRIBING
Table 5.11 Conceptually Clustered Matrix: Motives and Attitudes (format)
'.:
RESEARCH QUESTIONS
Motives Career relevance Centrality Initial attitude INFORMANTS (types) (none/some)
Users
V t
Uz• etc.
Administrators
A,
Az.etc.
introduced to it). We wondered whether a relationship ex~ isted between people's motives and their initial attitudes toward the practice,
The best way to find out would be to cluster the reM sponses to these questions. Not only is there a relationship to probe, but there is also a general theme (initial attitudes) and a possibility of handling three research questions at the same time.
Building the display. We need a format that (a) displays all of the relevant responses of all key informants on one sheet, (b) allows an initial comparison between responses and between informants, (c) lets you see how the data can be analyzed further (e.g., repartitioned or clustered), (d) for multicase studies, lends itself easily to cross~case
analysis and will not have to be redone, and (e) for multicase studies, provides some preliminary standardizationa set of content~analytic themes that all case analysts will be using.
When you are handling several conceptually/empirically related research questions together, a likely start-up format is a simple informant~by-variable matrix, as shown in Table 5.11. Thus we have on one sheet a format that includes aU respondents and all 'responses to the four research questions. Note that we have set up comparisons
(low/modlhigh) (fav.) neutr., unfav.)
between different kinds of informants (users and administrators), so it is role-ordered, as well as conceptually ordered. The format also calls for some preliminary sorting or scaling of the responses: types of motive, career-relevant or not, degree of centrality, valence of i~itial attitudes.
Entering the data. Next we go back to the coded segments keyed to the research questions. The analyst notes down the motives given by or attributed to an informant, and then tries to put a label on the motive. One informant, for example, gave several motives: She heard how good the new practice was (social influence); her principal was "really sold on it" and "wanted it in" (pressure); most other teachers were using it or planned to-"It's what's coming" (conformity); using the new practice was an occasion to "keep growing" (self-improvement). At this stage, it is best to leave the start-up labels as they are, without trying to regroup them into fewer headings that cover all informants; this practice gives you more degrees of freedom while still providing a preliminary shaping of the data.
Turning to career relevance, the analyst summarizes in a phrase or sentence the relevance of adopting the practice for eac.h informant. The next task is to look for evidence on how central the new practice is for people and what their initial attitudes seemed to be. For these two questions, the

analyst makes a ge~eral ra~ng, backing it with specific quotes. When these data are entered in the matrix, we get something like Table 5.12.
For cell entries, the analyst reduced the coded chunks to four kinds of entries: labels (e.g., self~improvement). quo· rations, short summary phrases, and ratings (none/some, lowlhigh, favor/:!.blelunfavorable). The labels and ratings set up comparisons between infonnants, and, if needed, be~ tween cases. The quotations supply some grounded mean· ing for the material; they put some flesh on the rating or label and can be extracted easily for use in the analytic text.
The summary phrases explain or qualify a rating, usually where there are no quotations (as in the "career relevance'-column). In general it's a good idea to add a short quote or explanatory phrase beside a label or scale; otherwise the analyst is tempted to work with general categories that lump together responses that really mean different things (as clearly seen in the "High" responses in the "centrality" column). If lumping does happen and you are puzzled about something, the qualifying words are easily at hand for quick reference.
Drawing conclusions. Reading across the rows gives the analyst a thumbnail profile of each informant and provides an initial test of the relationship between responses to the different questions (tactic: noting relations between variw abies). For example, L. Bayeis does have careeNelevant motiv€!s, sees the practice as very important, and is initial1y favorable. But R. Quint's entries do not follow that pattern or a contrasting one. We have to look at more rows.
Reading down the columns uses the tactic of making comparisons between the motives of different users and administrators, as well as comparisons between these groups. It also enables similar comparisons between responses to the career-relevance, centrality, and initial-attitude questions.
Table 5.12 contains about as many data as a qualitative analyst can handle and a reader can follow. The analyst has ordered informants according to their time of implementa. tion (early users, second generation, recent users) and their roles (users and administrators) and, within the group of users, has included a nonuser to set up an illustrative contrast between motives for adopting and motives for refusing the new practice. As an exercise, see what conclusions you might draw from Table 5.12. Then we'll suggest some that occur to us.
A scan down the columns of Table 5.12 provides both information and leads for follow-up analyses. In the first column, "social influence" motives are prominent. Also, a noticeable amount of pressure is being exerted on users (tactic: counting).
The tactic of making contrasts/comparisons leads to more conclusions. For example, there is some career rele-
E. Conceptually Ordered Displays a 129
vance in adoption for users, but practically none for administrators. Centrality is high-almost overwhelming-for users, but less so for administrators. Users are less favorable initially than administrators. Looking across rows, we can use the tactic of noting relations between variables and see that, for two of three career-motivated users, a relationship exists among the variables: High centrality and favorable attitudes are also present. But the opposite pattern (low career relevance. low centrality, and neutral! unfavorable attitudes) does not apply. In fact, it looks as if some people who are neutra1 would have been favorable were they not so apprehensive about doing welJ (tactic: finding intervening variables). This is agood example of the merits of including a quotation or explanatory phrase in the cell so as not to pool what may be different responses behind the same label ("neutral," in this case).
VariationS
In using conceptually clustered matrices for multicase studies, there is often a tension between the desire to run with the cas~ and the obligation to set up the case report to facilitate later cross~case analyses. For instance, the data for the Masepa case in Table 5.12 seem to cohere in ways that do not follow the four-column structure religiously. Note that, for users, regardless of their date of initial use, the modal pattern is social pressure, high centrality, and neutral, often mixed initial attitudes; people are backing into what most call "the most important thing" or "biggest step" they have undertaken. Clearly, the conceptual core of the table lies here, and the single~case analyst should fasten onto it, looking, perhaps, for an appropriate concep~ tual framework such as "approach~avoidance conflict" (tactic: making conceptuaUtheoretical coherence) or a descriptive gerund such as "ambivalent innovating" to pun the material together (tactic: subsuming particulars into the general).
For a single case, the next step would be to reconfig~ ure the table around this theme, dropping the "career relevance" column, looking more carefully at the mix of motives, and checking the number of informants who correspond to this profile. Table 5.12 is just a way station in the case-specific analysis, where the prime objective is-and should be-to follow the data where they beckon.
But suppose you have several cases. The display must be set up to permit a coherent comparison, looking across all cases: the motives, career relevance, centrality, attitude relationshipsl This may be a rogue case. It's important to hold on to th~ common set of categories, scales, and ratings for each case-even if the empirical fit is poor in one or another of these columns-until the fulJ set of cases can be studied.

130 • WITHIN-CASE DISPLAYS: EXPLORING. DESCRIBING
Table 5.12 Conceptually Clustered Matrix: Motives and Attitudes of Users, Nonusers, and Administrators at Masepa
CAREER INITIAL MOTIVES RELEVANCE CENTRALITY ATTITUDE
TOW ARD PROGRAM Self*impmvement: "To get better,l had to None Ifir,h: ftBiggest ~:ftThere
change"_."Maybe I wasn't teaching the best ways." *improvement thing I've ever wasn't any R. Quinl ~ "They wanted us to do it. .. of practice done thai appeal. They
Sogal influence: "Everybody was saying what Gail's somebody else rold. said it worked EARLY doing is great." me to do." so I was going USERS: 10 trY it." 1971·78 Observation: Saw O. Nonist do it and ·was Vehicle to High: "most ~
impressed," turnkey trainer important thing Eit k! l!;mona1 ~I)!h;: "I like structure." role: also rYe been involved
L. Bayeis Prnelics improvement:: "looking around for II became Tille I with." different way to teach reading .. Coordinator -, "you get tired of always doing the same old thillg." Spcial influence: heard from seve:aJ. friends about None * High;, "This is the -program possibly only Dew thing apprehensive S4m!2!::!!Ulib: ~l1oa jU~li[jeayon' ~I tool: the training stabiliz.ing her I've done since I've
F, MOlelly for recertification credit. Afre:r alllhal. I had to job at the been out of
SECOND follow through," school GChool ... 1 had to GENERA, ~: "He (Weelling) is theteasoR we do it here. invest $0 much," nON: He's so enthusiastic about it." 1978·79 Social opinion influence; "I heard how good it was," None, possibly llidl.: "It's been a Unfavorable,
~ "(Weelling) was zeally $Old 011 it. The, r"" nightm8J"e," once training
L. Brent really want it in." began Conformity' Most doing it or planning to in the school: "it's what's coming." S~IH:m!!:gvemenl! occasion to "keep growing." Obligation' requirement to obtain teaching post: "J Ticket to lfigh: "My fast ~.
V. Shazpert dido'l have s ehoice." teaching job in job" apprehensive Practice.improvement: complementing pte-service the district
. training Speia! jnfluence· "hean! it was good;" ..... s good friend None: fek lW1h.:. "This was ~mixed liked it." obligated by really lillLbig one feelings
A. Olkin ~: "strongly encouxagoo" by Weelling and administration for me." RECENT O<lhloff USER& "QbservatioD modeling: saw O. Norrlst. "She n:ally 1979-80 impressed me."
ObservatiOn! "It was $0 good for my own Ticket to fuU- ffigh: "This was ~,·l
kids ... ~mendous change in reading, spelling, work time teaching really a big step was excited
S, Sarels habits,~ position for me-a big about it."
move .. {notbing else} as high as this in my career."
NON'-Relative disadvantage: "My program was better." None NJA Unfavorable
USER C. Shinder Poor fit wilh PSlonai style: "too scholastic ... too p;""",mmed." ~ "I was looking for a highly structured. None at (lISt: lIim: "Largest ~,then
skill-oriented reading program." fa.", investment rve favorable K. Weelling HQv~l1:£ Rttlmill!< Qf ~tiC3! ilDl!Ilm:~ru: intrigued appreciates the ever made." Principal by reading about IlWltety learning; wanted to see it in visibility
operation. Relative advantage face validity of program: "well Another in a ~!"rtwas ~
~~ST organized;" could be used for other subject matters. series of one thing among a RATORS I. Dahlo£( Soda! influence: "impressed" that outstanding implements- lot of things I was
Curriculum teachers favored the program. tions working on." Coordinator Practice jmprovement: beginning teachcn ill·
prepawl in reading. "We didn't know what to do with them.Shey just had to leam on the job,"
W. Paisly S~l jn[l!!!mce: "talked into ~ .. by I. DahIoff None ~"Itwasno &!!!ll!! Asllt. Sup't big deal ....

Advice
As with preceding displays, conceptually clustered ma~ trices can be used with less complex cases, such as in~ dividuals or sman groups. They are most helpful when you 'have specified, or discovered, some clear conceptual themes.
A void using more than three or four questions when doing a conceptually clustered matrix. Otherwise the mind will boggle. There will be too many data to see inclusiveJy at one time, and too much time spent manipulating blocks of data to find clusters and covariatioris.
Work with an of the data on a single page, even if that page covers a waH or a big table. You can progressively reduce a giant chart to a more economical one by using summarizing phrases, short quotes, category headings, rat~ ings, and so on, as in Table 5.12.
Having a11 of the data in one readily surveyable place helps you move quickly and legitimately to a boiled~down matrix by making sure that all the data fit into a reasonable scheme, and that any ratings or judgments you make are well founded.
Time Required
If you have sorted all of the coded segments-either on cards, cut·up photocopies, or, most simply, via software such as Text ColIector, Kwalitan, or Metamorph (see Ap~ pendix)-all of the "motives" chunks together, all of the "career relevance" chunks together, and so on-a display like Table 5.12 can be built in 4-6 hours. A good deal depends, of course, on the number of informants: More informants will fatten tile piles of coded segments, enlarge the initial matrix, and make for a longer scrutiny until the patterns begin to come clear.
Thematic Conceptual Matrix
Conceptually ordered matrices need not be organized by persons or roles, as in TableS. 12. More general conceptuaJ themes can be the ordering principle, Box 5.8 is a display from a study of urban high school refonn (Louis & Miles, 1990; Miles & Rosenblum, 1987). The researchers were aiming to answer two research questions:
1. What barriers, problems, and dilemmas were encountered during planning/initiation and implementation of the school improvement project? These impediments may be "inherent" in the nature of high schools and the improve~ ment process, or may be conditioned by the local context.
2. What management and coping strategies were employed to deal with the barriers/problems/dilemmas? Which were technical. which were cultural, and which were political in nature?
E. Conceptually Ordered Displays • 131
After visiting problem-sol~ing meetings, interviewing coordinators, and asking people about typical problems and what was done about them, the researchers coded their notes and began entering data into the matrix in Box 5,8, A first step was to employ the tactic of clustering to define the specific problems used in row headings. For example, here are severa1 quotes:
The program is really a nothing. Nobody is excited about it,
Here it comes again. What is MESIIPI? Just a new flag the central office is waving so they can spend the grant money.
Every year we get a new one. MESIIPI is just the latest thing coming down the pike.
I have a lot of doubt whether it will do any good.
The coordinators are meeting every other week, but we don't 'see anything down in the trenches.
Here tile analyst identified two problems underlying these comments: teacher ownership of MESIfPI (a "more effective schools" program) and skepticism from the staff. Similar clustering was carried out with the results of ques~ rions like, 'What's been done about [thiS problem]?" and entered as strategies. The analyst had to make a conceptual sorting: Was the strategy basical1y technical, political, or cultural? The entries are essentially summary phrases, us· ing the decision rule of two confirmations and no contradiction by anyone in the site.
Here is an excerpt from the text the analyst wrote:
First, many of the problems encountered have minimal (or no) coping associated with them. In effect, the problems continue.
Second, it is rare to see any cultural-type coping. The problems are largely treated as deserving technical or political effort. even though cultural norms are doing much to make implementation difficult (e.g., "here it comes again" ... "don't rock the boat" ... "we are not good finishers"). This may in part be the tendency we already have noted to down~ play organizational issues as deserving of direct attention; issues of accountability and responsibility remain ambiguous.
Third, back of many of the problems noted are two main issues: the fact-that MES and IPI were essentially imposed on th~ school, and that very little assistance was provided. Administrators said things like "we have been directed to do it . , . every year we get a new one ... it doesn't matter whether we are pro or con. What we're here for is making it work." Delay in one sense is the simplest coping tactic available to Ileople who don't like something they have been handed t6 implement.
Here the analyst is blending inferences drawn directly from the displayed data (tactics: seeing patterns, themes; and factoring-that is, seeing a few general variab1es un-

w ..,
PROBLEMS
Confttt1ugl prnblem.t 1. Teacber ownmhip of
MBS/IPI 2. S~~tlclsm from staff 3. Lack of coordination
4. Thin IIcbool~level planning
5. Uneven implementation
frobknu fAerIe to high tJ:lw2IL.
1. Resistanoc to scanning
2. Poor fit of scanning to HS
Problenu rh!mming from program d«rign
1. Planning inadequacy
2. Insufficient prep. at HS
3. Slow implementation of MES
4. Work time required
Box 5.8 Thematic Conceptual Matrix: Problems and Coping Strategies
(Example From Chester High School) (Miles & Rosenblum, 1987)
COPING STRATEGIES Technical Politi .. v •••• " .... Cult ......u~ ..... a
Orientation mtg. for aU [acuity. DK Putting goals on the banner. [not effective)
Frequent mtgs. (prlnc.. VPs. supv's). Spec. ed. &; vae. ed, negotiation about P~~c. develops shorthand list of MBS space for MBS efforts. ob ectives for reference use. Power not much shared with admin. team. State Dept. alEd. MBS director drafts HS plans for 3 objectives; prine. cheeks w. VPs and sul'v·s. Discussion in admin. mtgs. Pressure from VP for curriculum; supv's Idea of using currie. funds for summer work required to use format she advocated. to locale gaps in implementation (lesson plans).
Idea that supv's shouJd get together, do adaptation. agree on common start date. (not done]. Exhorting, pressuring by Drindpol
Idea of making a new videotape. AUowing delay in implementation of Idea that supv's should adapt. select from scanning scanning procedures. {neither done] Supervisor holds info/training sessions with pairs of depts.
Funding delay partially buffered by business Supt pushed SDB asst. comm. on funding office ("they are understanding.~) delay. got action.
Pressure from district cootdinator to produce 86~81 plans (threat of SDB withdrawing funds). Prine. negotiated with C.o. to get ~program days· devoted to lPL When e.o. reneged, prine. gave up fae. mtg. days for depts for lPlwork.
.~
I

E. Conceptually Ordered Displays • 133
Box 5.9 Portion of Jack's Folk Taxonomy of Cars and Trucks(Bernard, 1994)
~ __ ---------""j"'-- Pick-up Trucks
Regular Slalion v." 11\ ~ ________ -" ____ -:~::==:=======~C'f"~ Wo~~ .~ 1--- ~ LI,I~l,Iry Spo7!Y Regular 4-Wheel Jeep·type Convenlional
~ Custom Work
~ Cor.; Sedons DrIVe Wagons Wagons
Lincoln Joguar Mercedes Codi/lcc PerfQ'~porls TW~ICh 8ro~ozers /\ 1\ Vans Vons
/\/\ Cors Cars door door bocks _ = 7\ ~
Corvene Comao Trans Fire' RaHy Reol Sport II II II Am bird Cars Cars
F'"~G MO~Pha Romeo
derlying many specifics), with illustrative comments drawn from elsewhere in the case.
Folk Taxonomy
We'd like to avoid the tacit implication that concepts are always properly sorted into rows and columns. Concepts also can be displayed in network form. Let's start with a hierarchical network display. Box 5.9, drawn from Bernard (1994), shows how one informant, Jack, classified cars and trucks when he was asked "frame elicitation" questions like "What kinds of cars are there?" As Jack continued, the researcher asked more such questions, like "What cars do you call lUxury cars?" "Is an MG a real sports car?" "Is a performance car a type of sporty car?" to refine the categories and to understand links between them in the person's mind.
The display, a hierarchical tree diagram, lets us see how the person classifies important phenomena. Jack clearly has a relatively differentiated set of ideas, and has seven levels in his scheme (though he does not give us many specific exemplars for the cars and trucks on the right side), We might infer that he falls into the "car nut" category.
Bernard makes several useful points: The display is typically idiosyncratic (e.g., Jack's term "regular cars"); not all categories necessarily have labels, or exemplars; the categories often may be overlapping and indeterminate (Jack says in the interview that Jeeps are both station wag~ ons and 4~wheel drive vehicles).
Bernard notes that folk taxonomies also can be created by starting with a batch of cards, which the person sorts into piles before "frame elicitation" questions begin,
Bernard also suggests "componential analysis," as used in linguistic and kinship studies, as a way to clarify categories, making it clear why a particular label is assigned to a particular object. You ask for distinctive features of the sorts of objects being "taxonomized" and aim to find the smallest group of features that discriminates them clearly, thus producing a matrix like that shown in Table 5.13.
Bernard comments on the risk of analytic shallowness with the method and says the issue is focusing on the person's real meanings, how they actually think about the phenomena involved. See also Spradley (1979) for more suggestions.
Table 5.13 Componential Analysis: Example for Seven Cars
According to Jack (Bernard, 1994)
Z 3 Expensive Practical Foreign
Corvette + Firebird MG ; + Masemti + + Mercedes + + + Jeep + Dodge Van + +

134 • WITHIN-CASE DISPLAYS: EXPLORING, DESCRIBING
Note: Researchers may use the method to sort out their own theoretical ideas-being careful, of course, to caB it a "real," rather than a folk, taxonomy.
Several computer programs are especially good at gen~ erating taxonomies of either sort; NUDIST, A TI.ASlti, SemNet, MetaDesign; see Appendix.
Cognitive Maps
Analysis Problem
Many of our examples so far have been complex, mul~ tilevel cases. But cases are often focused at the individual level. We need: good displays that show us the complexity of the person. People's minds-and our theories about them-are not always organized hierarchically. as in folk taxonomies. They can be represented fruitfully in nonhier~ archicaI network form: a collection of nodes attached by links. Remember the conceptual network "Joe's a gnerd," in Figure 4.7. In studies of thinking. the nodes can be represented as concepts (e.g., Jack's idea of "luxury car"), and the links as relationships (a Mercedes is "a kind of' luxury car).
is a kind of Mercedes lUxury car
But there can be many sorts of networks. Should we use the person's own concepts, or a standardized set? Will we restrict the network to single words at the nodes, or use complex phrases?Will concepts be at several levels, or just one? Will the links be given explicit names, rather than being left tacit, as in the Jack example? If named, will the links be standard and uniform throughout, or diverse for each link? And will the links be directional (either one- or two-way). or not?
Even with these technical choices made, some other problems remain. People's concepts are not that easy to evoke or to display systematically for drawing conclusions. We need a concrete method to evoke the complexity of the individual's thinking.
Brief Description
A cognitive map displays the person's representation of concepts about a particular domain, showing the relationships among them. Descriptive text is associated with it.
Dlustration
In a study of school restructuring efforts (Khattri & Miles, 1993), the researchers wanted to understand how
individual teachers and administrators viewed such matters as what a "school" is, what a "restructured school" would look like, and how such a school could be designed, implemented, and stabilized. .
Adapting methods used by Champagne, Klopfer, Desena. and Squires (1981) and Novak and Gowan (1984), the researchers began data collection with a "premapping" interview, asking a person such questions as, "What is restructuring? What cannot be called restructur~ ing? What are examples of 'structures'? What is the right way to go about it? What is the wrong way to go about it? What decisions about restructuring have been made in the school?"
Transcripts of these interviews were culled for key conA
cepts, phrased in the person's own words. such as accountability, staff development, small group does new things, get conservative staff support and institutionalizing. These concepts were divided into two lists, one for the content or substance of restructuring and one for the process-how it proceeds-and written on Post-Its.
Building the display and entering the data. At the mapping interview, the person is given the first bundle of PostIts (typicaIly under three dozen, alphabetized) and is asked to arrange them on a large sheet of cardboard "in a way that shows how you think about the words. t. When this task is complete, the researcper asks, ''Why are they arranged this way?" The researcher draws lines around concepts that the person says belong together. and evokes a name for the group, which also is written on the display. The question "What relationship is there between •.. and ... T leads to the person's naming of links between concepts andlor con~ cept groups, and those, too. are written on th~ display. The process is repeated for the second bundle.
Drawing conclusions. During preliminary analysis, the researcher listens to the tape of the mapping discussion, clarifies any errors, and writes a descriptive text that walks through the complete map. The map and text are fed back to the respondent to be sure it is an accurate repreA
sentation. Note that the procedure engages the respondent and the
researcher in joint work, simultaneously building the display and entering data.
Figure 5.6 shows the results of this process when Peter. a teacher in a small alternative high school, arranged his concepts of how restructuring proceeds. (It was redrawn for this book from the original production done with Peter, using MacDraw software.) Figure 5.7 shows the descriptive text the analyst wrote.
The text in Figure 5.7 is descriptive. staying close to what Peter said about his ideas. The analyst wanted to take some next analytic steps and began looking for core or underlying themes, writing these comments:

~
""~ j ..... d.
if ;1
G n (5)GMlNS·
"""""" formovingon.
"""""'-
""
Figure 5.6
Cognitive Map: Peter's View of How Restructuring Proceeds (Khattri & Miles, 1993)
(1) ONB'I'BAM - ~v ANGUARD", ON BOOB. PWLOSOPHYIS TRYING NHW'THlNGS. BXPERlMEN1lNG
giving structand momforchangc:s
prof=onslism.
"""~ ""'" have powerto sttuctnre their expertisc
''''' ..... """"
does new thinp
not .,,,,, -..... whole-school
"""" . ndical break
aeativily
exampl~ model enthusiasm
te.eberdccides what', best far
group of students
!On1eoltO (vanguard pushing or principal)
~ .. ti<"''''''"'''''' (4)CinstitutionalizinU
I °kOWCHANOBHAPPBNS • moves - something
into the 5Choot day
'---...... ~
out~goab:
'" solutions
~'~ friendly positive I!lg1ImenlS ~ finding agreement
rclatkmships .--/ lead to-
..",.,.
involve as ntlIn)'pcople aspossiblo
not being -(6)
pro=d clearing .... ~
1~ -,,""" ~oog
(2)CONSERVA1IVBPHILOSOPHY
g~
eomcrvative staff support
timoline
(7) 1lilliGS WEWANTTOSTAY AWAY FROM
(would mako other stuff not work, inImuptit)
[Includes REFLEC'I'IVBNESJ ~~ 1op-<lE'\ I wimout wai~m power deQSIOlU
"1

, , !~
I.
"
136 • WITHIN-CASE DISPLAYS: EXPLORING. DESCRIBING
Figure 5.7 Descriptive Account for Peter's Map of How Restructuring Proceeds
(Khattri & Miles, 1993)
How restructuring proceeds: Peter. map 1
In one major cluster, Peter describes process features that characterize a "vanguard" team that's on the edge (1) with a philosophy of experimenting and trying new things: giving structural room for changes, professionalism, creativity. Teacher teams have power to structure their days, and the image is of a small group doing new things, making a radical break. The aim is not to change the whole school, but to use expertise, develop an example or model (of the new) and generate enthusiasm.
At the bottom of the map is a differently-oriented cluster, labeled conservative philosoJ2hY. (2), aiming to "preserve things so they don't fall apart"; it includes the concepts of do it slowly, bring others along, get conservative staff support, and people adapting what they like.
In the middle is a cluster called how change happens (3)-"the way when it's working. it works": it describes. in effect, what the school wide processes are for change. It includes the ideas that teachers decide what's best for a group of students and that there are agreed~ on outcomes/goals. Solutions appear, and in the context of friendly relationships, there are positive arguments, which are the "heart" of the change process (positive arguments require friendly relationships). The arguments are also influenced by someone pushing (either the principal or a vanguard team). and they lead to finding agreement, though perspective differ~ ences exist. The idea is to involve as many people as possible, and not be fractured.
The experimenting. vanguard team also "subinstitutionalizes" changes; the institutiona1~ izing work (4) is a sort of "end product" that moves the change into the regular school day.
At the left of the map, Petet identifies certain givens (5) necessary for "moving on, working together." These include being explicit about problems. and the presence of teacher vulnerability, which helps people look clearly at success and failure. The concept of reflec~ tiveness about changes on the "What can be restructured" map is included her~,~as :~~~;.;(
At the right, the Policy Council (6) looks at the overall process. serves as a cl~~rig" .. .:<,~. house, and sets a time line.
FinalIy Peter identifies things we want to stay away from (7) that would make the other': processes not work, or interrupt them. These include decisions without PQwer to implement, and top-down curriculum decisions.
The HOW map is essentially organized around a sort of dialectic of the change process. The sense is that an,active, pro~ gressive team takes initiative, constrained somewhat by qther conservative team(s), with the result that a sort of de facto school~wide consensus re change processes exists. Peter also notes, in effect, 'the need for certain norms as pre-conditions for effective change (problem orientation, openness/vulner~ ability, .reflectiveness, etc.).
Aconceptual theme underlying both maps [the WHAT map and this HOW map] is peer-controlled power; the idea that teams of teachers are responsible only to each other for the control they exert over the shared learning environment. A second underlying theme is experimentation. which Peter sees as central not only to the work of his team! but to teach~ ing. "The philosophy is that experimentation doesn't always bring a good thing, but the act of experimenting is good for everybody."

The WHATapd HOW maps also seem to share the concepts of reflectiveness and initiative (by the progressive team).
Here the analyst is using the tactics of factoring and noti,ng patterns, themes. (The comments above were de~ rived from a matrix that displayed possible core themes for the analyst.)
Variations
This version of cognitive mapping makes for maximum idiosyncrasy-and complexity-in the results. A simpler version (Morine~Dershimer, 1991) asks the respondent to generate a list of concepts related to a major topic (e.g., restructuring). The major topic is placed in the center, and then other concepts are placed around it, with unnamed links radiating out to them. and from them to other con~ cepts in turn.
Leinhardt (1987) describes a method in which the respondent works with a batch of prewritten cards (standard across all respondents). sorting them into piles. naming the piles, and commenting on the relationships.
You can use cognitive mapping techniques, such as folk taxonomies, to clarify your own ideas about the meaning of a particular set of data. Such a map is really an evolved conceptual framework. Computer programs with hypertext features that permit linking any bit of data with another and that form higher-level categories are particularly helpful here; we think of HyperRESEARCH, ATLAS/ti, and Metamorph (see Appendix).
Cognitive maps also can be drawn from a particular piece of text, such as an interview transcription, a folk tale, or a curriculum (McKeown & Beck, 1990). Here the analyst is interrogating the text, rather than the person. Relevant software includes MECA and SemNet.
Advice
Think carefully about the idiosyncrasy versus compar~ ability issue: How important is it that your displays can be used across several persons or situations?
Use supplementary displays such as matrices to further condense and examine the cognitive maps--especiaJly if you contemplate cross-case analysis.
Cognitive maps have a way of too king more organized, socially desirable, and systematic than they probably are in the person's mind. Allow for those biases when making analyses and interpretations.
Make a software decision early. The learning curves and user friendliness of the ones we have cited show considerable variation; leave enough time for fluency to develop on your part. The time will be repaid many times over.
E. Conceptually Ordered Displays • 137
Time Required
The mapping procedure Khattri and Miles (1993) used is labor~jntensiv~. even after transcription of the two inter~ views. Extracting concepts from the premapping interview takes 2 hours or so. Correcting the "raw" map and writing the descriptive text typically takes 3 or 4 hours. The analytic work following may occupy another 3 or 4 hours (if supplementary matrices are used; if not, 2 or 3 hours).
Effects Matrix
Analysis Problem
In many studies the researcher is interested in outcomes-a topic with strong conceptual overtones. An evaluator may want to know what changes a particular program or treatment brought about in its target popula~ tion. A more descriptive researcher may simply want to know where things stood at the end of some process (e.g., how well stabilized a newly created school is after 2 years). A researcher aiming at explanations (the topic we discuss further in the next chapter) will usually want to have a good look at some main dependent variables of interest (e.g., reading scores, dropout rates, school social climate) before turning to predictor variables.
These are examples of "ultimate" outcomes. That label may sound pretentious, but it only means that the variable is the last one being looked at in a temporal or causal chain. A researcher will be interested, too, in preceding outcomes, which usually are labeled "intervening" or "intermediate."
The problem for the qualitative researcher is how to select and display data that will faithfully represent the changed state of persons, relationships. groups. or organizations, seen as one or more outcomes of interest. Words are much harder to manage in this respect than numberswhere the primitive decision rules often turn out to be something like "Subtract 'pre' from 'post' scores and pro~ ceed to the statistic of your choice." For qualitative data, clarifyingjust which outcomes have occurred is not always an easy process. Conceptual clarity is at a premium.
Brief Description
An effects matrix displays data on one or more outcomes, in as differentiated a form as the study requires. The label "effect" is used to remind the reader that outcomes are always putcomes of something: a global program, an independetlt variable, an intervening variable. There is always at least an implicit predecessor. The basic principle in an effects matrix is focus on dependent variables.

13B • WITHIN-CASE DISPLAYS: EXPLORING, DESCRIBING
Table 5.14 Effects Matrix:
Organizational Changes After Implementation of the ECRI Program
Early Use 1st and 2nd yrs
Later Use 3rd yr,
EFFECT TYPE PRIMARY CHANGES Spn-l~OFFS PRIMAR Y CHANGES SPIN-OFFS
Scheduling: EeRI all Cutting back on Integrated Less individual morning. math. optional scheduling. latitude: rescheduling music, activities cross-age classroom
Structural phys. ed. Two separate grouping in problems Helping teacher regimens in school grades 2-6 become
named: has dual Ambiguity of status organizational status (teach/admin) and role problems
No letter grades. no Parents uneasy BeR! evaluation Teachers more norms 2 regimens in class sheets. visible,
Teachers insecure tightening inspectable Loosens age-grading supervision
Procedural system
Ins ti tUlional izing Inwhouse assistance More uniformity in Problems, assistance via mechanism work in all solutions more helping teacher implanted classes common, public
Users are minority. Cliques. friction Tighter academic Reduction in "fun band together between users, nonw press activ ities, ..
Relationsl . users Climate
Illustration
When an organization, such as a school, implements an innovation, the possibility exists that the organization may change in some way as a consequence. Although some innovations can be "dropped into" an existing structure. serving as a replaceable' part, most innovations turn out to make demands on th~ system and to have ripple effects. The organizational response often shows up in the form of something new-new attitudes, new rules, new procedures. new structures. In the school improvement study, we wanted to study the changes in local schools that were traceable to their having implemented an innovation.
Building the display. Firstwe need to getclearwhatmakes up the bundle called an "outcome" (in this case, organizational change). What parts or aspects does it have?
Table 5.14 shows how this worked out. The analyst dew cided that the outcome "organizational change" has three basic parts: structural changes, procedural or operating changes, and more general relational or social climate
projects (e.g., Xmas)
Perception. by More lateral help teachers of More 'public' collective venture distress
changes. The conceptual sequence is from "hard" to "soft" aspects of change. .
Second, the analyst, reflecting On the particular case at hand, believes that such aspects of organizational change should be displayed separately for the "early use" period (first and second years) and for "later use," when 9 of the school's 11 teachers were users of the innovation.
Third, the analyst wants to distinguish between "primary changes"-those directly following from the rew
quirements of the innovation's implementation-and those termed "spinwoffs"-secondary effects. some of which may not have been fully anticipated. Because the usual convention (at least in a culture where the printed word is read from left to right) is that later events should be displayed to the right of earlier events, the analyst puts the time dimension in columns and the outcome types in rows.
This matrix crosses not two, but three lists: effects, time of use, and primary versus spin-off outcomes. Note that the primary change/spin-off division could just as easily have appeared as a subdivision of the three change types. That would permit easier comparison of, say, structural spin-offs at Times I and 2. As we've seen, any given set

r
of data usually can be configured in a dozen or more ways. Each way has its advantages and limitations. .
Entering the data. The cell entries in Table 5,14 are brief phrases describing specific organizational changes found in the coded write-ups of field notes. The original question to teachers, th,eir principal, and several central office personnel was, "Did any changes occur.in the organization of the school or the district during this period?" Fonow-up probes asked about specific structural or "set-up" changes, procedural changes, and climate or feeling shifts.
The decision rule was that any change reported and veri~ fled by a document or at least one other,respondent would be reduced to a summary phrase for entry into the matrix.
Drawing conclusions. Again we encourage you to take a first cut at writing some analysis of Table 5.14 before readw ing ours. (For context, the ECRI innovation is a relatively demanding, rather structured,language arts program being implemented in an elementary school. It takes a behaviorw ist approach to word recognition, phonetics, composition, and vocabulary.)
A look at the left side of the table shows us that the major structural change was rescheduling previously separate language arts activities into one integrated morning period; this change required rescheduling of the subjects taught by circulating teachers (music. physical education). This change, in turn, (see "Spinwoffs" column) created two separate daily regimens, because the scheduling was done for two ECRI users in the first year and five in the second year. Other teachers were on the old schedule.
Other early changes included use of mastery levels, rather than letter grades, and the creation of a new helping teacher role to assist new users of ECRI. We can see by moving vertically down the columns that (as has been found in much social psychological research) structural changes tend to lead to procedural changes and, in turn. to climate/attitudinal changes (tactic: making conceptual! theoretical coherence). In this case the pressure. insecuw rity, and speciaJ attention led to a "we unhappy few" climate change, where users banded together. Moving across the climate row, we can see the spinwoff effect: cliques and friction.
Moving to the right half of the matrix, we can note that, in the third year, because 9 of 11 teachers were now inw volved, scheduling became more integrated, and close supervision and uniformity were more typical. And it is clear that the fuller-scale, more regulated implementation now is seen by teachers as a coUective venture. Looking across from primary changes to spin-offs, we'see that teachers are· both more likely and more able to express need for help and to give and receive it (tactic: building a logical chain of evidence).
E. Conceptually Ordered Displays • 139
This display lets us see how structural changes induce procedural and attitude changes. We can see how firstw level changes lead to later consequences ("spin-offs"), and we can see how organizational changes flowed and develw oped over the 3-year period. Naturally these conclusions aU need to be confirmed, tested, verified-for example, by looking for negative evidence or checking out rival explanations. But we have a good running start on what the effects added up to. If we simply had bundled all of the reported organizational changes into one contentwanalytic summary, all of this information would have been lost.
Dlustration
Let's turn to another example. presented briefly. Supw pose you were interested in sorting out, rather inductively, all of the "ultimate" outcomes reported as the result of some substantial intervention-in our study, the implew mentation of an innovation.
Building the display. Outcomes can be sorted according to their directness. Some outcomes are "direct" effects, like the "primary changes" just noted. Others are more general; they might be termed "metaweffects," outcomes that go considerably beyond the immediate direct effects the innow vation is supposed to have. Finally, we can think of "side effects," outcomes quite far away from the original intenw tion.
Each type of effect, we realize, can be either positive or negative. An innovation's proponents usually want others to accentuate the positive. But unwelcome outcomes are typical in any area of human endeavor (Sieber, 1981), and they should be included here.
Now, where can we look for outcomes? They can be reported by different roles (teachers or administrators), and they can be attached to different roles (outcomes for students, outcomes for teachers, etc.).
We should look also at actual outcomes in relation to the intended program outcomes-those the innovation's developer believes it will ordinarily accomplish.
Table 5.15 shows how the display worked out. We actually have four crossed lists here: directness of effects, positiveness and negativeness of effects. program objecw tives, and effects on different populations.
The innovation involved is a high school environment studies program. The people interviewed included three us·ers of-the innovation·and two administrators.
, Entering the data; The researcher has entered summarizing phrases. including all outcomes mentioned. Those that receive strong emphasis by the respondent, or that are confirmed by another respondent, get underlined. Entries that represent an inference made by the researcher. rather than

140 • WlTHIN-CASEDISPLAYS: EXPLORING, DESCRIBING
ThbleS,IS Effects Matrix: Direct, Meta, and Side Effects of Program
(Environmental Studies, Lido High School)
DIRECT EFFECTS META EFFECTS SIDE EFFECTS + - + - +
Effects on Plan & conduct Pupils env'l tasks
Awareness of env'l problems
PROGRAM Effects on Hands~on tasks Interdisciplinary OllJECl1VES Sloft Work wilh skills
community , After-class work
Effects on Investment in Community env'l ed.
activities
Effects on Env'I awareness As adutts, will Improved values Pupils Hands-on work make good env'l KS!t dr0Bouts in
decisions in + self images community
SEENBY Effects on Hands-on Comnletes env'l Off-c!!!!ll!:us Acquired more Crystallized USERS Sloft approach l!XQgnJD 11m l!I2gIiYl] is off-campus sites bard work &
Looser sty Ie Outside ~ "Expert" in low pay
WQrkSDQ1Hii ground community. because of its Kept user in ed. demands*
Effects on Env'} awareness Community Knowledge of
school programs
Effects on Hands-on work Success Pupils off.campus experiences
Effects on Utilizes their SIOft creativity
SEENBY Effects on No more ~ Orientation to ADMIN'RS Org'n discipline effective tQ community
problems transport Rounds out 14 kids to = W
Effects on Community
claim made strongly. by one person, or by more than one respondent
* inference made by researcher
a direct paraphrase of respondent comments, are marked with an asterisk.
Drawing conclusions. Using the tactic of counting, we can see immediately in Table 5. i5 that positive effects at all three levels outnumber negative ones. And we can see
also, by comparing/contrasting intended objectives with actually noted outcomes, that there is a good deal of congruence.
But some negative meta- and side effects are closely intertwined with sought-for outcomes. For example, a side effect of the program is that it keeps dropouts in, but its

off~campus, practical aspect also means that the program becomes a "dumping ground" (tactic: making meta .. phors) for low~achieving students with discipline prob~ lems. These are the kinds of real-life contradictions that qualitative data analysis is good at surfacing and keeping visible throughout analysis and interpretation.
Variations
Effects matrices also can be organized by specific persons; you can show, for example, the changes in concepts, attitudes, and behavior experienced by several teachers as a result of their use of an innovation, Under these circumstances the cell entries will typically be much finer and "thicker," including items such as these:
I'm more sensitive to kids, more aware of them individually and how I affect them.
I learned not to fight too hard when other teachers weren't doing it right.
You should be looking at what's good, not worry so much about where the kids are failing,
No real change in the classroom, no.
Effects data can be retrieved from observation or available documents, as well as from interviews. And the typical "program"-a treatment aimed at achieving outcomeshas some type of evaluation component attached to it, with some already-collected data, which can be invoked as welL
Advice
Effects matrices are used most easily in complex cases and payoff well when multiple cases are included.
Unbundle outcomes carefully and then work to "substruct" them (see Chapter 7, section C) into a differentiated matrix. Consider two or three alternative formats before firming up. Revise if needed after a few data have been entered.
Be explicit and crisp about the decision rules for data entry. Outcomes usually carry more intellectual and prac~ tical weight than other types of variables: Much rests on the clarity and validity of outcome assessments. If your effects matrix does not include negative (undesired) outcomes, be prepared to give a good justification for the reader.
Time Required
Much depends on the degree of differentiation in the matrix, the size of the database, and the practical accessi-
E. Conceptually Ordered Displays _ 141
bility of coded data. A matrix such as the one in our first i1lustration (data from 15 informants answering a specific interview question) can usuaUy be assembled in a few hours, with rapid analysis following. The second i1lustra~ tion, which involved scanning coded interviews from four people, took slightly less time.
Summary Comment
Analysis of quaHtative data rests very centrally on displays that compress and order data to permit drawing co· herent conclusions. while guarding against the overload and potential for bias that appears when we try to analyze extended, unreduced text. Two major families of displays are matrices (rows by columns) and networks (nodes connected by links).
We've described several types of partially ordered displays, which are useful in exploratory work. Time-ordered displays are essential in understanding the flow and sequence of events and processes. Role-ordered displays sort out people according to their position-related experiences. Conceptu~ly ordered displays emphasize well·defined variables and their interaction.
Building displays is an interesting, creative task involv~ ing the management of trade~offs; entering condensed data from coded field notes needs to be done according to clear decision rules. Conclusions can be drawn and verified by using a wide range of tactics explored in more detail in Chapter 10. Conclusions embodied in successive versions of written text interact closely with the display (which may change during the process).
This concludes our discussion of exploratory, descriptive, singte~case displays. We've repeatedly foreshadowed issues of explaining phenomena, how the analyst comes to be able to answer "why" questions. We now turn to this topic.
Notes
1. Narrative text. as a context-preserving, syntagmatic presentation, is a powerful way to help a reader reexperience events meaningfully linked over time-as in a story, novel, play, or biography (cf. 10sselson & Lieblich, 1993). But such texis are already analyzed-reduced, ordered. focused. It is extended. unfocused material that is hard to draw conclusions from. Analysts aiming for a phenomenological understanding of a text (cf. Melnick & Beaudry, 1990; Polkinghome, 1988) may well need to rend and reread an extended text to experience its deeper messages and meanings, But they, too, move toward focused displays,
"such as the "srnopses" described in Chapter 4, section I. See also Smith and Robbins "(1982) for "useful suggestions on-presenting results to busy aUdiences, inclUding matrices. vignenes, summaries, and findings·orie"nted hendings"

142 • WITHIN-CASE DISPLAYS: EXPLORING, DESCRIBING
2. This way of Jooldng at display-Iext interaction was outlined originally by Eleanor Farmr and Mary Ann Millsap.
3. These families of descriptive dispby are similar 10 the levels of questions that Wmner (1992) says can be answered through graphic displays: (a) "data extraction" (what's the state of affairs?), (b) trends over time, and (c) "understanding the deep structure," seeing both trends and groupings.
4. Contexts come in still other types, of course. For useful ideas on mapping the physical context and the kinship context, see Crane and Angrosino (1974) and Schusky (1983),
S. For penetrating discussion afthe differences (and similarities) between survey and fieldwork interviewing, see Mishler (1986) and Schuman (1982).
6. Statistical techniques foreslim.ating trends Il!ld significance levels of event histories are described by Turna (1982) arid·AlIison (1984). The clearest disclJssions of how to analyze "sequences" we have seen are by Abbott (1990, 1992). For asimple way to display and analyze how severnl variables co-occur during a time period. see Prick (1990).