with a little help from my (random) friends
TRANSCRIPT

With a Little Help from My (Random) Friends:
Success and Failure in Post-Business School Entrepreneurship*,**
Josh Lerner
Harvard University and NBER
Ulrike Malmendier
UC Berkeley and NBER
October 24, 2012
* Harvard Business School’s Division of Research and the National Science Foundation provided financial support.
**We would like to thank a number of Harvard Business School officials and faculty who made this project possible,
including Lynda Applegate, Angela Crispi, Lee Gross, Jim Heskett, Elizabeth Karpati, Jana Kierstaad, Joe Lassiter,
Bill Sahlman, Coral Sullivan, and especially Mike Roberts, Toni Wegner, and Sarah Woolverton. Chris Allen, Dan-
iel Littlejohn-Carrillo, Lori Santikian, Rui Tang, Astha Tharpa, and especially Zoe Cullen, Geraldine Kim, and Rui
Xu provided excellent research assistance. Helpful comments were provided by seminar participants at the Ameri-
can Finance Association meetings, Boston College, Harvard, MIT, the National Bureau of Economic Research, New
York University, the University of Southern California, and Yale. Lerner’s address is Rock 214, Harvard Business
School, Boston, MA USA; his phone number is +1-617-495-6065; Malmendier’s address is 501 Evans Hall, De-
partment of Economics, UC Berkeley, Berkeley, CA 94708 USA. All errors are our own.

How do individuals decide to become entrepreneurs and learn to make optimal entrepreneurial
decisions? The concentration of entrepreneurs in regions such as Silicon Valley has stimulated
research and policy interest into the influence of peers, but the causal effect is hard to identify
empirically. We exploit the exogenous assignment of students into business-school sections to
identify the causal effect of entrepreneurial peers. We show that, in contrast to prior findings, a
higher share of entrepreneurial peers decreases, rather than increases, entrepreneurship. The de-
crease is driven by a reduction in unsuccessful entrepreneurial ventures; the effect on successful
ventures is significantly more positive.

1
Introduction
The promotion of entrepreneurship has been a major focus of policymakers in recent
years (see Kanniainen and Keuschnigg [2004]). Thousands of national and local initia-
tives have been launched to foster entrepreneurship in the belief that entrepreneurial ac-
tivity is associated with the creation of wealth, technological innovation, and increased
social welfare. Consistent with this assertion, cross-national studies (e.g., Djankov et al.
[2002]) suggest that nations with greater barriers to entry of new firms also have poorer-
functioning and more corrupt economies. Reflecting this interest, the returns to entrepre-
neurial ventures have become a topic of increasing scrutiny in financial economics, in-
cluding research on the expected returns of investors in initial public offerings (Ritter
[1991]; Brav and Gompers [1997]), venture capital and private equity funds (Kaplan and
Schoar [2005]; Phalippou and Gottschalg [2009]; Korteweg and Sorensen [2010]), and
angel investors (Kerr, et al [forthcoming]).
What are, then, the determinants of entrepreneurial returns? The concentration of
entrepreneurs in regions such as Silicon Valley has triggered speculation that the interac-
tion of high-skilled individuals with similar interests lead to powerful peer effects among
entrepreneurs. For instance, individuals who work at recently formed, venture-backed
firms are particularly likely to become entrepreneurs (Gompers, et al. [2005]), as are
those who work at companies where colleagues become entrepreneurs (Nanda and
Sorensen [2010]) and in regions where many others opt for entrepreneurship (Giannetti
and Simonov [2009]). These studies suggest that peer effects are important determinants
of entrepreneurial activity, consistent with findings on peer effects in other arenas of fi-
nance such as the interaction among stock analysts and mutual fund managers (Cohen, et

2
al. [2008, 2010]). However, the inability of these studies to fully control for unobserved
heterogeneity or sorting of individuals into firms and locations means that our interpreta-
tion of the results must be cautious.
A second issue with prior findings on the determinants of entrepreneurship, and
on peer effects in particular, is its failure to distinguish between successful and unsuc-
cessful entrepreneurial ventures. Calculations using both individual and aggregate data
suggest that returns to entrepreneurship may be quite poor (Hamilton [2000]; Moskowitz
and Vissing-Jorgensen [2002]; Hall and Woodward [2010]). An emerging literature on
―behavioral entrepreneurship‖ finds that individuals tend to pursue new ventures even if
the expected returns are predictably meager (Camerer and Lovallo [1990]; de Meza and
Southey [1996]; Arabsheibani, et al. [2000]; Landier and Thesmar [2009]). Such self-
selection of overconfident individuals into entrepreneurship may benefit society (Bernar-
do and Welch [2001]), but the high failure rates of entrepreneurial ventures (see, for in-
stance, Davis, et al. [1998]) raise caution.2 Despite this concern, much of the previous
research, including the work on peer effects in entrepreneurship, has focused on what in-
duces entrepreneurship rather than asking what increases the rate of successful but de-
creases the rate of unsuccessful ventures.
In this paper, we distinguish between successful and unsuccessful ventures and
make methodological progress in identifying peer effects in entrepreneurship. We exploit
the exogenous assignment of Masters of Business Administration (MBA) students at
Harvard Business School (HBS) into sections. At HBS, school administrators exogenous-
ly assign students into sections that spend the entirety of their first year in the program
2 Landier and Thesmar [2009] find that firms run by optimists—a characteristic that has been shown by
Evans and Leighton [1989] to be associated with the decision to become an entrepreneur—grow less, die
sooner, and are less profitable, despite the fact that these owners tend to put in more effort.

3
studying and working together. These sections form extremely close ties, and are a set-
ting where peer effects—if they are empirically observable at all—would likely be seen.
We exploit the fact that the representation of students with entrepreneurial backgrounds
varies considerably across sections: We analyze the effect of students with prior entre-
preneurial experience on the rate of post-MBA entrepreneurship among their section-
mates (without such prior experience). Moreover, we collect detailed data about the stu-
dents’ entrepreneurial ventures, which allow us to differentiate between successful and
unsuccessful start-ups and to relate peer effects to entrepreneurial success. Our novel data
set combines the official class card records of 5,897 students of the classes 1997 to 2004,
section-level post-MBA placement data, and hand-collected data on the success of entre-
preneurial ventures.
We find a striking pattern: exposure to a higher share of peers with a pre-MBA
entrepreneurial background leads to lower rates of entrepreneurship post-MBA. A one
standard-deviation increase in the share of peers with an entrepreneurial background
(evaluated at the mean of all independent variables) reduces the predicted share of the
other students going into entrepreneurship by about one percentage point, a reduction of
more than twenty-five percent. When we differentiate between successful and unsuccess-
ful ventures, however, we find that the negative peer effect is exclusively driven by a de-
crease in unsuccessful entrepreneurship. The effect on successful post-MBA entrepre-
neurs is indistinguishable from zero, and significantly more positive than the effect on
unsuccessful entrepreneurs.
Our results are consistent with the presence of intra-section learning. An extensive
literature, beginning with Jovanovic [1982], has highlighted the fact that entrepreneurs

4
learn about their abilities through running their businesses. The close ties between stu-
dents in the same section may accelerate the learning process. Such intra-section learning
may occur through several possible channels. First, students with entrepreneurial back-
grounds may provide direct counsel to their peers and help identifying which business
ideas are worth pursuing (selection of business ideas), or which students are able to run a
business successfully (selection of individuals with business skills).3 Second, the mere
presence of entrepreneurial peers and their reports about their experiences may help other
students to realize the challenges involved in starting a company. That is, even without
individual advice, pre-MBA entrepreneurs may inject realism into other students and dis-
courage all but the best potential entrepreneurs from pursuing their ventures. Third, the
presence of entrepreneurial peers may not affect individual decisions directly, but en-
courage students to take more elective entrepreneurship classes, which in turn lead to bet-
ter decisions.
We address the third mechanism by examining the enrollment in second-year
elective entrepreneurship classes. We find no effect of the presence on entrepreneurial
peers on enrollment in such classes, ruling out the third explanation. (This finding also
casts doubt on the second explanation, since a more general discouragement would sug-
gest lower enrollment.) In addition, we test whether prior entrepreneurs’ own (prior) suc-
cess or failure is related to the sign or strength of the peer effect, as one would expect un-
der the second channel. Since the success rate among prior entrepreneurs at HBS is unu-
sually high (42%), our data provides the necessary variation. We do not find any such
correlation. Hence, while the lack of micro-data on individual student-level interactions
3 Entrepreneurial peers might also introduce section-mates with promising ideas to venture capitalists or
other sources of financing.
5
limits our ability to test the causal role of direct student interaction, the empirical patterns
seem most consistent with this interpretation.
This first channel is also consistent with our last finding: the variance of post-
MBA entrepreneurship rates is significantly lower when more entrepreneurs are present
in the section. One interpretation of the reduction in variance is that, with a large enough
number of entrepreneurial peers, it becomes more likely that at least one of them has the
expertise to detect the flaw in a given business idea.
Our analysis fills several gaps in the literature on the determinants of and returns
to entrepreneurship. In addition to the above-mentioned appeal of the exogenous assign-
ment and the availability of success measures, our setting overcomes some of the data
limitations of the primary sources used in previous entrepreneurship research, such as
Census data, Internal Revenue Service data, and the Panel Study of Entrepreneurial Dy-
namics. As highlighted by Parker [2004], those data capture a specific type of entrepre-
neurial activity, typically the self-reported decision to become self-employed (e.g., as a
groundskeeper or consultant) rather than the founding of an entrepreneurial firm. In fact,
in many databases, founders of entrepreneurial companies cannot be distinguished from
employees of established firms. In our setting, we carefully trace the entrepreneurial his-
tories of students who start a company.
A second challenge facing much of the earlier empirical work is that the im-
portance of entrepreneurial entities varies tremendously. While the bulk of entrepreneuri-
al ventures simply replicate other entities and have limited growth potential (Bhide
[2000]; Hurst and Pugsley [2012]), a small number of ventures create enormous wealth
and have a profound economic impact. Our paper complements previous research in us-

6
ing data that include a significant number of high-potential start-ups. Historically, Har-
vard Business School students have been instrumental in founding leading firms in a va-
riety of industries (e.g., the Blackstone Group, Bloomberg, LLP, and the modern Xerox
Corporation; for many more examples, see Cruikshank [2005]). Even within our relative-
ly recent sample, we encounter early-career entrepreneurs founding highly successful
firms, such as athenahealth (publicly traded, with a market capitalization of $3.2 billion
in August 2012) and SupplierMarket (acquired by Ariba for $581 million). In other
words, this paper analyzes a particular and talented subset of the overall population, in
contrast to much of the prior literature mentioned above.
The differences in samples preclude comparisons with previous findings. Any dif-
ferences in the sign and magnitude of peer effects in our analysis, relative to prior litera-
ture, may either reflect the improved identification or sample differences. However, given
the highly skewed nature of entrepreneurial outcomes, the occupational choices and peer
effects in this subset of individuals are particularly relevant and important. Our results
suggest that, in this sample, much of the benefit from exposure to entrepreneurship does
not to come from encouragement of more entrepreneurship but from help in weeding out
ventures that are likely to fail.
I. Identification
Our identification strategy exploits three unique features of the data we collected. The
first is the exogenous assignment of students to sections. The second is the identification
of students with prior entrepreneurial experience, which allows us to distinguish between
students who exert an entrepreneurial influence and those who are less likely to do so.
And, third, we obtain information about the scale and success of the entrepreneurial ven-

7
tures.
I.A. Challenges in Identifying Peer Effects
The identification of peer effects is a major challenge in economics. In the context of en-
trepreneurship, earlier papers measure peer effects by regressing entrepreneurship out-
comes on entrepreneurship among peers. There are several difficulties in interpreting co-
efficients estimated with this approach (Manski [1993], Sacerdote [2001]).
The most important issue is self-selection. If individuals choose where to work or
otherwise interact with their peers, it is difficult to separate selection from peer effects. In
fact, several studies in the economics show that peer effects found in settings with endog-
enous sorting disappear once the analysis is redone exploiting exogenous assignment, re-
gardless of how extensively observables were controlled for in the settings with endoge-
nous sorting.4 In this paper, we move beyond the limitations of endogenous sorting by
exploiting exogenous variation in the exposure to entrepreneurial peers.
Another confounding issue in the literature on peer effects is the distinction be-
tween the effect of one peer on others and common shocks affecting the entire peer
group.5 Focusing on pre-determined characteristics, such as entrepreneurial activities pri-
or to graduate school, avoids this problem.
A related issue is the distinction between the influence of peers versus the indi-
vidual’s own prior inclinations. In the context of entrepreneurship, the question is wheth-
4 Kremer and Levy [2008], for example, study the peer effects of college students who frequently con-
sumed alcohol prior to college on the GPA of their roommates, and find systematically different effects in
the samples of randomly assigned and self-selected roommates. Duflo and Saez [2002] analyze the influ-
ence of co-workers on the decision to invest in a retirement account in a setting with endogenous sorting.
When they re-analyze the effect in a randomized experiment (Duflo and Saez [2003]), they find significant-
ly smaller (if any) peer effects. 5 In the context of school outcomes, Sacerdote [2001] finds a significant correlation in the GPAs of ran-
domly assigned college roommates but little evidence that roommates’ pre-college academic background
(SAT scores and high-school performance) matter. Hence, common shocks due to dorm room characteris-
tics, infections, or joint class choices might explain part of the results (Kremer and Levy [2008]).

8
er one can distinguish between the influence of entrepreneurial peers versus an individu-
al’s own predisposition to become an entrepreneur, as well as interaction effects. To illus-
trate the identification problem, suppose we would like to identify the effect of how ―en-
trepreneurial‖ the average peer is, separately from the effect of how ―entrepreneurial‖ an
individual herself is, on the individual’s decision to become an entrepreneur. A simple
individual-level regression model can be written as follows:
effectsotherXXXXY jijijijiji ,,,,, (1)
where i indicates the individual, j the group of peers, and Yi j is an indicator equal to 1 if
individual i becomes an entrepreneur. jiX , is the average peer effect, i.e., the share of
entrepreneurial peers in group j excluding individual i, and Xi,j is an indicator equal to 1 if
individual i is entrepreneurial herself. The interaction term allows for a different peer ef-
fect on individuals who are entrepreneurial themselves versus those who are not. Sum-
ming the individual-level data by group (j) and dividing by group size, we obtain the
group-level regression model:
effectsotherMN
N
MN
NXXY
jj
j
jj
j
jjj
1
1 (2)
effectsotherXXXY jjjj 1 (3)
where jY is the share of individuals in group j who become entrepreneurs;
jX is the
share of entrepreneurial peers in group j; 1jX is the share of entrepreneurial peers in
group j after removing one entrepreneurial individual (and is equal to 0 if there is no en-
trepreneurial peer); Nj is the number of entrepreneurial peers in group j; and Mj is the
number of non-entrepreneurial peers in group j. Equation (3) illustrates that we cannot
separately estimate the entrepreneurial influence of peers (β) and an individual’s own en-
9
trepreneurial disposition (γ). Instead, we are measuring the combined effect (β + γ). In
addition, the interactive effect 1jj XX complicates the estimation.
Our empirical approach avoids this confound since we identify individuals who
are likely to exert entrepreneurial peer influence ex ante, using prior entrepreneurial ex-
perience as a proxy. At the same time, we exclude pre-MBA entrepreneurs from the out-
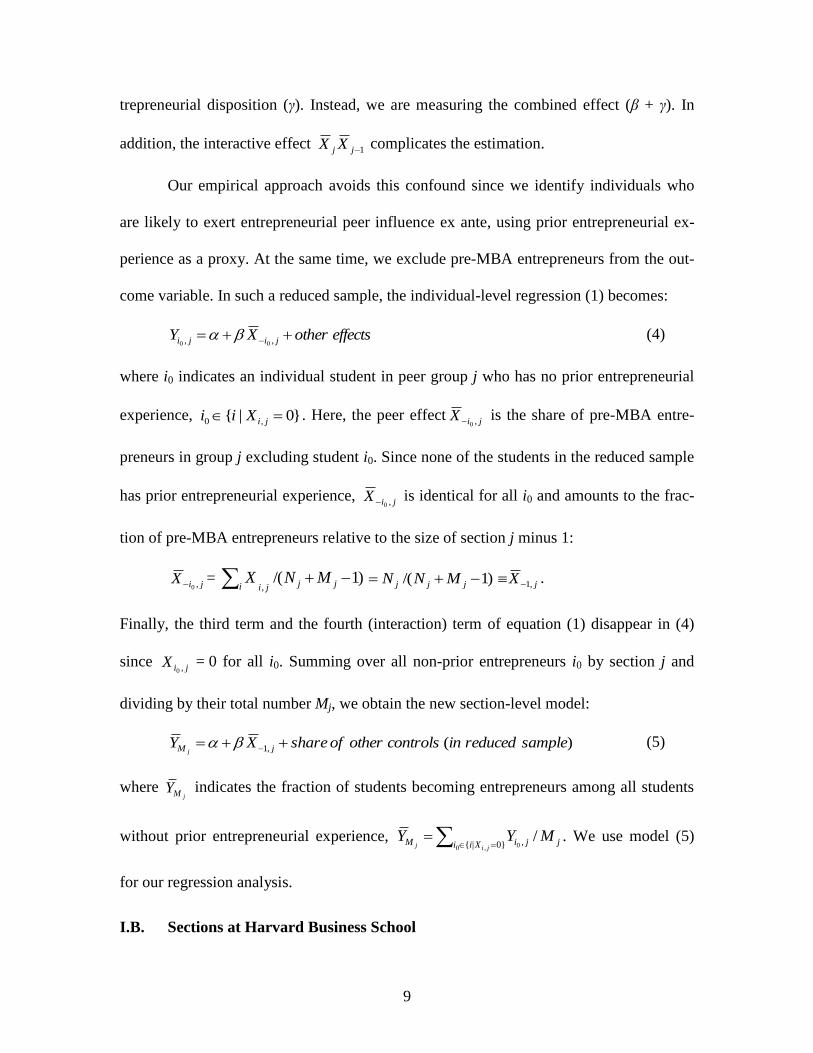
come variable. In such a reduced sample, the individual-level regression (1) becomes:
effectsotherXY jiji ,, 00 (4)
where i0 indicates an individual student in peer group j who has no prior entrepreneurial
experience, }0|{ ,0 jiXii . Here, the peer effectjiX ,0 is the share of pre-MBA entre-
preneurs in group j excluding student i0. Since none of the students in the reduced sample
has prior entrepreneurial experience, jiX ,0 is identical for all i0 and amounts to the frac-
tion of pre-MBA entrepreneurs relative to the size of section j minus 1:
jiX ,0= )1/(
, jjjii
MNX )1/( jjj MNN jX ,1 .
Finally, the third term and the fourth (interaction) term of equation (1) disappear in (4)
since jiX ,0 = 0 for all i0. Summing over all non-prior entrepreneurs i0 by section j and
dividing by their total number Mj, we obtain the new section-level model:
)(,1 samplereducedincontrolsotherofshareXY jM j (5)
where jMY indicates the fraction of students becoming entrepreneurs among all students
without prior entrepreneurial experience, jXii jiM MYYjij
/}0|{ ,
,0 0 . We use model (5)
for our regression analysis.
I.B. Sections at Harvard Business School
10
We also exploit Harvard Business School’s long-established section system to address
the above-mentioned identification challenges. MBA students spend their entire first year
in a set group of 80 to 95 students in a single classroom, taking a fixed slate of classes
(e.g., accounting, finance, and marketing). There is no provision for switching between
sections. And while administrators ensure that each section is taught by a mixture of jun-
ior and senior faculty, no effort is made to match faculty and section characteristics. The
social ties established in the first year appear to remain extremely strong, even after grad-
uation. For instance, at the 25th
alumni reunions, fundraising and many activities are ar-
ranged on a section-by-section basis. The power of the social experience engendered by
HBS sections has been observed upon in both journalistic accounts and academic studies,
which we report in more detail in the Appendix.
Given the profound influence of the section experience, it seems conceivable that
section-mates affect their peers’ decisions to become entrepreneurs. Cruickshank [2005]
offers a number of illustrations where section-mates began businesses or refined business
ideas together. Another place to see the impact of the section relationships on entrepre-
neurial choices is the HBS business plan contest. This contest, started in 1997, was open
in its initial years only to second-year students. Many of the entries were the foundation
for post-MBA ventures. In the contests between 1998 and 2004, 33% of student teams
consisted of section-mates, even though students were free to choose partners across their
entire class.6 Were the selection of partners random across sections, the expected share of
section-mates would be 9% for 1998 to 2003 and 10% for 2004.
6 Students were allowed in these years to involve students from other schools but not first-year students. In
our calculations, we consider all pairwise combinations, ignoring non-HBS students. For example, a team
consisting of three students, hailing from sections A, B, and B, was regarded as involving three pairs, one
of which consisted of students in the same section and two of which did not. There were 277 student teams
consisting of 566 pairs of second-year students, and 185 of those pairs, or 33%, consisted of section-mates.

11
A second reason why the HBS section environment is a promising path to explore
entrepreneurial peer effects is the professional experience of the students. Unlike other
professional schools, HBS students have considerable work experience, between three
and five years for the typical student in the classes under study.7 Moreover, there is con-
siderable diversity of backgrounds, in particular in terms of entrepreneurial experience,
which allows us to exploit the differences across sections empirically.
I.C. Assignment to Sections
Students are assigned into sections by a computer program developed by HBS adminis-
trators. The assignment procedure is a mixture of randomization and stratification. It is
based on the information about students on the official forms that all entering students fill
out and that are also the basis of the class cards that we analyze.
The assignment program has undergone slight modifications over the years, but
worked as follows during the period under study: First, approximately 200 students are
randomly chosen out of all entering students and randomly assigned to sections. Then,
additional students are considered one at a time in random order and assigned to a section
based on a stratification score. This score is a weighted average of the Herfindahl index
of each stratification criterion. The program computes which assignment would make the
weighted average Herfindahl index lowest, and assigns the student to that section.
The stratification criteria are, in order of priority (and hence weight): gender; eth-
nicity; whether the student went to the remedial analytics course in August prior to ma-
triculation, and if so, what (remedial) section the student was assigned to; quantitative
and verbal skills, in particular, whether the student’s admission was conditional on a re-
7 http://www.hbs.edu/about/mba.html (accessed September 16, 2011) and unpublished tabulations.

12
medial analytics course, supplemental work on quantitative skills, or work on verbal
skills, and whether the student’s quantitative or verbal GMAT score was high, medium,
or low; home region (distinguishes ten US regions, most major European countries, Ja-
pan, China, India, and everywhere else); industry in which the student worked in his or
her most recent job (e.g., consulting, finance, telecommunications, etc.); age; whether the
student attended one of the major ―feeder‖ colleges (Harvard, Yale, West Point, etc.);
function in the student’s last job (e.g., sales or finance, etc., but there is no function for
entrepreneurs); marital status; college major; whether the student worked for one of 49
major companies in their last job.8 Once a section fills up, the assignments are only made
to the remaining sections. Finally, the registrar staff ―hand-adjust‖ these assignments to
correct for two considerations: One is students born to expatriate parents. For example, a
student born in the U.S. with French citizenship (which suggests French parents) may be
switched to a section with fewer French people. The other is students with a military
background whom the program missed because of a brief stint on Wall Street or in con-
sulting before going to business school. Students will be swapped to ensure that the mili-
tary component in each section is about even.
Hence, the primary dimensions along which students are sorted are orthogonal to
the ones of interest of our study. Some of the secondary considerations in assigning stu-
dents to sections, such as the undergraduate institution—e.g., Ivy League vs. state univer-
sity graduates—are not orthogonal to the variable of interest. However, while stratifica-
tion along these dimensions may lower the power of our analysis, it does not bias our es-
8 Due to software limitations (the program requires an exact match), this category works very poorly. For
instance, it recognizes ―McKinsey & Co.‖ or ―McKinsey & Company,‖ but not ―McKinsey‖ or ―McKinsey
Chicago.‖ Out of approximately 450 admits in the class of 2010 that we examined, the program only rec-
ognized the firms for about 10%. All others were bunched together in ―other,‖ along with former entrepre-
neurs and students who worked for smaller firms.

13
timation given the exogenous assignment and our ability to control for the stratification
categories. We had access to all information used about the students in the sectioning
process (or approximations of that information) with the exception of that on test scores
and conditional admissions.
Most importantly, the administrators do not identify and balance out students who
were entrepreneurs prior to HBS. Instead of the detailed textual analysis we undertake
(see below), their assignment software uses only the subset of the class card information
that can be readily sorted by the computer. Commonly, entrepreneurs are classified as
―general management,‖ but this function is very broad and includes a wide range of other
backgrounds.9 Overall, 52.5% of the students with an entrepreneurial experience and
15.2% of all other students are classified as general management. As a result of the
coarse classification, sections vary widely in the number of entrepreneurs. The section
share of entrepreneurial peers ranges from 0% at the 10th
percentile to 10% at the 90th
percentile, which allows us to gain empirical identification.
The broad definition of the ―general management‖ function also ensures that the
number of entrepreneurs in a section is not negatively correlated with other types of
―general management‖ experience. A possible threat to identification could have been
that sections with more entrepreneurs would have significantly fewer other students in the
general management category and that the presence of more entrepreneurs therefore
affects the types of non-entrepreneurial students in a section. To address this concern, we
regress the share of pre-MBA entrepreneurs on the share of non-entrepreneurs with a
9 Examples include leadership positions at non-profits (e.g., an associate at a foundation), at for-profit
organizations (e.g., the program director at a sports training academy, the general manager of a number of
restaurants, or the senior manager of new business development at a heath-care firm), and in the military,
e.g., junior officers.

14
general management background (and year dummies). We find that the relationship is
statistically insignificant (with a t-statistic of -0.35) and economically negligible (with a
coefficient of -0.04). Nevertheless, as an added control, we include ―share of students
without an entrepreneurial background who worked in a general management function‖
in all the regression analyses below.
II. The Data
Our analysis draws on four primary sets of data. First, we collect data on the characteris-
tics of students from their class cards. Class cards are initially filled in by school adminis-
trators based on students’ applications.10
Students can update their class cards while en-
rolled at HBS. We obtain the class cards for 6,129 students graduating between 1997 and
2004. The starting date was dictated by data availability; the end date by the need to have
several years after graduation in order to identify which entrepreneurs were successful.
We extract information on gender, nationality (in particular, sole or joint U.S. citizen-
ship), age, family status, work experience, and educational background. Due to inappro-
priately classified students (e.g., cross registrants) and missing data, the usable data
amounts to 5,897 students. For age, we use 21.5 years plus the time elapsed since college
graduation.11
For family status, we use whether they had a partner, as well as whether
they indicated children among their interests or other descriptive material. For work ex-
10
The fact that the class card information is drawn from applications alleviates concerns that students ex-
aggerate their accomplishments. Lying on one’s application is a very high-risk strategy, as it can lead to
expulsion from the school or even the voiding of a degree. HBS takes ethics during the application process
very seriously: several years ago, some accepted students who had checked the status of their application
on a web site earlier than allowed had their offers rescinded (Broughton [2008]). 11
This calculation is based on estimates by school administrators. While U.S. Census data suggests that the
average graduate of an undergraduate program is considerably older, the majority of the school’s enrollees
complete their undergraduate programs faster. The primary exceptions are Mormon students, who frequent-
ly take two years off from college to serve as missionaries.

15
perience, we use the industry students had worked in after college.12
For educational
background, we use college and college major. We classify whether their primary degrees
are from an Ivy League school or, alternatively, an ―Ivy Plus‖ school.13
Going beyond the characteristics used by HBS for stratification, we also attempt
to characterize risk attitudes, given suggestive evidence in the literature on lower risk-
aversion among entrepreneurs (Parker [2004]). As an imperfect proxy, we exploit the
riskiness of the activities listed by the students based on the injury data from American
Sports Data [2005].14
We employ their compilation of ―Total Injuries Ranked by Expo-
sure Incidence,‖ which gives the number of injuries per 1000 exposures for each sport.
The most risky activity (boxing) causes 5.2 injuries per 1000 exposures and gets a risk
score of 1. Other activities are scaled accordingly. Lacrosse, for example, causes 2.9 inju-
ries per 1,000 exposures and gets a risk score of 2.9/5.2 = 0.558. We average the top risk
score for each student in the section. In unreported robustness checks, we employ the av-
erage across all activities listed by each student. We also calculate the share of students in
each section whose top risk scores are higher than certain thresholds – higher than the
mean (0.38), higher than the mean plus one standard deviation (0.48), and higher than the
12
We use a sixty-industry scheme of the hiring and compensation database at HBS Career Services. Stu-
dents who worked in multiple industries are coded as having participated in all of them. The results are
robust to assigning each student to a single field—the one in which he or she spent the most time or, if the
student worked an equal amount of time in two fields, the area in which he or she worked most recently. 13
Ivy Plus is an association of administrators of leading schools, which includes the Ivy League schools
plus CalTech, University of Chicago, Duke, MIT, Stanford, and the Universities of Cambridge and Oxford.
In unreported analyses, we also use a classification that adds the top non-U.S. schools, as defined by the
Times Higher Education Supplement, in addition to Cambridge and Oxford: the Ecole Polytechnique and
the London School of Economics. These changes make little difference to the results. 14
The data is based on a survey of 25,000 households in 2003 (62% response rate). Several injury measures
are provided, e.g., total injuries, injuries resulting in an emergency room visit, etc., which tend to be quite
correlated. For sports not included in the American Sports Data, we substitute the closest sport (e.g., base-
ball for cricket, day hiking for orienteering). If there is no comparable listing, we assign the top ranking if
they appear to be very high risk (e.g., motorcycle racing) and the median ranking if they are more moderate
(for instance, fencing). We exclude activities that do not involve physical exertion (e.g., fantasy football
and pigeon racing) or are too vague (for instance, ―athletics‖ or ―all sports‖).

16
mean plus two standard deviations (0.58). Again, the results are little different.
Finally, we use the class cards to construct the key variable for our analysis: prior
entrepreneurial experience. We identify students who (co-)founded an entrepreneurial
venture prior to entering business school. We do this by searching for terms such as ―co-
founded,‖ ―started,‖ or ―launched.‖ We include ventures which are spun-off from another
firm, but eliminate corporate ventures, e.g., starting up and heading a division within a
company.15
Unlike the calculation of industry experience (which focused on post-college
employment), we include businesses begun before graduating from college, on the
grounds that these experiences also provide insights into the planning and implementa-
tion of entrepreneurial ventures. Overall, the prior entrepreneurial endeavors were quite
diverse, but most fell into three broad categories:
o Businesses geared toward a limited market. Frequent examples included campus-
oriented services (e.g., a bottled-water delivery service to dorm rooms at local college
campuses) and food service facilities (e.g., a 14-unit retail bagel chain in Hungary).
o Businesses that were acquired due to economies of scale or scope, such as a chain of
eight bike shops sold to a larger competitor, or an Internet consulting firm that was
sold to a more generally focused consulting firm after a failed IPO.
o Ventures where the entrepreneurial founder was eventually shunted into a narrower
functional role (e.g., chief technology officer) as the firm grew and professional man-
agement was recruited, e.g., in a security software firm.
For supplemental analyses, we also assess the success of those prior entrepreneur-
ial ventures. (This information is only used in Table VIII.) If there are entrepreneurial
15
Freelance consulting is not counted as starting a business unless there are other consultants working for
that person. We also do not include a small number of cases where students operated franchises as entre-
preneurs since operating a franchise is more similar to running a corporate unit.

17
peer effects, the influence of successful entrepreneurs may be more encouraging than that
of unsuccessful entrepreneurs. Moreover, while the core of our analysis focuses on spill-
overs from entrepreneurial experience rather than entrepreneurial skills, this measure al-
lows us to approximate the latter. Our primary cut-off point for success is whether the
business achieved a million dollars in annual revenues.16
Unlike the identification of the
pre-MBA entrepreneurs, which is entirely based on official class card records, or the
identification of post-business success, where we have multiple, highly consistent infor-
mation sources, our identification here is only approximate. In addition to the class cards,
we use social networking sites such as Facebook and LinkedIn, and direct contacts with
the students. In total, we classify 42% of the businesses as successful, 19% as unsuccess-
ful, and the remainder as unknown.
A success rate of 42% is unusually high compared to broader samples of entre-
preneurs. Apparently, pre-MBA entrepreneurs often sold their businesses at a profit. We
encountered descriptions such as ―grew business from start-up to $6 million per year in
revenues—my brother is managing now,‖ or ―took $2 million in profits out of business in
three years before wrapping it up.‖ To better understand this selection of entrepreneurs,
we conducted interviews with MBAs who had been entrepreneurs prior to business
school. They all emphasized their need for skill development and the intention to go onto
new and larger ventures. Many had been technically trained prior to business school and
highlighted that their lack of business training or insights into marketing, finance, etc. had
become increasingly problematic as their businesses grew and they interacted with indi-
vidual angel investors and venture capitalists. The other main motivation mentioned was
16
Note that the cut-off is lower than in the definition of the success for post-business school entrepreneur-
ship discussed below. The lower hurdle reflects that students engaging in pre-business school entrepreneur-
ship had a lower opportunity cost.

18
the desire for more contacts. Several respondents expected ties with venture investors,
corporate development specialists, and wealthy people in general to result from enroll-
ment at HBS, which would increase the probability of success of future ventures.
A difficulty in the data collection was posed by the failure of HBS to archive class
cards prior to 2000. We obtained cards for the years 1997 to 1999 from HBS professors
who had saved the class cards of the classes they had taught. Some of these instructors
had taught first-year classes, in which case they had information on all students in a given
section. Others had taught second-year classes, in which case the class cards covered stu-
dents from various sections who had chosen that class. As a result, the completeness of
our information in the early years varies.
Missing class cards reduce the precision with which we can characterize the fea-
tures of sections and raise concerns about response bias. In high-count sections (all or
almost all class cards), the cards are provided by HBS or by first-year instructors, who
are assigned randomly to sections. Thus, there is little potential for bias. In low-count
sections, instead, the cards come from second-year instructors. Only a minority of in-
structors saves the cards of former students, and these are typically professors of man-
agement practice (successful practitioners who become instructors after their business
careers) and professors in more practically minded fields such as entrepreneurship. To
prevent such selection biasing our result, the main analyses in the paper only employ sec-
tions where we have been able to gather at least seventy class cards. We undertake sup-
plemental analyses with all sections, with a less restrictive, and with a more restrictive
sub-sample (sections with at least 40, 75, or 80 class cards).17
17
In the more expansive samples (all sections or all sections with 40+ class cards), we also replicated our
analyses weighting the observations by the number of class cards. All of our main results are robust to all

19
Tables I and II show the summary statistics. Unlike in the rest of the paper, Table
I displays aggregate data on the entire student body, including students for whom we are
missing class cards. The year-by-year statistics reveal that class size remained approxi-
mately constant, around 900 across all sections, but the composition changed: female,
minority, and non-U.S. students were increasingly represented. In addition, the share of
students with a technical or science background increased markedly. The average section
size is stable, around 80 students, from the class of 1998, when the average section size
shrank in conjunction with an added experimental accelerated MBA program, to the class
of 2004, when the number of sections was reduced from 11 to 10 after elimination of the
accelerated program.
The lower half of Table I shows measures of macro-economic financing condi-
tions, which we use to control for the U.S. economic environment for entrepreneurship.
One measure is the amount of U.S. venture capital provided annually in the initial and in
all financing rounds of new firms. The information is taken from National Venture Capi-
tal Association [2005], based on the records of Venture Economics. Another measure,
compiled from Securities Data Company and the website of Jay Ritter, is the number and
dollar volume of initial public offerings in United States, as well as the amount ―left on
the table‖ in these offerings (the difference between the closing price on the first day and
the offer price, multiplied by the number of shares sold). Even though IPOs are typically
confined to firms that have several years of operations, they provide a useful proxy of the
financing available to new ventures in the same industry, possibly reflecting investment
opportunities in this industry (Gompers, et al. [2008]).
of these alternative approaches, though in some cases the levels of statistical significance are lower – con-
sistent with underlying selection bias. All replication tables are available from the authors.

20
The year-by-year tabulation in the lower half of Table I highlights the acceleration
of activity during the ―bubble years‖ of the late 1990s. This pattern is also illustrated in
Figure 1. In our regression analysis, we employ both a VC and an IPO measure of financ-
ing conditions. Alternatively, we include year dummies.
Table II shows detailed characteristics for those students for whom we have class
card information. We aggregate by section to make the data compatible with the outcome
data, which is available only by section (as described below). Panel A shows the sum-
mary statistics for all 86 sections, and Panel B for the 60 sections with at least seventy
class cards. In terms of control variables, the data reveals the heavy representation of stu-
dents in investment banking and consulting.18
We also single out the share of students in
private equity (which we define here to include both venture capital and buyout funds),
since these students may be particularly well prepared to provide counsel to would-be
entrepreneurs. Sections differ on a variety of personal characteristics, including the pres-
ence of students with children and graduates of elite schools. The differences between the
10th
and 90th
percentiles narrow when we require data on at least 70 students (Panel B),
which reflects the fact that the distribution becomes less noisy.
The key variable of interest is the share of students who previously worked as en-
trepreneurs. The average is around 5%, though the 10th
-90th
percentile range is quite
large, between 0 and 10 percent. The scatter plot in Appendix Figure 1 shows the full
range of variation by plotting the year-section data points, ordered by section.
To distinguish time-series from cross-sectional variation, we graph the full distri-
bution of entrepreneurs in a section, both the raw count (left graph in Figure 2A) and ad-
18
The variation in the share of investment bankers (10th
versus 90th
percentile) reflects in large part time-
series variation, i.e., the ebb-and-flow of these admits across classes, rather than inter-section differences.

21
justed for year effects, i.e., the share divided by the average share in that year (right graph
in Figure 2A). While some sections have no members with previous entrepreneurial ven-
tures, others have up to 13% (12 pre-MBA entrepreneurs) and, year-adjusted, a rate near-
ly three times the rate of the other sections in that year. The year-by-year variation,
shown in Panel B, is smaller, ranging from shares of 3.7% in 1998 to 6.3% in 1997.
Our second data set contains the class choices in the second year. We determine
all elective classes students enrolled in, as well as the fraction of such classes the course
prospectus listed as (co-)sponsored by the Entrepreneurial Management unit. We com-
pute the share of entrepreneurship classes for students without prior entrepreneurial expe-
rience. On average, non-entrepreneurs devote 19% of their elective classes to entrepre-
neurship. The ratio varies from as low as 9% to as high as 27% across sections and years.
Our third data set provides information about the careers post-graduation, includ-
ing the key outcome variable, post-MBA entrepreneurship. We use the annual HBS ―exit
survey.‖ Since HBS makes the picking of a cap and gown for graduation conditional on
survey completion, participation is almost perfect.19
The survey offers multiple categories
for the post-graduation industry of employment, for cases where the student is still look-
ing for employment and for students who have founded or are planning to imminently
found a new venture. The survey responses are anonymous to ensure candid responses.
As the survey only reflects students’ intentions at graduation, it is possible that some
would-be entrepreneurs abandon their quests later, or, vice versa, students decide to start
a company later. Our measure of post-MBA entrepreneurship is unbiased if this inexacti-
19
The survey does not capture students who drop out without completing a degree. This (very small) frac-
tion, typically considerably under 1%, overwhelmingly represent students who leave the program involun-
tarily due to poor academic performance. Even at the peak of the Internet boom, only a handful of students
permanently left school before graduation to pursue an entrepreneurial opportunity.

22
tude only introduces random noise; it is precise for the stated entrepreneurial intentions.
We obtained access to the number of students starting an entrepreneurial venture,
aggregated on the section level. We then separate out the shares of students who also
were entrepreneurs pre-MBA. As discussed above, we need to exclude ―pre-and-post-
MBA‖ entrepreneurs from the estimation of peer effects to obtain identification and to
distinguish the estimated peer effect from the effect of own prior experience. Our desired
outcome variable jMY is the fraction of students in section j who become entrepreneurs
post-MBA among all students with no prior entrepreneurial experience in that section:
jjiXiiM MYYjij
/,}0|{ 0,0 .
The empirical difficulty lies in the anonymity of the aggregate, section-level
placement data. To create the desired ratio, we need to identify, for all sections j, the
number of students with prior entrepreneurial experience who also started a (new) com-
pany post-MBA. We use our individual-level class card data to identify students with pri-
or entrepreneurial experience and research if they took an entrepreneurial position after
HBS. The main sources were social networking sites, Google, and direct contacts. This
data allows us to calculate the numerator of the outcome variable, }0,|{ ,jXi jii
Y , as
}0,|{ ,jXi jii
Y =
}1|{ ,,
, jiXi jii ji YY .
Another difficulty is that, for some sections, we do not have all class cards. In
those sections, our measure of the fraction of post-MBA entrepreneurs among non-pre-
MBA entrepreneurs,jMY , could be biased in two ways. First, if we calculated the number
of pre-not-post-MBA entrepreneurs, Mj, by simply subtracting the number of ―identified‖
pre-MBA entrepreneurs from the size of section j, we would overestimate Mj and hence
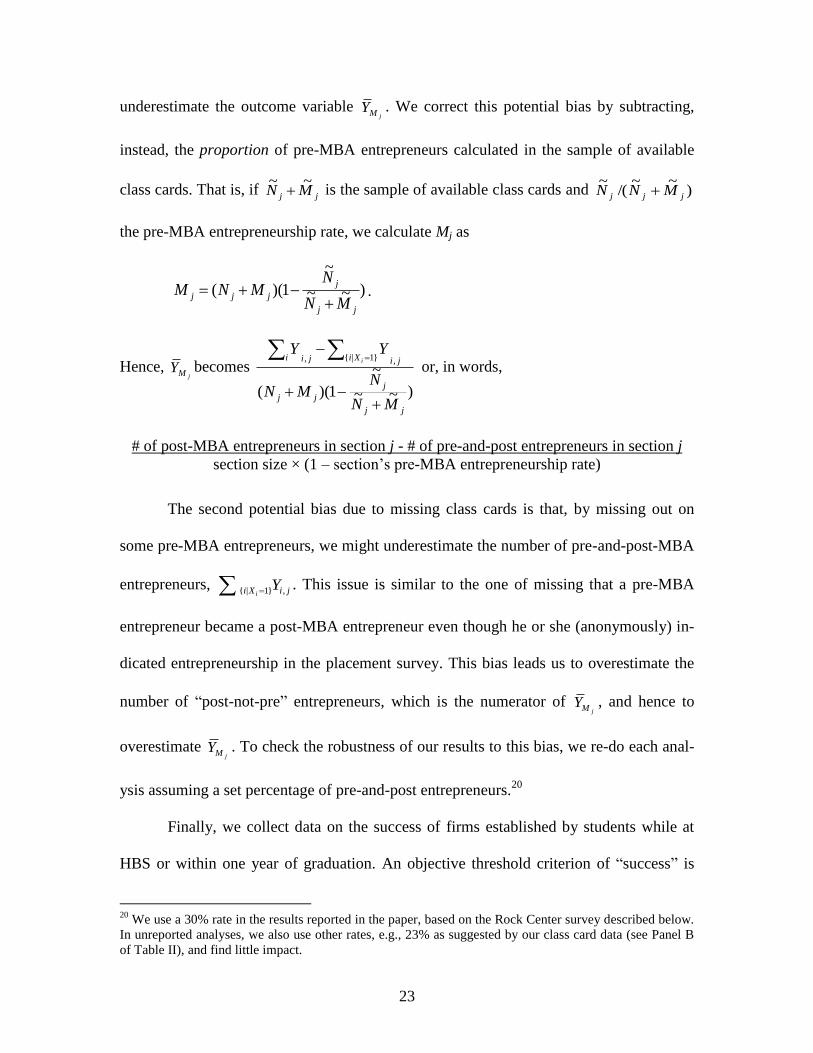
23
underestimate the outcome variable jMY . We correct this potential bias by subtracting,
instead, the proportion of pre-MBA entrepreneurs calculated in the sample of available
class cards. That is, if jj MN
~~ is the sample of available class cards and )
~~/(
~jjj MNN
the pre-MBA entrepreneurship rate, we calculate Mj as
)~~
~
1)((jj
j
jjjMN
NMNM
.
Hence, jMY becomes
)~~
~
1)((
,}1|{,
jj
j
jj
jiXijii
MN
NMN
YYi
or, in words,
# of post-MBA entrepreneurs in section j - # of pre-and-post entrepreneurs in section j
section size × (1 – section’s pre-MBA entrepreneurship rate)
The second potential bias due to missing class cards is that, by missing out on
some pre-MBA entrepreneurs, we might underestimate the number of pre-and-post-MBA
entrepreneurs, jiXi Y
i ,}1|{ . This issue is similar to the one of missing that a pre-MBA
entrepreneur became a post-MBA entrepreneur even though he or she (anonymously) in-
dicated entrepreneurship in the placement survey. This bias leads us to overestimate the
number of ―post-not-pre‖ entrepreneurs, which is the numerator of jMY , and hence to
overestimate jMY . To check the robustness of our results to this bias, we re-do each anal-
ysis assuming a set percentage of pre-and-post entrepreneurs.20
Finally, we collect data on the success of firms established by students while at
HBS or within one year of graduation. An objective threshold criterion of ―success‖ is
20
We use a 30% rate in the results reported in the paper, based on the Rock Center survey described below.
In unreported analyses, we also use other rates, e.g., 23% as suggested by our class card data (see Panel B
of Table II), and find little impact.

24
hard to find. We define a successful business as one that, as of July 2011, (a) had gone
public, (b) had been acquired for more than $5m, or (c) had, then or at the time of the sale
of the company, at least 50 employees or $5m in annual revenues.21
The $5m cut-off is
based on the following rationale: Hall and Woodward [2010] estimate the mean equity
stake of entrepreneurial teams at the time of exit at 53%, and, according to Gompers, et
al. [2005], the typical venture-backed firm has 3.0 founders. Assuming a valuation-to-
revenue ratio of one,22
a $5m valuation at exit guarantees that the equity per founder is
(approximately) worth at least one million dollars. In supplemental analyses, we employ
higher hurdles for criteria (b) and (c), namely $25 million or even $100 million.
We use three sources. First, we obtain access to research of the HBS External Re-
lations (Development) Office into its entrepreneurial alumni. Second, we obtain access to
the online survey of the Rock Center for Entrepreneurship that collects information about
students who participated in the business plan contest as well as other early-career entre-
preneurs.23
Third, we conducted interviews with the three faculty members in the HBS
Entrepreneurial Management unit who are intimately involved with most alumni ventures
– whether as sponsors of the independent studies where the initial business plans are
drawn up, or as directors, advisory board members, or investors in subsequently estab-
lished ventures – and who often stay in touch with alumni entrepreneurs even without a
formal role. As a result, they have extensive knowledge about the performance of these
21
While we would have liked to determine the success as of a set time after graduation (e.g., three years
after degree completion), this information proved infeasible to gather. 22
According to Thomson Reuters SDC data, the median multiple of valuation to the last twelve months
revenues in all U.S. IPOs between 1997 to 2004 was 1.55; when excluding the ―bubble years‖ of 1999 and
2000, it was 0.99 23
The survey used a ―viral‖ approach, whereby known entrepreneurs were asked to identify other entrepre-
neurs among their classmates, and encourage them to complete the survey. Alumni were initially contacted
via e-mail in January 2005. Non-respondents were contacted three times via e-mail and telephone. Overall,
41% of all contacted students participated. This rate is consistent with or above the level of responses typi-
cal in social science studies of this cohort (Baruch [1999]).

25
ventures. In cases where none of the three sources revealed the revenues, public status, or
acquisitions of our sample firms, we consulted a wide variety of business databases, such
as CorpTech, EDGAR, Factiva, and Orbis. We also contacted entrepreneurs directly to
obtain information on a confidential basis.
In total, 26 entrepreneurs (associated with a total of 19 firms) qualified for the
lowest success hurdle, amounting to a success rate of only 13%. Of these, 14 entrepre-
neurs were identified by the Development Office and 16 through the Rock Center survey
(for a total of 22). The three faculty members identified respectively 19, 25, and 22 of the
entrepreneurs. Given the high degree of overlap across these various sources, we are con-
fident we have captured the universe of successful post-MBAs in our sample.
After compiling this information on individual ventures, we again aggregate it on
the section level. We compute the share of the class who became entrepreneurs after
graduation, as well as those who became successful entrepreneurs, both for the entire
graduating class and only for those who were not entrepreneurs prior to graduation. The
latter is the dependent variable in our regression analyses.
Figure 2, Panel C, summarizes some key patterns of the outcomes data. (Because
we have placement data for virtually all students, we report the data here for all sections.)
Entrepreneurial activities vary over time, with the peak in entrepreneurial entry occurring
around 2000. More than 10% of the class began entrepreneurial ventures upon graduating
in 2000. The rate of successful entrepreneurship is low, even when using the lower ($5
million) hurdle for success. The temporal pattern of success is less pronounced, but, gen-
erally, the years that saw the greatest number of successful entrepreneurs were earlier.
III. Empirical Analysis

26
Our analysis proceeds in several steps. First, we perform several tests of stratification and
(conditional) randomization in section assignment. Then, we present our main result, the
analysis of peer effects on the rate of students becoming entrepreneurs, as well as differ-
ential peer effects on the rate of successful versus unsuccessful entrepreneurs. Finally, we
explore possible channels for entrepreneurial peer effects.
III.A. Test of Stratification and Randomization
We saw already that the distribution of pre-MBA entrepreneurs across sections appears to
be random (e.g., in Appendix Figure 1). We now test whether students without entrepre-
neurial background in sections with more (above median) and with fewer (below median)
pre-MBA entrepreneurs display significant differences in any of their characteristics.
The raw results for all 68 characteristics variables in our data are presented in Ap-
pendix Table A1. Out of all job-related characteristics (20 types of last job, 17 types of
job functions), demographics (gender, US citizenship, children, partner, age, ethnicity),
our risk score measure, and education (major, attendance of an Ivy League or Ivy League
Plus college), six are significantly different at the five-percent confidence level: sections
with more entrepreneurs are less likely to have students who worked in entertainment
(3.2% vs. 4.3%), who attended elite schools (22.7% vs. 25.2% for Ivy League and 32.7%
vs. 35.7% for Ivy League plus), who majored in history (2.9% vs. 4.2%), and who had a
function in human resources (0.2% vs. 0.4%) and are more likely to have students who
had a function in medical services (0.7% vs. 0.3%). Many of the differences, however,
are in categories with a very small number of positive respondents, and the differences
range only from 0.2 to 3.0 percent. Another ten variables differ at the ten-percent level.
We aim to control for these differences in our main analysis. Given that we have

27
sixty sections with at least seventy class cards, we cannot use all 68 characteristics (nor
even the 16 significant characteristics). In order to identify the most relevant variables,
we use two forward-selection procedures. First, we start with a number of variables that
are commonly viewed as being particularly influential in determining the propensity of
students to become entrepreneurs24
: having consulting, investment banking, and private
equity backgrounds, gender, nationality, the presence of partners and children, attendance
at an Ivy League or Ivy Plus college, risk appetite, and year of graduation. We then con-
duct a forward stepwise selection to identify which additional student characteristics have
significant explanatory power (at the 5% level) in predicting the share of pre-MBA entre-
preneurs in a section using a linear regression framework, controlling for year effects. As
shown in Table III, this leads to the identification of three additional independent varia-
bles—students having a background in agriculture and health care, and majoring in engi-
neering. Second, we use a forward step-wise approach, with only year dummies preset,
and include all additional variables significant at the 5% level. In this case, we identify
five variables in addition to the year dummies.
We use both sets of control variables, in addition to the time dummies, in our
analyses. We report the analyses with the first set of variables in the main tables. (All rep-
lications with the second set of independent variables are available from the authors.) In
all regressions, we also control for the ―share of students without an entrepreneurial
background who worked in a general management function‖ to ensure that our results do
not reflect negative sorting on this background category as discussed above.25
Finally, we
24
See, e.g., Evans and Leighton [1989] and Landier and Thesmar [2009]. 25
An alternative approach would have been to define all variables only for individuals with general man-
agement experience. We cannot implement the alternative specification since we do not have outcome vari-
ables by individual, or for the subset of individuals with general management experience.
28
add interactions between the independent variables as further controls. Given the stratifi-
cation procedure employed for the section assignment, we would ideally include all pos-
sible interactions between all stratification variables. Because of the modest number of
observations, this is not possible to implement. Instead, we include pairwise interactions
between the following significant explanatory variables: the share of section that is male,
that are U.S. citizens, with a partner, and with investment banking background.
III.B. Univariate Comparisons
We begin the analysis of entrepreneurial peer effects by plotting the basic relationship
between the representation of entrepreneurial students and the rates of post-MBA entre-
preneurship, both in total and separating out unsuccessful and successful entrepreneurs.
Panel A of Figure 3 relates the share of pre-MBA entrepreneurs to the share of post-MBA
entrepreneurs (without prior entrepreneurial experience).26
Sections with more pre-MBA
entrepreneurs have, on average, lower rates of post-MBA entrepreneurs. Moreover, these
sections have considerably less variation in the share of post-MBA entrepreneurs.
We then distinguish between unsuccessful and successful post-MBA entrepre-
neurs. We define the rate of unsuccessful entrepreneurship as the difference between the
rates of total and of successful entrepreneurship.27
Panel B reveals the same pattern for
the share of unsuccessful post-MBA entrepreneurs as in Panel A for all post-MBA entre-
preneurs. Meanwhile, the pattern for successful post-MBA entrepreneurs, in Panel C, is
less pronounced and relatively flat, with the exception of one section with a high number
26
This is calculated by subtracting out the number of pre-and-post-MBA entrepreneurs (the first of the two
possible corrective methodologies described in Section II). 27
While we believe that we identified a virtually comprehensive list of successful HBS entrepreneurs from
the classes in our sample, a similar approach is not feasible for unsuccessful entrepreneurs. Unsuccessful
ventures are much less visible after failure, and participants are often unwilling to disclose their failure
(e.g., in response to a survey request).

29
of successful entrepreneurs and a high pre-MBA entrepreneurship rate. Certainly, no sign
of a negative relationship, as identified in the other two panels, appears here.
Table IV examines the correlation coefficients between various characteristics of
the sections and the share of students without an entrepreneurial background who became
entrepreneurs after finishing the program. In Column 1, we see that sections with more
males, U.S. citizens, and students with children have higher rates of entrepreneurship.
(Again, all variables are computed using only students who were not pre-MBA entrepre-
neurs.) Both venture capital funding and IPO activity in the year of graduation are highly
correlated with post-MBA entrepreneurship. Most importantly, there is a significantly
negative relationship between the section share of pre-MBA entrepreneurs and the share
of those who were not prior entrepreneurs but began ventures after their MBA, consistent
with the pattern observed in Figure 3. This negative correlation provides another piece of
suggestive evidence speaking to our main research question.
Columns 2 and 3 reveal that this negative correlation is entirely driven by the
share of unsuccessful post-MBA entrepreneurs, again consistent with Figure 3: The cor-
relation with unsuccessful entrepreneurship is significantly negative, while the correlation
with successful entrepreneurship is insignificant (and has a positive sign). More general-
ly, the correlations with unsuccessful entrepreneurship in Column 2 mirror those of Col-
umn 1, while the correlations with successful entrepreneurship in Column 3 are much
weaker – the only significant correlates are having a partner and the risk aversion score
(negative correlation) and the measures of entrepreneurial finance activity (positive). One
reason for the lack of significance in the sample of successful entrepreneurs as well as for
the close resemblance of correlation coefficients in the full and in the unsuccessful sam-

30
ple is simply the small number of successful post-MBA entrepreneurs. If we compare the
fraction of successful entrepreneurs (among all post-not-pre entrepreneurs28
) in sections
with above and below-median numbers of pre-MBA entrepreneurs, 18.0% versus 7.5%,
the difference is not significant (p-value = 17.1%), but economically large.
III.C. Regression Analyses
We test whether the suggestive univariate patterns hold up in a controlled regression
framework. As before, the units of observation are section-years, and the main dependent
variable is the section share without prior entrepreneurial background who became entre-
preneurs after graduation, either overall or divided into successful and unsuccessful. As
derived in Section I.A, we control for the characteristics of these same students without
prior entrepreneurial experience, using the variables selected in Section III.A.
Table V presents the first main result, the analysis of entrepreneurial peer effects
on the propensity of their section-mates without entrepreneurial experience to become
entrepreneurs afterwards. Since the left-hand side variable is censored at zero, we first
estimate a Tobit specification. The Tobit specification does not allow us to employ year
dummy variables (the estimates do not converge), and we use the volume of venture fi-
nancing and IPOs as controls. Alternatively, we estimate OLS coefficients with the inclu-
sion of year dummies. In those specifications we can also add pairwise interactions be-
tween significant explanatory variables as additional controls, as discussed above. We
use the two methods discussed in Section II to correct the overall post-MBA entrepre-
neurship rate for prior entrepreneurial experience: In the first three columns, we subtract
the number of identified pre-and-post-MBA entrepreneurs; in the last three columns, we
28 The calculation of the success rate excludes sections with no post-MBA entrepreneurship.

31
subtract an average pre-and-post-MBA entrepreneurship rate of 30%.
All regressions confirm the pattern found in the raw data: The coefficient on the
share of the section with an entrepreneurial background is always significantly negative.
The effect is not only statistically significant, but also economically meaningful. Even
using the low coefficient estimate from the OLS regression in the second column, a one-
standard deviation increase in the pre-MBA entrepreneurship rate translates into a de-
crease of 26% in the predicted rate of entrepreneurship after business school: the share of
post-not-pre entrepreneurs drops by one percentage point (-0.35×0.029), from 3.9% to
2.9%. The second set of regressions suggests declines of even larger magnitudes.
In addition to our main result, we observe several interesting patterns. The share
of students with a private equity background is positive but insignificant (after the inclu-
sion of year dummies). The difference in sign, relative to the negative estimate for pre-
MBA entrepreneurs, may reflect that this category is dominated by buyout firms with lit-
tle exposure to young firms, rather than venture capitalists. We also see that the coeffi-
cient on the share of the section that is male is always positive and typically statistically
significant, while the share that has a partner is always negative and (at least marginally)
significant. The coefficient on the mean risk tolerance of the section is generally insignif-
icant. Finally, more entrepreneurial activity in the economy is associated with periods of
more venture activity. When we employ class dummies, those for 1999 and 2000 have
the greatest magnitude and significance.
We then distinguish between unsuccessful and successful entrepreneurs. Table VI
presents the same set of regression specifications as in the previous table but with differ-
ent dependent variables: the share of post-MBA entrepreneurs who were not previously

32
entrepreneurs and whose post-graduation ventures ultimately failed (in Panel A) or whose
ventures were successful (in Panel B). In Panel C, we test whether the peer effects esti-
mated for unsuccessful and for successful entrepreneurs in Panels A and B are the same.
The results for unsuccessful entrepreneurship (Panel A) are very similar to those
for overall entrepreneurship. The section share with prior entrepreneurial background is
significantly negatively associated with unsuccessful post-MBA entrepreneurship among
their peers. In fact, the coefficient estimates of all independent variables are quite similar
in terms of significance and size. As expected, given the high likelihood of failure, a re-
duction in unsuccessful ventures drives the overall negative peer effect.
The economic magnitude of the peer effect is somewhat larger for unsuccessful
entrepreneurs than in the baseline, given the smaller baseline. Using again the coefficient
estimate from the first OLS regression (column 2), a one-standard deviation increase in
the pre-MBA entrepreneurship rate translates into a decrease of 30%, namely, more than
one percentage point [-0.36×0.029] out of 3.5% unsuccessful post-not-pre entrepreneurs.
The results of the regressions explaining successful entrepreneurship (Panel B)
are rather different: The coefficient on the share of pre-MBA entrepreneurs are much
smaller and always positive, ranging from 0.02 to 0.16. They are never statistically sig-
nificant, nor are any of the other variables that are important in Table V consistently sig-
nificant. The goodness of fit is also considerably lower.
The lack of significance is not surprising, given the limited representation of suc-
cessful entrepreneurs (0.4% of all students without prior entrepreneurial experience) and
left-censoring. However, the consistently positive coefficient estimates point suggest the
possibility that entrepreneurial peers are less discouraging, or even encouraging, when

33
confronted with promising, and hence ultimately successful business ideas.
We perform two tests to explore this possibility. First, we test whether the peer ef-
fects estimated for unsuccessful and for successful entrepreneurship in Panels A and B
are the same. We employ the standard econometric approach: We estimate a pooled re-
gression on observations from both regressions and then examine the significance of the
interaction between the pre-MBA entrepreneur share and the dummy variable denoting
successful outcomes. This amounts to performing a t-test of the null hypothesis that the
coefficients on the pre-MBA entrepreneurial share variable are not different in the suc-
cessful and unsuccessful entrepreneurship regressions. We also undertake an F-test com-
paring all coefficients in the two regressions.
As shown in Panel C, the null hypothesis of no difference is always rejected at the
one-percent confidence level. Thus, peers with entrepreneurial experience tend to deter
students without an entrepreneurial background from undertaking unsuccessful ventures,
but their influence on would-be successful entrepreneurs is significantly more positive.
We perform a second test to ensure that the significant difference estimated in
Panel C is not merely a reflection of the lower (absolute) rate of successful entrepreneurs.
That is, a potential concern is that the magnitude of a hypothetical negative peer effect on
successful ventures is limited because the rate of successful ventures cannot fall below
zero. For example, if the shares of both successful and unsuccessful ventures were to
drop by the same percentage in response to peer interaction, we might still estimate a pos-
itive interaction coefficient given the higher baseline rate of unsuccessful ventures.
To address this concern, we repeat the analysis in Table V using as a dependent
variable the ratio of the number of failed to the number of total ventures. If the insignifi-

34
cantly positive coefficient estimated for successful entrepreneurs concealed a negative
effect identical to the one on unsuccessful would-be entrepreneurs, then peers should
have no effect on the ratio. If the effect is significantly more positive for successful
would-be entrepreneurs, the coefficient estimate should be negative. We deal with the
cases of ―no new ventures‖ in a section (zero denominator) in several alternative ways:
dropping those observations; coding those ratios as ―zero‖; adding a small number to
both the numerator and denominator in all observations. We re-estimate all six regression
models of Table V with each approach. We find that the coefficient on the number of pre-
MBA entrepreneurs is negative in all cases: the peer effect is more negative on unsuc-
cessful ventures. Since both the counts of unsuccessful and total ventures are likely to be
noisily measured, it might be anticipated that the ratio would be particularly noisy. None-
theless, the coefficient is significant at conventional significance levels in the majority of
cases. For example, when we calculate the ratio dropping cases of zero ventures and
when we calculate the ratio coding cases of zero ventures as zero, the coefficient estimate
is significant in nine out of twelve cases (marginally significant in the other cases).
Taken together, our results imply that experienced peers are serving a positive
role in disproportionately weeding out bad ventures.
We perform a number of robustness checks. First we test whether our results are
robust to employing higher thresholds for ―success.‖ As discussed above, we chose the
$5 million threshold for ―success‖ in order to guarantee equity worth about $1 million or
more per founder. In some cases, this cut-off may be too low. For example, Guru.com, an
online marketplace for freelance talent in our sample, was sold for approximately $5 mil-
lion to rival Unicru in 2002. Given that Guru.com raised over $62 million in venture

35
capital financing in 1999 and 2000, it is doubtful whether the parties involved regarded
this as a success.29
To address this concern, we use $25 million and $100 million as alter-
native cutoffs, which we term ―very successful‖ and ―super-successful‖ respectively.
Columns 1 through 4 of Table VII show results akin to those in the specifications
of Column 2 of Table VI, Panels A and B. The coefficient estimates closely resemble
those using our original success measure, not only in terms of sign and significance but
also in terms of economic magnitude. Moreover, the coefficients on the share of pre-
MBA entrepreneurs in the regressions predicting unsuccessful versus successful post-
MBA entrepreneurship (i.e., ―not very successful‖ versus ―very successful,‖ and ―not su-
per-successful‖ versus ―super-successful‖) are significantly different at the one-percent
confidence level in both cases.
Another robustness check addresses the concerns that, as revealed in Figure 2.C,
the class of 2000 had an extraordinary high post-MBA entrepreneurship rate and might
explain all of our results. We reran the regressions without the observations from the
class of 2000. The results were little changed.
We also repeat the analyses in Tables V and VII, adding additional control varia-
bles suggested by the literature on the determinants of entrepreneurship, in particular,
Eesley, et al. [2007] and Evans and Leighton [1989]. For instance the results were robust
when we added, among other variables: section share (excluding prior entrepreneurs) that
is white; section share (excluding prior entrepreneurs) that is Asian; section share (ex-
cluding prior entrepreneurs) that is Hispanic; section share (excluding prior entrepre-
neurs) that are races other than white, black, Asian, and Hispanic; section share (exclud-
29
The information on Guru.com was obtained from http://www.venturexpert.com (accessed September 16,
2011), Factiva, and other on-line sources.

36
ing prior entrepreneurs) that is aged 30 or over at matriculation; section share (excluding
prior entrepreneurs) with a college major in natural science; section share (excluding pri-
or entrepreneurs) with a college major in medical science; section share (excluding prior
entrepreneurs) with a college major in computer science.
Finally, the reported analyses focus on the 60 sections with at least 70 class cards.
As additional robustness checks, we repeat the analyses using only sections with a mini-
mum of 75 or 80 class cards (a total of 57 and 40 sections respectively). When we repro-
duce the analyses in Tables V and VI using these higher cut-off points, the results are
generally robust, despite the smaller sample sizes. Hence, the results are not a conse-
quence of any assumptions regarding missing observations.
III.D. Interpretation
As noted in the introduction, we can offer a variety of explanations for the observed intra-
section learning. A first possible channel is direct interaction of pre-MBA entrepreneurs
with aspiring entrepreneurs in their section and their counsel about what constitutes a
good business idea. As argued by the alumni and students we interviewed, students who
were entrepreneurs prior to business school play a critical if informal knowledge dissem-
ination role: would-be entrepreneurs approach these individuals and receive help evaluat-
ing their potential business plans and understanding their strengths and weaknesses.
While others in the section may have the same analytical skills, the personal experience
of prior entrepreneurs gives them a credibility others do not have.
A second interpretation is that the mere presence of former entrepreneurs and
their reports about their prior entrepreneurial ventures discourage all but the best ―would-
be entrepreneurs.‖ Aspiring entrepreneurs with less promising ideas abandon or at least

37
postpone their plans to start a company, even without direct interaction and specific
counsel. This explanation is particularly plausible if the entrepreneurial peers had nega-
tive experiences, given that we estimated the peer effect to be significantly negative.
A third interpretation is that entrepreneurs do not affect other students directly,
but raise interest in entrepreneurship and induce their section-mates to take additional en-
trepreneurship classes as electives, which may help them to subsequently make better de-
cisions about pursuing new ventures.
The third hypothesis is directly testable. We use our additional data on enrollment
in elective entrepreneurship classes to test whether there is a positive relationship with
the presence of prior entrepreneurs in a section. We employ the share of classes under the
sponsorship of the Entrepreneurial Management unit that students without entrepreneurial
background took in their second year as the new outcome variable, and repeat the prior
regression analyses. Column 5 of Table VII displays the regression specification that mir-
rors Column 2 of Table V. With the exception of two significant time dummies (the clas-
ses of 2000 and 2001 had the greatest enrollment in entrepreneurship classes), none of the
coefficient estimates are significant at the five-percent confidence level, and only the co-
efficient estimate for gender is marginally significant but varies depending on the regres-
sion specification. Most importantly, the impact of peers with an entrepreneurial back-
ground is very small and never significant.30
Hence, we find no support for the explana-
tion that entrepreneurial peers induce others to take entrepreneurship classes.
It is harder to distinguish between the remaining two explanations, ―direct coun-
sel‖ (channel 1) and ―mere presence‖ (channel 2), though the finding on enrollment in
30
Because the number of electives shifted over time, and the number of sections with seventy or more class
cards is not evenly distributed, we repeated these analyses for all sections and for the set of the sections
with forty or more class cards. We use weighted and unweighted data. The results are the same.

38
entrepreneurship classes points towards channel 1: If the mere presence of entrepreneuri-
al peers discourages start-up activities, we might also expect it to dampen interest in en-
trepreneurship classes, and hence a negative coefficient.
Relatedly, the second interpretation would be more plausible if pre-MBA entre-
preneurs tended to be failed entrepreneurs, whose previous experiences diminish the en-
thusiasm of their peers about entrepreneurship. However, as we saw already, pre-MBA
entrepreneurs in our sample have been quite successful, with some even having sold
companies for tens of millions of dollars.
Still, it is possible that prior entrepreneurial experiences color the influence that
pre-MBA entrepreneurs exert on the entrepreneurial ambitions of their peers: A success-
ful entrepreneur may be more encouraging, and a failed entrepreneur may be more dis-
couraging. We test the latter hypothesis using our hand-collected data on the outcomes of
prior ventures of MBA students. In Table VIII, we present the same regression specifica-
tions as in Table VI, but split the share of pre-MBA entrepreneurs into those who were
successful and those who failed (total rate minus successful rate).
For unsuccessful post-MBA entrepreneurs, we find a negative peer effect both of
successful prior entrepreneurs and of unsuccessful prior entrepreneurs (Panel A). Both
coefficients are similar in magnitude to our previous estimations, though estimated less
precisely. (The loss of significance is not surprisingly given that we are splitting the al-
ready small number of pre-MBA entrepreneurs into two groups.) Only the Tobit specifi-
cation suggests a stronger peer effect of unsuccessful entrepreneurs, but the differences in
coefficients are insignificant in all cases.
Panel B shows the effect on successful entrepreneurs. As in Table VI.B, the good-

39
ness of fit is considerably lower, and only two out of the twelve coefficients of interest
are even marginally significant. Directionally, the peer effect of successful pre-MBA en-
trepreneurs is always positive while the effect of failed pre-MBA entrepreneurs is either
negative or very close to zero. The differences are never significant.
Overall, we have at best very weak evidence that the specific prior experience of
entrepreneurial peers is central in explaining our results. Again, it is possible that the lack
of significant results reflects the lack of power.
As a final piece of evidence, we examine the variance, rather than the mean rate
of entrepreneurship. If intra-section learning relies on direct interaction, then the effect
will be noisier when there are few pre-MBA entrepreneurs present and, hence, interaction
and productive feedback are less likely. With a large number of entrepreneurs, instead,
one of them will be critical and experienced enough to detect the ―flaw‖ in a business
plan. Hence, sections with fewer pre-MBA entrepreneurs should display greater variance
in their post-MBA entrepreneurship rates, particularly for unsuccessful entrepreneurs.
Table IX reports the variance in post-MBA entrepreneurship, separately for sec-
tions with below-median and above-median shares of pre-MBA entrepreneurs. We find
that sections with more prior entrepreneurs have 44% less variance in the overall entre-
preneurship rate, a pattern entirely driven by unsuccessful entrepreneurs. However, at
least part of the reduction in variance may be mechanistic, due to the reduced likelihood
of becoming entrepreneur when many pre-MBA entrepreneurs are present. To alleviate
this concern, we repeat the analysis restricted to sections with a minimum number of stu-
dents becoming entrepreneur: at least three, five, or seven. In all cases, the results are di-
rectionally similar: the variance in the rate of unsuccessful (and overall) post-MBA en-

40
trepreneurship is always higher in sections with below-median numbers of experienced
entrepreneurs than in section with above median numbers, and the reverse holds for the
rate of successful post-MBA entrepreneurship. Most of the differences in variance be-
come insignificant, likely due to the small sample size when we impose the double-
restriction of a minimum number of class cards (70+) and of a minimum number of post-
MBA entrepreneurs. The results are significant when we only use the restriction of at
least three, five, or seven post-MBA entrepreneurs, regardless of the class-card count.
The robust (and non-mechanistic) reduction in variance is another piece of sug-
gestive evidence, pointing to the role of direct interaction with entrepreneurial peers.
IV. Conclusions
This paper tests how social interactions with peers affect an individual’s decision to be-
come an entrepreneur and, hence, the aggregate returns to entrepreneurship. We examine
the decision to become entrepreneur among recent graduates of the Harvard MBA pro-
gram. This setting is empirically attractive due to the exogenous assignment of students
to sections, the ability to distinguish success and failure in terms of firm outcomes, and
the potentially high economic impact of these ventures.
We find that a higher share of former entrepreneurs in a given section reduces en-
trepreneurship rates among students without an entrepreneurial background. This effect is
driven by a significantly lower rate of (ultimately) unsuccessful entrepreneurs. The influ-
ence on (ultimately) successful post-MBA entrepreneurs, instead, is indistinguishable
from zero, and significantly more positive than the effect on unsuccessful entrepreneur-
ship. Whether former entrepreneurs were successful or unsuccessful themselves has, at
best, a weak directional effect. Our results are consistent with intra-section learning,

41
where the close ties between students in a section lead to an enhanced understanding of
the merits of proposed business ideas.
Our analysis of peer effects in entrepreneurship is relevant to policy-makers,
business school faculty, and administrators, given the emphasis they are placing on the
promotion of entrepreneurship. During the 1990s and early 2000s, for example, U.S.
business schools created over 300 endowed chairs in entrepreneurship, typically paying
salaries significantly above those in other business disciplines (Katz [2004]). Hundreds of
business plan contests were launched during these years, and entrepreneurial activities
often benefitted from public subsidies. The results of this paper suggest a slight redirec-
tion in educational and policy initiatives. Much of the benefit from exposure to entrepre-
neurship appears not to come from encouragement of more entrepreneurship, but from
help in weeding out ventures that are likely to fail. Rather than attracting more people
into entrepreneurship, schools and policy-makers may want to provide support to would-
be entrepreneurs in critically evaluating their most promising business ideas.
We see two avenues for future research. First, this paper suggests a richer role for
peer effects in entrepreneurship. Most prior studies have implicitly assumed a ―contagion
effect,‖ where the decision of one individual to begin a firm leads others to do so like-
wise. Our analysis suggests that the mechanism is more complex: feedback of experi-
enced entrepreneurs may encourage or discourage would-be entrepreneurs. Uncovering
the exact channels of interaction would be worthwhile – also beyond the business school
setting, e.g., for the design of business incubators.
A second avenue for future research is exploiting section assignments at HBS for
phenomena other than entrepreneurship. Shue’s [2011] analysis of executive compensa-

42
tion and acquisition strategies of companies headed by HBS graduates represents one
such analysis, and points to the breadth of research topic possible with these data. The
differing educational, national, religious, and experiential mixtures of the various sections
should make this a fertile testing ground for a variety of network and peer effects.

43
References
American Sports Data, 2005, A Comprehensive Study of Sports Injuries in the U.S.,
Cortlandt Manor, NY, American Sports Data.
Arabsheibani, Gholamreza, David de Meza, John Maloney, and Bernard Pearson, 2000,
And a vision appeared unto them of a great profit: Evidence of self-deception among the
unemployed, Economic Letters 67, 35-41.
Baruch, Yehuda, 1999, Response Rates in Academic Studies—A Comparative Analysis,
Berlin, Springer Science+Business Media.
Bernardo, Antonio, and Ivo Welch, 2001, On the evolution of overconfidence and entre-
preneurship, Journal of Economics & Management Strategy 10, 301-30.
Bhide, Amar, 2000. The Origins and Evolution of New Businesses, New York, Oxford.
Brav, Alon and Paul Gompers, 1997, Myth or reality? The long-run underperformance of
initial public offerings: Evidence from venture and nonventure capital-backed companies,
Journal of Finance 52, 1791-1821.
Broughton, Philip, D., 2008, Ahead of the Curve: Two Years at Harvard Business School,
New York, Penguin.

44
Camerer, Colin, and Dan Lovallo, 1999, Overconfidence and excess entry: An experi-
mental approach, American Economic Review 89, 306-318.
Cohen, Lauren, Andrea Frazzini, and Christopher J. Malloy, 2008, The small world of
investing: Board connections and mutual fund returns. Journal of Political Economy 116,
951-979.
Cohen, Lauren, Andrea Frazzini and Christopher Malloy, 2010, Sell-side school ties,
Journal of Finance 65, 1409-1437.
Cruikshank, Jeffrey L., 2005, Shaping the Waves: A History of Entrepreneurship at Har-
vard Business School, Boston, Harvard Business School Publishing.
Davis, Steven J., John C. Haltiwanger, and Scott Schuh, Job Creation and Destruction,
Cambridge, MIT Press.
De Meza, David, and Clive Southey, 1996, The borrower’s curse: Optimism, finance, and
entrepreneurship, Economic Journal 106, 375-386.
Djankov, Simeon, Rafael La Porta, Florencio Lopez-de-Silanes, and Andrei Shleifer,
2002, The regulation of entry, Quarterly Journal of Economics 117, 1-37.

45
Duflo, Esther, and Emmanuel Saez, 2002, Participation and investment decisions in a re-
tirement plan: The influence of colleagues' choices, Journal of Public Economics 85,
121-148.
Duflo, Esther, and Emmanuel Saez, 2003. The role of information and social interactions
in retirement plan decisions: Evidence from a randomized experiment, Quarterly Journal
of Economics 118, 815-842.
Eesley, Charles, David Hsu, and Edward Roberts, 2007, Entrepreneurs from technology-
based universities: Evidence from MIT, Research Policy 36, 768-788.
Evans, David S., and Linda S. Leighton, 1989, Some empirical aspects of entrepreneur-
ship, American Economic Review 79, 519-535.
Ewing, David W., 1990, Inside Harvard Business School: Strategies and Lessons of
America’s Leading School of Business, New York, Times Books.
Giannetti, Mariassunta, and Andrei Simonov, 2009, Social interactions and entrepreneur-
ial activity, Journal of Economics and Management Strategy, 18, 665-709.
Gompers, Paul A., Anna Kovner, Josh Lerner, and David Scharfstein, 2007, Performance
persistence in entrepreneurship, Journal of Financial Economics, 62 (2007), 731-764.

46
Gompers, Paul A., Anna Kovner, Josh Lerner, and David Scharfstein, 2008, Venture cap-
ital investment cycles: The impact of public markets, Journal of Financial Economics,
87, 1-23.
Gompers, Paul A., Josh Lerner, and David Scharfstein, 2005, Entrepreneurial spawning:
Public corporations and the genesis of new ventures, 1986 to 1999, Journal of Finance,
60, 577-614.
Hall, Robert E., and Susan E. Woodward, 2010, ―The Burden of the Nondiversifiable
Risk of Entrepreneurship,‖ American Economic Review, 100 (June 2010) 1163–1194.
Hurst, Erik K., and Benjamin W. Pugsley, 2012, ―What Do Small Businesses Do?,‖ Brook-
ings Papers on Economic Activity, forthcoming.
Jovanovic, Boyan, 1982, Selection and the evolution of industry, Econometrica 50, 649-
670.
Kanniainen, Vesa, and Christian Keuschnigg, 2004, Venture Capital, Entrepreneurship,
and Public Policy, Cambridge, Massachusetts, MIT Press.
Kaplan, Steven and Antoinette Schoar, 2005, Private equity performance: Returns, persis-
tence, and capital flows, Journal of Finance 60, 1791-1823.

47
Katz, Jerome A., 2004, Survey of Endowed Positions in Entrepreneurship and Related
Fields in the United States, St Louis, Missouri, J. A. Katz and Associates.
Kerr, William, Josh Lerner and Antoinette Schoar, forthcoming, The consequences of
entrepreneurial finance: evidence from angel financings, Review of Financial Studies.
Korteweg, Arthur and Morten Sorensen, 2010, Risk and return characteristics of venture
capital-backed entrepreneurial companies, Review of Financial Studies 23, 3738-3772.
Kremer, Michael and Dan Levy, 2008, Peer effects and alcohol use among college stu-
dents, Journal of Economic Perspectives 22 (Summer), 189-206.
Landier, Augustin, and David Thesmar, 2009, Financial contracting with optimistic en-
trepreneurs: Theory and evidence, Review of Financial Studies 22,117-150.
Lazear, Edward P., 2005, Entrepreneurship, Journal of Labor Economics 23, 649-680.
Manski, Charles F., 1993, Identification of Endogenous Social Effects: The Reflection
Problem, Review of Economic Studies 60, 531–542.
Nanda, Ramana, and Jesper Sorensen, 2010, Workplace peer effects and entrepreneur-
ship, Management Science 56, 1116-1126.

48
National Venture Capital Association, 2005, 2005 Venture Capital Yearbook, Newark,
New Jersey, Venture Economics.
Orth, Charles D., III, 1963, Social Structure and Learning Climate: The First Year at the
Harvard Business School, Boston, Division of Research, Graduate School of Business
Administration, Harvard University.
Parker, Simon C., 2004, The Economics of Self-Employment and Entrepreneurship, New
York, Cambridge University Press.
Phalippou, Ludovic and Oliver Gottschalg, 2009, The performance of private equity
funds, Review of Financial Studies 22, 1747-1776.
Ritter, Jay, 1991, The long-run performance of initial public offerings, Journal of Fi-
nance 46, 3-27.
Sacerdote, Bruce, 2001, Peer effects with random assignment: Results for Dartmouth
roommates, Quarterly Journal of Economics 116, 681-704.
Shue, Kelly, 2011, Executive networks and firm policies: Evidence from the random as-
signment of MBA peers, Unpublished working paper, Harvard University.

49
Appendix: The HBS Section System
Our paper exploits the section system of Harvard Business School to address several
challenges to identification present in previous literature. The key feature is the exoge-
nous assignment into sections discussed in the paper. Another advantage of the empirical
setting is that section-mates form extremely close ties, and are a setting where peer ef-
fects—if they are empirically observable at all—would likely be seen.
The social ties established in the first year appear to remain extremely strong,
even after the second-year, when student take elective classes together with the entire
student body, and long after graduation. We provide two examples of the numerous jour-
nalistic accounts and academic studies analyzing the social experience engendered by
HBS sections. First, in his account of Harvard Business School life, Ewing [1990] ob-
serves:
If the Harvard Business School has a secret power, it is the section system.
A first-year section has a life of its own, bigger than any student, more
powerful than any instructor… All first-year instructors I know agree
about the awesome power of the section. They may not like the way it
works in all cases—who does—yet it drives B-school students to learn, in-
fluencing them in countless ways.
Similarly, in a field-based analysis of the first-year HBS experience, Orth [1963]
highlights that section-mates, ―in order to insure feelings of safety and, if possible com-
petence in a situation that is initially perceived to them to be threatening,‖ adopt ―norms‖
that affect study patterns, social interactions, and even choices regarding employers with

50
which to interview. He notes that ―some norms appeared to be common to all first-year
sections and others appeared to develop as a result of a particular section’s pattern of ad-
aptation to the conflicts and pressures of the first year.‖

1997 1998 1999 2000 2001 2002 2003 2004
MBA Enrollment 898 913 903 880 865 917 898 898
MBA Applications 6,973 8,053 7,496 8,061 8,476 8,124 8,893 10,382
Profile
Female 27% 24% 29% 30% 31% 33% 36% 35%
Minorities 19% 18% 18% 19% 18% 20% 21% 25%
International 24% 25% 26% 26% 35% 32% 33% 32%
Undergraduate Majors
Humanities & Social Science 50% 46% 47% 42% 41% 41% 45% 40%
Engineering & Sciences 22% 26% 29% 34% 31% 31% 30% 32%
Business Administration 24% 25% 20% 21% 24% 24% 20% 20%
Other 5% 3% 4% 3% 4% 4% 5% 8%
Average Section Size 90 83 82 80 79 83 82 90
IPOs in Graduation Year
Number of IPOs 432 267 457 346 76 67 62 179
Aggregate Proceeds ($ billion) 29 32 63 61 34 22 10 32
Aggregate Sum Left-on-Table ($ billion) 4 5 36 27 3 1 1 4
Venture Financing in Graduation Year
First-Round Financing ($ million) 4,844 7,199 16,201 28,979 7,512 4,452 3,577 4,438
Total Financing ($ million) 14,897 21,270 54,480 105,832 40,943 21,615 18,924 20,993
Table I. Background Variables
Class of …
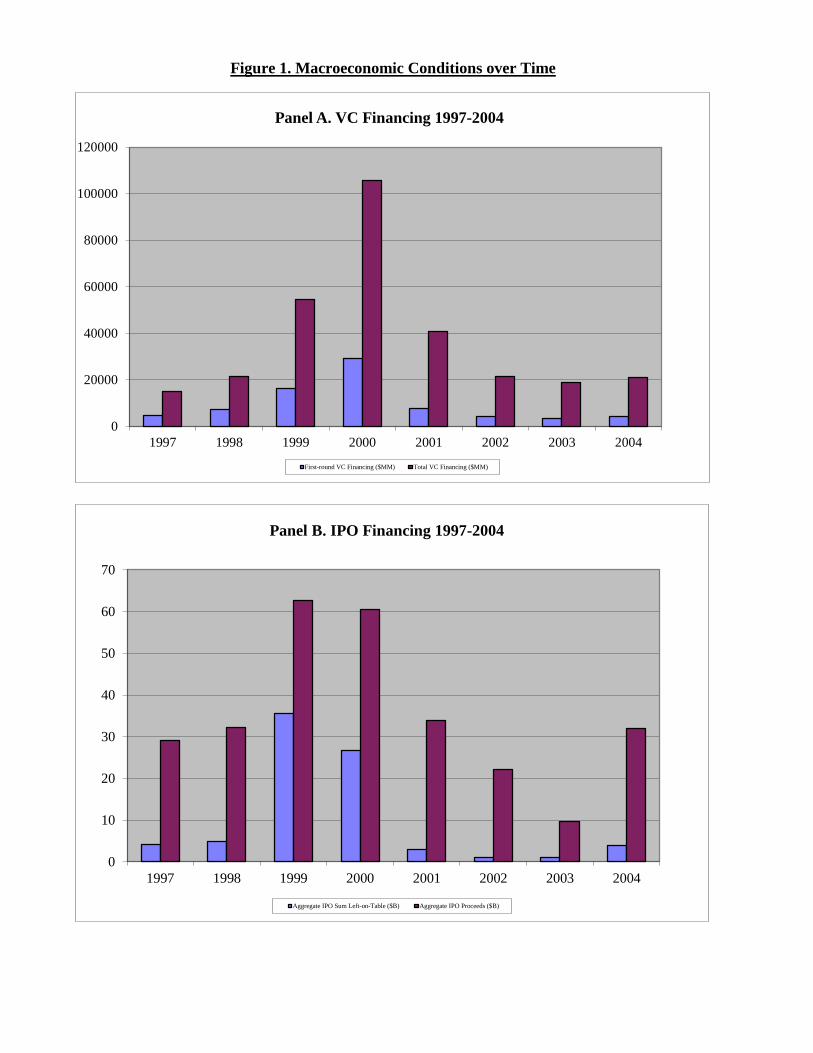
Figure 1. Macroeconomic Conditions over Time
0
20000
40000
60000
80000
100000
120000
1997 1998 1999 2000 2001 2002 2003 2004
Panel A. VC Financing 1997-2004
First-round VC Financing ($MM) Total VC Financing ($MM)
0
10
20
30
40
50
60
70
1997 1998 1999 2000 2001 2002 2003 2004
Panel B. IPO Financing 1997-2004
Aggregate IPO Sum Left-on-Table ($B) Aggregate IPO Proceeds ($B)

Panel A. Full Sample (86 sections)Mean Median St. Dev.
10th
Percentile
90th
Percentile
Share of section that worked
… as an entrepreneur 5.0% 4.7% 3.4% 0.0% 9.8%
… in consulting 22.9% 23.5% 5.3% 16.3% 29.0%
… in investment banking 19.3% 19.0% 5.7% 12.8% 25.0%
… in private equity 4.7% 4.2% 3.0% 1.1% 8.9%
… in agricultural business 2.4% 2.6% 1.9% 0.0% 4.2%
… in health care 3.2% 2.7% 2.3% 0.0% 5.4%
… in hardware manufacturing 1.3% 1.2% 1.5% 0.0% 3.2%
… in general management 15.6% 15.1% 4.7% 10.0% 20.7%
Share of section that is male 69.4% 67.9% 7.1% 62.8% 82.5%
… has USA citizenship 66.9% 65.8% 6.7% 59.0% 76.9%
… has children 4.9% 4.6% 3.2% 1.3% 9.1%
… has a partner 41.3% 42.1% 7.4% 31.6% 50.6%
Share of section older than 30 6.1% 5.8% 3.8% 1.3% 10.7%
Average maximum risk score 38.4% 38.9% 3.2% 34.4% 42.2%
Share of section having attended an Ivy League college 24.2% 24.1% 5.5% 18.1% 31.8%
Share of section having attended an Ivy Plus college 34.4% 34.4% 6.5% 25.3% 42.7%
Share of section with an Engineering major in college 22.6% 22.6% 5.7% 15.9% 29.4%
Share of post-MBA entrepreneurs 4.5% 4.2% 3.5% 0.0% 7.9%
Share of successful post-MBA entrepreneurs 0.6% 0.0% 1.0% 0.0% 1.4%
Share of post- but not pre-MBA entrepreneurs 3.7% 2.9% 3.7% 0.0% 8.4%
Share of successful post-but not pre-MBA entrepreneurs 0.6% 0.0% 1.0% 0.0% 1.5%
Panel B. Sections with at least 70 class cards (60
sections) Mean Median St. Dev.
10th
Percentile
90th
Percentile
Share of section that worked
… as an entrepreneur 4.8% 4.6% 2.9% 1.3% 8.6%
… in consulting 24.2% 24.0% 4.0% 19.6% 28.8%
… in investment banking 18.7% 18.7% 3.7% 14.1% 22.6%
… in private equity 5.1% 4.6% 3.1% 1.3% 9.4%
… in agricultural business 2.7% 2.6% 1.6% 1.2% 4.1%
… in health care 3.3% 3.3% 1.6% 1.2% 5.3%
… in hardware manufacturing 1.0% 1.2% 1.0% 0.0% 2.4%
… in general management 14.8% 14.5% 3.7% 9.7% 19.9%
Share of section that is male 66.5% 66.2% 3.2% 62.7% 70.6%
… has USA citizenship 65.3% 64.5% 5.6% 58.8% 71.8%
… has children 4.6% 4.1% 2.9% 1.4% 9.0%
… has a partner 42.6% 43.0% 7.1% 33.7% 51.7%
Share of section older than 30 5.0% 4.9% 2.5% 1.3% 8.2%
Average maximum risk score 38.8% 39.3% 2.8% 35.4% 42.1%
Share of section having attended an Ivy League college 24.0% 24.1% 4.1% 19.4% 29.1%
Share of section having attended an Ivy Plus college 34.7% 34.3% 5.5% 27.4% 42.2%
Share of section with an Engineering major in college 22.2% 22.3% 4.5% 16.2% 28.2%
Share of post-MBA entrepreneurs 4.8% 4.2% 3.8% 0.0% 10.2%
Share of successful post-MBA entrepreneurs 0.4% 0.0% 0.7% 0.0% 1.4%
Share of post- but not pre-MBA entrepreneurs 3.9% 2.8% 4.1% 0.0% 10.6%
Share of successful post-but not pre-MBA entrepreneurs 0.4% 0.0% 0.8% 0.0% 1.4%
Notes. The sample contains the classes of 1997-2004.
Table II. Section Characteristics

Figure 2. Variation in Entrepreneurial Activity
Panel A. Pre-MBA Entrepreneurship Across Sections
Panel B. Pre-MBA Entrepreneurship Over Time
Panel C. Post-MBA Entrepreneurship
Notes. The left graph shows the histogram of the fraction of students (in percent) with entrepreneurship experience
prior to entering the MBA program (relative to section size). The right graph shows the histogram of the number of
entrepreneurs normalized by the number of class cards available for the section, divided by the average rate in the
same year across sections. The sample contains the 60 sections with 70 or more available class cards.
Notes. The graph shows rates of students with entrepreneurship experience prior to entering the MBA program.
The sample contains the 60 sections with 70 or more available class cards.
Notes. The graph shows the rate of post-HBS entrepreneurship and the rate of successful post-HBS
entrepreneurship for all graduates of the MBA program (two leftmost bars in each year) and the same two rates for
students who were not entrepreneurs prior to entering the MBA program (two rightmost bars in each year).
0%
2%
4%
6%
8%
10%
12%
1997 1998 1999 2000 2001 2002 2003 2004
Number of pre-HBS entrepreneurs Year-adjusted rate of pre-HBS entrepreneurs
0
2
4
6
8
10
12
0% 2% 4% 6% 8% 10% 12%
0
2
4
6
8
10
12
14
0% 50% 100% 150% 200% 250%

Baseline Alternative
Share that worked pre-MBA in consulting -0.11 -0.11
[0.08] [0.05]**
… in investment banking 0.02
[0.07]
… in private equity -0.17
[0.14]
… in agricultural business -0.59 -0.54
[0.16]*** [0.15]***
… in health care 0.39 0.45
[0.13]*** [0.11]***
… in hardware manufacturing 0.36
[0.16]**
… in telecommunications -0.20
[0.10]**
Share that is male 0.19
[0.08]**
… has US citizenship -0.02
[0.07]
… has children -0.11
[0.12]
… has a partner 0.07
[0.07]
Share older than 30 0.25
[0.09]***
Average maximum risk score 0.08
[0.13]
Share that attended an Ivy League college -0.1
[0.12]
Share that attended an Ivy Plus college -0.04
[0.10]
Share that majored in Engineering in college -0.18
[0.07]**
Year fixed effects yes yes
Observations 60 60
R-squared 0.46 0.47
F-test (excluding year effects) 4.10 (0.00, 13) 11.63 (0.00, 7)
Table III. Predicting the Share of Pre-MBA Entrepreneurs
Notes. All section-level measures include pre-MBA entrepreneurs. The additional
controls (and alternative sets of additional controls) are discussed in the text. We
report the F -statistic for the joint significance of all control variables excluding year
effects (and, in parentheses, the p -value and the number of constraints). Robust
standard errors in brackets.

Figure 3. Relationship between Pre- and Post-MBA Entrepreneurship
Panel A. All Post-MBA Entrepreneurs
Panel B. Unsuccessful Post-MBA Entrepreneurs Panel C. Successful Post-MBA Entrepreneurs
Notes. In all three panels, the sample consists of all sections with at least 70 class cards.

Share of post-MBA
entrepreneurs
Share of
unsuccessful post-
MBA entrepreneurs
Share of successful
post-MBA
entrepreneurs
Share of post-MBA entrepreneurs 1.00
Share of successful post-MBA entrepreneurs 0.17 1.00
(0.20)
Share of unsuccessful post-MBA entrepreneurs 0.95 1.00 0.03
(0.00) (0.82)
Share that worked pre-MBA
… as an entrepreneur -0.33 -0.24 0.12
(0.01) (0.07) (0.35)
… in consulting -0.13 -0.14 -0.06
(0.33) (0.30) (0.63)
… in investment banking -0.13 -0.11 -0.14
(0.32) (0.40) (0.30)
… in private equity -0.08 -0.12 -0.02
(0.56) (0.37) (0.89)
… in agricultural business 0.33 0.35 0.06
(0.01) (0.01) (0.67)
… in health service 0.24 0.31 0.03
(0.07) (0.02) (0.80)
… in general management -0.01 0.00 -0.05
(0.93) (0.70) (0.98)
Share that is male 0.25 0.21 0.11
(0.06) (0.11) (0.43)
… has USA citizenship -0.13 -0.22 -0.06
(0.33) (0.09) (0.64)
… has children -0.04 -0.06 0.14
(0.76) (0.65) (0.27)
… has a partner -0.04 -0.04 -0.26
(0.76) (0.75) (0.05)
Average maximum risk score -0.06 -0.07 -0.25
(0.63) (0.60) (0.06)
Share that attended an Ivy League college -0.21 -0.25 -0.06
(0.12) (0.06) (0.65)
Share that attended an Ivy Plus college 0.14 0.17 0.08
(0.28) (0.18) (0.52)
Share that majored in Engineering in college 0.04 0.05 -0.06
(0.79) (0.72) (0.65)
IPO proceeds in graduation year ($ trillion) 0.57 0.56 0.20
(0.00) (0.00) (0.12)
Total venture funding in graduation year ($ trillion) 0.70 0.69 0.21
(0.00) (0.00) (0.10)
Table IV. Correlation Coefficients
Notes. The sample includes all sections with at least 70 class cards. All section-level measures (except the share that
worked pre-MBA as an entrepreneur) exclude pre-MBA entrepreneurs. P -values in parentheses.

Share of section with entrepreneurial background -0.46 -0.35 -0.36 -0.54 -0.43 -0.45
[0.13]*** [0.11]*** [0.11]*** [0.12]*** [0.12]*** [0.10]***
Share of non-entrepreneurs with consulting background -0.11 -0.08 -0.1 -0.04 -0.08 -0.06
[0.10] [0.09] [0.10] [0.09] [0.07] [0.08]
... with investment banking background -0.05 -0.18 0.02 -0.04 -0.16 0.04
[0.09] [0.09]* [0.19] [0.09] [0.09]* [0.17]
... with private-equity background 0.29 0.05 0.03 0.25 0.03 0.03
[0.14]** [0.16] [0.15] [0.11]** [0.13] [0.12]
... with agricultural-business background -0.36 -0.54 -0.49 -0.35 -0.54 -0.5
[0.26] [0.29]* [0.32] [0.21] [0.23]** [0.24]**
... with health-care background 0.58 0.56 0.56 0.54 0.53 0.55
[0.28]** [0.26]** [0.30]* [0.25]** [0.20]** [0.23]**
... with general management background 0.08 0.01 0.04 0.08 -0.02 -0.03
[0.10] [0.10] [0.10] [0.08] [0.03] [0.03]
Share of non-entrepreneurs that are male 0.53 0.81 0.84 0.47 0.76 0.82
[0.12]*** [0.21]*** [0.26]*** [0.11]*** [0.18]*** [0.20]***
... that are U.S. citizens 0.05 0.18 0.21 0.07 0.18 0.18
[0.07] [0.12] [0.20] [0.06] [0.09]* [0.15]
... with children 0.01 0.2 0.1 0.03 0.19 0.14
[0.16] [0.19] [0.20] [0.14] [0.14] [0.17]
... with a partner -0.11 -0.18 -0.12 -0.17 -0.21 -0.17
[0.06]* [0.09]** [0.16] [0.05]*** [0.07]*** [0.14]
Share of non-entrepreneurs who attended Ivy League college 0.1 0.22 0.22 0.06 0.18 0.14
[0.15] [0.14] [0.19] [0.13] [0.12] [0.15]
... that attended an Ivy Plus college -0.01 -0.09 -0.08 -0.02 -0.13 -0.12
[0.12] [0.12] [0.15] [0.10] [0.09] [0.11]
… that majored in engineering in college 0.07 -0.03 -0.02 0.09 0 0
[0.08] [0.10] [0.10] [0.07] [0.08] [0.08]
Mean maximum risk score of section -0.22 -0.26 -0.19 -0.17 -0.2 -0.14
[0.14] [0.16] [0.21] [0.12] [0.12] [0.18]
Total IPO proceeds in graduation year ($ trillions) -1.38 -1.35
[0.54]** [0.46]***
Total venture financing in graduation year 1.32 1.24
[0.28]*** [0.23]***
Year dummies X X X X
Selected interactions of stratification variables X X
Regression type Tobit OLS OLS Tobit OLS OLS
Observations 60 60 60 60 60 60
R-squared 0.74 0.78 0.82 0.84
Table V. Determinants of Post-MBA Entrepreneurship
Dependent Variable:Share of post-MBA entrepreneurs net of …
identified share of pre-&-post-MBA entrepr av. estim. share of pre-&-post-MBA entrepr.

Notes. The sample consists of all sections with at least 70 available class cards. All section-level measures (except for pre-MBA entrepreneurs) exclude pre-
MBA entrepreneurs. The selected set of stratification variables included as interactions contains the share of section that is male, that are U.S. citizens, with a
partner, and with investment banking background. Robust standard errors in brackets. * significant at 10%; ** significant at 5%; *** significant at 1%

Panel A. Unsuccessful Entrepreneurship
Share of section with entrepreneurial background -0.47 -0.36 -0.36 -0.57 -0.42 -0.43
[0.14]*** [0.11]*** [0.10]*** [0.14]*** [0.10]*** [0.09]***
Controls for other professional backgrounds X X X X X X
of non-entrepreneurs
Controls for demographic characteristics and education X X X X X X
of non-entrepreneurs
Controls for total IPO proceeds and total venture financing X X
in graduation year
Year dummies X X X X
Selected interactions of stratification variables X X
Regression type Tobit OLS OLS Tobit OLS OLS
Observations 60 60 60 60 60 60
R-squared 0.74 0.80 0.82 0.84
Panel B. Successful Entrepreneurship
Share of section with entrepreneurial background 0.14 0.03 0.02 0.16 0.03 0.02
[0.11] [0.03] [0.03] [0.10] [0.03] [0.02]
Controls for other professional backgrounds X X X X X X
of non-entrepreneurs
Controls for demographic characteristics and education X X X X X X
of non-entrepreneurs
Controls for total IPO proceeds and total venture financing X X
in graduation year
Year dummies X X X X
Selected interactions of stratification variables X X
Regression type Tobit OLS OLS Tobit OLS OLS
Observations 60 60 60 60 60 60
R-squared 0.36 0.59 0.45 0.62
Panel C. Test of Differences
p-Value, test of difference in successful and unsuccessful regressions:
Share of section with entrepreneurial background 0.000 0.000 0.000 0.000 0.000 0.000
Joint test of all variables 0.000 0.000 0.000 0.000 0.000 0.000
Table VI. Determinants of Unsuccessful versus Successful Post-MBA Entrepreneurship
Dependent Variable:Share of unsuccessful post-MBA entrepreneurs net of …
identified share of pre-and-post-MBA entrepr. av. est. share of pre-and-post-MBA entrepr.
Dependent Variable:Share of successful post-MBA entrepreneurs net of …
identified share of pre-and-post-MBA entrepr. av. est. share of pre-and-post-MBA entrepr.
Share of post-MBA entrepreneurs net of …
identified share of pre-and-post-MBA entrepr. av. estim. share of pre-and-post-MBA entrepr.

Notes. The sample consists of all sections with at least 70 class cards. Controls for other professional backgrounds of non-entrepreneurs and Controls for
demographic characteristics and education of non-entrepreneurs include all control variables shown in Table V. The selected set of stratification variables
included as interactions contains the share of section that is male, that are U.S. citizens, with a partner, and with investment banking background. Robust standard
errors are in brackets. * significant at 10%; ** significant at 5%; *** significant at 1%.

not "very
successful"
"very
successful"
not "super-
successful"
"super-
successful"
(1) (2) (3) (4) (5)
Share of section with entrepreneurial background -0.36 0.04 -0.36 0.04 0.02
[0.13]*** [0.03] [0.13]*** [0.03] [0.08]
Share of non-entrepreneurs ...
… with consulting background -0.07 -0.02 -0.08 -0.02 0.09
[0.11] [0.03] [0.11] [0.03] [0.09]
... with investment-banking background -0.18 -0.01 -0.18 -0.01 -0.10
[0.13] [0.03] [0.13] [0.03] [0.07]
... with private-equity background 0.04 0.02 0.05 0.02 -0.04
[0.17] [0.04] [0.17] [0.04] [0.10]
... with agricultural-business background -0.59 0.06 -0.56 0.06 -0.32
[0.31]* [0.07] [0.31]* [0.07] [0.21]
... with health care background 0.62 -0.09 0.59 -0.09 -0.17
[0.29]** [0.07] [0.28]** [0.07] [0.20]
... with general management background 0.04 -0.04 0.02 -0.04 0.01
[0.12] [0.03] [0.11] [0.03] [0.08]
Share of non-entrepreneurs that are male 0.83 -0.03 0.81 -0.03 -0.27
[0.25]*** [0.06] [0.25]*** [0.06] [0.16]*
... that are U.S. citizens 0.24 -0.06 0.21 -0.06 -0.12
[0.14]* [0.03]* [0.14] [0.03]* [0.09]
... with children 0.14 0.07 0.18 0.07 0.10
[0.17] [0.04]* [0.17] [0.04]* [0.11]
... with a partner -0.17 -0.02 -0.17 -0.02 -0.06
[0.07]** [0.02] [0.07]** [0.02] [0.05]
... that attended an Ivy League college 0.32 -0.09 0.26 -0.09 0.12
[0.17]* [0.04]** [0.17] [0.04]** [0.14]
... that attended an Ivy Plus college -0.14 0.05 -0.11 0.05 -0.07
[0.12] [0.03]* [0.12] [0.03]* [0.07]
… with major in engineering in college -0.04 0.03 -0.03 0.03 0.01
[0.10] [0.02] [0.10] [0.02] [0.08]
Mean maximum risk score of section -0.3 0.04 -0.28 0.04 0.13
[0.17]* [0.04] [0.17] [0.04] [0.10]
Year dummies X X X X
Regression type OLS OLS OLS OLS OLS
Observations 60 60 60 60 60R-squared 0.73 0.43 0.73 0.45 0.88
Table VII. Alternative Success Measures and Alternative Outcome (Elective Courses)
Dependent Variable:
Share of post-MBA entrepreneurs (net of identified
pre-and-post-MBA entrepreneurs) who were …
Enrollment in
entrepreneurship
classes by non-pre-
MBA
entrepreneurs
Notes. OLS regressions on the sample of all sections with at least 70 class cards. All section-level measures (except the
share with entrepreneurial background) do not include pre-MBA entrepreneurs. Robust standard errors in brackets. *
significant at 10%; ** significant at 5%; *** significant at 1%

Panel A. Effects on Unsuccessful Post-MBA Entrepreneurship
Share of section with successful entrepreneurial background -0.31 -0.39 -0.36 -0.45 -0.41 -0.43
[0.29] [0.27] [0.32] [0.21]** [0.19]** [0.23]*
Share of section with unsuccessful entrepreneurial background -0.60 -0.33 -0.36 -0.65 -0.43 -0.43
[0.22]*** [0.21] [0.22] [0.21]*** [0.19]** [0.18]**
Controls for other professional backgrounds X X X X X X
of non-entrepreneurs
Controls for demographic characteristics and education X X X X X X
of non-entrepreneurs
Controls for total IPO proceeds and total venture financing X X
in graduation year
Year dummies X X X X
Selected interactions of stratification variables X X
Regression type Tobit OLS OLS Tobit OLS OLS
Observations 60 60 60 60 60 60
R-squared 0.74 0.80 0.83 0.86
F-statistic, test of successful and unsuccessful entrepeneurs 0.45 0.02 0.00 0.35 0.00 0.00P-value [0.50] [0.88] [0.99] [0.55] [0.96] [0.99]
Panel B. Effects on Successful Post-MBA Entrepreneurship
Share of section with successful entrepreneurial background 0.37 0.08 0.05 0.31 0.06 0.03
[0.20]* [0.07] [0.05] [0.18]* [0.06] [0.05]
Share of section with unsuccessful entrepreneurial background -0.04 -0.01 0.00 0.03 0.00 0.01
[0.21] [0.06] [0.06] [0.19] [0.06] [0.05]
Controls for other professional backgrounds X X X X X X
of non-entrepreneurs
Controls for demographic characteristics and education X X X X X X
of non-entrepreneurs
Controls for total IPO proceeds and total venture financing X X
in graduation year
Year dummies X X X X
Selected interactions of stratification variables X X
Regression type Tobit OLS OLS Tobit OLS OLS
Observations 60 60 60 60 60 60
R-squared 0.38 0.60 0.46 0.62
F-statistic, test of successful and unsuccessful entrepeneurs 1.37 0.74 0.48 0.85 0.34 0.03P-value [0.24] [0.39] [0.49] [0.36] [0.56] [0.86]
Notes. All section-level measures (except the share with pre-MBA entrepreneurs) do not include pre-MBA entrepreneurs. The sample consists of all sections with at least 70 class cards.
The regressions contain all controls used in Tables V and VII. The selected set of interactions of stratification variables include share of section that is male, are U.S. citizens, with
consulting background, with investment banking background, with private equity background, and that attended an Ivy Plus college. The F-test reports a test of the null hypothesis that the
coefficients on the two entrepreneurial background variables are the same. Robust standard errors in brackets. * significant at 10%; ** significant at 5%; *** significant at 1%
Table VIII. Effects of Successful and Unsuccessful Pre-MBA Entrepreneurship
Dependent Variable:Share of unsuccessful post-MBA entrepreneurs net of …
identified share of pre-and-post-MBA entrepr. av. est. share of pre-and-post-MBA entrepr.
Dependent Variable:Share of successful post-MBA entrepreneurs net of …
identified share of pre-and-post-MBA entrepr. av. est. share of pre-and-post-MBA entrepr.

For sections with For sections with p-Value, test
below median number above median number of null
of students with of students with hypothesis
entrepreneurial entrepreneurial of no
background background difference
Standard Deviation of Entrepreneurship Rate
Total Post-MBA Entrepreneurship 5.30% 4.16% 0.007
Successful Post-MBA Entrepreneurship 0.24% 0.55% 0.010
Unsuccessful MBA Entrepreneurship 5.05% 3.66% 0.005
Notes. The sample consists of all sections with at least 70 available class cards.
Table IX. Variance in Post-MBA Entrepreneurship Rates

below median above median p-values
Share that ever worked as an entrepreneur 5.0% 2.4% 7.8% [0.00]***
(3.4%) (1.6%) (2.6%)
Share of non-entrerprenurs that worked most recently
… in computer hardware 1.4% 1.4% 1.4% [0.98]
(1.5%) (1.5%) (1.5%)
… in computer software 3.7% 3.7% 3.5% [0.81]
(2.9%) (3.1%) (2.6%)
… in computer-related services 2.3% 2.3% 2.1% [0.58]
(2.3%) (2.4%) (2.1%)
… in other high-tech sectors 1.1% 1.3% 0.8% [0.07]*
(1.4%) (1.6%) (1.0%)
… in telecommunications 3.2% 3.5% 3.0% [0.24]
(2.2%) (2.1%) (2.3%)
… in diversified manufacturing 1.4% 1.2% 1.6% [0.15]
(1.4%) (0.5%) (1.6%)
… in banking 15.4% 15.3% 15.5% [0.86]
(5.6%) (0.3%) (6.5%)
… in financial services 6.1% 5.5% 6.7% [0.06]*
(2.9%) (2.7%) (3.0%)
… in consulting 18.7% 18.7% 18.6% [0.94]
(4.6%) (3.8%) (5.2%)
… in venture capital/private equity 8.0% 8.5% 7.5% [0.35]
(4.7%) (4.4%) (5.0%)
… in military 3.3% 3.4% 3.2% [0.72]
(2.3%) (1.9%) (2.7%)
… in non-profit organizations 4.3% 4.0% 4.5% [0.41]
(2.6%) (2.6%) (2.7%)
… in accounting 1.1% 0.8% 1.4% [0.08]*
(1.6%) (1.4%) (1.8%)
… in law 0.9% 0.8% 1.0% [0.61]
(1.4%) (1.2%) (1.5%)
… in retail 4.0% 4.3% 3.6% [0.15]
(2.7%) (2.9%) (2.4%)
… in advertising/marketing 2.1% 2.4% 1.8% [0.16]
(2.3%) (2.2%) (2.2%)
… in entertainment 3.8% 4.3% 3.2% [0.02]**
(2.3%) (2.0%) (2.4%)
… in agricultural business 2.4% 2.7% 2.0% [0.09]*
(1.8%) (2.0%) (1.6%)
… in health services 3.2% 2.8% 3.7% [0.06]*
(2.3%) (1.8%) (2.6%)
… in other industries 1.4% 1.4% 1.3% [0.57]
(1.5%) (1.5%) (1.5%)
Appendix Table A1. Stratification Checks:
Comparing sections with high- and low shares of pre-MBA entrepreneurs
Full Sample# of pre-MBA Entrepreneurs

below median above median p-values
Share that attended an Ivy League college 24.0% 25.2% 22.7% [0.02]**
(5.3%) (5.0%) (5.3%)
… an Ivy Plus League college 32.3% 35.7% 32.7% [0.02]**
(6.3%) (5.7%) (6.6%)
Share that is male 69.4% 69.6% 69.2% [0.82]
(7.1%) (7.3%) (6.9%)
… has a partner 41.2% 41.8% 40.6% [0.42]
(7.3%) (6.6%) (8.1%)
… has a male partner 31.8% 32.7% 30.7% [0.10]*
(5.7%) (4.8%) (6.5%)
… has a female partner 9.2% 8.7% 9.6% [0.44]
(4.6%) (4.3%) (4.8%)
Share with business major at college 23.8% 23.5% 24.1% [0.61]
(5.8%) (5.9%) (5.6%)
… with economics major at college 22.7% 22.4% 22.9% [0.73]
(5.9%) (6.5%) (5.1%)
… with engineering major at college 16.6% 17.4% 15.8% [0.13]
(4.7%) (4.0%) (5.5%)
… with computer science major at college 6.0% 5.8% 6.1% [0.67]
(3.1%) (3.2%) (3.0%)
… with mathematics major at college 2.3% 2.1% 2.4% [0.59]
(2.0%) (1.9%) (2.0%)
… with natural science major at college 4.1% 3.9% 4.1% [0.83]
(3.0%) (2.0%) (3.7%)
… with law major at college 0.7% 0.8% 0.6% [0.52]
(0.9%) (0.9%) (0.9%)
… with medical science major at college 0.3% 0.2% 0.4% [0.29]
(0.7%) (0.6%) (0.8%)
… with humanity major at college 4.8% 4.4% 5.1% [0.32]
(3.1%) (2.8%) (3.3%)
… with history major at college 3.6% 4.2% 2.9% [0.01]**
(2.6%) (2.8%) (2.2%)
… with journalism major at college 0.4% 0.4% 0.4% [0.76]
(0.8%) (0.7%) (0.8%)
… with architecture major at college 0.3% 0.1% 0.5% [0.09]*
(0.9%) (0.3%) (1.2%)
… with political science major at college 7.9% 7.4% 8.4% [0.24]
(3.8%) (3.9%) (3.6%)
… with anthropology major at college 4.9% 5.4% 4.3% [0.06]*
(3.0%) (3.0%) (2.9%)
Share that has US citizenship 66.9% 67.4% 66.3% [0.45]
(6.7%) (6.6%) (6.9%)
Share of Caucasians 43.2% 43.7% 42.7% [0.72]
(12.2%) (12.6%) (12.0%)
… of Asians 5.8% 5.7% 5.9% [0.81]
(2.9%) (2.8%) (3.1%)
… of Hispanics 1.8% 1.9% 1.6% [0.32]
(1.6%) (1.6%) (1.5%)
… of other races 3.9% 3.8% 4.1% [0.69]
(2.8%) (2.6%) (3.1%)
Appendix-Table A1 (continued )
Full Sample# of pre-MBA Entrepreneurs
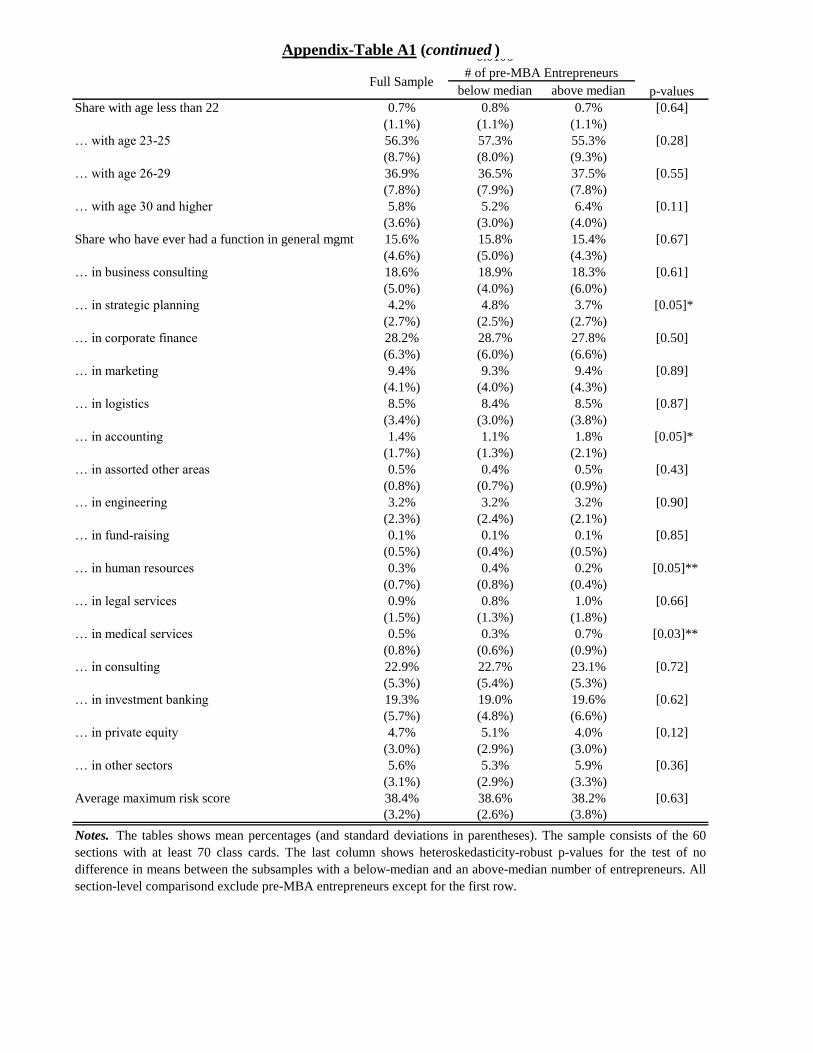
below median above median p-values
Share with age less than 22 0.7% 0.8% 0.7% [0.64]
(1.1%) (1.1%) (1.1%)
… with age 23-25 56.3% 57.3% 55.3% [0.28]
(8.7%) (8.0%) (9.3%)
… with age 26-29 36.9% 36.5% 37.5% [0.55]
(7.8%) (7.9%) (7.8%)
… with age 30 and higher 5.8% 5.2% 6.4% [0.11]
(3.6%) (3.0%) (4.0%)
Share who have ever had a function in general mgmt 15.6% 15.8% 15.4% [0.67]
(4.6%) (5.0%) (4.3%)
… in business consulting 18.6% 18.9% 18.3% [0.61]
(5.0%) (4.0%) (6.0%)
… in strategic planning 4.2% 4.8% 3.7% [0.05]*
(2.7%) (2.5%) (2.7%)
… in corporate finance 28.2% 28.7% 27.8% [0.50]
(6.3%) (6.0%) (6.6%)
… in marketing 9.4% 9.3% 9.4% [0.89]
(4.1%) (4.0%) (4.3%)
… in logistics 8.5% 8.4% 8.5% [0.87]
(3.4%) (3.0%) (3.8%)
… in accounting 1.4% 1.1% 1.8% [0.05]*
(1.7%) (1.3%) (2.1%)
… in assorted other areas 0.5% 0.4% 0.5% [0.43]
(0.8%) (0.7%) (0.9%)
… in engineering 3.2% 3.2% 3.2% [0.90]
(2.3%) (2.4%) (2.1%)
… in fund-raising 0.1% 0.1% 0.1% [0.85]
(0.5%) (0.4%) (0.5%)
… in human resources 0.3% 0.4% 0.2% [0.05]**
(0.7%) (0.8%) (0.4%)
… in legal services 0.9% 0.8% 1.0% [0.66]
(1.5%) (1.3%) (1.8%)
… in medical services 0.5% 0.3% 0.7% [0.03]**
(0.8%) (0.6%) (0.9%)
… in consulting 22.9% 22.7% 23.1% [0.72]
(5.3%) (5.4%) (5.3%)
… in investment banking 19.3% 19.0% 19.6% [0.62]
(5.7%) (4.8%) (6.6%)
… in private equity 4.7% 5.1% 4.0% [0.12]
(3.0%) (2.9%) (3.0%)
… in other sectors 5.6% 5.3% 5.9% [0.36]
(3.1%) (2.9%) (3.3%)
Average maximum risk score 38.4% 38.6% 38.2% [0.63]
(3.2%) (2.6%) (3.8%)
Notes. The tables shows mean percentages (and standard deviations in parentheses). The sample consists of the 60
sections with at least 70 class cards. The last column shows heteroskedasticity-robust p-values for the test of no
difference in means between the subsamples with a below-median and an above-median number of entrepreneurs. All
section-level comparisond exclude pre-MBA entrepreneurs except for the first row.
Appendix-Table A1 (continued )0.0106
Full Sample# of pre-MBA Entrepreneurs

Appendix Figure 1. Variation in Entrepreneurial Activity
Notes. The graph plots each section-year observation of the rate of pre-MBA entrepreneurs, ordered by
section (A to K). The sample contains the 60 sections with at least 70 available class cards.
0%
2%
4%
6%
8%
10%
12%
14%
A B C D E F G H I J K