with a little help from my friends: global electioneering...
TRANSCRIPT

With a Little Help from My Friends: Global
Electioneering and World Bank Lending∗
Erasmus K. Kersting
Villanova University
Christopher Kilby†
Villanova University
December 23, 2014
Abstract
This paper investigates how World Bank lending responds to upcoming elections
in borrowing countries. We find that investment project loans disburse faster when
countries are aligned with the U.S. in the UN. Moreover, disbursement accelerates in
the run-up to competitive executive elections if the government is geopolitically aligned
with the U.S. but decelerates if the government is not. These disbursement patterns
are consistent with global electioneering that serves U.S. foreign policy interests but
jeopardizes the development effectiveness of multilateral lending.
Key words: World Bank, Political Business Cycle, Elections
JEL codes: E32, F34, F35, O19
∗The authors would like to thank Connor Branham for excellent research assistance. In addition, we arevery grateful to Michael Toppa for web scraping disbursement data and to Erik Voeten for recalculatingideal points based on U.S. important votes. E-mail: [email protected]; [email protected].†Corresponding author

“What would you do if I sang out of tune/ would you stand up and walk out on me?”
John Lennon and Paul McCartney
1 Introduction
Foreign aid has attracted substantial attention in the last decade. While critics abound,
even supporters push for major reforms. Much of bilateral aid is seen as driven by donor
geopolitical and commercial interests. These non-developmental motives can undermine the
economic impact of aid because resources are less likely to be allocated to the areas with the
highest economic return and recipient governments face distorted incentives. Recent research
highlights the geopolitics of U.S. bilateral aid in particular. For example, Kuziemko and
Werker (2006) find that U.S. bilateral aid to developing countries increases dramatically
when they serve on the United Nations Security Council (UNSC), a pattern the authors
equate to bribery by the U.S. to secure international support on key foreign policy issues.
Faye and Niehaus (2012) provide evidence that the U.S., along with a handful of other
large donors, increases bilateral aid to friendly governments that face competitive executive
elections. This suggests global electioneering—an attempt by the U.S. to influence foreign
elections to keep friendly governments in power. These practices might not be surprising
given that the lead U.S. aid agency, USAID, is subordinate to the State Department.
International financial institutions (IFIs) purport to be above such politics. Their char-
ters mandate policies and lending driven by need and economic effi ciency criteria. Recog-
nizing the advantages of apolitical decision-making, aid reform proposals routinely call for
a greater share of aid resources to be redirected through these institutions. Yet there is
accumulating evidence that narrow interests of major shareholders-especially, U.S. interests-
shape IFI behavior. IMF programs have been linked to U.S. interests as reflected in UN
voting alignment (Barro and Lee 2005), UNSC membership (Dreher et al. 2009B), and
U.S. bank exposure (Broz and Hawes 2006). Given the nature of the IMF’s role—episodic
interventions, huge programs, and global financial crises with high stakes for the world’s
major economies—the intrusion of politics may not be surprising. The World Bank, on the
other hand, has more continuous involvement via smaller programs, a profile less obviously
prone to external influence. Nonetheless, recent research finds that countries gain privileged
access to World Bank resources when they are more important to the U.S., whether mea-
suring importance by UN voting alignment (Kilby 2009) or UNSC membership (Dreher et

al. 2009A).
This paper focuses on global electioneering, investigating whether World Bank lending
reflects U.S. interests in the reelection of U.S.-friendly governments. Of all the political
dimensions of aid, electioneering is the most intrusive as it impinges on the fundamental
function of the domestic political system: the selection of the government. Thus, whether
IFIs engage in electioneering is critical to assessing their degree of politicization.
We apply a difference-in-difference approach to explore whether World Bank lending
responds differentially to competitive executive elections in countries aligned with the U.S.
on United Nations General Assembly (UNGA) votes. From a practical viewpoint, World
Bank data have several advantages over the country-year data typically available for aid
flows (Dreher and Vaubel 2004, Faye and Niehaus 2012). Project-level World Bank data
can distinguish between types of aid that are useful for electioneering and types that are not.
Timing information– critical for determining if aid is provided in the run-up to an election
rather than far earlier or even after the election (Faye and Niehaus 2012, Appendix)– is
precise. For each project, we have the date of the initial loan commitment as well as month-
by-month data on subsequent disbursements. Paired with vote-by-vote UNGA data and
election dates, World Bank project data enable us to construct variables that match much
more precisely the timing implied by theory.
World Bank lending can improve an incumbent government’s reelection prospects via two
channels, announcement value and expanded government resources. Announcements of new
World Bank lending can signal to the electorate the “quality”of the incumbent government,
i.e., World Bank support of the government and its policies as well as the government’s abil-
ity to deliver resources (either as public goods or as private goods for key constituencies).
This holds even if there is insuffi cient time prior to an election for the additional resources to
impact voters because of lags between loan commitment and disbursement or lags between
government spending and its impact on the economy. However, approving a new project
for the purpose of influencing an election (and thus necessarily during a fairly narrow time
window) may be logistically impractical given World Bank project preparation procedures.1
Disbursement of an existing World Bank loan, in contrast, may be easier to influence in
a short period of time. This would not provide the opportunity for a well-publicized an-
nouncement but would expand government resources directly (through loan disbursement)
as well as indirectly (through potentially improved access to private capital, bilateral aid
1See Kilby (2013B) for a detailed analysis on the political economy of World Bank project preparation.
2

and multilateral aid from other sources, especially if receiving the disbursements signals
compliance with loan conditions).
World Bank loans fall into one of two categories, investment project lending and devel-
opment policy lending (DPL). These categories differ significantly in terms of publicity and
disbursement profiles and thus would not be interchangeable for electioneering purposes. Ap-
proval of investment projects may have some announcement value, but disbursement ramps
up relatively slowly so that approval of a new investment project is unlikely to provide
significant additional resources within the timeframe relevant for an election.2 In contrast,
DPLs are both high profile and quick-disbursing.3 Yet the announcement value of a new
DPL may well be negative because of controversy over the neoliberal policies underpinning
DPLs and public perception of foreign imperialism. As Schneider (2013, 485) points out,
“the very existence of a [DPL] program could signal economic incompetence to the elec-
torate.” In addition, DPL disbursement may be tied to implementation of contractionary
policies that are unlikely to benefit an incumbent government (though enforcement of World
Bank conditionality has a decidedly mixed record; e.g., Mosley et al. 1995, Kilby 2009). In
summary, the existence of different channels and loan categories through which the World
Bank might engage in electioneering necessitates a separate analysis of investment loans
and DPLs as well as of new loan commitments and the flow of disbursements from ongoing
projects.
We find evidence of electioneering correlated with U.S. geopolitical interests for World
Bank investment loan disbursements but not for DPL disbursements or new loan commit-
ments. We first examine projects’ disbursement speed which we define in terms of the
number of months until 25% of the project commitment amount is disbursed.4 Disburse-
ment speed for investment loans increases with the recipient country’s geopolitical alignment
with the U.S. Furthermore, periods before a competitive executive election reveal a strong
differential effect: disbursement accelerates for governments aligned with the U.S. and de-
celerates for governments not aligned with the U.S. For example, consider the impact of
2Of 5367 World Bank investment project loans approved between January 1, 1984 and December 31,2010, only 306 (6%) reached 25% disbursement within a year of approval; the median time to reach 25%disbursement was 34 months. Just 101 investment project loans (2%) reached 50% disbursement within ayear of approval; the median time to reach 50% disbursement was 49 months.
3Of 1014 World Bank DPLs approved between January 1, 1984 and December 31, 2010, 907 (89%)reached 25% disbursement within a year of approval; the median time to reach 25% disbursement was 4months. Seven hundred and twelve (70%) reached 50% disbursement within a year of approval; the mediantime to reach 50% disbursement was 5 months.
4The fewer the months to reach 25% disbursed, the greater the disbursement speed. In most caseschanging the threshold to 50% or 75% has little impact on results (in terms of sign, significance or magnitudeof coeffi cient estimates). Below we note the few cases where differences arise.
3

elections with low and high U.S. alignment. On average, World Bank investment projects
take 36 months to reach 25% disbursed. If alignment with the U.S. is one standard devi-
ation below the mean, the predicted time to reach 25% disbursed is 39.6 months with no
impending election and 41.9 months with an impending election, an increase (slowing) of 2.3
months. If alignment with the U.S. is one standard deviation above the mean, the predicted
time to reach 25% disbursed is 32.7 months with no impending election and 30.4 months
with an impending election, a decrease (acceleration) of 2.2 months.
Further supporting evidence is provided by a Tobit analysis of monthly disbursement
data. For investment projects, disbursements are larger before competitive executive elec-
tions than at other times if the country is aligned with the U.S. but smaller otherwise.
Again, these patterns do not hold for DPL disbursements.
We do not find strong empirical support for U.S. use of the announcement channel.
There is only weak evidence of an increase in new commitments in advance of elections
and this effect (if any) does not depend on geopolitical alignment with the U.S. There is,
however, a direct link between new commitments and geopolitical alignment with the U.S., a
result that mirrors those in earlier studies (Andersen et al. 2006, Dreher et al. 2009A). One
potential explanation for the absence of an election effect is the significant amount of time
it takes the World Bank to prepare a new project (Kilby 2013B). As a result, electioneering
via generating new projects may be logistically impractical.
Section 2 discusses the existing literature in more detail, highlighting the fronts along
which the present paper makes progress. Section 3 provides details on the data and discusses
modeling choices. Section 4 presents the results of the disbursement speed analysis, section
5 contains the discussion of the Tobit analysis of disbursements at the project-month level
and section 6 contains the analysis of new loan commitments. Section 7 discusses the results
and their robustness while section 8 concludes.
2 Previous Research
The notion that the U.S. might influence World Bank lending to improve reelection prospects
for friendly governments has been suggested in the literature. For example, Schneider (2013)
develops a theory of globalized electoral politics which also applies to the World Bank: “In
this case, the theory would predict that borrowing countries are more likely to generate
electoral cycles in international distributive bargaining if one of the major stakeholders
4

has a strategic interest in that government’s survival.” (Schneider 2013, 486) The logic of
such global electioneering is built on a set of three premises. First, borrowing governments
are able to direct these funds to key groups of voters and this impacts election outcomes.
Second, the U.S. engages in global electioneering, i.e., there is a political aid cycle. Third,
the U.S. is able to influence the timing and amount of funds allocated by the World Bank.
Roughly speaking, these are means, motive, and opportunity.
Anecdotal evidence that recipient governments use aid funds to curry favor from impor-
tant constituencies abounds. Harder empirical evidence is also now emerging as geo-coded
aid data become available to illuminate the subnational distribution of aid. For a sample
of 27 countries in Africa, Öhler and Nunnenkamp (2013) find a bias in aid flows toward the
birthplace of the country’s leader, consistent with government tactics to maintain ethnic-
based political support. Briggs (2014) and Jablonski (2014) find similar results in more
detailed empirical work on aid to Kenya. Jablonski also presents evidence that aid flows
do impact voting (as measured by election victory margins) and thus can help incumbent
governments win elections.
Given that incumbents can use additional aid to improve their reelection prospects, does
the U.S. provide more funding to favored governments in advance of elections? According to
a recent study by Faye and Niehaus (2012), the answer is yes. Bilateral aid from the U.S. in-
creases in election years for governments that vote with the U.S. in the UNGA but decreases
in election years for governments that vote against the U.S. While the UNGA has little for-
mal power, UNGA voting is a reasonable measure of the degree to which governments are
favored by the U.S. The U.S. administration is in a stronger position both domestically and
internationally when it has more support in the UN. The U.S. State Department reports
annually to Congress on UNGA voting alignment, in part to justify aid flows. In addition,
UN voting alignment is one of the few measures to assess the overlap of interests between
governments that is available consistently over long periods of time. Thus, the change in
UNGA alignment is a good indicator of whether a government is more or less friendly with
the U.S.
Finally, is it possible for the U.S. to influence decisions in the World Bank in this fashion?
Despite a charter that prohibits political considerations, past research on the World Bank
(and other IFIs) does identify the impact of geopolitics on numerous World Bank activities.
Empirical analysis of the geopolitics of World Bank lending begins with Akins (1981) who
finds that World Bank commitments reflect U.S. trade flows and bilateral aid. Frey and
5

Schneider (1986) find that former colonies and current trading partners of the U.S. receive
more World Bank funding, ceteris paribus. Gwin (1997) documents how the U.S. executive
branch in particular has been able to influence World Bank lending, policies, and practices.
The set of geopolitical variables used in the now extensive literature on the political economy
of IFIs includes UN voting patterns– especially alignment with the U.S. on UNGA votes
designated as important by the U.S. State Department– and temporary membership on the
United Nations Security Council (UNSC).5
This paper focuses on political cycles in World Bank lending. By taking advantage
of variation in geopolitical alignment with the U.S., we identify a supply-side effect that
cannot be explained by fluctuation in demand for World Bank funds around elections.6
The fine-grained nature of World Bank data means timing is known precisely so we can
identify resource flows shortly before an election without inadvertently also capturing post-
election flows. The data also allow us to differentiate between those types of aid flows with
characteristics useful for reelection purposes and other types. As a result, we can subject
the political aid cycle hypothesis to more rigorous testing that examines implications along
several dimensions, including the exploration of competing explanations.
3 Data and Estimation Method
We begin our analysis by examining the factors that influence the speed at which a World
Bank project disburses funds. For each project, we compute the number of months it takes
for cumulative disbursements to reach 25% of the total committed amount. Project data
come from the World Bank Projects Database (World Bank 2013). These include approval
date, commitment amount (for IBRD loans and IDA credits), sector, and lending instrument
type for 7,148 projects. In addition, we scraped monthly disbursement data from the on-line
version of this database. Disbursement data are available by month for the vast majority
of IBRD/IDA projects approved on or after January 1, 1984; our data collection ended
September 17, 2013. However, our estimation sample stops in December 2010 because of
availability of election data. In addition, covariate data are missing in a few cases (not
5Other empirical work on the political economy of the World Bank (and, in particular, on U.S. influence)includes Andersen et al. (2006), Dreher et al. (2009A), Fleck and Kilby (2006), Kilby (2009B, 2013A,2013B, 2014) and Weck Hannemann and Schneider (1991).
6Previous empirical work on World Bank lending and elections is limited to Dreher and Vaubel (2004)which reports lower borrowing from the non-concessional branch of the World Bank in the eighteen monthperiod following an election. Methodologically, our approach parallels that in Dreher (2003) for IMF lending,Dreher et al. (2008) for IMF forecasts, Faye and Niehaus (2012) for bilateral aid, and Hlavac (2013) forUNICEF funds.
6

yet UN members or missing GDP data), reducing the overall sample to 421,500 monthly
observations on 6381 projects. In the analysis below, we use these monthly disbursement
data to calculate the speed of disbursement for each project.
[Figure 1 about here]
Figure 1 displays the average cumulative disbursement pattern separately for investment
projects and DPLs. The horizontal axis is the number of months since project approval while
the vertical axis is cumulative disbursement as a share of total commitments, averaged over
either all investment projects or all DPLs. Figure 1 illustrates that disbursement speeds
differ dramatically across these types of activities: one year after approval, the average
DPL project has disbursed 80% of committed funds while the corresponding number for
investment projects is less than 10%.7 For the following disbursement speed analysis a
sample split along this dimension is thus a natural choice both theoretically and empirically.
We proceed to discuss the sample of investment projects, followed by DPLs.
[Table 1 about here]
As indicated in Panel A of Table 1, there are 5367 investment projects in our sample.
The average investment project takes 36 months for disbursements to reach 25% of the
committed amount, ranging from projects where it took only a single month to one that
reached the threshold only after 154 months (a $500 million financial intermediary loan to
Argentina approved in March 1994).
Special attention is warranted to the definition of the political economy variables UN
Alignment and CEE. UN Alignment reflects the degree to which the recipient country’s
UN voting record matches that of the U.S. The basis for the measure consists of all UN
votes that occurred in the previous 12 months and that the U.S. State Department offi cially
designated as ‘important.’ UN Alignment ranges from zero to one, with one indicating
perfect alignment.8 This measure, with minor variations, has been widely used in the
7Cumulative disbursement figures may exceed 100% or plateau below 100% for various reasons. Com-mitment and disbursement figures are reported in USD while the actual loans are in a variety of currencies(e.g., Euro). Thus, reported disbursements may exceed 100% when the dollar declines in value betweencommitment and disbursement or plateau below 100% when the dollar rises in value between commitmentand disbursement. Cancellation of part of the loan amount (for projects finishing under budget or when por-tions of the planned project are cancelled) also contributes to cumulative disbursements not reaching 100%.Note that the DPL graph implicitly weights recent years more heavily since the advent of single trancheoperations transformed larger, multi-tranche operations into more frequent, smaller operations. These latterDPLs are often approved only after conditions are met and so typically disburse quickly and fully.
8We assign each vote a 1 if the country and the U.S. vote the same (treating abstentions and absences asequivalent), a 0 if the votes are opposite, and 1
2if one party abstains/is absent while the other votes. UN
Alignment is the average of these values over the 12 month period.
7

literature on the political economy of foreign aid (e.g. Thacker 1999, Dreher and Jensen
2007). United Nations General Assembly voting data are drawn from Strezhnev and Voeten
(2013) and U.S. State Department (1984-2012).
CEE is binary and in any given month takes on the value one if a competitive executive
election takes place within the next 12 months, zero otherwise. Data on the timing and
competitiveness of recipient country elections are drawn from the National Elections across
Democracy and Autocracy (NELDA) database (Hyde and Marinov 2012). Following Hyde
and Marinov and also Jablonski (2013), we define competitive elections as elections meeting
three criteria: i) there is more than one legal party, ii) opposition is allowed, and iii) there
is a choice of candidates on the ballot.
Note that both CEE and UN Alignment are available by country at a monthly fre-
quency. To investigate disbursement speed at the project level, we average CEE and UN
Alignment across the months leading up to and including the month when cumulative dis-
bursement reaches 25% of the committed amount. The mean of 0.12 for CEE indicates that
for the average investment project one month in eight falls into a pre-election period. Of our
investment project sample, 3223 projects (60% of the sample) have a zero value for CEE,
indicating that the project began and reached at least 25% disbursed without there being
a forthcoming election in the country. The remaining 2144 projects all include pre-election
periods that correspond to a total of 316 competitive executive elections in 89 countries
during the years 1984 to 2010.
Approval Period is the project’s approval date measured in months since 1960 and thus
allows for secular trends. Approval Period ranges from 288 (January 1984) to 611 (May
2010) and averages 450 (July 1997). IDA is a dummy variable, equal to 1 for projects
that include IDA funding (i.e., no interest loans from the concessional window of the World
Bank), some 54 percent of the sample. Project Size is the log of the project commitment
amount (i.e., the amount of the IBRD loan and/or IDA credit) in 2005 dollars. This ranges
from 13.18 (a $470,000 specific investment loan to Tajikistan approved in June 2000) to
21.95 (a $3.75 billion specific investment loan to South Africa approved in April 2010), with
an average of 17.64 ($45.8 million).9
We also include several widely available macro variables to capture the quality of the
policy environment, the level of development, and the country’s size. As with the political
9Because of skew in the distribution of loan sizes, the average without logs is considerably higher at $83.4million.
8

economy variables, these are averaged over the relevant period. Inflation is the annual
percentage change in the GDP deflator and ranges from -17 percent to over 6,000 percent
(from a project in the Democratic Republic of the Congo with a time frame that includes
the hyperinflation year of 1994). GDP is the log of purchasing power parity (PPP) GDP
in 2005 dollars, averaging 24.12 ($29 billion) and ranging from 18.42 ($99 million) to 28.98
($3.9 trillion). Population is the log of population which averages 17.10 (27 million people)
and ranges from 10.63 (41 thousand people) to 21.01 (1.3 billion people). Data for all three
variables are drawn from the WDI (Azevedo 2011, World Bank 2014E).
Turning to the DPL data, Panel B of Table 1 displays the summary statistics for the 1014
DPLs in the dataset. The important difference to note is the drastically higher disbursement
speed. DPL projects reach 25% of commitments within a time frame ranging from 1 to
64 months, with an average of less than six months. In contrast to investment projects,
DPLs generally have fewer, larger disbursements and complicating matters is the fact that
the number of disbursement tranches has changed over time. At the offi cial advent of
adjustment lending in the early 1980s, program loans were structured in multiple tranches,
each scheduled to disburse if the recipient government reached pre-determined benchmarks
by the appointed date. Over time, the World Bank has shifted to single tranche operations
where World Bank Executive Board approval of a DPL signals compliance with adjustment
conditions and disbursement follows directly.10 Thus, for analysis at the project level, both
comparisons of DPLs over time and aggregation of DPLs over time pose problems.
We control for changing disbursement schedules by including approval period as an
explanatory variable in all project-level specifications. In addition, fixed effects for lending
instrument type (different types of investment loans and different types of DPLs) and sector
board code (functional categories for project activities) control for systematic differences in
disbursement speed across those loan categories.
4 Disbursement Speed Analysis
We estimate the baseline specification using Ordinary Least Squares (OLS):
#monthsij = β1UNAlignmentij + β2CEEij + β3Xi + β4Zij + γj + εij (1)
10The median time from loan approval to reach 50% disbursement has fallen from 14.5 months for DPLsapproved in the 1980s to 11 months for DPLs approved in the 1990s to 4 months for DPLs approved sincethe start of 2000.
9

The unit of analysis is a project i that takes place in country j. The dependent variable is
the number of months it takes for cumulative disbursements to reach the threshold of 25% of
the total committed amount.11 We index the country variables UN Alignment, CEE and
Z by both i and j because they are based on time-varying country-level data averaged over
a project-specific period (the months during which the project’s cumulative disbursement
were at or below the threshold). The project-specific vector X includes Approval Period,
IDA, and Project Size as well as dummies for lending instrument type and project sector.
The country-specific vector Z contains measures of Inflation, GDP and Population. The
model estimated includes country fixed effects (γj). Table 2 presents results for investment
project loans, Table 3 for DPLs. Reported t-statistics and significance levels are based on
country-clustered standard errors.
[Table 2 about here]
Column 1 of Table 2 is our baseline specification for investment project loans. The results
indicate that projects take less time to reach 25% disbursement when the government is more
aligned with the U.S. in the UN. Furthermore, projects occurring in pre-election periods take
a shorter time to reach the threshold although this difference is not statistically significant.
The coeffi cient estimates for Approval Period and Project Size indicate that more recent
and larger projects disburse more quickly, while the distinction between IBRD and IDA has
no impact on the disbursement speed. Note that these results do not necessarily indicate
favoritism or electioneering: The coeffi cient on UN Alignment might just indicate that
when governments vote with the U.S. they also have other characteristics that allow for
faster loan disbursements (e.g., higher bureaucratic quality). Any election effect might be a
demand story: in the run-up to an election, a government might intensify efforts to secure
disbursements from existing World Bank loans.
Column 2 presents the results of the baseline specification with the interaction of the two
political economy variables. The results display a differential effect when projects cover a
pre-election period: Loan disbursement accelerates prior to an election when the government
is aligned with the U.S. In contrast, when governments are not aligned with the U.S. they
see a deceleration of disbursements in pre-election months. Note that this result cannot
be reconciled with the previous explanations. If governments are simply better at fulfilling
requirements necessary to receive disbursements when they also happen to be aligned with
11Changing the cut-off threshold does not change results, with one exception discussed below.
10

the U.S., this effect should be independent of election timing. Similarly, if the election effect
were purely a demand effect there would be no difference between cases where a government
is aligned with the U.S. and cases where it is not. We thus interpret these results as evidence
of electioneering with the goal of supporting administrations that are friendly toward the
U.S.
This effect is quantitatively significant. The effect of an upcoming election for a typical
country aligned with the U.S. is to shorten the predicted time to reach 25% disbursement
by 2.3 months. In the case of a country not aligned with the U.S., the predicted time to
reach 25% disbursed increases by 2.3 months.12
Our analysis requires us to decide how to treat projects that a) never reach cumulative
disbursements of 25% of total commitments or b) have not reached that threshold by the
end of our sample, December 2010. Columns 3 and 4 of Table 2 repeat the same estimation
using a smaller sample where all of these cases are removed. (By keeping them in the sample,
the estimations underlying columns 1 and 2 implicitly assume that the threshold is reached
in the last month we observe the project.) The results are not qualitatively different; while
the coeffi cient estimates are generally smaller, their sign and statistical significance are not
changed.13
[Table 3 about here]
Next we turn to the analysis of DPL projects. Table 3 depicts the results of the same
estimations on the new sample. Our main finding is that there is no effect of geopolitical
alignment with the U.S. or election-related timing on the disbursement of development policy
loans. Note that the drop in the number of observations between columns 3 and 4 versus
1 and 2 is much less than in the previous case (26 versus 808). The reason is the generally
shorter duration of DPL projects: since disbursement occurs in big tranches, there are very
few projects that never reach 25% of the committed amount and the number of censored
projects (“cut off”due to our sample ending) is also considerably smaller.
We also examine the robustness of our result to a change in the cut-off percentage. Since
there is no deep theoretical reason to choose 25% of total commitments as the threshold to
12For this computation a country "not aligned with the U.S." is one standard deviation below the mean ofUN Alignment and a country "aligned with the U.S." is one standard deviation above the mean. The effectof an upcoming election is to increase CEE from 0 to 0.29 (the mean conditional on CEE being strictlypositive).13The exception is the estimated coeffi cient for CEE which is now statistically significant in the baseline
specification. As an alternative to excluding the censored projects, one could estimate a hazard model whichallows for censoring but this suffers from an incidental parameters problem given country fixed effects.
11

measure disbursement speed, we also use 50% and 75%.
[Table 4 about here]
Table 4 presents the results, reporting only for the key political economy variables. The
first three columns contain the 25%, 50% and 75% threshold results for investment projects
while the last three show the parallel results for DPLs. As shown in Columns 1-3, increasing
the threshold does not affect the significance of our main results. In fact, the coeffi cients
on UN Alignment, CEE and the interaction all increase as the cut-off moves from 25% to
75%. This finding is intuitive, as the number of months it takes the average project to reach
75% of commitments is higher than for 25%, and acceleration would thus imply a larger
change in the number of months.
Columns 4-6 confirm earlier results with no evidence of electioneering for DPLs. The
estimated coeffi cients on CEE and the interaction term never reach statistical significance.
However, there is a general effect of geopolitical alignment on the disbursement of DPL
programs– provided one allows for a suffi ciently long time horizon. As the threshold in-
creases, the coeffi cient on UN Alignment increase in magnitude and becomes statistically
significant at the highest threshold. The results in Column 6 imply that an increase of two
standard deviations in UN Alignment is associated with five month decrease in the time to
reach 75% disbursement. Note that on average a DPL project reaches that point after only
15 12 months, so this is no small effect. The fact that DPLs disburse much more rapidly
than investment projects is likely the cause of the lack of a statistically significant result for
cut-offs below 75%.
5 Project Level Data at the Monthly Frequency
In this section we approach our question from a different angle. Instead of reducing each
project to one observation, we exploit the richness of the data by estimating the determinants
of disbursement for each project during each active month separately. While drastically
increasing the number of observations, this approach also raises a number of questions, the
most important of which we discuss in the following. First, the estimation method needs to
take into account the large number of zeros in the data.
[Table 5 about here]
12

Table 5 provides descriptive statistics for the same investment and DPL projects as
before but using the disaggregate monthly data. As Panel A indicates, there are over
400,000 observations corresponding to 5,367 investment projects. The number of months
with strictly positive disbursements is about 200,000. Given the substantial number of zeros
in this sample (and in the Panel B DPL sample), a simple regression model is not attractive.
We account for zeros via a standard Tobit estimation (i.e., modeling latent disbursement)
rather than using an estimator that separately models selection and level (e.g., a two part
model). We do this because accelerated disbursement may imply adding a larger number of
small disbursements in some cases and thus impact coeffi cient estimates in the level equation
in such a model. The speed-of-disbursement estimates in Section 4 above (e.g., months to
25% disbursed) circumvent this problem via aggregation that ignores the microstructure of
disbursement. A Tobit likewise would diminish the impact of adding small disbursements
since the same parameter reflects both the likelihood of a positive disbursement and the size
of that disbursement.14
[Figure 2 about here]
Equally important is the need to account for the typical disbursement schedule of World
Bank projects. Figure 2 displays the disbursement profiles of investment projects and DPLs,
averaged across projects by month. Disbursement for DPLs clearly tends to be front-loaded,
with falling disbursement shares throughout the life of the project. In contrast, investment
project disbursement profiles have a hump-shape with the largest disbursements (as a share
of total commitment) occurring at about three years after the beginning of the project. In
both cases, disbursement is not uniform over the project’s life cycle, and the probability of
a disbursement in a given month therefore depends on the age of the project. We include
a third-order polynomial in the duration of the project in our specification to control for
this kind of “loan life cycle” effect. Lastly, a key variable that is expected to influence
the frequency of disbursements is the overall size of the project. We thus include the total
commitment amount, both directly and interacted with the duration polynomial terms, to
control for project life cycle effects that may in turn differ depending on project size.
14 In principle, one could look at the unconditional marginal effect in a Heckman selection model but thereis no theoretical foundation for exclusion restrictions. The concern that added small disbursements couldimpact estimation results is borne out as estimation of a two part model yields selection equation resultsthat are consistent with the earlier speed-of-disbursement estimates and the Tobit results below but levelequation results which are not.
13

The complete specification is given by:
dijt = β1UNAlignemntjt + β2CEEjt + β3Xi + β4Zjt + β5Montht + β6Month2t + β7Month3t
+β8Project Sizei + β9Project Sizei ×Montht + β10Project Sizei ×Month2t
+β11Project Sizei ×Month3t + γj + εijt
Disbursementijt =
{dijt if dijt > 0
0 if dijt ≤ 0(2)
As before, the subscripts indicate project i in country j at time t. Month is the number
of months the project has been active. dijt is latent disbursement, observed as actual
disbursement (Disbursementijt) only when positive. Xi includes the IDA dummy as well
as lending instrument type and sector dummies. Zjt is the usual vector of macro variables,
i.e., inflation, log of GDP and log of population. The model estimated includes country
fixed effects (γj).15 Standard errors are clustered at the project level to allow for potential
within-project correlation.
[Table 6 about here]
Table 6 presents Tobit estimation results. Note that our analysis has shifted from “time”
to “amount” so positive values now indicate better access to World Bank resources. The
results of Column 2 are consistent with the global electioneering story for investment project
disbursements at the monthly frequency. While UN Alignment has no impact on latent
disbursements on average (Column 1), the interaction with CEE in Column 2 is positive and
statistically significant at the 5% level. In order to interpret this effect in terms of observable
disbursements, we use the estimates from Table 6, Column 2 to calculate the change in
expected disbursements due to elections (i.e., moving from CEE = 0 to CEE = 1) across
the range of values for UN Alignment with other variables held at their sample means.
Figure 3 presents the results.
[Figure 3 about here]
The solid line in Figure 3 is the estimated impact of an upcoming competitive executive
election at different levels of UN alignment with the U.S. in the preceding 12 months. The
15Because the unit of observation is the project-month, T >> N and country dummies can be estimatedconsistently.
14

dotted lines give the 90% confidence interval. The histogram at the bottom of the graph
indicates the distribution of the data, i.e., what share of the observations occurs at each UN
alignment value.16 The figure shows that for governments with low U.S. alignment (UN
alignment below 0.4, 43% of observed cases) expected disbursement is lower when there
is an election. This negative effect is statistically significant for UN alignment below 0.23
(16.8% of the observed cases). Conversely, for governments with high U.S. alignment (UN
alignment above 0.4, 57% of observed cases), expected disbursement is higher when there
is an election. This positive effect is statistically significant for UN alignment above 0.52
(31.7% of the observed cases).
Returning to Table 6, Columns 3 and 4 (and expected disbursement calculations shown
in Figure 4) confirm our previous result: the influence of elections is limited to investment
loans. Neither UN Alignment nor CEE has a statistically significant effect on monthly
disbursements of DPLs in the latent variable model. As shown in Figure 4, across the range
of values of UN alignment, expected disbursements are not statistically different when there
is an election.
[Figure 4 about here]
6 Commitment Analysis
As the third part of our analysis, we turn to the political economy of loan commitments.
This relates to the announcement effect—electioneering potentially takes the form of allowing
incumbent governments to announce new projects to boost their reelection prospects. As
this question needs to be analyzed at the country level, the country-month (rather than
the project-month) now becomes the unit of analysis and we aggregate across projects. In
addition, we include all months from our time period, not only those with active World
Bank projects. The result is a balanced, rectangular panel with 46,332 observations (143
countries with 324 monthly observations each—January 1984 to December 2010). We then
use data on eligibility for World Bank loans to reduce the sample to the relevant observations.
Information on IBRD and IDA eligibility is taken from Knack et al. (2012) and World Bank
(2014A-D).
[Table 7 about here]
16The histogram axis is omitted to simplify the figure.
15

Table 7 presents the summary statistics. Omitting periods of non-eligibility and cases
with missing data reduces the sample to 38,567 observations and 143 countries. There are
4,831 total non-zero observations for Commitment.17 This number is lower than the number
of projects in the disbursement analysis because of aggregation to the country-month level;
in some cases, there is more than one project per country-month. Note also that we only
consider the first commitment for each project in this analysis.18 The mean for CEE is
0.11. Of the 38,567 country-months in the sample, 4,087 fall into the ‘pre-election’category.
Formally, the specification we estimate is defined in terms of latent commitments (cjt):
cjt = β1UNAlignmentjt + β2CEEjt + β3Zjt + γj + γt + εjt
Commitmentjt =
{cjt if cjt > 0
0 if cjt ≤ 0(3)
Here Commitmentjt are new commitments of funds from the World Bank (either for in-
vestment projects only, DPLs only, or pooled depending on the specification) to country j
in period t. The vector of country-specific variables again controls for inflation, real GDP
and population. The model estimated includes year dummies (γt) and country fixed ef-
fects (γj).19 Standard errors are again clustered at the country level to allow for potential
within-country correlation.
[Table 8 about here]
Table 8 presents the results. Overall, there is evidence of geopolitical influence on new
World Bank commitments. The estimated coeffi cient on UN Alignment is positive, sizable
and statistically significant throughout. However, there is only weak evidence of an election
effect in Columns 1 and 5, and the statistical insignificance (and “wrong” sign) of the
interaction term means that this may simply reflect demand: administrations that face
an upcoming election may intensify their efforts to secure new loans, especially to finance
investment projects which do not come with politically unpopular conditions. Analyzing
the marginal effect of CEE on the expected level of commitments (based on estimates from
17This number refers to pooled commitments which can either by investment projects or DPLs. Separately,the number of non-zero observations is 4,187 for investment projects and 945 for DPLs.18There are 476 observations with additional commitments occurring at later points in the life of the
project. As these additional commitments presumably have little to no announcement value for local politi-cians, we omit them for this analysis. That is not to say that the question whether these ‘tagged-on’fundsare politically motivated is uninteresting; it is just one that falls outside the scope of this paper.19Again because we have monthly observations, T >> N and country dummies can be estimated consis-
tently.
16

Column 1), we find that an upcoming election increases expected new commitments for
investment projects by 15% relative to the case without an election. Turning to the marginal
effect of increasing alignment with the U.S. on the size of new DPL commitments, the
results reported in Column 3 imply that a two-standard-deviation increase raises expected
commitments by 16.7%. In sum, this analysis of new loan commitments does yield evidence
of geopolitical influence but no clear support for electioneering at the commitment phase.
7 Discussion and Robustness
In this section we examine alternative explanations for our results and assess their plausibil-
ity, considering both potential endogeneity and robustness. First, we focus on the exogeneity
of the timing of competitive elections. Elections sometimes occur before or after their orig-
inally scheduled date, which may violate the assumption that CEE is uncorrelated with the
error term, for example if the election date is changed by the incumbent to take advantage
of World Bank loan disbursements.20 NELDA election data identify elections that did not
occur at the originally scheduled date.21 We do not observe the exact reasons for moving
the date of the election so we take the most conservative stance and view all such elections
as potentially endogenous.
[Table 9 about here]
Table 9 shows that our results do not hinge on these suspect elections. Columns 1
through 4 replicate the main specifications from Table 2 (disbursement speed for investment
projects), Table 3 (disbursement speed for DPLs), and Table 6 (monthly disbursements for
investment projects and for DPLs). In each case, we use a sample that omits all observations
where the timing of elections may be endogenous.22 Comparing Column 1 of Table 9 with
Column 2 of Table 2 (disbursement speed for investment projects) we see that dropping
elections with changed dates shrinks the estimation sample by 460 observations from 5367
20Faye and Niehaus (2012) present evidence suggesting that endogenous election timing to take advantageof aid inflows is not prevalent. However in a different context, Ito (1990) finds that elections in Japan weretimed to take advantage of economic expansions.21We use the variable nelda6 which is the answer to the question: “If regular, were these elections early
or late relative to the date they were supposed to be held per established procedure?” In case the answer is“N/A”we referred to the election-specific notes to assess whether the timing of the election could have beeninfluenced by loan disbursements. In 36 out of 43 “N/A”cases we characterized the election as potentiallyendogenous. In total, 80 of the 316 competitive executive elections did not take place on schedule.22NELDA data do not generally allow us to identify endogenous “non-elections,” i.e., months that would
have had elections if the election date had not been changed.
17

projects to 4907 projects. This 8% reduction in the sample has little impact on the results
in terms of sign, size and significance. Turning to Column 2 of Table 9 as compared with
Column 2 of Table 3 (disbursement speed for DPLs), the sample shrinks by 42 observations
from 1014 to 972. This 4% reduction in the sample again has little impact; UN Alignment,
CEE, and their interaction remain far from significant (although the signs of the estimated
coeffi cients for UN Alignment and CEE do change). Likewise, Column 3 of Table 9 shows
little change from Column 2 of Table 6 (Tobit results for monthly disbursements to invest-
ment projects); the number of projects declines by 1, the number of monthly observations
falls from 401,857 to 391,790 (2.5%), and the sign, size and significance of CEE and the
interaction term change very little. The estimated coeffi cient on UN Alignment switches
from negative to positive but in any case remains small in absolute value and statistically
indistinguishable from zero. Finally, Column 4 of Table 9 compares with Column 4 of Table
6 (Tobit results for monthly disbursements to DPLs). Dropping elections with date changes
reduces the sample from 19,643 to 18,839 (4%). While the magnitude of some key coeffi -
cients changes, they remain statistically insignificant and their signs are unchanged. Instead
of omitting the observations with suspect elections one could alternatively set the value of
CEE to zero and keep the observation in the sample. This approach has the advantage of
leaving the number of observations unchanged. Our results are robust to this approach, as
well.
In addition to the question of endogenous election timing, we also explore the plausibility
of scenarios in which disbursement speed could impact UN voting. Consider an incumbent
executive whose preferences over UN votes align with the U.S. more than do those of their
constituents. Facing reelection, the incumbent can garner popular support either by catering
to domestic preferences regarding the UN or by providing public and private goods. When
World Bank funds disburse more quickly, the incumbent can provide more goods– instead
of altering its UN votes to pander to an anti-U.S. public. In this scenario, an exogenously
driven acceleration of World Bank disbursements increases UN voting alignment with the
U.S., i.e., there is reverse causation. Note that this scenario also implies that, in general, UN
voting alignment with the U.S. should be lower prior to elections (when unpopular actions
have more immediate consequences) than at other times. Yet we do not find this pattern in
the data. Using country/month data and regressing UN Alignment on CEE, the estimated
coeffi cient on CEE is positive (though not significant). We also find a positive relationship
with slightly more sophisticated specification that includes country dummies (to allow for
18

country variation in the UN voting patterns and in the frequency of competitive elections)
and time dummies (to allow for the downward trend in UN voting alignment with the U.S.
and the upward trend in the frequency of competitive elections). This pattern is inconsistent
with the reverse causation story just outlined.
Perhaps a simpler story of reverse causation is that incumbent governments expect
disbursements-for-votes and that expectation drives their UN voting. We are less concerned
with this story for several reasons. First, the pattern identified (faster disbursement prior
to competitive elections for incumbents aligned with the U.S.) also holds for UN votes not
designated “important”by the U.S. State Department, a pattern consistent with support for
a government with similar preferences rather than vote-buying per se. Second, there is little
reason to think that the U.S. would be more interested in buying votes from governments
facing a contested reelection than from other governments. Finally, the pattern would only
be observed if World Bank disbursements did indeed follow the expected disbursements-for-
votes behavior. Since this is the behavior we are trying to identify, it does not matter for
our purposes whether the UN votes happen because payment was anticipated or for other
reasons.
Turning to robustness, we subject our election measure to a variety of tests. First, we
experiment with different pre-election windows, including both 6 month and 18 month win-
dows. In the disbursement speed estimations, all results are robust to shortening the CEE
window to half a year. However, the results of the Tobit analysis on monthly data become
weaker, with the interaction term remaining positive but missing significance at the 10%
level. This finding underlines the notion that electioneering is by definition forward-looking;
by constructing the pre-election period too narrowly we run the danger of underestimating
the effect.
Lengthening the window to 18 months leaves all of our results intact. In fact, the Tobit
results for monthly project-level data are estimated with higher precision, suggesting that
even one year might fall short of the true window of influence of an upcoming election.
Next, we conduct a placebo test by examining non-competitive elections rather than
competitive ones. If the response we see in World Bank disbursements is an attempt to in-
fluence the outcome of elections, there is no reason to expect it in the case of non-competitive
elections where extra funding for friendly incumbents or reduced funding for unfriendly in-
cumbents would have no impact on the outcome. Consistent with this interpretation, we do
19

not find any significant election effects for the non-competitive cases.23
This paper focuses on U.S. influence in the World Bank– but could the pattern we find be
an indirect effect of U.S. influence in the IMF? Cross conditionality– where World Bank loan
disbursement depends on the borrowing government meeting IMF program conditions– is
another possible channel. We investigate this using data on new and ongoing IMF programs
from Dreher (2006– updated by Dreher to 2012). First, we include a dummy for new or
ongoing IMF programs in our speed of disbursement specification for investment project
loans. The estimated coeffi cient on the IMF dummy is close to zero and far from statisti-
cally significant and there is little impact on other coeffi cient estimates or their statistical
significance. Next we divide the sample between those observations with IMF programs
and those without. Estimation results are very similar to those reported earlier (e.g., Table
2, Column 2) for both sub-samples, strongly suggesting that our findings are unrelated to
events at the IMF.
Finally, we consider other alignment measures. As mentioned above, the key results
(negative and significance coeffi cients on UN Alignment and CEE × UN Alignment) hold
whether we consider alignment with the U.S. on important votes, other votes or all votes.
This acceleration of disbursements for aligned governments facing competitive elections also
holds if we instead use the ideal point estimates from Bailey et al. (2013), whether they are
based on all votes or important votes. Likewise, using UN voting alignment with the G7
yields similar results with a negative and significant coeffi cient on CEE × UN Alignment
again indicating accelerated disbursement for aligned governments facing competitive elec-
tions. Following Copelovitch (2010), we also consider a common agency framework and
explore the impact of heterogeneity in G7 preferences by including G7 UN alignment, the
variance of G7 UN alignment, and their interaction. The latter two terms prove insignifi-
cant, suggesting that preference heterogeneity does not play a significant role in determining
outcomes in this setting.24
23Non-competitive elections are all those elections not included in our previous analysis, i.e., electionswhere opposition is not allowed or where there was only one legal party or where there was no choice ofcandidates on the ballot. There are 13 non-competitive executive elections in the NELDA data for oursample (as compared to 316 competitive elections).24Nonetheless, there are notable differences between the roles of U.S. voting alignment and other G7
voting alignments. In addition, alignment with the U.S. on important and other votes is much more similarthan for other G7 countries– the opposite of what one might expect– especially when considering partnercountries outside of Europe. All this points to the need for further research on the determinants of UNvoting alignment.
20

8 Conclusion
This paper explores global electioneering in international financial institutions using the
case of the United States and the World Bank. We examine whether World Bank lending
favors the reelection of U.S.-friendly governments. There are several channels through which
lending can improve the reelection prospects of incumbent governments. Consequently, we
analyze the speed and magnitude of disbursements from existing loans as well as approval
of new loans. Identification of electioneering relies on the borrowing country’s geopolitical
alignment with the U.S. as indicated by voting behavior in the UN.
Using monthly data for over 6000 World Bank projects, we find that the disbursement of
investment project loans accelerates if a borrowing government faces an upcoming election
and has been voting with the U.S. in the UN. In the case of low geopolitical alignment with
the U.S., disbursement decelerates in the run-up to an election. Shifting from disbursement
speed (e.g., how quickly 25% of a loan disburses) to monthly disbursement amounts for
investment projects, a Tobit analysis yields similar results: expected disbursements increase
in the months before an election if the incumbent government is aligned with the U.S.
but decrease if the incumbent government is not aligned with the U.S. However, neither
analysis indicates such a political cycle for Development Policy Lending or in the case of
non-competitive elections where incumbent government victory is assured with or without
World Bank funds.
We also find new commitments (i.e., the awarding of new loans) depend on political
economy factors but in a different way. Geopolitical alignment with the U.S. results in more
commitments for investment projects as well as DPLs. There is a weak election effect but
this effect does not hinge on geopolitical alignment with the U.S. Thus, we cannot rule out
that demand by the borrowing government, rather than electioneering by the U.S., is the
driving factor in any link between loan commitments and elections.
The question of whether the World Bank engages in electioneering—a pattern of lending
that could bias election outcomes—is central for an organization that purports to be apolit-
ical. Certainly, the most political act for a development agency is interfering in a client’s
election process. Politicization of international financial institutions undermines the inter-
national order and risks reducing their development effectiveness in myriad ways. In our
example, accelerating disbursement could reduce oversight and create an environment ripe
for corruption. It may rush physical implementation, leading to ineffi ciencies, substandard
21

practices, and poor outcomes. Delaying disbursement could equally lower implementation
quality and set back project completion, reducing or postponing project benefits and thus
lowering the rate of return.
What is more, politicization changes the incentives borrowing governments and their
implementing agencies face because they expect the continued flow of funding to hinge on
geopolitics rather than successful implementation or economic impact. The threat to cut
aid due to poor economic performance is hardly credible when the recipient knows the aid
is politically motivated.
9 References
Akins, Michael E. 1981. United States Control over World Bank Group Decision-Making.Unpublished doctoral dissertation. University of Pennsylvania, Philadelphia.
Andersen, Thomas Barnebeck, Henrik Hansen, and Thomas Markussen. 2006. “US politicsand World Bank IDA-lending.”Journal of Development Studies 42(5):772-794.
Azevedo, J.P. 2011. “wbopendata: Stata module to access World Bank databases.”Statis-tical Software Components S457234, Boston College Department of Economics.
Bailey, Michael and Strezhnev, Anton and Voeten, Erik. 2013. “Estimating dynamic statepreferences from United Nations voting data.”Working Paper.
Barro, Robert and Jong Wha Lee. 2005. “IMF programs: Who is chosen and what are theeffects?”Journal of Monetary Economics 52(7):1245-1269.
Briggs, Ryan C. 2014. “Aiding and abetting: Project aid and ethnic politics in Kenya.”World Development 64:194-205.
Broz, J. Lawrence and Michael Brewster Hawes. 2006. “US domestic politics and inter-national monetary fund policy.”In Delegation and Agency in International Organizations,edited by Darren G. Hawkins, David A. Lake, Daniel L. Nielson and Michael J. Tierney.New York: Cambridge University Press.
Copelovitch, Mark S. 2010. “Master or servant? Common agency and the political economyof IMF lending.”International Studies Quarterly 54(1):49-77.
Dreher, Axel. 2003. “The influence of elections on IMF programme interruptions.”Journalof Development Studies 39(6):101-120.
Dreher, Axel. 2006. “IMF and economic growth: The effects of programs, loans, and com-pliance with conditionality.”World Development 34(5):769-788.
Dreher, Axel, and Nathan M. Jensen. 2007. “Independent actor or agent? An empiricalanalysis of the impact of US interests on IMF conditions.”Journal of Law and Economics50(1):105-124.
22

Dreher, Axel, Silvia Marchesi, and James Raymond Vreeland. 2008. “The political economyof IMF forecasts.”Public Choice 137:145-171.
Dreher, Axel, Jan-Egbert Sturm, and James Raymond Vreeland. 2009A. “Development aidand international politics: Does membership on the UN Security Council influence WorldBank decisions?”Journal of Development Economics 88:1-18.
Dreher, Axel, Jan-Egbert Sturm, and James Raymond Vreeland. 2009B. “Global horsetrading: IMF loans for votes in the United Nations Security Council.”European EconomicReview 53(7):742-757.
Dreher, Axel, and Roland Vaubel. 2004. “Do IMF and IBRD cause moral hazard andpolitical business cycles? Evidence from panel data.”Open Economies Review 15(1): 5-22.
Faye, Michael, and Paul Niehaus. 2012. “Political aid cycles.”American Economic Review102(7): 3516-3530.
Fleck, Robert K. and Christopher Kilby. 2006. “Word Bank independence: A model anstatistical analysis of U.S. influence.”Review of Development Economics 10(2):224-240.
Frey, Bruno and Friedrich Schneider. 1986. “Competing models of international lendingactivity.”Journal of Development Economics 20:225-245.
Hlavac, Marek. 2013. “The political economy of multilateral foreign aid: UNICEF as a toolof U.S. foreign policy.”Mimeo.
Hyde, Susan D., and Nikolay Marinov. 2012. “Which elections can be lost?” PoliticalAnalysis 20(2):191-201.
Ito, Takatoshi. 1990. “The timing of elections and political business cycles in Japan.”Jour-nal of Asian Economics 1(1):135-56.
Jablonski, Ryan. 2013. “How foreign aid affects election outcomes.”Working paper.
Jablonski, Ryan. 2014. “How aid targets votes: The impact of electoral incentives on for-eign aid distribution.”World Politics 66(2):293-330.
Kilby, Christopher. 2009. “The political economy of conditionality: An empirical analysisof World Bank loan disbursements.”Journal of Development Economics 89(1):51 61.
Kilby, Christopher. 2013A. “An empirical assessment of informal influence in the WorldBank.”Economic Development and Cultural Change 61(2):431-464.
Kilby, Christopher. 2013B. “The political economy of project preparation: An empiricalanalysis of World Bank projects.”Journal of Development Economics 105:211-225.
Kilby, Christopher. 2014. “Assessing the impact of World Bank preparation on projectoutcomes.”Villanova School of Business Economics Working Paper #20.
Knack, Stephen, F. Halsey Rogers, and Jac C. Heckelman. 2012. “Crossing the thresh-old: A positive analysis of IBRD graduation policy.”Review of International Organizations7(2):145-176.
23

Kuziemko, Ilyana and Eric Werker. 2006. “How much is a seat on the security coun-cil worth? Foreign aid and bribery at the United Nations.” Journal of Political Economy114(5): 905-930.
Mosley, Paul, Jane Harrigan, and John Toye. 1995. Aid and Power: The World Bank andPolicy-Based Lending in the 1980s, 2nd Ed. New York: Routledge.
Öhler, Hannes, and Peter Nunnenkamp. 2013. “Needs-based targeting or favoritism? Theregional allocation of multilateral aid within recipient countries.”Kiel Working Paper No.1838.
Schneider, Christina J. 2013. “Globalizing electoral politics: Political competence and dis-tributional bargaining in the European Union.”World Politics 65(3):452-490.
Strezhnev, Anton and Erik Voeten. 2013. United Nations General Assembly Voting Data.http://hdl.handle.net/1902.1/12379 UNF:5:s7mORKL1ZZ6/P3AR5Fokkw== Erik Voeten
[Distributor] V7 [Version]
Thacker, Strom C. 1999. “The high politics of IMF lending.”World Politics 52:38-75.
United Nations (UN). 2014. Countries Elected Members of the Security Council.http://www.un.org/en/sc/members/elected.asp Accessed June 16, 2014.
U.S. State Department. 1984-2012. Voting Practices in the United Nations. GPO, Wash-ington.
Vreeland, James Raymond, and Axel Dreher. 2014. The Political Economy of the UnitedNations Security Council: Money and Influence. New York: Cambridge University Press.
Weck Hannemann, Hannelore and Friedrich Schneider. 1991. “Determinants of foreign aidunder alternative institutional arrangements.” In Roland Vaubel and Thomas D. Willett(Eds.), The Political Economy of International Organizations: A Public Choice Approach,245 266. Boulder: Westview.
World Bank. 2013. World Bank Projects Database. http://go.worldbank.org/KPMUDAVVT0Accessed September 17, 2013.
World Bank. 2014A. IBRD Members. http://go.worldbank.org/65RBCJ2IW0 AccessedJuly 14, 2014.
World Bank. 2014B. IDA Borrowing Countries. http://www.worldbank.org/ida/borrowing-countries.html Accessed July 14, 2014.
World Bank. 2014C. IDA Graduates. http://www.worldbank.org/ida/ida-graduates.htmlAccessed July 14, 2014
World Bank. 2014D. Member Countries. http://www.worldbank.org/en/about/leadership/membersAccessed July 14, 2014.
World Bank. 2014E. World Development Indicators. Accessed via wbopendata June 16,2014.
24

0
20
40
60
80
100
Cum
ulat
ive
% D
isbu
rsed
0 12 24 36 48 60 72 84 96 108 120Months
Investment Projects DPLs
Cumulative Disbursement by Type
Figure 1: Cumulative Disbursement by Type
0
2
4
6
8
10
Mon
thly
% D
isbu
rsed
0 12 24 36 48 60 72 84 96 108 120Months
Investment Projects DPLs
(5 month rectangular smoothing)Disbursement Patterns by Type
Figure 2: Disbursement Patterns by Type
25

Figure 3: Impact of Elections on Expected Disbursement for Investment Projects
Figure 4: Impact of Elections on Expected Disbursement for DPLs
26
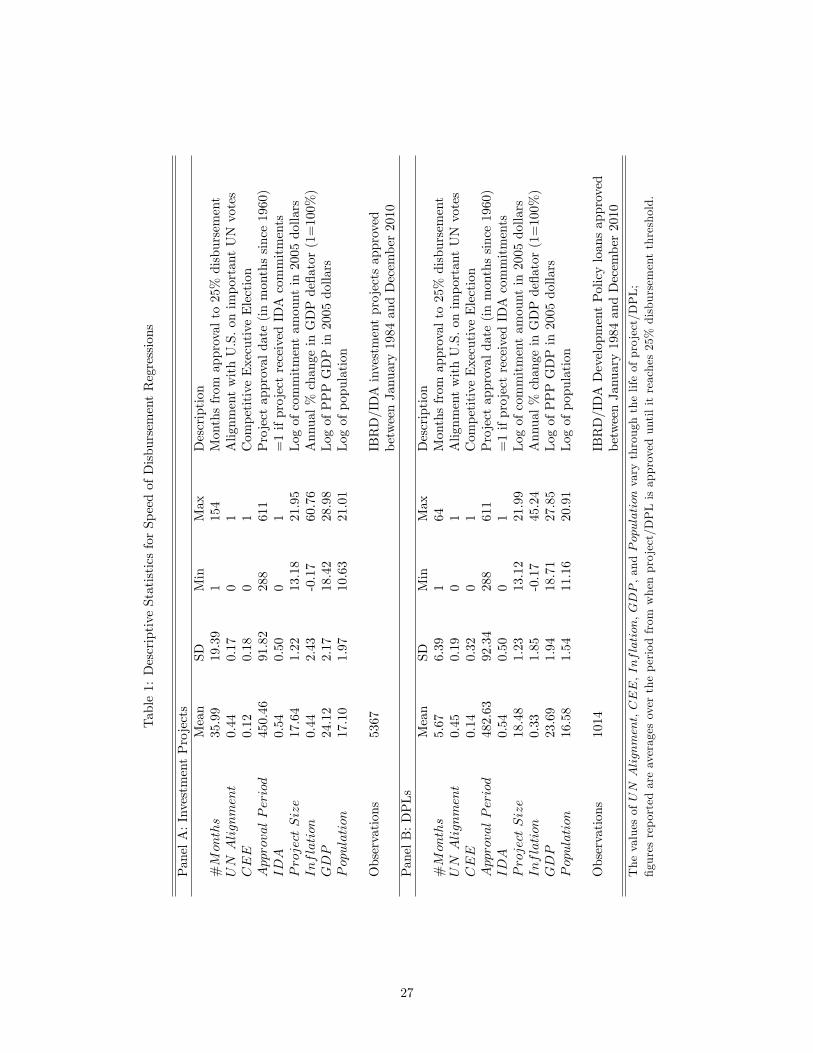
Table1:DescriptiveStatisticsforSpeedofDisbursementRegressions
PanelA:InvestmentProjects
Mean
SDMin
Max
Description
#Months
35.99
19.39
1154
Monthsfrom
approvalto25%disbursement
UNAlignment
0.44
0.17
01
AlignmentwithU.S.onimportantUNvotes
CEE
0.12
0.18
01
CompetitiveExecutiveElection
ApprovalPeriod
450.46
91.82
288
611
Projectapprovaldate(inmonthssince1960)
IDA
0.54
0.50
01
=1ifprojectreceivedIDAcommitments
ProjectSize
17.64
1.22
13.18
21.95
Logofcommitmentamountin2005dollars
Inflation
0.44
2.43
-0.17
60.76
Annual%changeinGDPdeflator(1=100%)
GDP
24.12
2.17
18.42
28.98
LogofPPPGDPin2005dollars
Population
17.10
1.97
10.63
21.01
Logofpopulation
Observations
5367
IBRD/IDAinvestmentprojectsapproved
betweenJanuary1984andDecember2010
PanelB:DPLs
Mean
SDMin
Max
Description
#Months
5.67
6.39
164
Monthsfrom
approvalto25%disbursement
UNAlignment
0.45
0.19
01
AlignmentwithU.S.onimportantUNvotes
CEE
0.14
0.32
01
CompetitiveExecutiveElection
ApprovalPeriod
482.63
92.34
288
611
Projectapprovaldate(inmonthssince1960)
IDA
0.54
0.50
01
=1ifprojectreceivedIDAcommitments
ProjectSize
18.48
1.23
13.12
21.99
Logofcommitmentamountin2005dollars
Inflation
0.33
1.85
-0.17
45.24
Annual%changeinGDPdeflator(1=100%)
GDP
23.69
1.94
18.71
27.85
LogofPPPGDPin2005dollars
Population
16.58
1.54
11.16
20.91
Logofpopulation
Observations
1014
IBRD/IDADevelopmentPolicyloansapproved
betweenJanuary1984andDecember2010
ThevaluesofUNAlignment,CEE,Inflation,GDP,andPopulationvarythroughthelifeofproject/DPL;
figuresreportedareaveragesovertheperiodfrom
whenproject/DPLisapproveduntilitreaches25%disbursementthreshold.
27

Table 2: Time to 25%+ Disbursement, Investment Projects
(1) (2) (3) (4)
UN Alignment -24.92*** -19.94*** -13.07** -10.06*(-4.17) (-3.15) (-2.48) (-1.81)
CEE -1.686 20.24*** -4.045** 10.14(-0.94) (2.85) (-2.22) (1.64)
× UN Alignment -45.98*** -29.32**(-3.36) (-2.46)
Approval Period -0.248*** -0.254*** -0.205*** -0.209***(-7.39) (-7.56) (-6.22) (-6.35)
IDA -0.200 -0.335 0.861 0.752(-0.15) (-0.25) (0.63) (0.55)
Project Size -1.294** -1.272** -1.026* -1.022*(-2.28) (-2.22) (-1.91) (-1.89)
Inflation -0.0914 -0.0937 -0.434** -0.442**(-0.30) (-0.31) (-2.50) (-2.56)
GDP 19.28*** 20.32*** 21.54*** 22.20***(5.20) (5.29) (5.54) (5.59)
Population 60.47*** 61.32*** 52.53*** 53.09***(4.68) (4.78) (4.30) (4.38)
Observations 5367 5367 4559 4559
t statistics in parentheses based on country-clustered standard errors. All specifications include un-reported country, lending instrument type and sector dummies. Dependent variable is #Months, thenumber of months to reach 25% disbursement. UN Alignment is voting coincidence with the U.S. onUNGA votes designated as important by the U.S. State Department. CEE indicates overlap with the12 month period prior to a competitive executive election. Approval Period is the project approvaldate measured in months since 1960. IDA is a dummy variable indicating projects that receive IDAcommitments. Project Size is the log of the commitment amount in 2005 dollars. Inflation is thepercentage change in the GDP deflator. GDP is the log of PPP GDP in 2005 dollars. Population isthe log of population. UN Alignment, CEE, Inflation, GDP , and Population are period averages.(1) and (2) include investment projects that reach (or exceed) 25% disbursements in our data as wellas those that end before reaching 25% disbursement or that have not yet reached 25% disbursement atthe end of our sample (December 2010).(3) and (4) include only investment projects that reach (or exceed) 25% disbursements in our data.***<0.01 **<0.05 *<0.1
28

Table 3: Time to 25%+ Disbursement, DPLs
(1) (2) (3) (4)
UN Alignment -0.675 -0.466 0.112 0.117(-0.35) (-0.23) (0.07) (0.07)
CEE -0.208 0.537 -0.242 -0.225(-0.39) (0.47) (-0.51) (-0.21)
× UN Alignment -1.568 -0.0354(-0.61) (-0.02)
Approval Period -0.0290*** -0.0291** -0.0330*** -0.0330***(-2.64) (-2.64) (-3.93) (-3.92)
IDA 0.381 0.411 0.353 0.353(0.23) (0.25) (0.22) (0.21)
Project Size -0.458 -0.452 -0.755** -0.755**(-1.10) (-1.08) (-2.07) (-2.05)
Inflation 0.122 0.119 -0.0295 -0.0296(0.84) (0.82) (-0.81) (-0.81)
GDP 6.255*** 6.255*** 5.454*** 5.454***(2.90) (2.89) (2.81) (2.81)
Population -1.474 -1.428 0.733 0.734(-0.44) (-0.42) (0.27) (0.27)
Observations 1014 1014 988 988
t statistics in parentheses based on country-clustered errors. All specifications include unreported country,lending instrument type and sector dummies. Dependent variable is #Months, the number of months toreach 25% disbursement. UN Alignment is voting coincidence with the U.S. on UNGA votes designatedas important by the U.S. State Department. CEE indicates overlap with the 12 month period prior to acompetitive executive election. Approval Period is the project approval date measured in months since1960. IDA is a dummy variable indicating projects that receive IDA commitments. Project Size is thelog of the commitment amount in 2005 dollars. Inflation is the percentage change in the GDP deflator.GDP is the log of PPP GDP in 2005 dollars. Population is the log of population. UN Alignment, CEE,Inflation, GDP , and Population are period averages.(1) and (2) include DPLs that reach (or exceed) 25% disbursements in our data as well as those that endbefore reaching 25% disbursement or that have not yet reached 25% disbursement at the end of our sample(December 2010).(3) and (4) include only DPLs that reach (or exceed) 25% disbursements in our data.***<0.01 **<0.05 *<0.1
29

Table4:Timeto25%,50%,and75%Disbursement
(1)
(2)
(3)
(4)
(5)
(6)
UNAlignment
-19.94***
-28.29**
-37.95**
-0.466
-5.652
-15.17***
(-3.15)
(-2.44)
(-2.45)
(-0.23)
(-1.46)
(-2.77)
CEE
20.24***
43.37***
66.97***
0.537
1.507
1.146
(2.85)
(3.15)
(3.46)
(0.47)
(0.55)
(0.35)
×UNAlignment
-45.98***
-90.08***
-134.1***
-1.568
-0.523
1.385
(-3.36)
(-3.33)
(-3.42)
(-0.61)
(-0.09)
(0.18)
Observations
5367
5367
5367
1014
1014
1014
tstatisticsinparenthesesbasedoncountry-clusteredstandarderrors.AllspecificationsincludeApprovalPeriod,IDA,Project
Size,Inflation,GDP,andPopulationaswellascountry,lendinginstrumenttypeandsectordummies.UNAlignmentisvoting
coincidencewiththeU.S.onUNGAvotesdesignatedasimportantbytheU.S.StateDepartment.CEEindicatesoverlapwiththe
12Monthperiodpriortoacompetitiveexecutiveelection.UNAlignmentandCEEareperiodaverages.
(1)Dependentvariableisnumberofmonthstoreach25%disbursementforinvestmentprojects(repeatsTable2,Column2)
(2)Dependentvariableisnumberofmonthstoreach50%disbursementforinvestmentprojects
(3)Dependentvariableisnumberofmonthstoreach75%disbursementforinvestmentprojects
(4)Dependentvariableisnumberofmonthstoreach25%disbursementforDPLs(repeatsTable3,Column2)
(5)Dependentvariableisnumberofmonthstoreach50%disbursementforDPLs
(6)Dependentvariableisnumberofmonthstoreach75%disbursementforDPLs
***<0.01**<0.05*<0.1
30

Table5:DescriptiveStatisticsforDisbursementTobit
PanelA:InvestmentProjects
Frequency
Mean
SDMin
Max
Description
Disbursem
ent
monthly
6.19
6.74
019.96
Logof(disbursementamount+1)
UNAlignment
monthly
0.43
0.19
01
AlignmentwithU.S.onimportantUNvotes
CEE
monthly
0.12
0.32
01
CompetitiveExecutiveElection
IDA
byproject
0.54
0.50
01
=1ifprojectreceivedIDAcommitments
ProjectSize
byproject
17.72
1.18
13.18
21.95
Logofcommitmentamount
Inflation
annual
0.50
5.09
-0.29
267.62
Annual%changeinGDPdeflator(1=100%)
GDP
annual
24.20
2.18
18.42
28.98
LogofPPPGDPin2005dollars
Population
annual
17.19
1.98
10.62
21.01
Logofpopulation
No.ofprojects
5367
No.ofobservations
401857
PanelB:DPLs
Frequency
Mean
SDMin
Max
Description
Disbursem
ent
monthly
4.34
6.94
021.99
Logof(disbursementamount+1)
UNAlignment
monthly
0.48
0.18
01
AlignmentwithU.S.onimportantUNvotes
CEE
monthly
0.15
0.35
01
CompetitiveExecutiveElection
IDA
byproject
0.57
0.50
01
=1ifprojectreceivedIDAcommitments
ProjectSize
byproject
18.62
1.11
13.12
21.99
Logofcommitmentamount
Inflation
annual
0.37
1.91
-0.17
45.24
Annual%changeinGDPdeflator(1=100%)
GDP
annual
23.45
1.88
18.71
27.85
LogofPPPGDPin2005dollars
Population
annual
16.44
1.36
11.16
20.91
Logofpopulation
No.ofprojects
1014
No.ofobservations
19643
Inthecaseofanegativevaluefordisbursement,disbursedamountissettozero.
Disbursementandcommitmentamountsarein2005dollarsbasedonapprovalyear.
31

Table 6: Tobit Analysis of Disbursements at the Project/Month Level - InvestmentProjects vs. DPLs
(1) (2) (3) (4)
UN Alignment 0.138 -0.0389 -4.122 -4.092(0.25) (-0.07) (-1.50) (-1.48)
CEE 0.0649 -0.654** -0.126 0.0166(0.63) (-2.17) (-0.20) (0.01)
× UN Alignment 1.590** -0.278(2.54) (-0.08)
IDA 0.0537 0.0584 1.324 1.328(0.16) (0.17) (0.57) (0.57)
Inflation -0.0747*** -0.0747*** -0.267 -0.267(-6.76) (-6.76) (-1.58) (-1.58)
GDP -0.537 -0.580 -8.485*** -8.484***(-1.13) (-1.22) (-3.60) (-3.60)
Population 4.059*** 4.042*** -8.862 -8.866(3.41) (3.40) (-1.54) (-1.54)
Projects 5367 5367 1014 1014Observations 401857 401857 19643 19643
t statistics in parentheses based on project-clustered standard errors. The dependent variable is logof (disbursement + 1). All Tobit specifications include unreported country, lending instrument typeand sector dummies. The lower limit for the Tobit is zero. All specifcations also include controls fordisbursement timing, namely a third-order polynomial in the age of the project in months. In addition,the size of the project is controlled for both separately and in the form of interactions with the projecttime variables (see text for full specification). UN Alignment is voting coincidence with the U.S. onUNGA votes designated as important by the U.S. State Department. CEE indicates overlap with the 12month period prior to a competitive executive election. Inflation is the percentage change in the GDPdeflator. GDP is the log of PPP GDP in 2005 dollars. Population is the log of population.(1) and (2) present results for investment projects, (3) and (4) present results for DPLs.***<0.01 **<0.05 *<0.1
32

Table7:DescriptiveStatisticsforCommitmentAnalysis
Mean
SDMin
Max
Description
Com
mitment(INV)
1.93
5.53
021.95
Logof(commitmentamountforinvestmentprojects+1)
Com
mitment(DPL)
0.45
2.87
021.98
Logof(commitmentamountforDPLs+1)
Com
mitment(pooled)
2.24
5.95
022.11
Logof(totalcommitmentamount+1)
UNAlignment
0.46
0.20
01
AlignmentwithU.S.onimportantUNvotes
CEE
0.11
0.31
01
CompetitiveExecutiveElection
Inflation
0.65
6.75
-0.30
267.62
Annual%changeinGDPdeflator(1=100%)
GDP
22.89
2.02
18.42
28.98
LogofPPPGDPin2005dollars
Population
15.68
1.96
10.62
21.01
Logofpopulation
No.ofcountries
143
No.ofobservations
38567
Commitmentamountsin2005dollars.
33

Table8:TobitAnalysisofCommitments
(1)
(2)
(3)
(4)
(5)
(6)
INVprojects
INVprojects
DPLprojects
DPLprojects
Allprojects
Allprojects
UNAlignment
6.674*
6.986*
17.17***
15.65**
8.577**
8.612**
(1.75)
(1.83)
(2.65)
(2.44)
(2.32)
(2.35)
CEE
1.407*
2.901
1.406
-4.385
1.333*
1.500
(1.82)
(1.53)
(0.96)
(-1.13)
(1.72)
(0.85)
×UNAlignment
-3.134
12.15
-0.350
(-0.87)
(1.59)
(-0.10)
Inflation
-0.00533***
-0.00534***
-0.00512*
-0.00507*
-0.00490***
-0.00490***
(-3.29)
(-3.28)
(-1.73)
(-1.71)
(-4.00)
(-4.00)
GDP
2.360
2.394
1.444
1.368
1.753
1.757
(0.91)
(0.92)
(0.29)
(0.27)
(0.68)
(0.69)
Population
4.745
4.721
17.22*
17.12*
6.034
6.032
(0.72)
(0.72)
(1.95)
(1.95)
(0.99)
(0.99)
Observations
38567
38567
38567
38567
38567
38567
tstatisticsinparenthesesbasedoncountry-clusteredstandarderrors.Dependentvariableisthelogof(commitment+1).Onlyfirstcommitmentsareconsidered.
Allspecificationsincludeunreportedcountryandyeardummies.
***<0.01**<0.05*<0.1
34

Table9:ResultsforRegularlyScheduledElectionsOnly
(1)
(2)
(3)
(4)
DependentVariable
monthsto25%disbursed
monthsto25%disbursed
(log)disbursement
(log)disbursement
LendingInstrumentType
Investmentproject
DPL
InvestmentProject
DPL
Estimation
Method
OLS
OLS
Tobit
Tobit
UNAlignment
-17.93***
0.274
0.00184
-3.911
(-2.84)
(0.14)
(0.00)
(-1.41)
CEE
22.04***
0.0623
-0.682**
0.920
(2.73)
(0.05)
(-2.10)
(0.43)
×UNAlignment
-44.83***
-1.275
1.684**
-1.648
(-2.95)
(-0.45)
(2.47)
(-0.42)
ApprovalPeriod
-0.250***
-0.0260**
(-7.08)
(-2.38)
IDA
-0.580
-0.175
0.0508
1.409
(-0.41)
(-0.10)
(0.15)
(0.59)
ProjectSize
-1.551***
-0.468
(-2.66)
(-1.07)
Inflation
-0.0442
0.122
-0.0759***
-0.269
(-0.15)
(0.80)
(-6.83)
(-1.55)
GDP
20.47***
5.235***
-0.544
-8.440***
(5.22)
(2.80)
(-1.14)
(-3.61)
Population
61.05***
-1.320
4.335***
-7.560
(4.46)
(-0.39)
(3.62)
(-1.31)
Projects
4907
972
5366
1004
Observations
4907
972
391790
18839
tstatisticsinparenthesesbasedoncountry-clusteredstandarderrors(Columns(1)and(2))orproject-clusteredstandarderrors(Columns(3)and(4)).
Column(1)correspondstoColumn(2)ofTable2.Column(2)correspondstoColumn(2)ofTable3.Columns(3)and(4)correspondtoColumns(2)and(4)of
Table6.Theestimationsamplesomitpotentiallyendogenouslytimedelections.Thespecificationisunchanged;fordetailednotespleaserefertotheearliertables.
***<0.01**<0.05*<0.1
35