wisconsin economic summit | 10.05.10 money makes the world
TRANSCRIPT

Wisconsin Economic Summit | 10.05.10
Money makes the world . . .
Wisconsin Economic Summit | 10.05.10
Money makes the world . . .
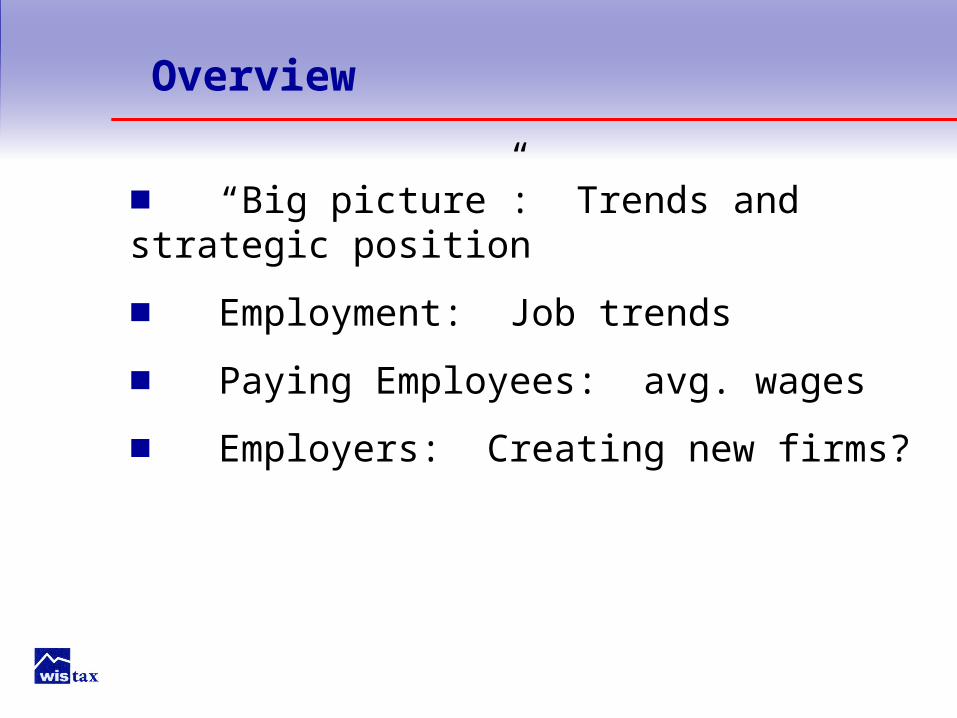
■ “Big picture”: Trends and strategic position
■ Employment: Job trends
■ Paying Employees: avg. wages
■ Employers: Creating new firms?
Overview
Economy
Revenues
Budgets
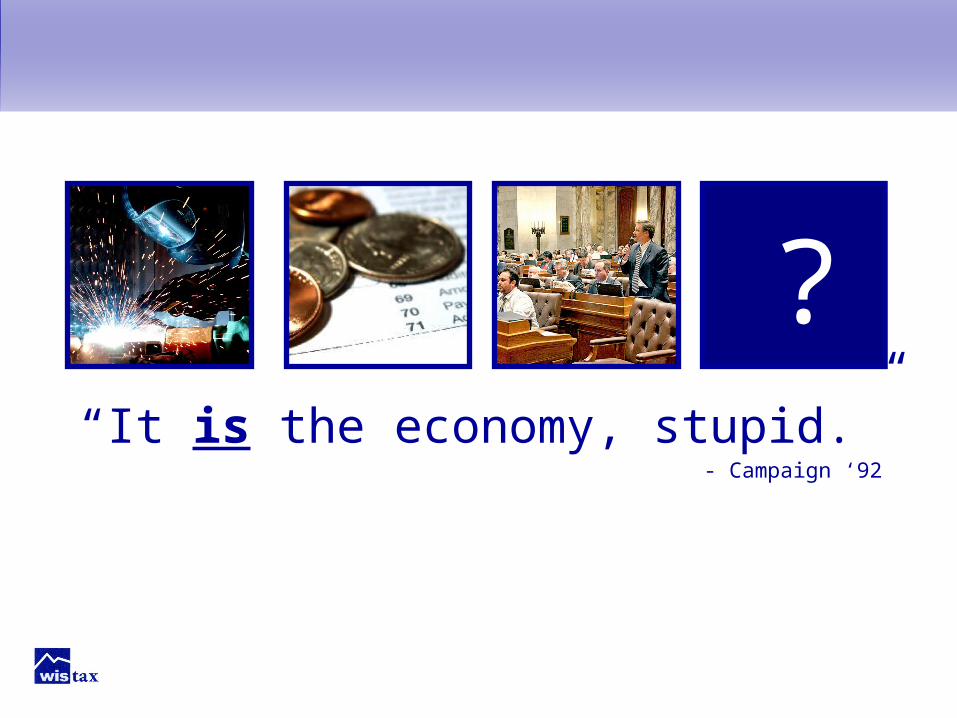
?“It is the economy, stupid.”
- Campaign ‘92
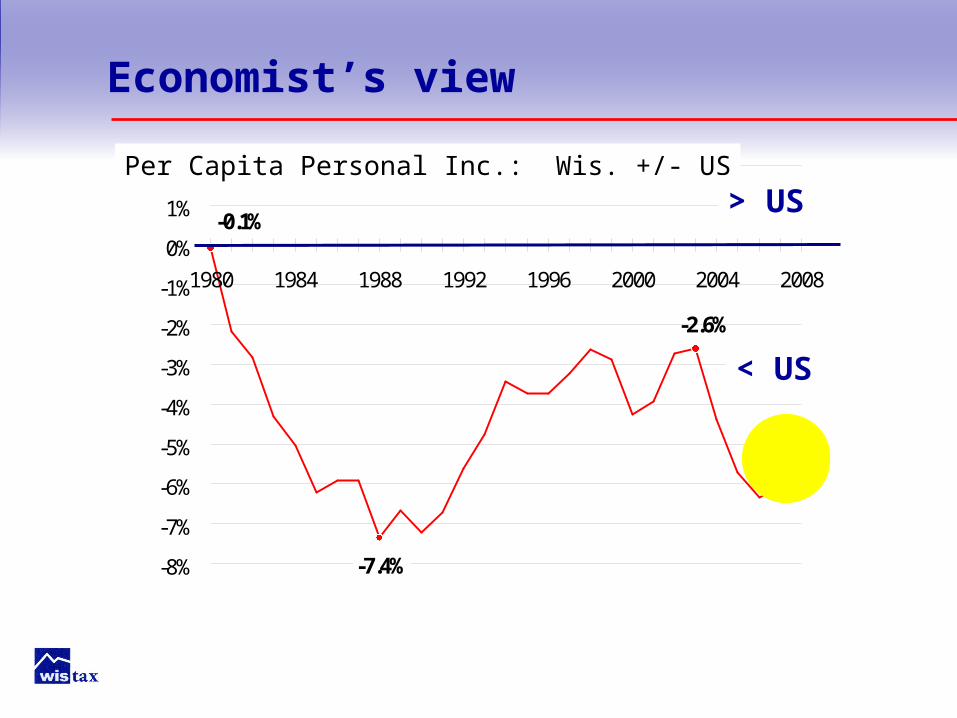
-7.4%
-2.6%
-0.1%
-6.1%
-8%
-7%
-6%
-5%
-4%
-3%
-2%
-1%
0%
1%
2%
1980 1984 1988 1992 1996 2000 2004 2008
WI
Per Capita Personal Inc.: Wis. +/- US
> US
< US
Economist’s view

1.93%
1.90% 1.86%
1.77%
2.08%
1.77%
1.87%
1.70%
2.10%
1.50%
1.75%
2.00%
2.25%
1963 1971 1979 1987 1995 2003
MN
WI
Wis. % of US GDP
Marketer’s view
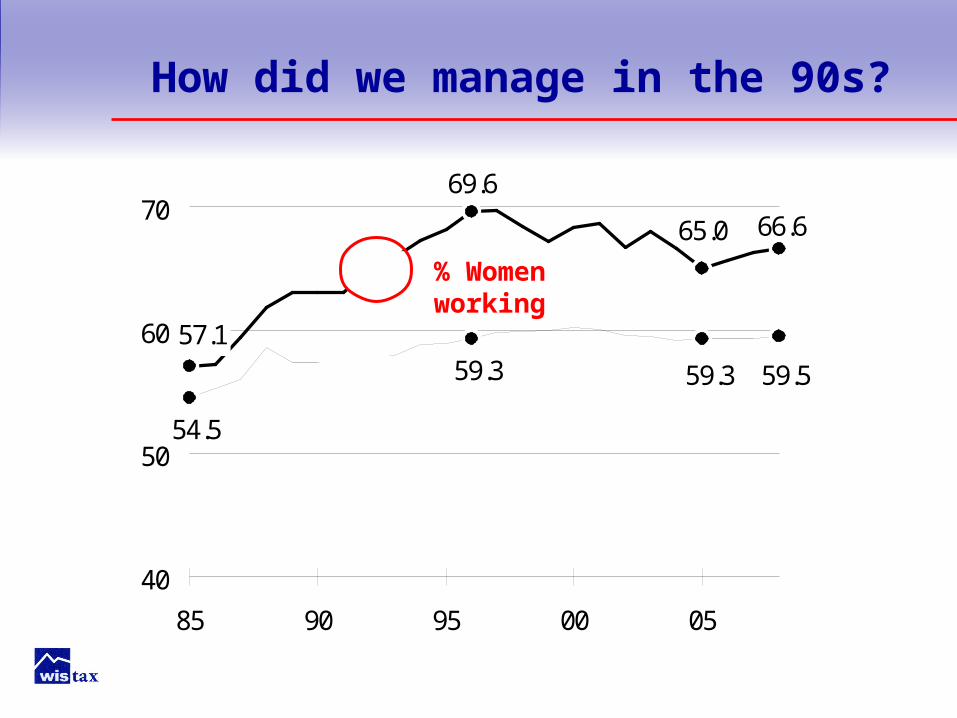
66.665.0
69.6
57.1
59.559.359.3
54.5
40
50
60
70
85 90 95 00 05
Wis.
U.S.
How did we manage in the 90s?
% Women working
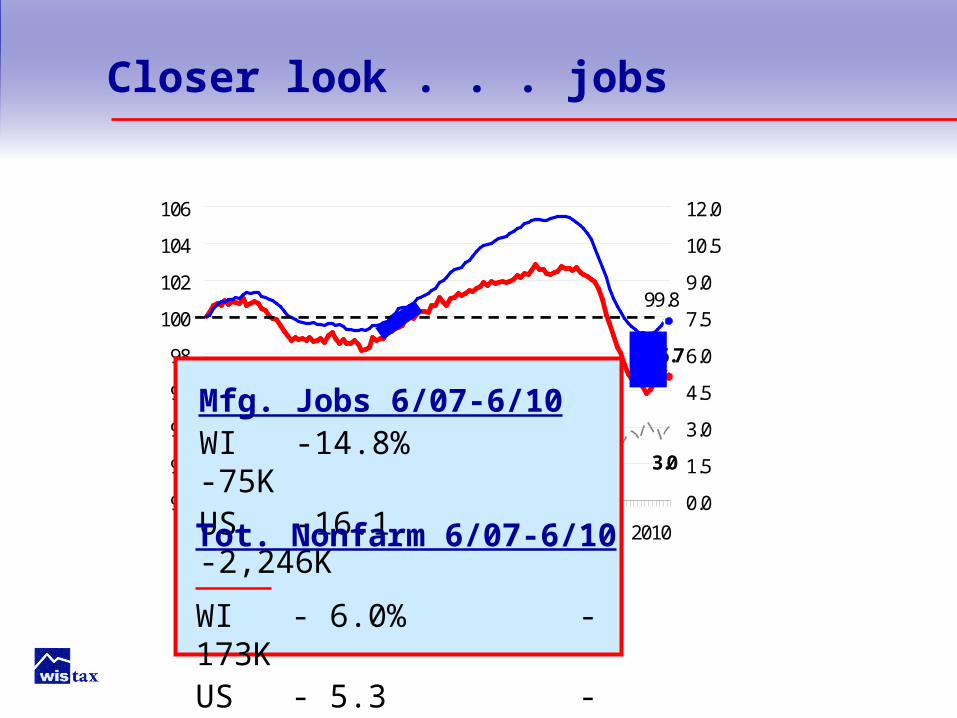
96.7
99.8
3.0
90
92
94
96
98
100
102
104
106
2000 2002 2004 2006 2008 2010
0.0
1.5
3.0
4.5
6.0
7.5
9.0
10.5
12.0
US - WI difference
US
WI
Mfg. Jobs 6/07-6/10WI -14.8%-75KUS -16.1 -2,246KTot. Nonfarm 6/07-6/10 WI - 6.0% - 173KUS - 5.3 -7,236K
Closer look . . . jobs
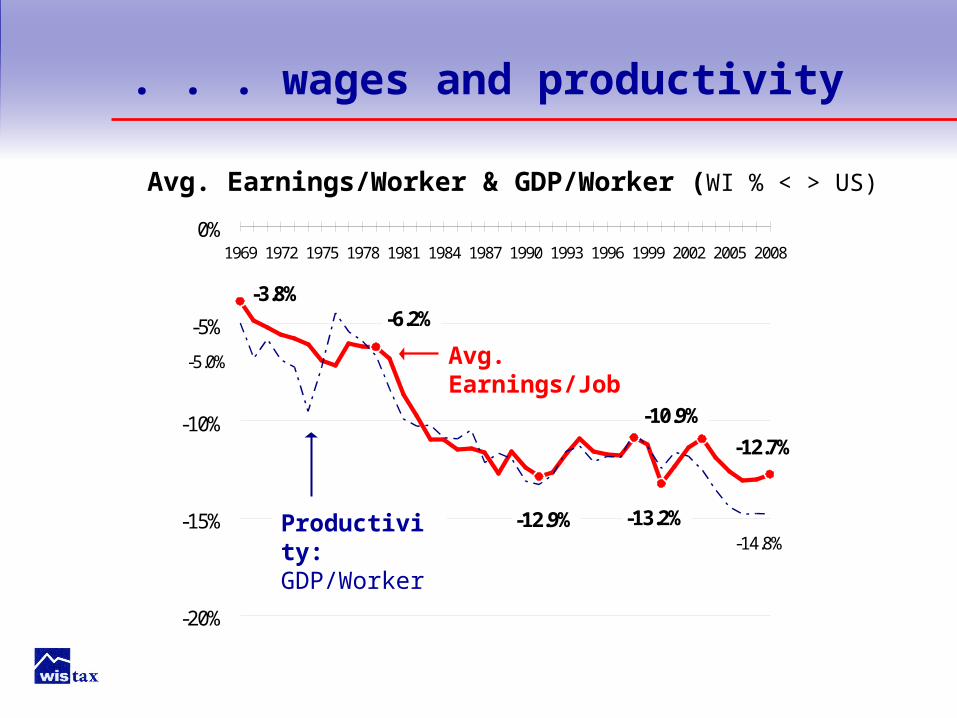
Avg. Earnings/Worker & GDP/Worker (WI % < > US)
-3.8%-6.2%
-12.9%
-10.9%
-13.2%
-12.7%
-14.8%
-5.0%
-20%
-15%
-10%
-5%
0%1969 1972 1975 1978 1981 1984 1987 1990 1993 1996 1999 2002 2005 2008
Productivity:GDP/Worker
Avg. Earnings/Job
. . . wages and productivity
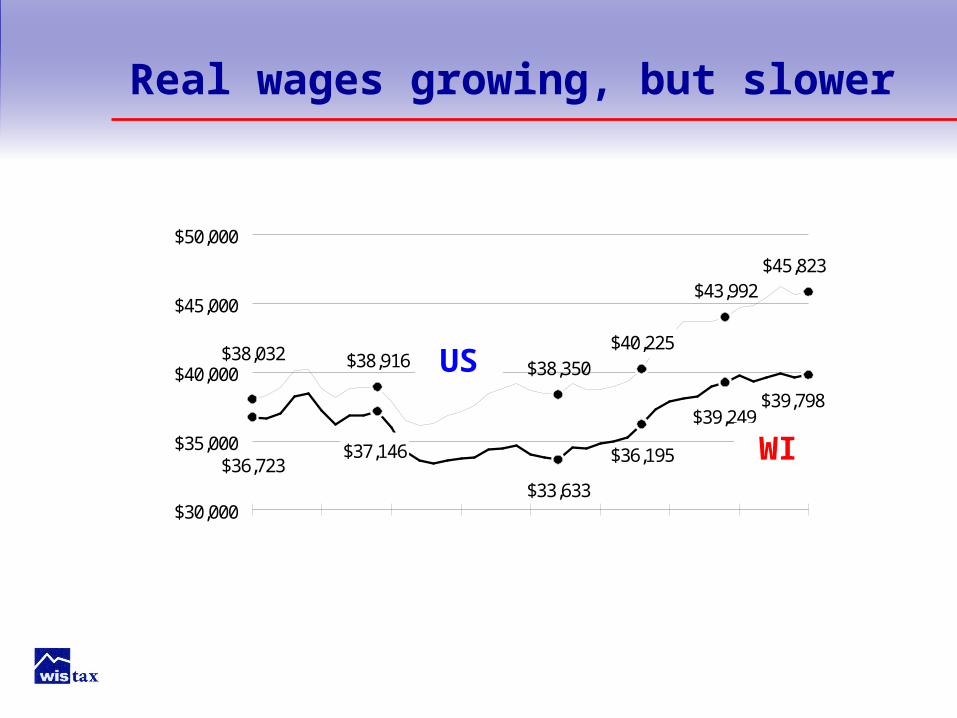
$45,823$43,992
$40,225$38,350$38,916$38,032
$36,723$37,146
$33,633
$36,195
$39,249$39,798
$30,000
$35,000
$40,000
$45,000
$50,000
Real wages growing, but slower
WI
US
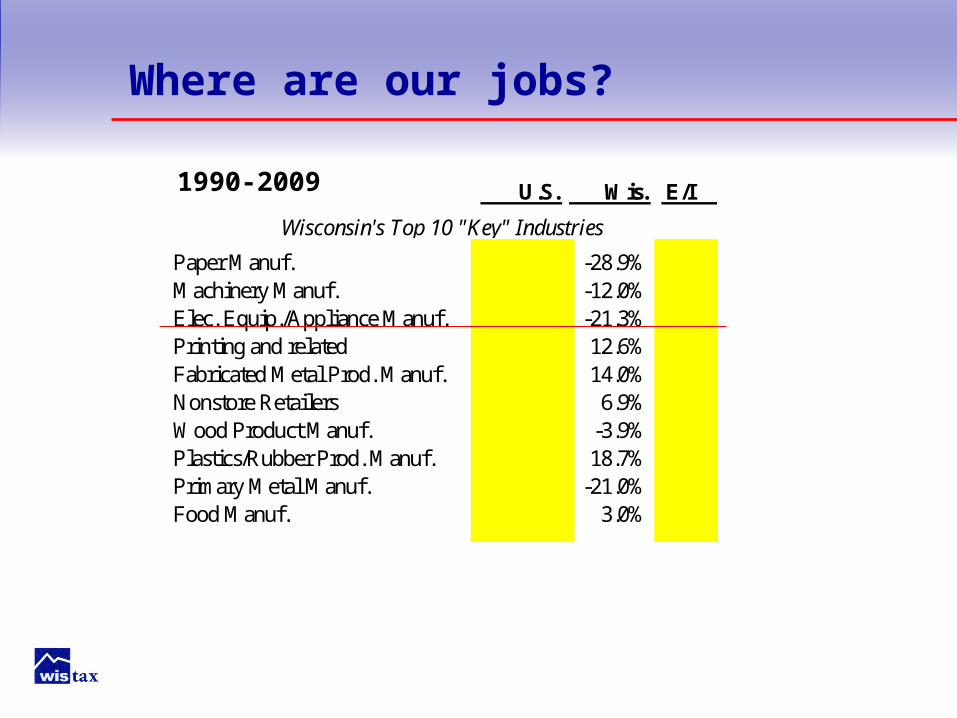
U.S. Wis. E/I
Paper Manuf. -32.4% -28.9% Exp
Machinery Manuf. -16.3% -12.0% E
Elec. Equip./Appliance Manuf. -31.4% -21.3% E
Printing and related -28.8% 12.6% E
Fabricated Metal Prod. Manuf. -3.1% 14.0% E
Nonstore Retailers -7.9% 6.9% E
Wood Product Manuf. -15.1% -3.9% E
Plastics/Rubber Prod. Manuf. -6.7% 18.7% E
Primary Metal Manuf. -34.9% -21.0% E
Food Manuf. -2.4% 3.0% E
Wisconsin's Top 10 "Key" Industries
Where are our jobs?
1990-2009
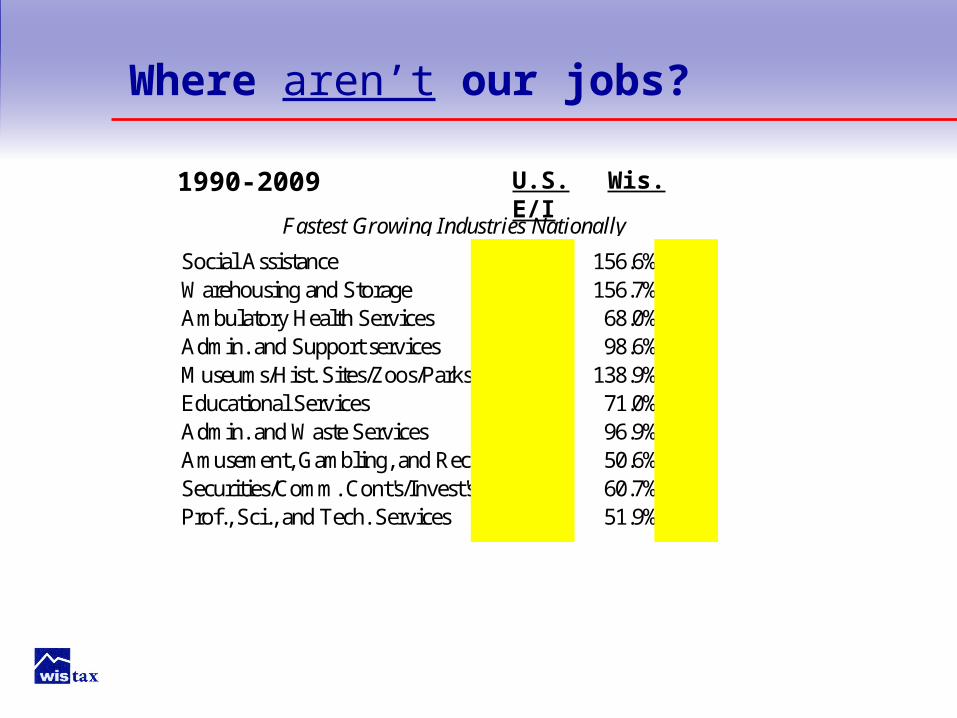
Where aren’t our jobs?
Social Assistance 104.4% 156.6% ~Exp
Warehousing and Storage 95.9% 156.7% Imp
Ambulatory Health Services 87.3% 68.0% I
Admin. and Support services 78.9% 98.6% I
Museums/Hist. Sites/Zoos/Parks 78.4% 138.9% I
Educational Services 78.0% 71.0% I
Admin. and Waste Services 75.8% 96.9% I
Amusement, Gambling, and Rec. 74.4% 50.6% I
Securities/Comm. Cont's/Invest's 70.3% 60.7% I
Prof., Sci., and Tech. Services 61.4% 51.9% I
Fastest Growing Industries Nationally
1990-2009
U.S. Wis. E/I
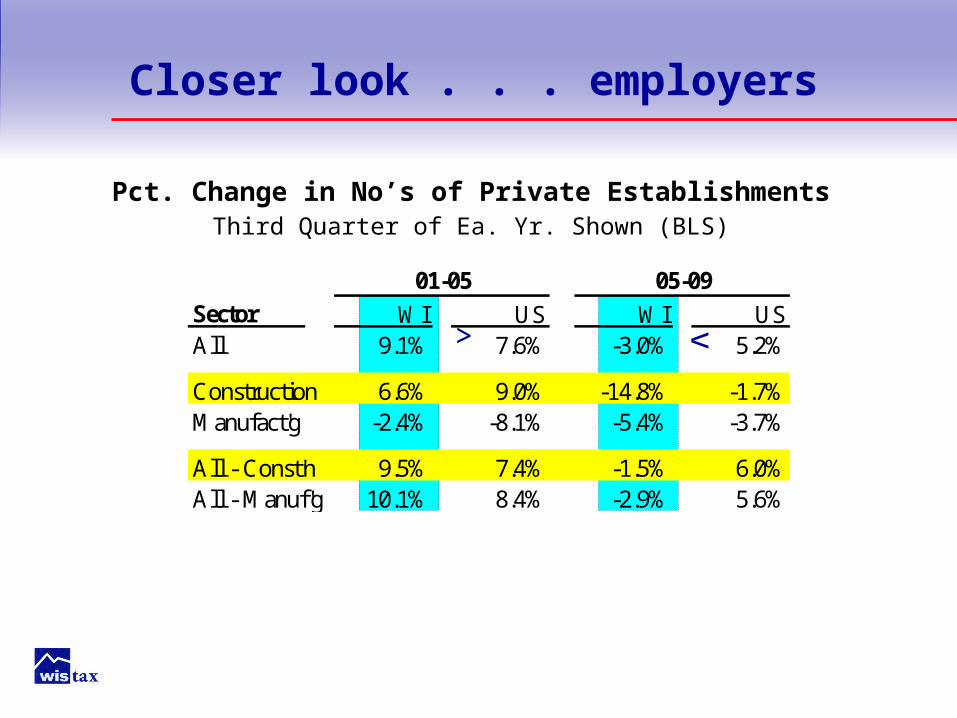
Sector WI US WI USAll 9.1% 7.6% -3.0% 5.2%
Construction 6.6% 9.0% -14.8% -1.7%Manufact'g -2.4% -8.1% -5.4% -3.7%
All - Const'n 9.5% 7.4% -1.5% 6.0%All - Manuf'g 10.1% 8.4% -2.9% 5.6%
05-0901-05
Pct. Change in No’s of Private EstablishmentsThird Quarter of Ea. Yr. Shown (BLS)
> v
Closer look . . . employers
1993-99 Rank 2005-09 Rank 2009:4 Rank
US 5.6 5.5 5.6WI 4.5 43 4.7 40 4.3 44
1993-99 Rank 2005-09 Rank 2009:4 Rank
US 1.8 1.2 1.2WI 1.4 43 1.0 44 1.0 38
New Firms as Pct. Of All Firms
Employees of New Firms as Pct. Of All Employees
Are we creating new firms?
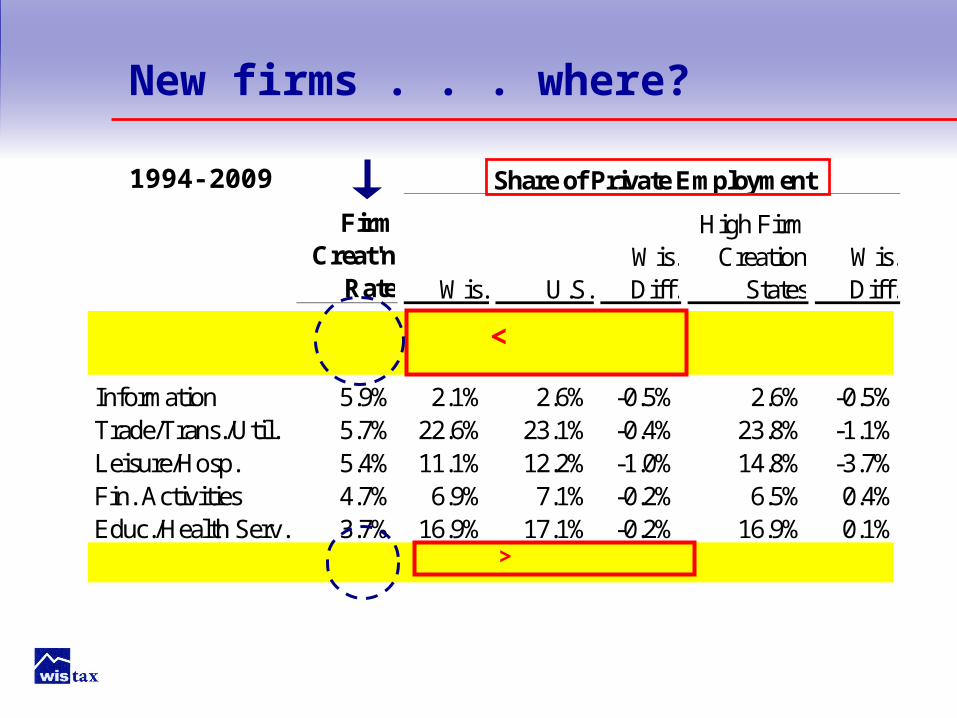
Firm Creat'n
Rate Wis. U.S.Wis. Diff.
High Firm Creation
StatesWis. Diff.
Construction 7.9% 4.5% 5.6% -1.1% 6.4% -1.9%Prof./Bus. Serv. 6.9% 11.4% 15.4% -4.0% 13.9% -2.5%Information 5.9% 2.1% 2.6% -0.5% 2.6% -0.5%Trade/Trans./Util. 5.7% 22.6% 23.1% -0.4% 23.8% -1.1%Leisure/Hosp. 5.4% 11.1% 12.2% -1.0% 14.8% -3.7%Fin. Activities 4.7% 6.9% 7.1% -0.2% 6.5% 0.4%Educ./Health Serv. 3.7% 16.9% 17.1% -0.2% 16.9% 0.1%Manufacturing 3.0% 19.3% 11.0% 8.2% 8.7% 10.6%
Share of Private Employment
New firms . . . where?
<
>
1994-2009
-80
-40
0
40
80
-60 -40 -20 0 20 40 60
^ wyak
ny
vaca
de
tx
ma
IA
WI
MI
MN
ILms
scky
"Stars"
"Dogs"
ar|id
WI98
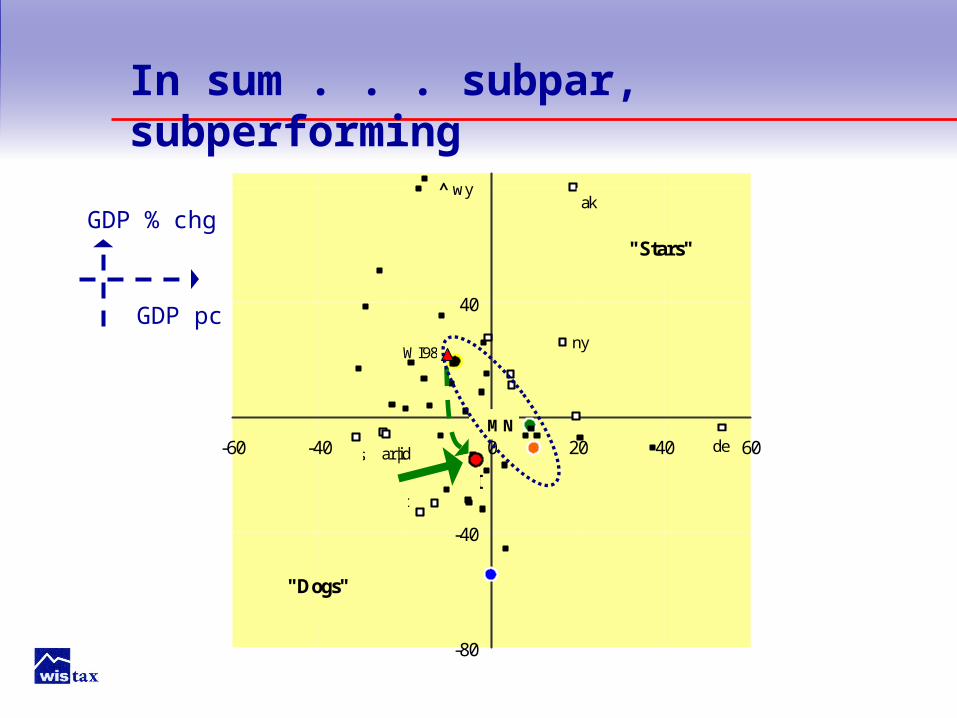
GDP % chg
GDP pc
In sum . . . subpar, subperforming
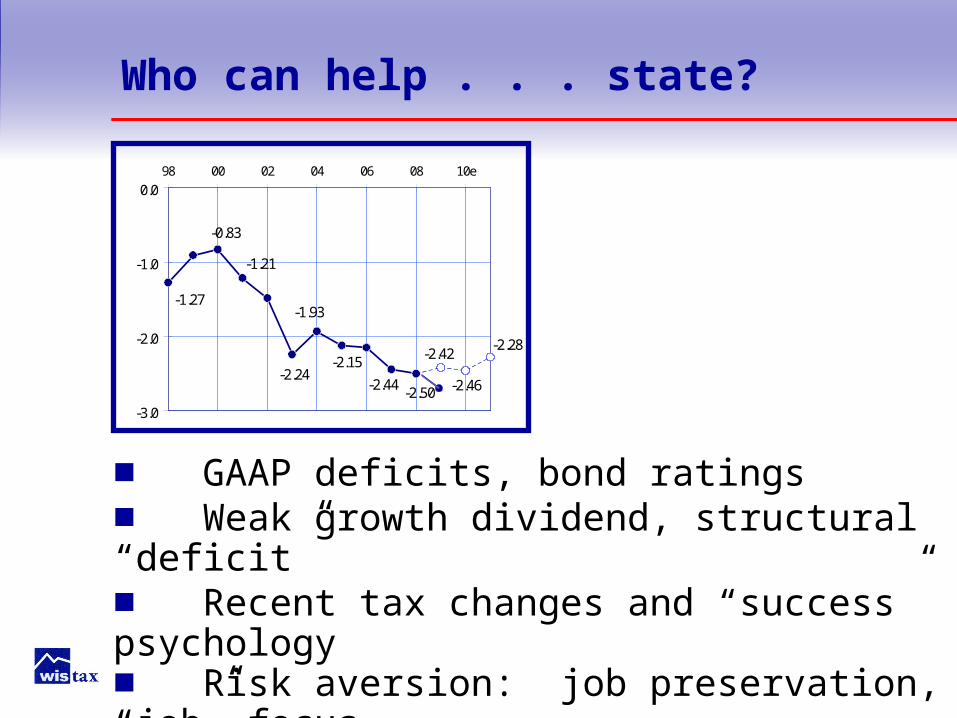
Who can help . . . state?
-2.46
-2.42-2.28
-1.27
-0.83
-1.21
-2.24
-1.93
-2.15
-2.44 -2.50-3.0
-2.0
-1.0
0.098 00 02 04 06 08 10e
■ GAAP deficits, bond ratings■ Weak growth dividend, structural “deficit”■ Recent tax changes and “success” psychology■ Risk aversion: job preservation, “job” focus
. . . universities?
■ Research, yes; but slow, probabilistic process■ More college grads, yes; but, nimbleness?
outmigration due to job lack, low wages■ . . . and job crowding and wage suppression?
■ “. . . US government debt held by the public has grown rapidly . . . it is now higher than it has ever been except during . . . World War II.”
■ “. . . deficits will cause debt to rise to unsupportable levels.”
Federal debt = 100% of GDP: 2020 - 2040
▪ Crowding out of private savings/investment ▪ Rising interest costs forcing program cuts▪ Higher marginal tax rates “would
discourage work and saving and further reduce output”
. . . Feds? (CBO, 7.27.10)

Takeaway?
New firms create new
jobs.Soul-searching questions for
Wisconsin.

The Wisconsin Taxpayers AllianceOur eighth decade of teaching and informing the press and public about how their government works, taxes, and spends.
Thank you for making our nonpartisan researchand citizen education possible.
www.wistax.org