wisconsin department of natural resources 2011 …dnr.wi.gov/files/pdf/pubs/le/le0006_2011.pdf1949...
TRANSCRIPT

Wisconsin Department of Natural Resources
2011 Hunting Incident Report2011 Hunting Incident Report

2
Table of Contents
Executive Summary
3
History of Hunting Incidents & Fatalities
4
Incident Rate per 100,000 Hunters
5
Month & Day of Incident
6
Time of Incidents
7
Where Incidents Occurred
8
Animals Hunted by Shooter
9
Firearms Involved in Incidents
10
Contributing Factors to Incident
11
Incident Conditions: Weather; Light Conditions; Topography; Ground Cover
12
Injury Information
13
Shooter/Victim Hunting Party, Victim Visibility
13
Shooter Statistics; Hunter Education; Experience; Age & Gender
14
Shooter Activity at Time of Incident
15
Distance from Muzzle to Wound
16
Victim Statistics: Hunter Education; Experience; Age; Gender
17
Victim Statistics: Surroundings
18
Victim Statistics: Color of Cap, Coat and Trousers
19
State Map with Hunting Incidents by County
20
State Map with Hunting Incidents by Deer Management Unit
21
History of Deer Gun Incidents & Fatalities
22
State Map with Gun Deer Season Incidents
23
Deer Gun Incidents: Day of Week; Victim Clothing Color
24
Deer Season Safety Violation: Archery & Firearms
25

3
2011 Hunting Incident Executive Report
Hunting Incident -- is when a person is injured by the discharge of a hunting firearm or bow and arrow arising from the activity of hunting, including travel to and from the hunting field.
There were 26 total hunting incidents during the 2011 hunting season. Two of the 26 incidents were fatal. Thanks to the efforts of our hunter education program hunting is
a safe activity in Wisconsin and getting safer all the time. Hunting incidents are continuing a downward trend and for 2011 we
were below the 10 year average of
about 32 incidents per year.
Gun deer hunting, turkey and waterfowl hunting were the three hunting activities with the highest number of incidents with gun deer hunting having the most. Hunting on
game farms continue to be a location where several pheasant hunting incidents occur annually. Other game hunting remained basically the same compared to 2010.
Rifles and shotguns remain the hunting implement involved most often in hunting incidents. Shotguns (62%) and rifles (38%). No handgun or muzzleloader incidents
occurred in 2011.
There were three major causes for incidents for 2011: Shooters failure to positively identify the target, victim out of sight of the shooter and victim covered by shooter
swinging on game. It’s not a good enough reason to take a shot when a hunter only thinks they are seeing a legal target; they must know and be certain the target is
legal. Having a safe zone of fire and safe backstop is equally important to knowing your target.Planning your hunt and hunting your plan is important. Know where your hunting partners are at all times.
Self inflicted injuries accounted for 38% of the total number of incidents. This is a increase of 10% from 2010.
Juveniles (under age 18) make up 23% of the incidents in 2011 .
That means that 77% of all hunting incidents were caused by adult hunters. Historically juveniles have
contributed to nearly 33% of the total numbers of incidents. It
is important to note that the numbers of incidents caused by juvenile shooters was a single digit (6)
incidents out of 26 incidents for 2011.
To summarize this report, 2011 was the third time in history that we had a gun deer season without a fatality. 1972 was the first year without a fatal incident for
gun deer hunting. We were well below the 10 year average for hunting incidents and expect to continue that trend into the future. Incidents that were
caused while hunters were either moving or shooting at moving game increase the propensity for something to go wrong.
We cannot rest on past success and
must stress the importance of knowing and practicing the 4 basic
rules of firearms safety every time we handle a firearm. Remember the slogan “Safe Hunting is No
Accident.”
2012 can be the safest season ever. . . .IF all hunters follow those 4 simple rules.
Jon King
This annual report prepared by: Brenda Von RuedenHunter Education Administrator
Hunter Education Administrative AssistantBureau of Law Enforcement
Telephone (608) 267‐7509PO Box 7921, Madison, WI 53707

4
History of Hunting Incidents & Fatalities
0
20
40
60
80
100
120
1985
1986
1987
1988
1989
1990
1991
1992
1993
1994
1995
1996
1997
1998
1999
2000
2001
2002
2003
2004
2005
2006
2007
2008
2009
2010
2011
Fatal Total Accidents

5
Wisconsin Hunting Incident Rate Per 100,000 Hunters
05
101520253035404550
1949
1951
1953
1955
1957
1958
1961
1963
1965
1967
1969
1971
1973
1975
1977
1979
1981
1983
1985
1987
1989
1991
1993
1995
1997
1999
2001
2003
2005
2007
2009
2011
License Year
Total Number
of Incidents
Incidents per 100,000
2011 26 3.61111
2010 32 4.435825
2009 18 2.506053
2008 30 4.186997
2007 27 3.742728
2006 31 4.294515
2005 38 5.325037
2004 35 4.84226
2003 35 4.886903
2002 47 6.8205
2001 51 6.68359
1967 Hunter Education Begins
1980 Mandatory Blaze Orange for Gun Deer Season
1985 Mandatory Hunter Education Begins
6
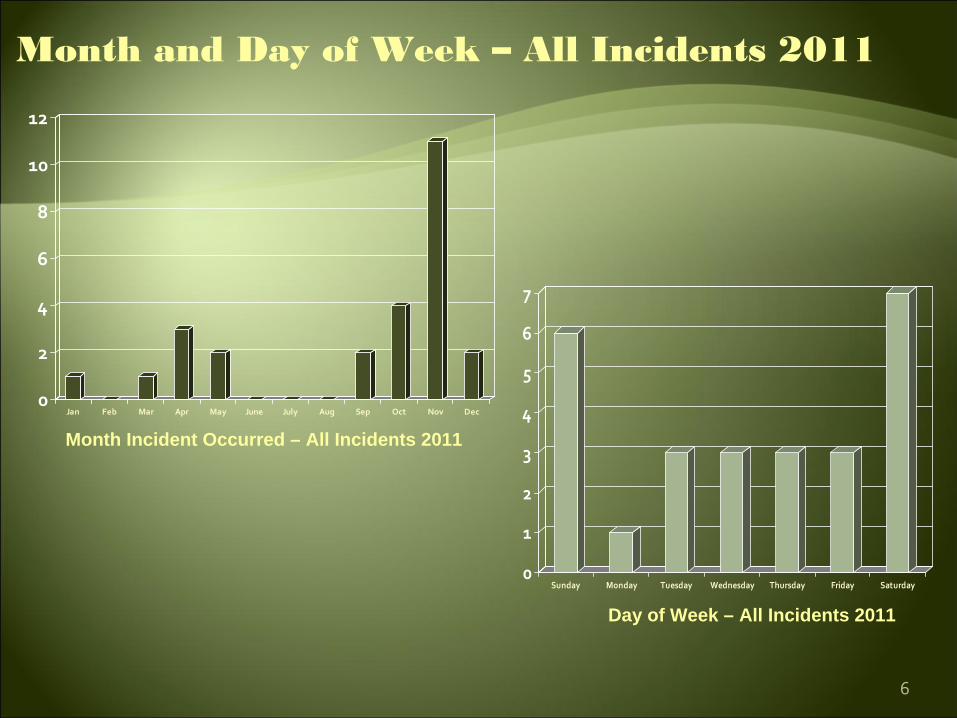
Month and Day of Week –
All Incidents 2011
0
1
2
3
4
5
6
7
Sunday Monday Tuesday Wednesday Thursday Friday Saturday
0
2
4
6
8
10
12
Jan Feb Mar Apr May June July Aug Sep Oct Nov Dec
Day of Week – All Incidents 2011
Month Incident Occurred – All Incidents 2011

7
Time of Day –
All Incidents 2011
0 1 2 3 4 5 6 7 8 9
4:01 - 6:00
2:01 - 4:00
12:01 - 2:00
10:01 - 12:00 PM
8:01 - 10:00
6:01 - 8:00 AM

8
Where Incident Occurred –
All Incidents 2011
Other12%
River, Stream or Lake6%
Public Hunting Grounds
27%
Wooded Area40%
Field/Cropland15%
Other Includes:Private Pond
1Private Property 1 Wooded Swamp 2
Type of Land

9
Animals Hunted by Shooter –
All Incidents 2011
9
4
3 3
4
2
1
0
1
2
3
4
5
6
7
8
9
10
Dee
r
Wat
erfo
wl
Phea
sant
Squi
rrel
Turk
ey
Coy
ote
Oth
er -
Bla
ckbi
rd

10
Firearms Involved in Incidents –
All Incidents 2011
Rifle38%
Shotgun62%
Type
Slide/Pump38%
Semi Auto31%
Break /Hinge4%
Bolt12%
Lever15%
Action

11
Contributing Factors to Incidents –
All Incidents 2011
0 1 2 3 4
Victim Out of Sight of Shooter
Victim Covered by Shooter Sw inging on Game
Victim Moved in Line of Fire
Shooter Failed to Identify Target
Ricochet
Firearm Fell, Insecure Rest
Shooter Stumbled and Fell
Trigger Caught on Object
Loading Firearm
Improper Crossing of Obstacle
Horseplay w / Firearm
Carless Gun Handling/Finger on Trigger
Walking Carrying Firearm w ith Safety Off

12
Incident Conditions –
All Incidents 2011
Cloudy31%
Clear54%
Partly Cloudy15%
Daylight92%
Dawn8%
None92%
Raining4%
Snow4%
Weather
Light Conditions
Precipitation
Level54%
Rolling19%
Swamp/Marsh23%
Steep Hill4%
Grass57%Leaves
23%
Snow Cover8%
Other12%
Ground CoverTopography

13
Incident Statistics –
All Incidents 2011
No62%
Yes38%
No35%
Yes38%
Self Inflicted
27%
12
4
10
0
2
4
6
8
10
12
Yes No Self Inflicted
Self Inflicted
Could Shooter See Victim?(includes self-inflicted injuries)
Members of the Same Hunting Party
(includes self-inflicted injuries)
Shooter/Victim Information Two-Party Incidents 2011

14
Incident “Shooter”
Statistics –
All Incidents 2011
17
9
0
2
4
6
8
10
12
14
16
18
Yes No
6 6
5
1
8
0
1
2
3
4
5
6
7
8
0‐5 Years 6‐10 Years 11‐15 Years 16‐19 Years 20+ years
Under 128%
Age 50‐5924%
Over Age 6015%
Age 40‐494% Age 30‐39
4%
Age 24‐2915%
Age 18‐2315%
Age 12‐1715%
Female6%
Male85%
Unknown9%
Hunter Education Graduate?
Age Gender
Years Hunting Experience

15
Activity “Shooter”
Was Involved In –
All Incidents 2011
23
10
65
012345678910
Driver Stander Still Hunting Stalking In Blind

16
12
2
6
4
2
0
2
4
6
8
10
12
0‐10 Yd 11‐20 Yds 21‐50 Yds 51‐100 Yds Over 100 Yds
Distance From Muzzle to Wound –
All Incidents 2011 (Includes Self Inflicted)

17
Incident “Victim”
Statistics –
All Incidents 2011
18
8
0
2
4
6
8
10
12
14
16
18
Yes No
6
4 4
2
10
012345678910
0‐5 Years 6‐10 Years 11‐15 Years 16‐20 Years 20+ years
Age 60 & Over23%
Age 30-399%
Age 40-499%
Age 50-5914%
Age 0-55%
Age 6-110%
Age 12-1726%
Age 18-2314%
Hunter Education Graduate?
Age Gender
Years Hunting Experience
Male88%
Female12%

18
Incident “Victim”
Surroundings Two-Party Incidents 2011
(Does not include Self Inflicted Incidents)
3
7
5
1
0
1
2
3
4
5
6
7
8
Dense Cover Light Cover Open Area Boat

19
Incident “Victim”
Clothing Color Two-Party Incidents Only 2011
(Does not include Self Inflicted Incidents)
Camouflage50%
Other13%
Blaze Orange31%
Blaze Orange/Camo
6%
01
23
45
67
8
BlazeOrange
Camouflage Brown Other
Cap
Coat or Vest Blue/Green8%
Blaze Orange44%
Other4%
Brown4% Unknown
4%Camouflage
36%
Trouser or Pants

20
2011 Hunting Incidents by County –
All Incidents

21
History of Gun Deer Incidents
0
10
20
30
40
50
60
70
1984
1986
1988
1990
1992
1994
1996
1998
2000
2002
2004
2006
2008
2010
Fatal Non-Fatal
Nonfatal100%
Fatal0%
2011 Gun Deer Incidents

22
Gun Deer Season Incidents 2011
1
2 1
1
1-Kenosha
1
1
1
Non Fatal = 8Non Fatal = 8
Fatal = 0Fatal = 0
Total = 8Total = 8
1.29 per 100,000 1.29 per 100,000 participants participants

23
Incidents by Day of Week Gun Deer Season -
2011
Saturday22%
Friday11%
Thursday11%
Wednesday11%
Tuesday0%
Monday11%
Sunday34%
Other - Black20%
Blaze Orange
80%
Other-Brown20%
Blaze Orange
80%
Incident Victim Clothing Color Gun Deer Season –
2011 Two Party Incidents Only(Does not include Self Inflicted Incidents)
Cap
Camo20%
Blaze Orange
40%
Blue/Green40%
Coat or Vest
Trousers or Pant

24
2011 Deer Season Safety Violations -
Firearms
0 10 20 30 40 50 60
Hunt within 50 Feet of Rd. - H07
Hunt Without Blaze Orange - H08
Hunt Before/After Hours - H23
Transport Loaded firearm in Vehicle - H43
Transport Uncased Firearm in Vehicle - H44
Hunt Deer with Illegal Firearm - H54
Shoot From/Across Rd. - H82

25
Remember Safe Hunting is no Accident!
TT
AA
BB
KKTreat Treat Every Every
Firearm Firearm As If It As If It
Is Is LoadedLoaded
Always Point the Muzzle In A Safe Direction
Be Certain Of Your Target & What’s Beyond
Keep Your Finger Outside The Trigger Guard Until
Ready To Shoot